prepared for the institute for catastrophic loss reduction
TRANSCRIPT

Fire following earthquake in the Vancouver region
Prepared for the Institute for Catastrophic Loss Reduction
By Charles Scawthorn, S.E.
November 2020
Institute for Catastrophic Loss Reduction
Building resilient communities
Institut de prévention des sinistres catastrophiques
Bâtir des communautés résilientes


Published by
Institute for Catastrophic Loss Reduction
20 Richmond Street East, Suite 210
Toronto, Ontario, Canada M5C 2R9
This material may be copied for purposes related to the document as long as the authors and
copyright holders are recognized.
The opinions expressed in this paper are those of the author and not necessarily those of the
Institute for Catastrophic Loss Reduction.
Cover photos: Front cover: (left) Vancouver Fire Rescue Services; (right) Lee Robinson, own work, unsplash.com
Back cover: Vancouver Fire Rescue Services.
Citation: Scawthorn, C. (2020) Fire following earthquake in the Vancouver region.
Prepared for the Institute for Catastrophic Loss Reduction, Toronto, 74 pp.
ISBN: 978-1-927929-29-2
Copyright © 2020 Institute for Catastrophic Loss Reduction
Fire following earthquake in the Vancouver region
Prepared for the Institute for Catastrophic Loss Reduction
By Charles Scawthorn, S.E.
SPA Risk LLC
November 2020
ICLR research paper series – number 67

Established in 1997 by Canada’s property and casualty insurers, the Institute for Catastrophic Loss Reduction is an independent, not-for-profit research institute
based in Toronto and at Western University in London, Canada. The Institute is a
founding member of the Global Alliance of Disaster Research Institutes. The Institute’s
research staff are internationally recognized for pioneering work in a number of
fields including wind and seismic engineering, atmospheric sciences, water resources
engineering and economics. Multi-disciplined research is a foundation for the
Institute’s work to build communities more resilient to disasters.
ICLR has been designated as an IRDR International
Centre of Excellence. IRDR International Centres of
Excellence (ICoEs), established through the IRDR
Scientific Committee (SC) and the relevant National
Committee (NC), provide regional and research foci for the IRDR program. ICoE
research programs embody an integrated approach to disaster risk reduction that
directly contribute to the ICSU/IRDR Science Plan for Integrated Research on Disaster
Risk and its objectives, as well as the IRDR Strategic Plan (2013-2017).
SPA Risk LLC is an engineering risk consultancy with offices in San Francisco, Denver,
Denmark and Japan. SPA serves government, utilities, manufacturing, finance,
insurance, and real-estate entities concerned with risk from natural and man-made
disasters. Services include Strategic development for insurance and enterprise risk
management; Hazard and Vulnerability models for use in loss estimation software;
Open risk models: open-source software, open methods, and open data; Worldwide
multi-hazard risk assessment; Multihazard risk management for individual facilities,
portfolios, and networks; Decision support using cost-benefit ratio, IRR, certainty
equivalent, with single- or multi-attribute objectives. SPA designs risk-management
alternatives and performs economic and life-safety analyses on the basis of cost-
benefit ratio, internal rate of return, certainty equivalent, cost per statistical life
saved, and other formal decision bases, provides decision-making information that is
understandable, defensible, and actionable. We provide expert independent review of
risk assessments.

i
Acknowledgements
The analysis this report presents builds on a large body of data and work by others. Perhaps the first
to be acknowledged are the people and governments of Vancouver and British Columbia for their
graciousness during a field visit for this study, and for their open data policies that provided access to
much more data than would be available in some other jurisdictions. The availability of high-quality
data enhances the modelling framework and accuracy, which benefits everyone.
Natural Resources Canada (NRCan) has developed a large body of scientific data that proved most
helpful to the analysis. Dr. Murray Journeay of NRCan in particular generously assisted with various
databases. The work of him and his colleagues at NRCan and in the Canadian scientific community in
general is greatly appreciated.
Mr. Micah Hilt, City of Vancouver Lead Seismic Policy Planner, was most helpful throughout the course
of the study; his assistance and comments really helped and are gratefully appreciated.
The City of Vancouver assisted the study in many ways – Vancouver Fire Department, particularly
Deputy Chief Rob Renning and Assistant Chiefs Rick Cheung and Ray Bryant, were most helpful and
are sincerely thanked. Similarly, Chief Joe Robertson of Burnaby FD was very informative and helpful.
Metro Vancouver was most helpful, and sincere thanks goes to Mike Searle, Greg Smith and their
colleagues. The City of Surrey’s water department also was most hospitable, and Mr. K.K. Li and
Mr. A. Wong’s assistance is gratefully acknowledged.
Dr. Zachary Bullock (Caltech, formerly Univ. of Colorado, Boulder) provided estimates of the ground
motions for the scenario events, and his assistance is gratefully acknowledged.
The Institute for Catastrophic Loss Reduction (ICLR) is gratefully acknowledged for conceiving and
managing this study, especially Paul Kovacs, Glenn McGillivray, Tracy Waddington and Sophie Guilbault.
The support of the 120 insurance companies and other members of ICLR is appreciated.

ii
Abstract
The Lower Mainland of British Columbia has significant earthquake hazard and potential for ground
motions that will cause significant damage to ordinary buildings and infrastructure. Earthquakes are
sometimes followed by major fires, whose damage can greatly exceed the shaking damage.
To assess the risk of fire following earthquake and identify opportunities to reduce the risk, five
scenario events are examined for the number of fires and amount of firespread they would cause:
two distant events: a Mw 9.0 Cascadia Subduction Zone event and a relatively distant Mw 7.3
event on Vancouver Island; and three relatively nearby events: a deep in-slab Mw 6.8 event on the
subducting Juan de Fuca Plate, a Mw 7.3 event in the Georgia Strait just to the west of the city of
Vancouver, and a Mw 6.5 shallow crustal event centred on the city of New Westminster.
Accounting for fire department response, water system damage, weather and other conditions, the
growth and ultimate final burnt area of fires are estimated to result in losses from nil to $10 billion.*
These are median estimates – there are significant probabilities of greater or less damage, and the
range is a function of the specific earthquake scenario (i.e., location and magnitude), time of day,
weather and other factors.
This loss would be almost entirely insured and would have a very significant impact on the Canadian
insurance industry. Fire losses would come on top of shaking and other losses, which would be
insured to a lesser extent. A leading global reinsurer has stated that losses of this magnitude would
likely result in failure of some insurers, would entail secondary and contingent losses, and could
conceivably lead to financial contagion.
This risk need not be tolerated and indeed the Province of British Columbia, City of Vancouver, and
regional agencies such as Metro Vancouver and BC Hydro have implemented excellent programs to
reduce this risk. Further actions, however, can still be taken to reduce the risk of fire damage and
include creation of a regional portable water supply system and providing secondary water supplies
for high-rise buildings.
Lastly, two things should be noted about this study: (1) it has focused solely on fire following
earthquake – there are many other ways in which a major earthquake will cause damage, which
haven’t been treated here; (2) this report has not assessed the seismic vulnerability of the gas
distribution or other energy industry assets, many of which are concentrated in the highly liquefiable
Fraser River Delta. In this respect, two actions have been de rigueur in other regions and should be
considered in the Lower Mainland: (a) a review of the overall seismic vulnerability and reliability of
major energy facilities; (b) a review of the gas distribution operator’s ability to control and isolate its
transmission and distribution networks in the event of a major earthquake, and consideration by the
gas distribution operator of incorporating an automatic gas shutoff device in gas meters.
* All dollar amounts are in Canadian dollars, unless otherwise indicated.
iii
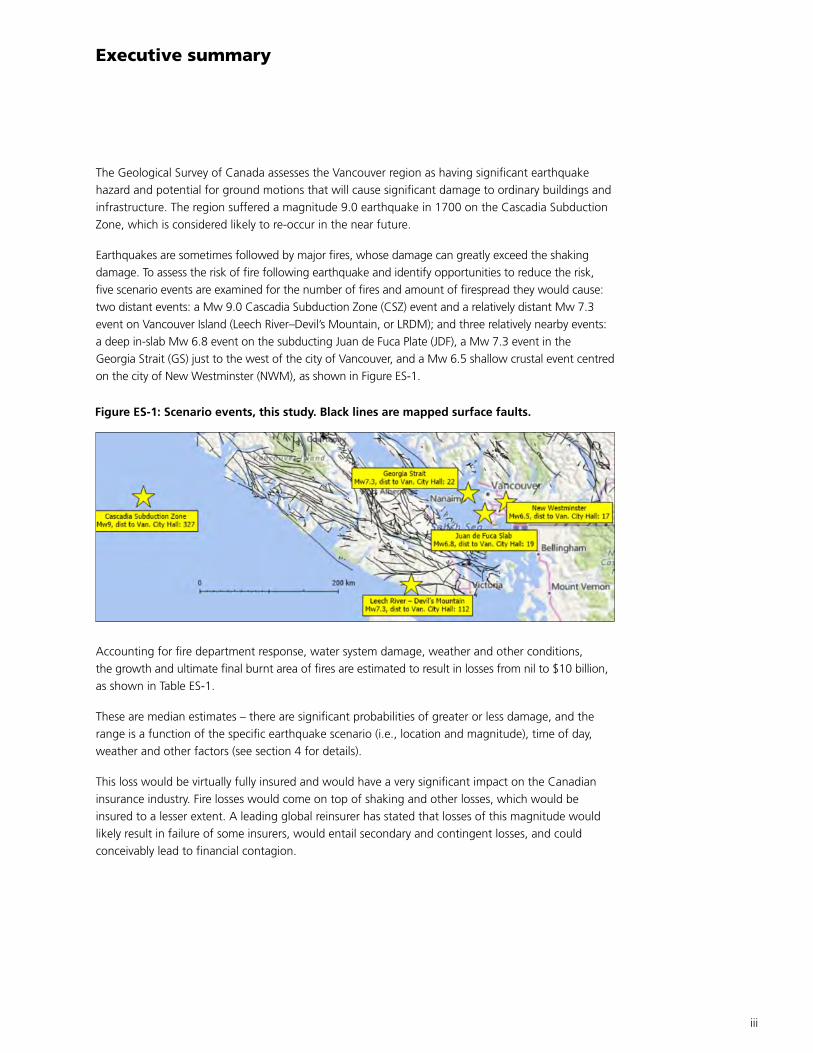
Executive summary
The Geological Survey of Canada assesses the Vancouver region as having significant earthquake
hazard and potential for ground motions that will cause significant damage to ordinary buildings and
infrastructure. The region suffered a magnitude 9.0 earthquake in 1700 on the Cascadia Subduction
Zone, which is considered likely to re-occur in the near future.
Earthquakes are sometimes followed by major fires, whose damage can greatly exceed the shaking
damage. To assess the risk of fire following earthquake and identify opportunities to reduce the risk,
five scenario events are examined for the number of fires and amount of firespread they would cause:
two distant events: a Mw 9.0 Cascadia Subduction Zone (CSZ) event and a relatively distant Mw 7.3
event on Vancouver Island (Leech River–Devil’s Mountain, or LRDM); and three relatively nearby events:
a deep in-slab Mw 6.8 event on the subducting Juan de Fuca Plate (JDF), a Mw 7.3 event in the
Georgia Strait (GS) just to the west of the city of Vancouver, and a Mw 6.5 shallow crustal event centred
on the city of New Westminster (NWM), as shown in Figure ES-1.
Accounting for fire department response, water system damage, weather and other conditions,
the growth and ultimate final burnt area of fires are estimated to result in losses from nil to $10 billion,
as shown in Table ES-1.
These are median estimates – there are significant probabilities of greater or less damage, and the
range is a function of the specific earthquake scenario (i.e., location and magnitude), time of day,
weather and other factors (see section 4 for details).
This loss would be virtually fully insured and would have a very significant impact on the Canadian
insurance industry. Fire losses would come on top of shaking and other losses, which would be
insured to a lesser extent. A leading global reinsurer has stated that losses of this magnitude would
likely result in failure of some insurers, would entail secondary and contingent losses, and could
conceivably lead to financial contagion.
Figure ES-1: Scenario events, this study. Black lines are mapped surface faults.

iv
This risk need not be tolerated and indeed the Province of British Columbia, City of Vancouver, and
regional agencies such as Metro Vancouver and BC Hydro in recent decades have implemented
excellent programs to reduce this risk. Further actions, however, can still be taken to reduce the
risk of fire damage. For example, the fire service in the Lower Mainland is modern, advanced,
well-equipped and of a high caliber in its organization, methods and tactics. The earthquake risk is
understood and appears to be a focus for fire departments and, as a result, Vancouver has built a
specialized high-pressure dedicated fire protection system and a defence in depth, with fireboats,
hose tenders and hose reels, as well as training citizen volunteer Neighbourhood Emergency
Assistance Teams (N.E.A.T.s). Other departments need to follow this model, tailored to their needs.
We recommend development of an integrated regional Portable Water Supply System (PWSS) of hose
tenders / hose reels, with compatible fittings, that can be used to access alternative water supply
sources and relay water to the fireground. Such a regional system would also benefit from a number
of HydroSubs®* among the various larger departments and would have wider applicability than just
earthquake – it can be used for wildfires, dewatering flooded areas and other emergency needs.
A significant number of, but not all, high-rise buildings in Vancouver are sprinklered, to the
region’s credit, as is the City’s requirement that all new construction – low- as well as high-rise – be
sprinklered. However, sprinklers rely on underground water mains for supply, which are likely to
fail in a major earthquake. This was recognized decades ago in the California Building Code, which
requires a secondary on-site water supply in high seismicity zones for firefighting purposes – typically
about 60,000 litres. Vancouver and the Provincial Building By-laws lack a similar provision, which we
recommend should be seriously considered. Retrofitting existing high-rise buildings with 60,000-litre
water tanks may seem a large and expensive task, but actually it isn’t. Such a tank would take up the
equivalent of perhaps two parking spaces in a basement parking garage, for example, and the cost
would be significantly less than 1% of the value of the building – perhaps on the order of the cost to
renovate the building lobby.
Lastly, two things should be noted about this study: (1) it has focused solely on fire following
earthquake – there are many other ways in which a major earthquake will cause damage, which
haven’t been treated here; (2) this report has not assessed the seismic vulnerability of the gas
distribution or other energy industry assets, many of which are concentrated in the highly liquefiable
Fraser River Delta. There is a long history of major energy facilities being damaged in earthquakes,
Table ES-1: Median number of fires, large fires and losses (in billions $).
ScenarioEQ1 Mw
9.0 CSZ
EQ2 Mw
6.8 JDF
EQ3 Mw
7.3 LRDM
EQ4 Mw
7.3 GS
EQ5 Mw
6.5 NWM
Median ignitions 16 106 4 216 93
Median no. large fires 0.6 31 0.02 47 29
Median losses in billions $ $0.16 $7.4 $0.01 $10.7 $7.2
* We use the eponym HydroSub® to refer to hydraulic driven portable submersible floating pump(s) linked to a prime mover
(e.g., diesel powered hydraulic powerpack) that permit quick access to and pumping from water sources such as rivers
and lakes. It should be noted that while HydroSub® is a commercial trade name of Hytrans Systems, similar systems are
manufactured by other companies (e.g., US Pump), and that the term HydroSub® is used here as an eponym. ICLR does not
endorse commercial products.

v
including by fire, so this aspect should not be ignored. Additionally, particularly in winter, millions of
people are dependent on energy services. While we didn’t address energy industry aspects, in this
respect two actions have been de rigueur in other regions and should be considered in the Lower
Mainland: (a) a review of the overall seismic vulnerability and reliability of major energy facilities;
(b) a review of the gas distribution operator’s ability to control and isolate its transmission and
distribution networks in the event of a major earthquake, and consideration by the gas distribution
operator of incorporating an automatic gas shutoff device in gas meters. Following the 1995 Kobe
earthquake, Japan replaced every gas meter in the country with meters incorporating an automatic
gas shutoff device, so the technology is well-established and the cost quite nominal if meters are
being replaced for other reasons. The opportunity afforded by the operator’s plan to replace these
meters for more efficient operation permits inclusion of the seismic shutoff device at a very modest
marginal cost.
This study was aided by many persons in the region – we met with a number of fire, water, city and
emergency planning and other officials, whose assistance was generously provided and is gratefully
appreciated. Natural Resources Canada (NRCan) generously provided assistance and data, which
contributed to this study and which is also gratefully acknowledged.

vi
Table of contents
Acknowledgements . . . . . . . . . . . . . . . . . . . . . . . . . . . . . . . . . . . . . . . . . . . . . . . . . . . . . . . . . . i
Abstract . . . . . . . . . . . . . . . . . . . . . . . . . . . . . . . . . . . . . . . . . . . . . . . . . . . . . . . . . . . . . . . . . . . ii
Executive summary . . . . . . . . . . . . . . . . . . . . . . . . . . . . . . . . . . . . . . . . . . . . . . . . . . . . . . . . . . iii
List of figures . . . . . . . . . . . . . . . . . . . . . . . . . . . . . . . . . . . . . . . . . . . . . . . . . . . . . . . . . . . . . . . viii
List of tables . . . . . . . . . . . . . . . . . . . . . . . . . . . . . . . . . . . . . . . . . . . . . . . . . . . . . . . . . . . . . . . . x
Short forms. . . . . . . . . . . . . . . . . . . . . . . . . . . . . . . . . . . . . . . . . . . . . . . . . . . . . . . . . . . . . . . . . xi
1 Introduction . . . . . . . . . . . . . . . . . . . . . . . . . . . . . . . . . . . . . . . . . . . . . . . . . . . . . . . . . . . . . 1
1.1 Purpose. . . . . . . . . . . . . . . . . . . . . . . . . . . . . . . . . . . . . . . . . . . . . . . . . . . . . . . . . . . . . . 1
1.2 Background . . . . . . . . . . . . . . . . . . . . . . . . . . . . . . . . . . . . . . . . . . . . . . . . . . . . . . . . . . . 1
1.3 Previous studies. . . . . . . . . . . . . . . . . . . . . . . . . . . . . . . . . . . . . . . . . . . . . . . . . . . . . . . . 3
1.4 Outline of this report. . . . . . . . . . . . . . . . . . . . . . . . . . . . . . . . . . . . . . . . . . . . . . . . . . . . 6
2 Study region. . . . . . . . . . . . . . . . . . . . . . . . . . . . . . . . . . . . . . . . . . . . . . . . . . . . . . . . . . . . . 7
2.1 The study region . . . . . . . . . . . . . . . . . . . . . . . . . . . . . . . . . . . . . . . . . . . . . . . . . . . . . . . 7
2.2 Earth science aspects. . . . . . . . . . . . . . . . . . . . . . . . . . . . . . . . . . . . . . . . . . . . . . . . . . . . 10
2.2.1 Geology. . . . . . . . . . . . . . . . . . . . . . . . . . . . . . . . . . . . . . . . . . . . . . . . . . . . . . . . . 10
2.2.2 Historic seismicity and seismic hazard . . . . . . . . . . . . . . . . . . . . . . . . . . . . . . . . . . . 11
2.2.3 Scenario events . . . . . . . . . . . . . . . . . . . . . . . . . . . . . . . . . . . . . . . . . . . . . . . . . . . 14
2.2.4 Local site conditions. . . . . . . . . . . . . . . . . . . . . . . . . . . . . . . . . . . . . . . . . . . . . . . . 16
2.2.5 Ground motion estimation . . . . . . . . . . . . . . . . . . . . . . . . . . . . . . . . . . . . . . . . . . . 16
2.2.6 Permanent ground displacement . . . . . . . . . . . . . . . . . . . . . . . . . . . . . . . . . . . . . . 21
2.3 Assets at risk . . . . . . . . . . . . . . . . . . . . . . . . . . . . . . . . . . . . . . . . . . . . . . . . . . . . . . . . . . 22
2.4 Fire aspects . . . . . . . . . . . . . . . . . . . . . . . . . . . . . . . . . . . . . . . . . . . . . . . . . . . . . . . . . . . 26
2.4.1 Fire service . . . . . . . . . . . . . . . . . . . . . . . . . . . . . . . . . . . . . . . . . . . . . . . . . . . . . . . 26
2.4.2 Gas and liquid fuel pipelines . . . . . . . . . . . . . . . . . . . . . . . . . . . . . . . . . . . . . . . . . 30
2.4.3 Water supply . . . . . . . . . . . . . . . . . . . . . . . . . . . . . . . . . . . . . . . . . . . . . . . . . . . . . 31
2.4.4 Weather . . . . . . . . . . . . . . . . . . . . . . . . . . . . . . . . . . . . . . . . . . . . . . . . . . . . . . . . 32
3 Analysis . . . . . . . . . . . . . . . . . . . . . . . . . . . . . . . . . . . . . . . . . . . . . . . . . . . . . . . . . . . . . . . 34
3.1 Modelling of fire following earthquake . . . . . . . . . . . . . . . . . . . . . . . . . . . . . . . . . . . . . . 34
3.2 Ignitions . . . . . . . . . . . . . . . . . . . . . . . . . . . . . . . . . . . . . . . . . . . . . . . . . . . . . . . . . . . . . 35
3.3 Initial response . . . . . . . . . . . . . . . . . . . . . . . . . . . . . . . . . . . . . . . . . . . . . . . . . . . . . . . . 37
3.3.1 Citizen response . . . . . . . . . . . . . . . . . . . . . . . . . . . . . . . . . . . . . . . . . . . . . . . . . . 37
3.3.2 Reporting . . . . . . . . . . . . . . . . . . . . . . . . . . . . . . . . . . . . . . . . . . . . . . . . . . . . . . . 37
3.3.3 Fire service initial response . . . . . . . . . . . . . . . . . . . . . . . . . . . . . . . . . . . . . . . . . . . 37
3.4 Fire spread . . . . . . . . . . . . . . . . . . . . . . . . . . . . . . . . . . . . . . . . . . . . . . . . . . . . . . . . . . . 38
3.5 Lifelines. . . . . . . . . . . . . . . . . . . . . . . . . . . . . . . . . . . . . . . . . . . . . . . . . . . . . . . . . . . . . . 39
3.5.1 Water supply . . . . . . . . . . . . . . . . . . . . . . . . . . . . . . . . . . . . . . . . . . . . . . . . . . . . . 39
3.5.2 Gas and liquid fuels . . . . . . . . . . . . . . . . . . . . . . . . . . . . . . . . . . . . . . . . . . . . . . . . 40
3.5.3 Communications . . . . . . . . . . . . . . . . . . . . . . . . . . . . . . . . . . . . . . . . . . . . . . . . . . 40
3.5.4 Transportation . . . . . . . . . . . . . . . . . . . . . . . . . . . . . . . . . . . . . . . . . . . . . . . . . . . . 40
3.6 Regional response . . . . . . . . . . . . . . . . . . . . . . . . . . . . . . . . . . . . . . . . . . . . . . . . . . . . . . 40

vii
4 Findings . . . . . . . . . . . . . . . . . . . . . . . . . . . . . . . . . . . . . . . . . . . . . . . . . . . . . . . . . . . . . . . 41
4.1 Final burnt area and loss . . . . . . . . . . . . . . . . . . . . . . . . . . . . . . . . . . . . . . . . . . . . . . . . . 41
4.1.1 EQ1 Mw 9.0 CSZ . . . . . . . . . . . . . . . . . . . . . . . . . . . . . . . . . . . . . . . . . . . . . . . . . . 41
4.1.2 EQ2 Mw 6.8 JDF . . . . . . . . . . . . . . . . . . . . . . . . . . . . . . . . . . . . . . . . . . . . . . . . . . 42
4.1.3 EQ3 Mw 7.3 LRDM . . . . . . . . . . . . . . . . . . . . . . . . . . . . . . . . . . . . . . . . . . . . . . . . 43
4.1.4 EQ4 Mw 7.3 GS . . . . . . . . . . . . . . . . . . . . . . . . . . . . . . . . . . . . . . . . . . . . . . . . . . . 44
4.1.5 EQ5 Mw 6.5 NWM . . . . . . . . . . . . . . . . . . . . . . . . . . . . . . . . . . . . . . . . . . . . . . . . 45
4.2 Summary of all scenario events . . . . . . . . . . . . . . . . . . . . . . . . . . . . . . . . . . . . . . . . . . . . 47
5 Mitigation of fire following earthquake . . . . . . . . . . . . . . . . . . . . . . . . . . . . . . . . . . . . . . 48
5.1 Fire service opportunities . . . . . . . . . . . . . . . . . . . . . . . . . . . . . . . . . . . . . . . . . . . . . . . . . 48
5.2 Building standards opportunities . . . . . . . . . . . . . . . . . . . . . . . . . . . . . . . . . . . . . . . . . . . 49
5.3 Energy industry . . . . . . . . . . . . . . . . . . . . . . . . . . . . . . . . . . . . . . . . . . . . . . . . . . . . . . . . 50
6 Concluding remarks . . . . . . . . . . . . . . . . . . . . . . . . . . . . . . . . . . . . . . . . . . . . . . . . . . . . . . . 53
References . . . . . . . . . . . . . . . . . . . . . . . . . . . . . . . . . . . . . . . . . . . . . . . . . . . . . . . . . . . . . . . . . 54
viii
List of figures
Figure 1: Seismic hazard for major Canadian cities . . . . . . . . . . . . . . . . . . . . . . . . . . . . . . . . . . 1
Figure 2: Sketch showing 1886 Great Vancouver fire extent (drawing made in 1932
based on interviews with survivors) . . . . . . . . . . . . . . . . . . . . . . . . . . . . . . . . . . . . . . 2
Figure 3: Scenario events studied in EQE (2001) . . . . . . . . . . . . . . . . . . . . . . . . . . . . . . . . . . . . 4
Figure 4: Study region road map . . . . . . . . . . . . . . . . . . . . . . . . . . . . . . . . . . . . . . . . . . . . . . . 7
Figure 5: Study region aerial photograph . . . . . . . . . . . . . . . . . . . . . . . . . . . . . . . . . . . . . . . . . 8
Figure 6: Study region municipalities . . . . . . . . . . . . . . . . . . . . . . . . . . . . . . . . . . . . . . . . . . . . 8
Figure 7: Population growth for Vancouver and region . . . . . . . . . . . . . . . . . . . . . . . . . . . . . . . 9
Figure 8: Study region population density per SAUID (Settled Area Unit ID). . . . . . . . . . . . . . . . 10
Figure 9: Surficial geology Vancouver area . . . . . . . . . . . . . . . . . . . . . . . . . . . . . . . . . . . . . . . . 11
Figure 10: Historical seismicity of Canada . . . . . . . . . . . . . . . . . . . . . . . . . . . . . . . . . . . . . . . . . . 11
Figure 11: Subduction of Juan de Fuca Plate beneath North American plate . . . . . . . . . . . . . . . . 12
Figure 12: Seismic hazard deaggregation for Vancouver . . . . . . . . . . . . . . . . . . . . . . . . . . . . . . . 14
Figure 13: Scenario events, this study. Black lines are mapped surface faults. . . . . . . . . . . . . . . . 14
Figure 14: Scenario events detail, this study. Black lines are mapped surface faults . . . . . . . . . . . 15
Figure 15: Regional Vs30 mapping . . . . . . . . . . . . . . . . . . . . . . . . . . . . . . . . . . . . . . . . . . . . . . . 16
Figure 16: Empirical semivariogram of the site conditions in the Metro Vancouver area . . . . . . . 17
Figure 17: Median peak ground acceleration (g), EQ1 Mw 9.0 Cascadia
Subduction Zone event . . . . . . . . . . . . . . . . . . . . . . . . . . . . . . . . . . . . . . . . . . . . . . . 18
Figure 18: Median peak ground acceleration (g), EQ2 Mw 6.8 Juan de Fuca Plate (JDF)
in-slab event . . . . . . . . . . . . . . . . . . . . . . . . . . . . . . . . . . . . . . . . . . . . . . . . . . . . . . . 18
Figure 19: Median peak ground acceleration (g), EQ3 Mw 7.3 Leech River–Devil’s
Mountain (LRDM) shallow crustal event . . . . . . . . . . . . . . . . . . . . . . . . . . . . . . . . . . . 19
Figure 20: Median peak ground acceleration (g), EQ4 Mw 7.3 Georgia Strait (GS)
shallow crustal event . . . . . . . . . . . . . . . . . . . . . . . . . . . . . . . . . . . . . . . . . . . . . . . . . 19
Figure 21: Median peak ground acceleration (g), EQ5 Mw 6.5 New Westminster (NWM)
shallow crustal event . . . . . . . . . . . . . . . . . . . . . . . . . . . . . . . . . . . . . . . . . . . . . . . . . 20
Figure 22: Median peak ground acceleration (g), EQ4 Mw 7.3 Georgia Strait (GS)
shallow crustal event . . . . . . . . . . . . . . . . . . . . . . . . . . . . . . . . . . . . . . . . . . . . . . . . . 20
Figure 23: Three of 100 realizations considering spatial correlation: mean peak
ground acceleration (g), EQ4 Mw 7.3 Georgia Strait (GS) shallow crustal event . . . . . 21
Figure 24: Areas of moderate, high and very high (3 to 5, resp.) liquefaction potential . . . . . . . . 22
Figure 25: Building total floor area (TFA) per analysis grid cell (sq. ft.) . . . . . . . . . . . . . . . . . . . . . 23
Figure 26: Detail of building density distribution, central Vancouver . . . . . . . . . . . . . . . . . . . . . . 24
Figure 27: Detail of building footprint data, downtown Vancouver . . . . . . . . . . . . . . . . . . . . . . . 24
Figure 28: Detail of building footprint data, central Vancouver . . . . . . . . . . . . . . . . . . . . . . . . . . 25
Figure 29: Examples of overhead electric distribution lines in densely built areas of
downtown and central Vancouver . . . . . . . . . . . . . . . . . . . . . . . . . . . . . . . . . . . . . . . 25
Figure 30: Fire stations and corresponding Voronoi areas . . . . . . . . . . . . . . . . . . . . . . . . . . . . . . 27
Figure 31: VFRS fireboat 1 . . . . . . . . . . . . . . . . . . . . . . . . . . . . . . . . . . . . . . . . . . . . . . . . . . . . . 28
Figure 32: VFRS HydroSub® . . . . . . . . . . . . . . . . . . . . . . . . . . . . . . . . . . . . . . . . . . . . . . . . . . . . 28
Figure 33: VFRS hose tender. . . . . . . . . . . . . . . . . . . . . . . . . . . . . . . . . . . . . . . . . . . . . . . . . . . . 28
Figure 34: VFRS hose reels . . . . . . . . . . . . . . . . . . . . . . . . . . . . . . . . . . . . . . . . . . . . . . . . . . . . . 29
Figure 35: Dedicated Fire Protection System (DFPS). Pump stations are at False Creek and
Coal Harbour. The grey area represents a 1,000-ft buffer around the system’s
water mains. . . . . . . . . . . . . . . . . . . . . . . . . . . . . . . . . . . . . . . . . . . . . . . . . . . . . . . . 29
ix
Figure 36: Major gas infrastructure in the study area includes the high pressure Fortis BC
transmission pipeline shown in red, and the 3 million ton per year capacity
WestPac LNG terminal on the Fraser River . . . . . . . . . . . . . . . . . . . . . . . . . . . . . . . . . 30
Figure 37: There are over 200,000 natural gas customers within the study area . . . . . . . . . . . . . 30
Figure 38: The study area is supplied by Metro Vancouver from primary sources on the
Capilano, Seymour and Coquitlam river watersheds north of Burrard Inlet via
large transmission lines. . . . . . . . . . . . . . . . . . . . . . . . . . . . . . . . . . . . . . . . . . . . . . . . 31
Figure 39: Water distribution network, differentiated by material . . . . . . . . . . . . . . . . . . . . . . . . 31
Figure 40: Study area Alternative Water Supply Factor, AWSF . . . . . . . . . . . . . . . . . . . . . . . . . . . 32
Figure 41: Vancouver weather pattern . . . . . . . . . . . . . . . . . . . . . . . . . . . . . . . . . . . . . . . . . . . . 33
Figure 42: Study area windspeed complementary cumulative distribution. . . . . . . . . . . . . . . . . . 33
Figure 43: Flow chart of fire-following-earthquake process. . . . . . . . . . . . . . . . . . . . . . . . . . . . . 34
Figure 44: Chart of fire department operations time line . . . . . . . . . . . . . . . . . . . . . . . . . . . . . . 35
Figure 45: Ignition models, taken from (Scawthorn 2018a): comparison of ignition regression
models (1) [Davidson 2009] and (3) [SPA 2009] using median values per
census tract . . . . . . . . . . . . . . . . . . . . . . . . . . . . . . . . . . . . . . . . . . . . . . . . . . . . . . . . 36
Figure 46: Probability of crossing firebreak . . . . . . . . . . . . . . . . . . . . . . . . . . . . . . . . . . . . . . . . . 38
Figure 47: Water Supply Factor (WSF) for one realization of EQ4, Mw 7.3 Georgia Strait . . . . . . 39
Figure 48: EQ1 distribution of mean ignitions per FRA, entire study area . . . . . . . . . . . . . . . . . . 41
Figure 49: EQ1 distribution of mean losses (in billions $) per FRA, entire study area . . . . . . . . . . 41
Figure 50: EQ1 histogram of (left) ignitions per FRA, and (right) losses (in billions $) per FRA,
given 1,000 realizations . . . . . . . . . . . . . . . . . . . . . . . . . . . . . . . . . . . . . . . . . . . . . . . 42
Figure 51: EQ2 distribution of mean ignitions per FRA, entire study area . . . . . . . . . . . . . . . . . . 42
Figure 52: EQ2 distribution of mean losses (in billions $) per FRA, entire study area . . . . . . . . . . 43
Figure 53: EQ2 histogram of (left) ignitions per FRA, and (right) losses (in billions $) per FRA,
given 1,000 realizations . . . . . . . . . . . . . . . . . . . . . . . . . . . . . . . . . . . . . . . . . . . . . . . 43
Figure 54: EQ4 distribution of mean ignitions per FRA, entire study area . . . . . . . . . . . . . . . . . . 44
Figure 55: EQ4 distribution of mean losses (in billions $) per FRA, entire study area . . . . . . . . . . 44
Figure 56: EQ4 histogram of (left) ignitions per FRA, and (right) losses (in billions $) per FRA,
given 1,000 realizations . . . . . . . . . . . . . . . . . . . . . . . . . . . . . . . . . . . . . . . . . . . . . . . 45
Figure 57: EQ5 distribution of mean ignitions per FRA, entire study area . . . . . . . . . . . . . . . . . . 45
Figure 58: EQ5 distribution of mean losses (in billions $) per FRA, entire study area . . . . . . . . . . 46
Figure 59: EQ5 histogram of (left) ignitions per FRA, and (right) losses (in billions $) per FRA,
given 1,000 realizations . . . . . . . . . . . . . . . . . . . . . . . . . . . . . . . . . . . . . . . . . . . . . . . 46
Figure 60: Lower Mainland fire following earthquake scenario losses, plotted in
ascending order. . . . . . . . . . . . . . . . . . . . . . . . . . . . . . . . . . . . . . . . . . . . . . . . . . . . . 47
Figure 61: Example of LDH system (Vallejo FD) . . . . . . . . . . . . . . . . . . . . . . . . . . . . . . . . . . . . . . 48
Figure 62: High-rise building and post-earthquake fire aspects . . . . . . . . . . . . . . . . . . . . . . . . . . 49
Figure 63: Selected Lower Mainland large energy facilities . . . . . . . . . . . . . . . . . . . . . . . . . . . . . 50
Figure 64: Seismic intensities measured in Tokyo Gas service area within five minutes
following 2011 Tohoku earthquake . . . . . . . . . . . . . . . . . . . . . . . . . . . . . . . . . . . . . . 51
Figure 65: Seismic gas shutoff device built into gas meter . . . . . . . . . . . . . . . . . . . . . . . . . . . . . 51
Figure 66: Lower Mainland gas utility meter upgrade announcement . . . . . . . . . . . . . . . . . . . . . 52

x
List of tables
Table 1: EQE (2001) Building square footage and values (Loss in 2001 millions $) . . . . . . . . . . 4
Table 2: EQE (2001) Scenario events, fires and losses (Loss in 2001 millions $,
% of total value at risk) . . . . . . . . . . . . . . . . . . . . . . . . . . . . . . . . . . . . . . . . . . . . . . . 5
Table 3: IBC/AIR (2013) Worldwide study – all property values in British Columbia
Buildings only (2013) millions $ . . . . . . . . . . . . . . . . . . . . . . . . . . . . . . . . . . . . . . . . . 5
Table 4: IBC/AIR (2013) Worldwide study – modelled losses Mw 9.0 Cascadia
Subduction Zone Buildings only (2013) millions $. . . . . . . . . . . . . . . . . . . . . . . . . . . . 6
Table 5: Study region municipalities and population . . . . . . . . . . . . . . . . . . . . . . . . . . . . . . . . 9
Table 6: Historical earthquakes in the study area . . . . . . . . . . . . . . . . . . . . . . . . . . . . . . . . . . . 13
Table 7: Characteristics of the five earthquake scenarios considered in this study . . . . . . . . . . 15
Table 8: Locations of the earthquake rupture models used in this study . . . . . . . . . . . . . . . . . 15
Table 9: Number of fire halls by jurisdiction . . . . . . . . . . . . . . . . . . . . . . . . . . . . . . . . . . . . . . . 26
Table 10: Median results by scenario. . . . . . . . . . . . . . . . . . . . . . . . . . . . . . . . . . . . . . . . . . . . . 47

xi
Short forms
AWS Alternative water supplies
AWSF Alternative Water Supply Factor
CatIQ Catastrophe Indices and Quantification Inc., a catastrophe data provider, see www.catiq.com
CSZ EQ1 Mw 9.0 Cascadia Subduction Zone event
DFPS Dedicated Fire Protection System
FRA Fire Response Area
GMPE Ground motion prediction equation
gpm Gallons per minute
GS EQ4 Mw 7.3 Georgia Strait shallow crustal even
Igpm Imperial gallons per minute
JDF EQ2 Mw 6.8 Juan de Fuca Plate in-slab event
LDH Large Diameter Hose (typically, 5” [125mm] or larger diameter)
LRDM EQ3 Mw 7.3 Leech River–Devil’s Mountain shallow crustal event
MMI Modified Mercalli Intensity
NRCan Natural Resources Canada
NWM EQ5 Mw 6.5 New Westminster shallow crustal event
PGA Peak ground acceleration
PGD Permanent ground displacement
PGV Peak ground velocity
PWSS Portable Water Supply System
TFA Total floor area
TIV Total Insured Value
VFRS Vancouver Fire Rescue Services
Vs30 Shear wave velocity of the upper 30 m of soil
WSF Water Supply Factor
WUI Wildland-urban interface


1
1. Introduction
1.1 Purpose
Fire following earthquake refers to a series of events or a stochastic process initiated by a large
earthquake. Fires occur following all earthquakes that significantly shake a human settlement but are
generally only a very significant problem in a large metropolitan area predominantly comprised of
densely spaced wood buildings. In such circumstances, the multiple simultaneous ignitions can
lead to catastrophic conflagrations that may be the dominant agent of damage for that event.
Such regions – high seismicity, densely spaced wood buildings – are the regions at highest risk of
post-earthquake fire, and include Japan, New Zealand, parts of Southeast Asia and North America
including the Lower Mainland of British Columbia.
1.2 Background
The Lower Mainland of British Columbia has a significant risk of earthquake shaking. Geologic and
seismologic studies have led the Geological Survey of Canada and the National Building Code of
Canada to rate the likelihood of peak ground acceleration at Vancouver as among the highest for a
major city in Canada (Adams et al. 2019), Figure 1.
Figure 1: Seismic hazard for major Canadian cities (Adams et al. 2019). Note that 2%/50-year peak ground acceleration (PGA) for Vancouver is 0.49g.
Sa(0.2) for Canada (mean values of 5% damped spectral acceleration
for Site Class C and a probability of 2%/50 years, units = g).
Uniform Hazard Spectra for mean 2%/50-year
ground motions on Site Class C for key cities.

2
Figure 2: Sketch showing 1886 Great Vancouver fire extent (drawing made in 1932 based on interviews with survivors) (Source: https://www.vancouverheritagefoundation.org/place-that-matters/crab-park-the-great-fire/75-54-the-great-vancouver-fire-major-matthews-sketch-1930/).
Large earthquakes are sometimes followed by large fires. Large fires, for example measured in terms
of square miles of burnt area, have not been unique to fires following earthquakes – indeed, the
great fires of London (1666) and Chicago (1871) are only the most noteworthy of a long succession
of non-earthquake related urban conflagrations. Among these was the Great Vancouver Fire of 1886,
which killed 21 and destroyed 600~1,000 buildings (Matthews 1960), Figure 2.
Large urban conflagrations were actually the norm in 19th Century North America, so that long
experience allowed the National Board of Fire Underwriters to state with some confidence when
considering another North American city (NBFU 1905):
“...In fact, San Francisco has violated all underwriting traditions and precedent by not burning up.
That it has not done so is largely due to tile vigilance of the fire department, which cannot be
relied upon indefinitely to stave off the inevitable.”
While the 1906 San Francisco earthquake had major geological effects and damaged many buildings,
it was the fire that resulted in 80% of the total damage – a fire foreseen and expected, irrespective of
an earthquake.

3
As the fire service was professionalized in the 20th Century, however, with improvements in
equipment, communications, training and organization, large urban conflagrations tended to
become largely a thing of the past (National Commission on Fire Prevention and Control 1973).
Largely, but not entirely, however, as witnessed in the 1991 East Bay Hills Fire where 3,500 buildings
were destroyed in a matter of hours, in Fort McMurray Canada in 2016 where more than 2,500
dwellings were destroyed, in 2017 in Northern California where 10,000 buildings were destroyed,
in 2018 in Northern California where 20,000 buildings were destroyed, or in 2019 and 2020 when
large wildland-urban interface (WUI) fires spread throughout western North America. While these
losses were WUI fires, they show that even a single ignition can lead to the overwhelming of regional
fire agencies. After an earthquake, there will be many ignitions, as well as many other demands on
fire agencies. It is worth noting that the two largest peace-time urban conflagrations in history have
been fires following earthquakes: 1906 San Francisco and 1923 Tokyo, the latter resulting in the
great majority of the 140,000 fatalities.
Although a combination of a professionalized fire service, improved water supply and better building
practices have been thought to have largely eliminated large urban conflagrations in the U.S., there is
still a gap – an Achilles Heel – which is fire following earthquake. This is due to the correlated effects
of a large earthquake, simultaneously causing numerous ignitions, degrading building fire resistive
features, dropping pressure in water supply mains, saturating communications and transportation
routes, and thus allowing some fires to quickly grow into conflagrations that outstrip local resources.
It is not sufficiently appreciated that the key to modern fire protection is a well-drilled rapid response
by professional firefighters during the early stages of structural fires, who arrive in time to suppress
the fire while it is still manageable. A typical response goal for urban fire departments, for example,
is about four minutes from time of report to arrival. If suppression is delayed, due either to delayed
response or lack of water, a single structural fire can quickly spread to neighbouring buildings and
grow to the point where an entire municipality’s fire resources are required, and perhaps even
assistance from neighbouring communities. This is for a single ignition. Simply put, most fire
departments are not sized or equipped to cope with the multiple simultaneous fires following a
major earthquake. A major earthquake and its associated fires is a low-probability event for which,
although having very high potential consequences, it may not be feasible to adequately prepare.
There are exceptions to this – San Francisco Fire Department, Los Angeles City Fire Department and
Vancouver Fire Rescue Services have all undertaken special measures.
1.3 Previous studies
Several previous studies of how the Lower Mainland would be affected by an earthquake are
relevant. An aspect of the fire-following-earthquake problem in the Lower Mainland has been the
concern for reliable firefighting water supply in the region. Water supply for the City of Vancouver is
discussed below, but in summary is mainly from north of Burrard Inlet, and in the late 1980s was
identified as significantly vulnerable to an earthquake. This concern heightened in the late 1980s
when the City sold its only fireboat. A 1990 study (EQE Engineering 1990) found “… the City has
inadequate in-city water storage, such that…less than a day’s supply…and little or no emergency
water supply….” finding that “… emergency water demand is estimated to be 20,000 to 30,000
Igpm… [or] …approximately 12 million gallons…[and]… Vancouver emergency water capabilities are
virtually non-existent…” This situation has to be, to some extent, offset by the construction and
deployment of the Dedicated Fire Protection System (DFPS), which is discussed below.

4
A qualitative examination of the situation in the city of Vancouver concluded that conditions were
such that “…likely to result in the vulnerability of Vancouver to post-earthquake fires exceeding that
of San Francisco or Los Angeles and approaching more closely to that prevailing in Japanese Cities”
(Robertson and Mehaffey 1998).
Losses due to fire following earthquake in the Lower Mainland were first studied in detail in 2001
(EQE 2001). Based on the seismotectonics of the region, several scenario earthquakes were analyzed
and are shown in Figure 3. The study area was basically the Metro Vancouver area, with building
exposure and values as shown in Table 1.
Figure 3: Scenario events studied in EQE (2001).
Table 1: EQE (2001) Building square footage and values (Loss in 2001 millions $).
City
Total bldg. area
(millions sq. ft.)
Total bldg.
value
(2001 $ M)
Total content
value
(2001 $ M)
Total value
(2001 $ M)
Burnaby 222.4 20,512 9,447 30,181
City of North Vancouver 17.6 1,341 693 2,052
Coquitlam 96.5 7,990 4,335 12,422
Delta 70.4 5,810 3,224 9,104
District of North Vancouver 102.3 8,625 4,459 13,186
New Westminster 82.6 7,076 3,909 11,068
Port Coquitlam 32.9 2,695 1,515 4,243
Port Moody 16 1,357 769 2,142
Richmond 214.1 16,901 8,783 25,898
Surrey 197.4 16,768 8,900 25,865
Vancouver 713.7 63,937 27,774 92,425
West Vancouver 32.6 2,703 1,395 4,131
Total 1,798 155,715 75,203 232,717
1975/1997 epicentreM7.5
1909 epicentreM7.8
Canada
M7.5
M6, M6.5

5
Estimated median losses for the scenario events are shown in Table 2. The current study is essentially
an update of the 2001 EQE study.
Table 2: EQE (2001) scenario events, fires and losses (Loss in 2001 millions $, % of total value at risk).
Table 3: IBC/AIR (2013) Worldwide study – all property values in British ColumbiaBuildings only – (2013) millions $.
Georgia Strait Mw=7.5
1909 Epicentre Mw=7.8
1975/1997 Epicentre, Mw=7.5
New Westminster Mw=6.5
Subduction Zone Mw=9.0
113 fires 31 fires 101 fires 157 fires 155 fires
Loss % Loss % Loss % Loss % Loss %
$2,795 1.04% $1,172 0.43% $2,685 1.00% $8,529 3.12% $4,700 1.74%
Property type Building or structural
valueContents value Total
Residential 465,184 327,007 792,191
Commercial/industrial 420,400 223,843 644,347
More recently, the Insurance Bureau of Canada sponsored a study of earthquake risk (AIR Worldwide
2013), which examined a magnitude 9.0 earthquake occurring in the Cascadia Subduction Zone at
the shallow depth of 11 km at epicentre location (Lat. 44.706, Lon. -124.569) to the west of
Vancouver Island in the Pacific Ocean, some 300 km from downtown Vancouver. The study employed
a single scenario windspeed of 19 km/h and found ground shaking responsible for most ground-up
losses, but landslides, the tsunami, and fires following the rupture also contribute to the damage
inflicted, Table 3 and Table 4. In summary, the study found:
“that ground shaking from the earthquake will cause fires on 55–65 city blocks in the two days
that follow the earthquake. Almost 50% of the earthquake induced ignitions occur in the
Metro Vancouver area, while only about 10% of the ignitions occur in the Victoria area.
A handful of ignitions are concentrated in the central business district of Vancouver, where
ignition risk is increased due to overhead power lines being in close proximity to mid- and
high-rise buildings. The Burnaby area experiences a high number of ignitions when compared to
the Metro Vancouver area. Other ignitions are scattered throughout the affected area in small
communities. The small communities are less likely to see simultaneous ignitions, but a fire that
ignites may involve several buildings on a block, or even consume the entire block… Some of the
55-65 primary fires that were ignited by the earthquake subsequently ignite fires on neighbouring
city blocks. Fires will ignite on a total of nearly 100 city blocks throughout the affected area and
burn a total of 1.5 to 2.5 million square feet of building floor area.”

6
It should be noted that the IBC/AIR study is for the entirety of British Columbia and does not break
out losses for the Metro Vancouver area, so comparison with other studies focused on the Metro
Vancouver area is difficult.
1.4 Outline of this report
The next section presents a summary of the study region and the data covering the natural, built and
social environments that were employed in this analysis. Section 3 then outlines the analysis methods,
section 4 the findings, and section 5 opportunities for mitigation. References conclude the report.
Table 4: IBC/AIR (2013) Worldwide study – modelled losses Mw 9.0 Cascadia Subduction ZoneBuildings only – (2013) millions $.
Peril Property %
Shake 48,639 3.4%
Tsunami 4,208 0.3%
Fire following 519 0.04%
Liquefaction and landslide 5,250 0.4%
Total direct loss 58,617 4.1%

7
2. Study region
2.1 The study region
The study region is the Vancouver metropolitan region, consisting of 12 municipalities on the shores
of Burrard Inlet and the Fraser River Delta in the southwestern portion of the Lower Mainland of the
province of British Columbia as shown in Figure 4 to Figure 6.
Table 5 indicates a study area population of about 2.5 million1, making the region the most populous
metropolitan area in western Canada, and the third most in Canada, and comprising more than 7%
of Canada’s population. Population growth is shown in Figure 7 and population density is shown in
Figure 8 per SAUID (Settled Area Unit ID) and within the study region varies from 10 to over
16,000 per sq. km. About a quarter of the study area’s population is within the City of Vancouver,
which is the eighth largest city in Canada, a major cultural centre with leading universities, major rail
hub and port.
1 2016 Vancouver Census metropolitan area.
Figure 4: Study region road map.

8
Figure 5: Study region aerial photograph.
Figure 6: Study region municipalities.

9
Table 5: Study region municipalities and population.
Figure 7: Population growth for Vancouver and region(Source: https://en.wikipedia.org/wiki/Demographics_of_Metro_Vancouver#Population_growth).
Jurisdiction Population (2016)
City of Burnaby 232,755
City of Coquitlam 139,284
City of Delta 102,238
Electoral Area A 16,133
Township of Langley 117,285
City of Langley 25,888
City of Maple Ridge 82,256
City of New Westminster 70,996
City of North Vancouver 52,898
District of North Vancouver 85,935
City of Pitt Meadows 18,573
City of Port Coquitlam 58,612
City of Port Moody 33,551
City of Richmond 198,309
City of Surrey 517,887
Tsawwassen First Nation 816
City of Vancouver 631,486
City of White Rock 19,952
District of West Vancouver 42,473
Total population 2,447,327
2,000
(1,0
00s)
Greater Vancouver
Vancouver
1,800
1,600
1,400
1,200
1,000
800
600
400
200
01881 1891 1901 1911 1921 1931 1941 1951 1961 1971 1981 1991 2001

10
2.2 Earth science aspects
2.2.1 Geology
The geology of the Vancouver region is well studied (Armstrong 1990) and is relevant to the
estimation of fire following earthquake in two aspects: the sources of seismicity, and the local site
conditions that affect shaking intensity and permanent ground deformation.
In summary, “the Vancouver area is composed of two distinct geographical areas: the Coast
Mountains along the North Shore and the Fraser Lowland encompassing the city and extending south
to the Canada-U.S.A. border. These are flanked on the south and east by the Olympic and Cascade
Mountains and to the west by the Georgia Straight and the Insular Mountains on Vancouver Island.
The Fraser Lowland is a triangular plain, not a true valley that resulted from erosion by rivers.
It is a depression between the Coast Plutonic Complex, Vancouver Island and the Cascade Mountains
that has been filled with sediments during the last 70 million years… Most of the landforms in the
Fraser Lowland were produced during or since the last major glaciation. The most important agent
for the deposition and sculpturing of these sediments has been the Fraser River, which developed
after ice left the Lowland some 8,000 to 10,000 years ago. Currently, it discharges approximately
18 million tonnes of sand, silt and mud each year, mostly during May, June and July. In order to keep
the river channel open for navigation, about 2.4 million tonnes of sediment, mostly sand, has to be
dredged annually. The nearly flat delta top is nowhere more than a few metres above high tide level.
Between it and the open water, tidal flats are swept by currents and waves. A three-metre-high dyke
or berm has been constructed around the seaward edge of the municipality of Richmond. The dyked
area is largely underlain by fine sediments, laid down when the Fraser River overflowed its banks and
when the sea flooded over the land during storms and at extremely high tides. On Lulu Island, and
south of the present course of the river, these sediments are overlain by peat that accumulated in
large swamps and bogs. Sand underlies most of the tidal flats and mud occurs in a fringe of marsh
around the edge of the delta.” (Armstrong 1990 ), see Figure 9.
Figure 8: Study region population density per SAUID (Settled Area Unit ID).
ICLR Lower Mainland FFE – SPA Risk
Population density
< 10
10…100
100…1000
1000…2000
1000…5000
> 5000
20 km0

11
2.2.2 Historic seismicity and seismic hazard
The Lower Mainland of British Columbia is one of the highest earthquake risk regions in Canada,
Figure 10. The fundamental source of seismicity is the subduction of the Juan de Fuca tectonic plate
beneath the North American plate, Figure 11, termed the Cascadia Subduction Zone (CSZ). West of
Figure 10: Historical seismicity of Canada (Source: Geological Survey of Canada).
Earthquakes in or near Canada, 1627-2015
Magnitude
3
4
5
6
7
8
9
Figure 9: Surficial geology Vancouver area (Armstrong 1979).

12
Figure 11: Subduction of Juan de Fuca Plate beneath North American plate (Source: USGS).
Cascadia earthquake sources
Source Affected area Max. size Recurrence
Subduction zone W.WA, OR, CA Mw 9 500-600 year
Deep Juan de Fuca Plate W.WA, OR Mw 7+ 30-50 year
Crustal faults WA, OR, CA Mw 7+ Hundreds of years?
Vancouver Island, and extending from the north tip of the Island to northern California, the oceanic
Juan de Fuca Plate is moving towards North America at about 2-5 cm/year. This region is called the
Cascadia Subduction Zone. Here, the much smaller Juan de Fuca Plate is sliding (subducting) beneath
the continent (it is about 45 km beneath Victoria, and about 70 km beneath Vancouver). The ocean
plate is not always moving, though. There is good evidence that the Juan de Fuca and North America
plates are currently locked together, causing strain to build up in the earth’s crust. It is this
squeezing of the crust that causes the 300 or so small earthquakes that are located in southwestern
British Columbia each year, and the less-frequent (once per decade, on average, damaging crustal
earthquakes (e.g., a magnitude 7.3 earthquake on central Vancouver Island in 1946). At some time
in the future, these plates will snap loose, generating a huge offshore “subduction” earthquake
similar to the 1964 Mw=9.2 Alaska earthquake, or the 1960 Mw=9.5 Chile earthquake. Current
crustal deformation measurements in this area provide evidence for this model. Geological evidence
also indicates that huge subduction earthquakes have struck this coast about every 240 years and
that there currently is a greater than one in three probability of such an event in the next 50 years
(Goldfinger et al. 2012; Lovett 2010).
13
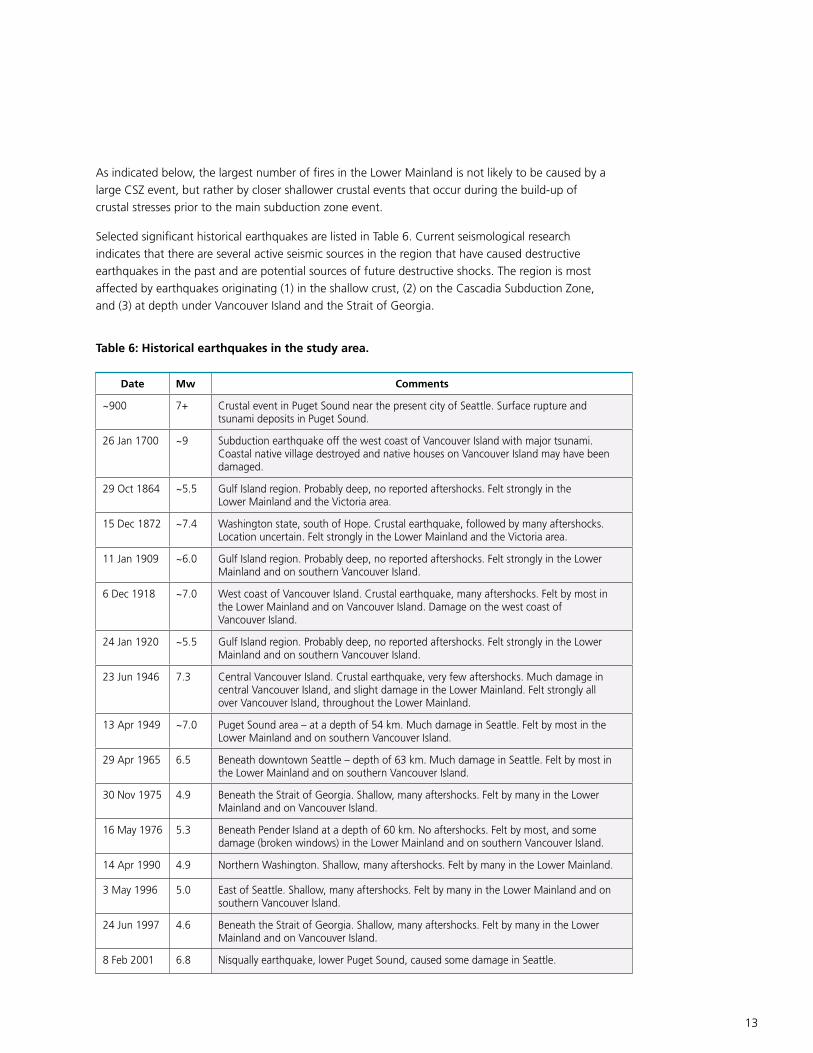
As indicated below, the largest number of fires in the Lower Mainland is not likely to be caused by a
large CSZ event, but rather by closer shallower crustal events that occur during the build-up of
crustal stresses prior to the main subduction zone event.
Selected significant historical earthquakes are listed in Table 6. Current seismological research
indicates that there are several active seismic sources in the region that have caused destructive
earthquakes in the past and are potential sources of future destructive shocks. The region is most
affected by earthquakes originating (1) in the shallow crust, (2) on the Cascadia Subduction Zone,
and (3) at depth under Vancouver Island and the Strait of Georgia.
Table 6: Historical earthquakes in the study area.
Date Mw Comments
~900 7+ Crustal event in Puget Sound near the present city of Seattle. Surface rupture and tsunami deposits in Puget Sound.
26 Jan 1700 ~9 Subduction earthquake off the west coast of Vancouver Island with major tsunami. Coastal native village destroyed and native houses on Vancouver Island may have been damaged.
29 Oct 1864 ~5.5 Gulf Island region. Probably deep, no reported aftershocks. Felt strongly in the Lower Mainland and the Victoria area.
15 Dec 1872 ~7.4 Washington state, south of Hope. Crustal earthquake, followed by many aftershocks. Location uncertain. Felt strongly in the Lower Mainland and the Victoria area.
11 Jan 1909 ~6.0 Gulf Island region. Probably deep, no reported aftershocks. Felt strongly in the Lower Mainland and on southern Vancouver Island.
6 Dec 1918 ~7.0 West coast of Vancouver Island. Crustal earthquake, many aftershocks. Felt by most in the Lower Mainland and on Vancouver Island. Damage on the west coast of Vancouver Island.
24 Jan 1920 ~5.5 Gulf Island region. Probably deep, no reported aftershocks. Felt strongly in the Lower Mainland and on southern Vancouver Island.
23 Jun 1946 7.3 Central Vancouver Island. Crustal earthquake, very few aftershocks. Much damage in central Vancouver Island, and slight damage in the Lower Mainland. Felt strongly all over Vancouver Island, throughout the Lower Mainland.
13 Apr 1949 ~7.0 Puget Sound area – at a depth of 54 km. Much damage in Seattle. Felt by most in the Lower Mainland and on southern Vancouver Island.
29 Apr 1965 6.5 Beneath downtown Seattle – depth of 63 km. Much damage in Seattle. Felt by most in the Lower Mainland and on southern Vancouver Island.
30 Nov 1975 4.9 Beneath the Strait of Georgia. Shallow, many aftershocks. Felt by many in the Lower Mainland and on Vancouver Island.
16 May 1976 5.3 Beneath Pender Island at a depth of 60 km. No aftershocks. Felt by most, and some damage (broken windows) in the Lower Mainland and on southern Vancouver Island.
14 Apr 1990 4.9 Northern Washington. Shallow, many aftershocks. Felt by many in the Lower Mainland.
3 May 1996 5.0 East of Seattle. Shallow, many aftershocks. Felt by many in the Lower Mainland and on southern Vancouver Island.
24 Jun 1997 4.6 Beneath the Strait of Georgia. Shallow, many aftershocks. Felt by many in the Lower Mainland and on Vancouver Island.
8 Feb 2001 6.8 Nisqually earthquake, lower Puget Sound, caused some damage in Seattle.
14
2.2.3 Scenario events
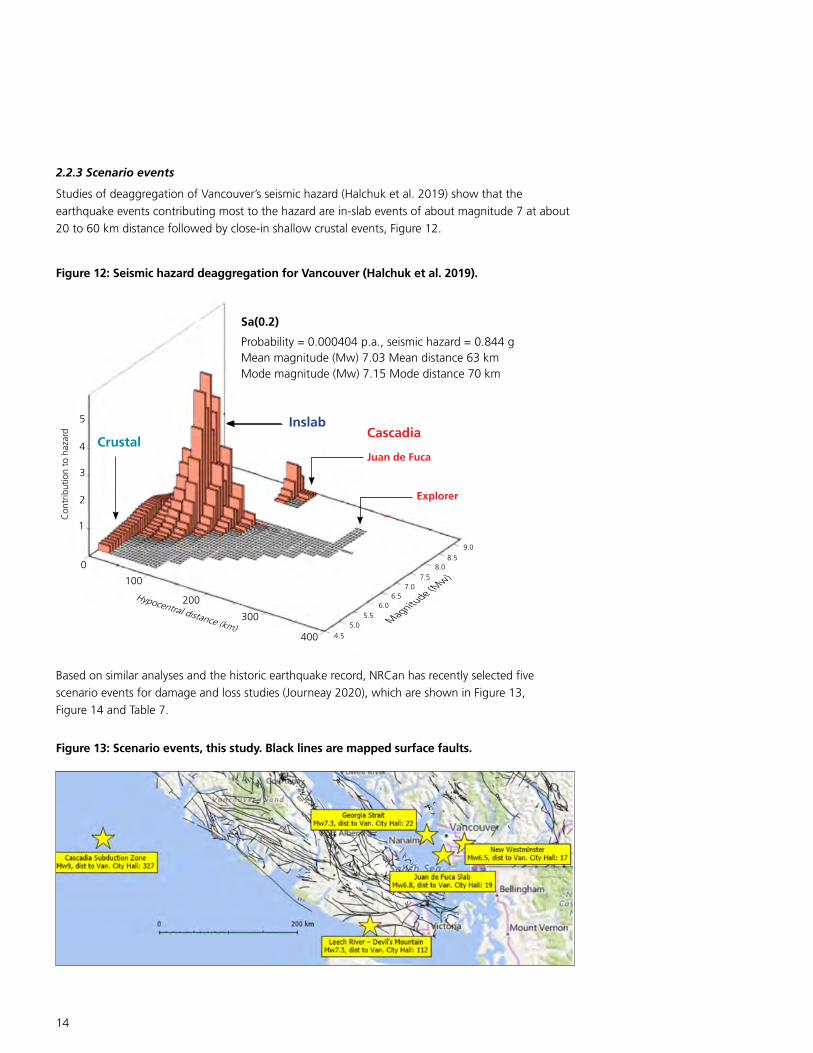
Studies of deaggregation of Vancouver’s seismic hazard (Halchuk et al. 2019) show that the
earthquake events contributing most to the hazard are in-slab events of about magnitude 7 at about
20 to 60 km distance followed by close-in shallow crustal events, Figure 12.
Con
trib
utio
n to
haz
ard
1
2
3
4
5
0
100
Hypocentral distance (km)
200
300
400 4.5
5.05.5
6.06.5
7.07.5
8.08.5
9.0
Magnitu
de (Mw)
Sa(0.2)
Probability = 0.000404 p.a., seismic hazard = 0.844 gMean magnitude (Mw) 7.03 Mean distance 63 kmMode magnitude (Mw) 7.15 Mode distance 70 km
InslabCascadia
Juan de Fuca
Explorer
Crustal
Figure 13: Scenario events, this study. Black lines are mapped surface faults.
Figure 12: Seismic hazard deaggregation for Vancouver (Halchuk et al. 2019).
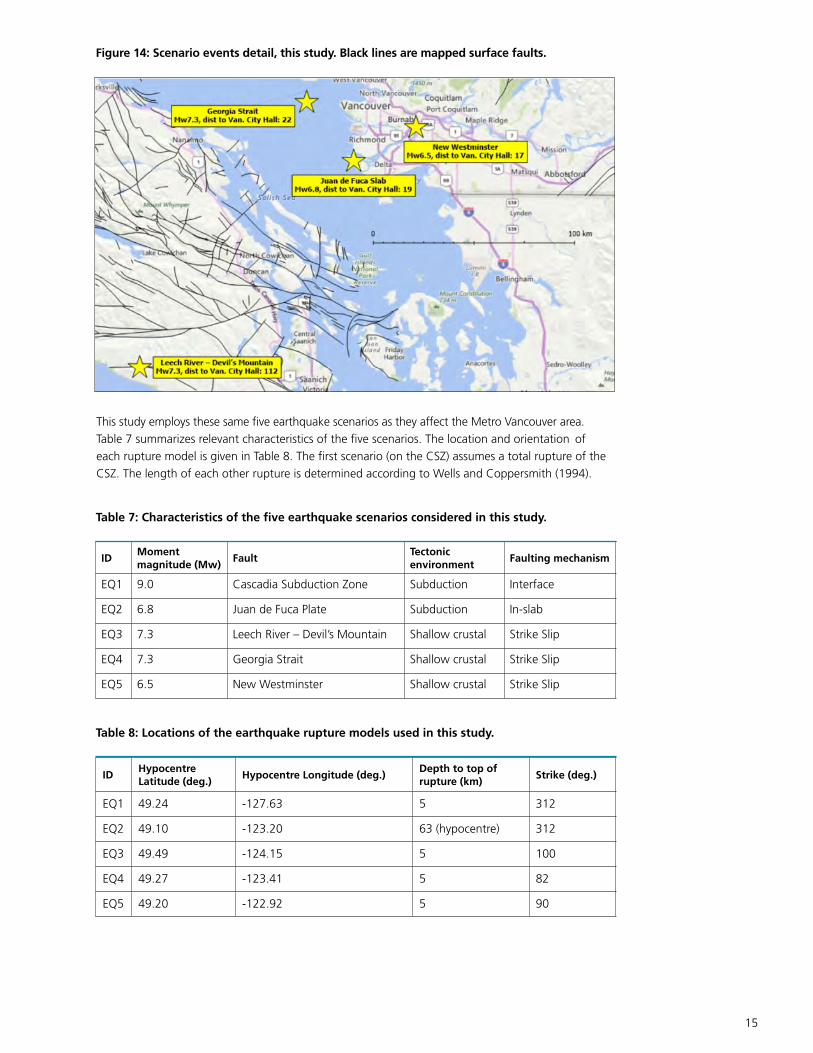
Based on similar analyses and the historic earthquake record, NRCan has recently selected five
scenario events for damage and loss studies (Journeay 2020), which are shown in Figure 13,
Figure 14 and Table 7.
15
This study employs these same five earthquake scenarios as they affect the Metro Vancouver area.
Table 7 summarizes relevant characteristics of the five scenarios. The location and orientation of
each rupture model is given in Table 8. The first scenario (on the CSZ) assumes a total rupture of the
CSZ. The length of each other rupture is determined according to Wells and Coppersmith (1994).
Figure 14: Scenario events detail, this study. Black lines are mapped surface faults.
Table 7: Characteristics of the five earthquake scenarios considered in this study.
Table 8: Locations of the earthquake rupture models used in this study.
ID Moment magnitude (Mw)
FaultTectonic environment
Faulting mechanism
EQ1 9.0 Cascadia Subduction Zone Subduction Interface
EQ2 6.8 Juan de Fuca Plate Subduction In-slab
EQ3 7.3 Leech River – Devil’s Mountain Shallow crustal Strike Slip
EQ4 7.3 Georgia Strait Shallow crustal Strike Slip
EQ5 6.5 New Westminster Shallow crustal Strike Slip
ID Hypocentre Latitude (deg.)
Hypocentre Longitude (deg.)Depth to top of rupture (km)
Strike (deg.)
EQ1 49.24 -127.63 5 312
EQ2 49.10 -123.20 63 (hypocentre) 312
EQ3 49.49 -124.15 5 100
EQ4 49.27 -123.41 5 82
EQ5 49.20 -122.92 5 90

16
A motive for selecting these events is that authorities would then have estimates of fire following
earthquake losses on the same basis as those for the NRCan studies of building damage. Source
mechanisms, style of faulting and other parameters for this study’s scenario events are based on the
above review of seismicity. Length of faulting was calculated using accepted relations (Wells and
Coppersmith 1994). It should be noted, however, that the NRCan estimates of ground motion were
not available for this study; therefore, this study performed its own estimates of ground motion,
with the intent to replicate as closely as possible the scenarios being employed by NRCan.
2.2.4 Local site conditions
Surficial or local soil conditions are a key factor affecting ground motions and thus fire following
earthquake. A key measure of soil conditions for seismic ground motions is Vs30, the shear wave
velocity of the upper 30 m of soil (Borcherdt and Gibbs 1976). NRCan provided detailed Vs30 data
for use in this study, consistent with their own studies, Figure 15.
Figure 15: Regional Vs30 mapping (Source: NRCan).
Vs30 (m/s)
<150
151…300
300…450
450…600
600…750
750…900
900…1050
>1050
ICLR Lower mainland FFE – SPA Risk
2.2.5 Ground motion estimation
Estimates of ground motion are needed as an input for the estimation of post-earthquake ignitions
(Lee et al. 2008; Scawthorn 2018b; TCLEE 2005). This study applies four of the NGA-West2 ground
motion prediction equations (GMPEs) to predict ground motion in the shallow crustal earthquake
scenarios (EQ3 and EQ4), specifically (Abrahamson, Silva and Kamai 2014; Boore et al. 2014;
Campbell and Bozorgnia 2014; Chiou and Youngs 2014). Each of the GMPEs is assigned equal
weight for predicting both the peak ground acceleration (PGA) and peak ground velocity (PGV).
17
For the subduction earthquake scenarios (EQ1 and EQ2), the (Abrahamson, Gregor and Addo 2016)
(“BC Hydro”) GMPE is used to predict PGA. This GMPE does not provide coefficients for the
prediction of PGV, nor do other subduction models in the literature (Atkinson and Boore 2003; Zhao
et al. 2006). We therefore apply the suite of NGA-West2 GMPEs for predicting PGV in EQ1 and EQ2,
acknowledging that these models are not directly applicable to these scenarios.
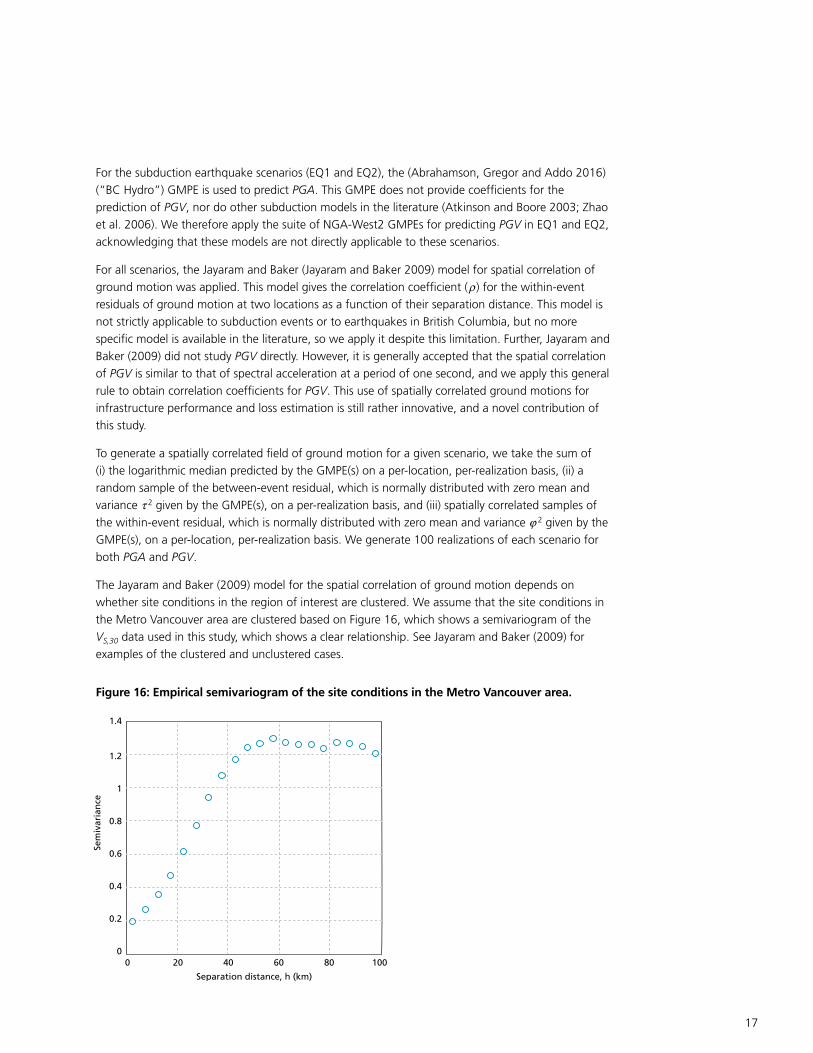
For all scenarios, the Jayaram and Baker (Jayaram and Baker 2009) model for spatial correlation of
ground motion was applied. This model gives the correlation coefficient (r ) for the within-event
residuals of ground motion at two locations as a function of their separation distance. This model is
not strictly applicable to subduction events or to earthquakes in British Columbia, but no more
specific model is available in the literature, so we apply it despite this limitation. Further, Jayaram and
Baker (2009) did not study PGV directly. However, it is generally accepted that the spatial correlation
of PGV is similar to that of spectral acceleration at a period of one second, and we apply this general
rule to obtain correlation coefficients for PGV. This use of spatially correlated ground motions for
infrastructure performance and loss estimation is still rather innovative, and a novel contribution of
this study.
To generate a spatially correlated field of ground motion for a given scenario, we take the sum of
(i) the logarithmic median predicted by the GMPE(s) on a per-location, per-realization basis, (ii) a
random sample of the between-event residual, which is normally distributed with zero mean and
variance t 2 given by the GMPE(s), on a per-realization basis, and (iii) spatially correlated samples of
the within-event residual, which is normally distributed with zero mean and variance j 2 given by the
GMPE(s), on a per-location, per-realization basis. We generate 100 realizations of each scenario for
both PGA and PGV.
The Jayaram and Baker (2009) model for the spatial correlation of ground motion depends on
whether site conditions in the region of interest are clustered. We assume that the site conditions in
the Metro Vancouver area are clustered based on Figure 16, which shows a semivariogram of the
VS,30 data used in this study, which shows a clear relationship. See Jayaram and Baker (2009) for
examples of the clustered and unclustered cases.
Sem
ivar
ian
ce
Separation distance, h (km)
00
0.2
0.4
0.6
0.8
1
1.2
1.4
20 40 60 80 100
Figure 16: Empirical semivariogram of the site conditions in the Metro Vancouver area.

18
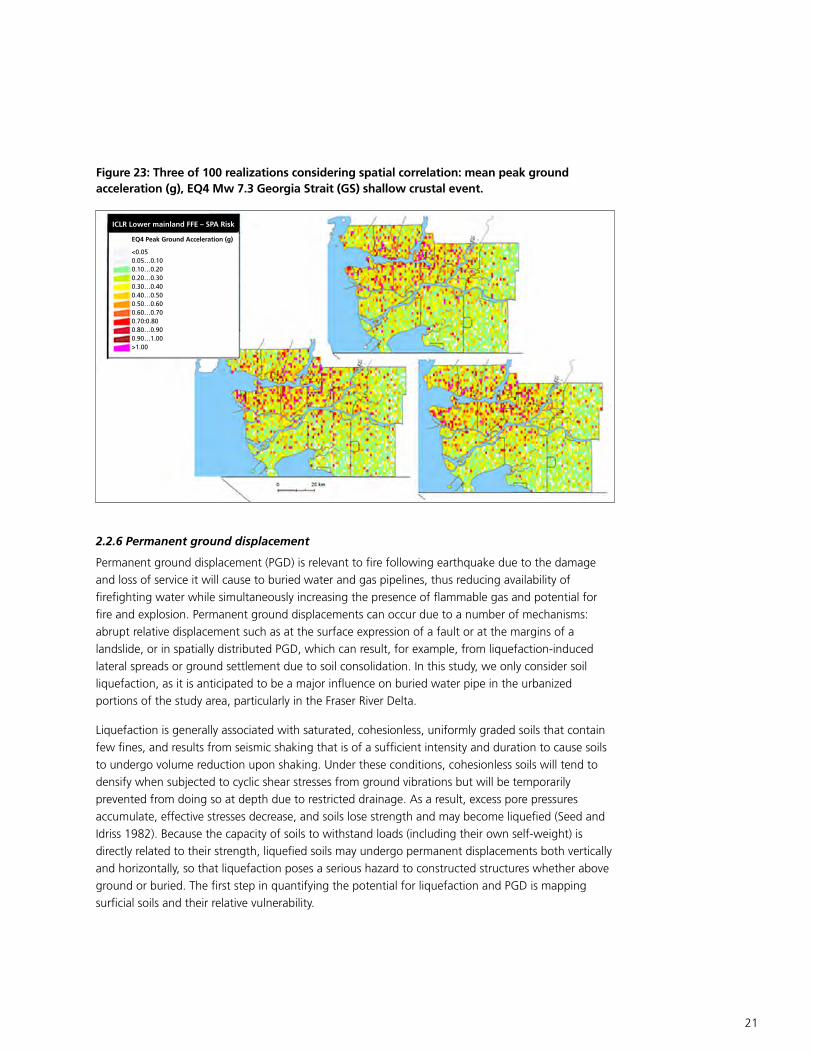
Median PGA for each of the five scenarios are shown in Figure 17 to Figure 21. As discussed above,
there is considerable variation in actual ground motion – for example, Figure 22 shows mean PGA
for EQ4, which can be seen to be considerably greater than median values, as expected, and
Figure 23 shows three of the 100 realizations of spatially correlated ground motion, for EQ4.
Figure 17: Median peak ground acceleration (g), EQ1 Mw 9.0 Cascadia Subduction Zone event.
Figure 18: Median peak ground acceleration (g), EQ2 Mw 6.8 Juan de Fuca Plate (JDF) in-slab event.
ICLR Lower mainland FFE – SPA Risk
ICLR Lower mainland FFE – SPA Risk
EQ2 Peak Ground Acceleration (g)<0.050.05…0.100.10…0.200.20…0.300.30…0.400.40…0.500.50…0.600.60…0.700.70:0.800.80…0.900.90…1.00>1.00
EQ1 Peak Ground Acceleration (g)<0.050.05…0.100.10…0.200.20…0.300.30…0.400.40…0.500.50…0.600.60…0.700.70:0.800.80…0.900.90…1.00>1.00

19
Figure 19: Median peak ground acceleration (g), EQ3 Mw 7.3 Leech River–Devil’s Mountain (LRDM) shallow crustal event.
Figure 20: Median peak ground acceleration (g), EQ4 Mw 7.3 Georgia Strait (GS) shallow crustal event.
ICLR Lower mainland FFE – SPA Risk
ICLR Lower mainland FFE – SPA Risk
EQ3 Peak Ground Acceleration (g)<0.050.05…0.100.10…0.200.20…0.300.30…0.400.40…0.500.50…0.600.60…0.700.70:0.800.80…0.900.90…1.00>1.00
EQ4 Peak Ground Acceleration (g)<0.050.05…0.100.10…0.200.20…0.300.30…0.400.40…0.500.50…0.600.60…0.700.70:0.800.80…0.900.90…1.00>1.00

20
Figure 21: Median peak ground acceleration (g), EQ5 Mw 6.5 New Westminster (NWM) shallow crustal event.
Figure 22: Mean peak ground acceleration (g), EQ4 Mw 7.3 Georgia Strait (GS) shallow crustal event.
ICLR Lower mainland FFE – SPA Risk
ICLR Lower mainland FFE – SPA Risk
EQ5 Peak Ground Acceleration (g)<0.050.05…0.100.10…0.200.20…0.300.30…0.400.40…0.500.50…0.600.60…0.700.70:0.800.80…0.900.90…1.00>1.00
EQ4 Peak Ground Acceleration (g)<0.050.05…0.100.10…0.200.20…0.300.30…0.400.40…0.500.50…0.600.60…0.700.70:0.800.80…0.900.90…1.00>1.00
21
Figure 23: Three of 100 realizations considering spatial correlation: mean peak ground acceleration (g), EQ4 Mw 7.3 Georgia Strait (GS) shallow crustal event.
ICLR Lower mainland FFE – SPA Risk
EQ4 Peak Ground Acceleration (g)
<0.050.05…0.100.10…0.200.20…0.300.30…0.400.40…0.500.50…0.600.60…0.700.70:0.800.80…0.900.90…1.00>1.00
2.2.6 Permanent ground displacement
Permanent ground displacement (PGD) is relevant to fire following earthquake due to the damage
and loss of service it will cause to buried water and gas pipelines, thus reducing availability of
firefighting water while simultaneously increasing the presence of flammable gas and potential for
fire and explosion. Permanent ground displacements can occur due to a number of mechanisms:
abrupt relative displacement such as at the surface expression of a fault or at the margins of a
landslide, or in spatially distributed PGD, which can result, for example, from liquefaction-induced
lateral spreads or ground settlement due to soil consolidation. In this study, we only consider soil
liquefaction, as it is anticipated to be a major influence on buried water pipe in the urbanized
portions of the study area, particularly in the Fraser River Delta.
Liquefaction is generally associated with saturated, cohesionless, uniformly graded soils that contain
few fines, and results from seismic shaking that is of a sufficient intensity and duration to cause soils
to undergo volume reduction upon shaking. Under these conditions, cohesionless soils will tend to
densify when subjected to cyclic shear stresses from ground vibrations but will be temporarily
prevented from doing so at depth due to restricted drainage. As a result, excess pore pressures
accumulate, effective stresses decrease, and soils lose strength and may become liquefied (Seed and
Idriss 1982). Because the capacity of soils to withstand loads (including their own self-weight) is
directly related to their strength, liquefied soils may undergo permanent displacements both vertically
and horizontally, so that liquefaction poses a serious hazard to constructed structures whether above
ground or buried. The first step in quantifying the potential for liquefaction and PGD is mapping
surficial soils and their relative vulnerability.
22
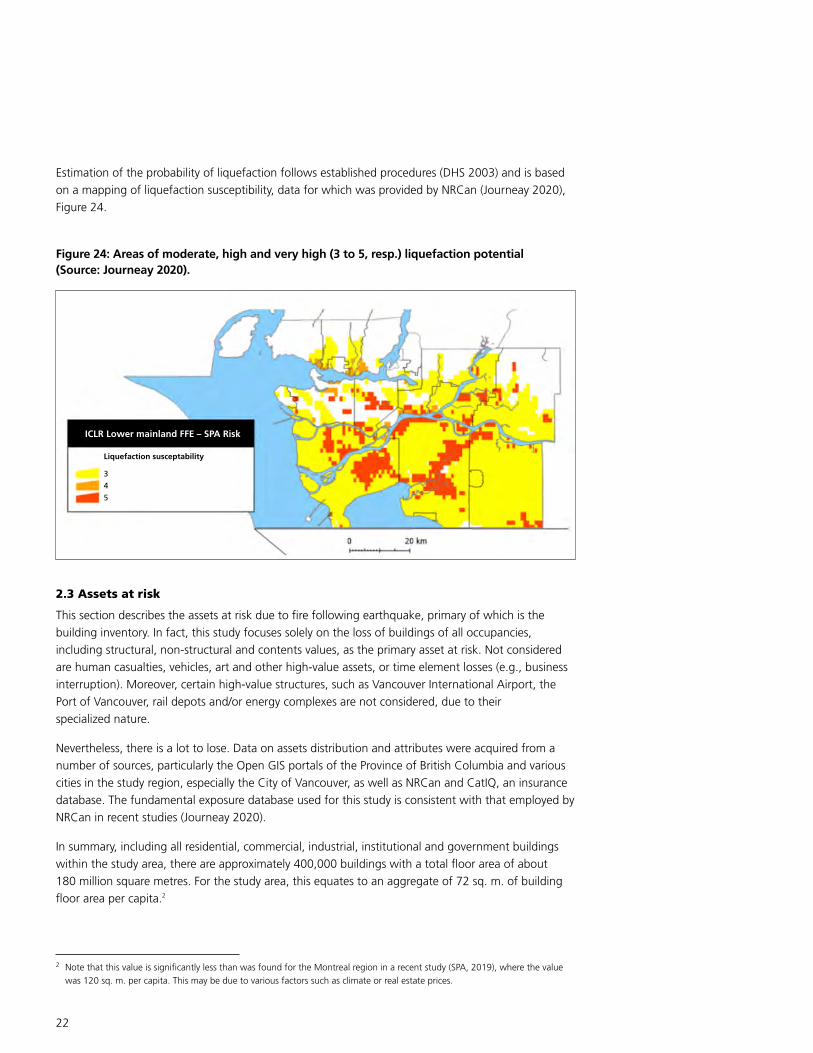
Estimation of the probability of liquefaction follows established procedures (DHS 2003) and is based
on a mapping of liquefaction susceptibility, data for which was provided by NRCan (Journeay 2020),
Figure 24.
Figure 24: Areas of moderate, high and very high (3 to 5, resp.) liquefaction potential (Source: Journeay 2020).
ICLR Lower mainland FFE – SPA Risk
Liquefaction susceptability
3
4
5
2.3 Assets at risk
This section describes the assets at risk due to fire following earthquake, primary of which is the
building inventory. In fact, this study focuses solely on the loss of buildings of all occupancies,
including structural, non-structural and contents values, as the primary asset at risk. Not considered
are human casualties, vehicles, art and other high-value assets, or time element losses (e.g., business
interruption). Moreover, certain high-value structures, such as Vancouver International Airport, the
Port of Vancouver, rail depots and/or energy complexes are not considered, due to their
specialized nature.
Nevertheless, there is a lot to lose. Data on assets distribution and attributes were acquired from a
number of sources, particularly the Open GIS portals of the Province of British Columbia and various
cities in the study region, especially the City of Vancouver, as well as NRCan and CatIQ, an insurance
database. The fundamental exposure database used for this study is consistent with that employed by
NRCan in recent studies (Journeay 2020).
In summary, including all residential, commercial, industrial, institutional and government buildings
within the study area, there are approximately 400,000 buildings with a total floor area of about
180 million square metres. For the study area, this equates to an aggregate of 72 sq. m. of building
floor area per capita.2
2 Note that this value is significantly less than was found for the Montreal region in a recent study (SPA, 2019), where the value
was 120 sq. m. per capita. This may be due to various factors such as climate or real estate prices.
23
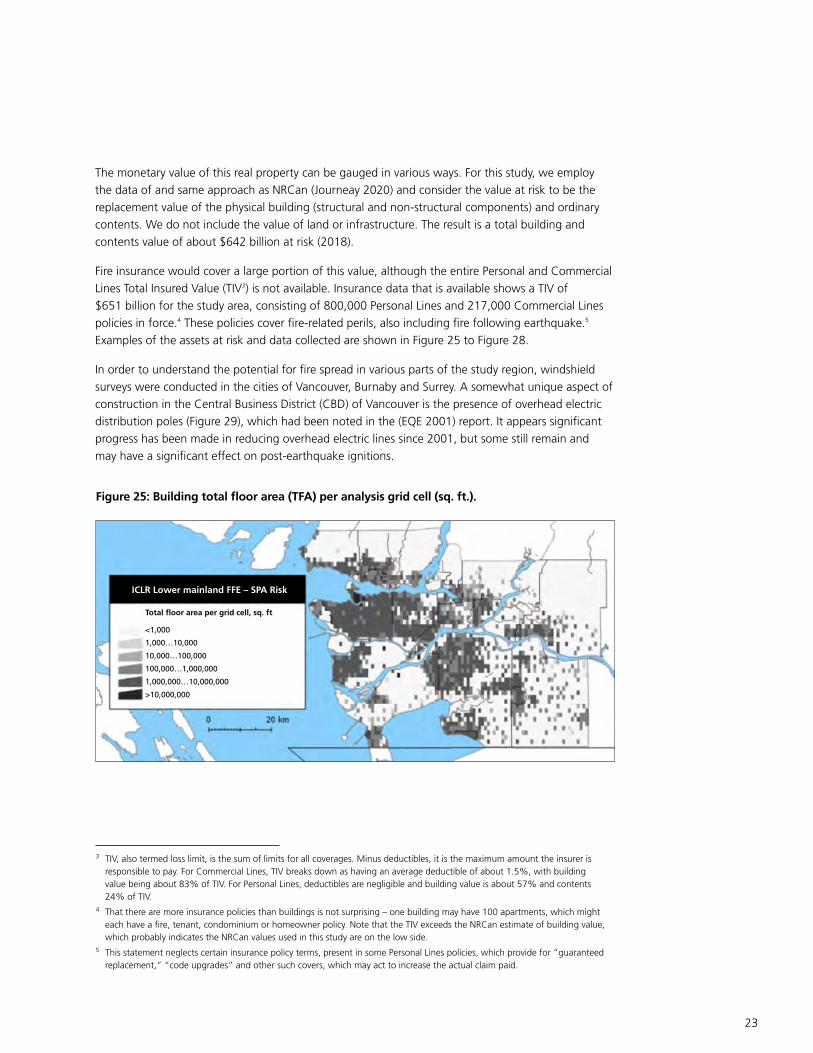
The monetary value of this real property can be gauged in various ways. For this study, we employ
the data of and same approach as NRCan (Journeay 2020) and consider the value at risk to be the
replacement value of the physical building (structural and non-structural components) and ordinary
contents. We do not include the value of land or infrastructure. The result is a total building and
contents value of about $642 billion at risk (2018).
Fire insurance would cover a large portion of this value, although the entire Personal and Commercial
Lines Total Insured Value (TIV3) is not available. Insurance data that is available shows a TIV of
$651 billion for the study area, consisting of 800,000 Personal Lines and 217,000 Commercial Lines
policies in force.4 These policies cover fire-related perils, also including fire following earthquake.5
Examples of the assets at risk and data collected are shown in Figure 25 to Figure 28.
In order to understand the potential for fire spread in various parts of the study region, windshield
surveys were conducted in the cities of Vancouver, Burnaby and Surrey. A somewhat unique aspect of
construction in the Central Business District (CBD) of Vancouver is the presence of overhead electric
distribution poles (Figure 29), which had been noted in the (EQE 2001) report. It appears significant
progress has been made in reducing overhead electric lines since 2001, but some still remain and
may have a significant effect on post-earthquake ignitions.
3 TIV, also termed loss limit, is the sum of limits for all coverages. Minus deductibles, it is the maximum amount the insurer is responsible to pay. For Commercial Lines, TIV breaks down as having an average deductible of about 1.5%, with building value being about 83% of TIV. For Personal Lines, deductibles are negligible and building value is about 57% and contents 24% of TIV.
4 That there are more insurance policies than buildings is not surprising – one building may have 100 apartments, which might each have a fire, tenant, condominium or homeowner policy. Note that the TIV exceeds the NRCan estimate of building value, which probably indicates the NRCan values used in this study are on the low side.
5 This statement neglects certain insurance policy terms, present in some Personal Lines policies, which provide for “guaranteed replacement,” “code upgrades” and other such covers, which may act to increase the actual claim paid.
Figure 25: Building total floor area (TFA) per analysis grid cell (sq. ft.).
ICLR Lower mainland FFE – SPA Risk
Total floor area per grid cell, sq. ft
<1,000
1,000…10,000
10,000…100,000
100,000…1,000,000
1,000,000…10,000,000
>10,000,000

24
Figure 26: Detail of building density distribution, central Vancouver.
Figure 27: Detail of building footprint data, downtown Vancouver. Building footprint data is especially useful for estimation of fire spread.
ICLR Lower mainland FFE – SPA Risk
Total floor area per grid cell, sq. ft
<1,000
1,000…10,000
10,000…100,000
100,000…1,000,000
1,000,000…10,000,000
>10,000,000

25
Figure 28: Detail of building footprint data, central Vancouver.
Figure 29: Examples of overhead electric distribution lines in densely built areas of downtown and central Vancouver.

26
2.4 Fire aspects
This section discusses aspects related to fire spread and firefighting, particularly the fire service and
water supply.
2.4.1 Fire service
The fire service in the Lower Mainland in general is very advanced, well-equipped, and modern in its
organization, methods and tactics. There is a total of 98 fire halls within the study area, as shown in
Figure 30 and Table 9, among which are distributed approximately 200 fire engines available for
immediate firefighting,6 which is consistent with normal practice in North American urban regions of
a comparable size.7 Each fire hall has a “first-due” area, termed a Fire Response Area (FRA), within
which the fire apparatus are expected to normally be the first to arrive. Detailed mapping data for
each fire hall’s FRA was not available, so Voronoi areas were generated for each fire hall and are used
in lieu of the actual FRA mapping,8 as shown in the figure by lines between fire halls.
6 Quantifying the number of engines available for immediate firefighting is a matter of judgment. In addition to fire engines in fire stations staffed and ready to go, fire departments routinely keep a number of “spares,” which replace engines when they are out for maintenance, and which can be put in service if extraordinary need arises. Not all spares are likely to be available at any given time, nor is there likely to be adequate on-duty staffing for all spares. For this study, the number of spares was taken into account along with other factors, to arrive at an estimate of the total immediately available for firefighting. Other apparatus, such as ladder trucks, are important but don’t pump water, which is the sine qua non for fire suppression, and therefore don’t enter into the analysis.
7 Particularly Canadian practice, which tends to be closer to the European model for fire halls, where there are fewer but larger fire halls, as opposed to typical U.S. practice.
8 Voronoi areas, named for the Russian mathematician Georgy Voronoy (1868-1908) partition a region according to specified rules, in this case, lines are drawn equidistant between stations, so that points within the resulting FRAs are always closest to that station (measured in a linear distance – traffic patterns, barriers and other factors are not considered). In other studies, the author has found use of Voronoi diagrams to be a good approximation of actual FRAs.
Table 9: Number of fire halls by jurisdiction.
Jurisdiction Fire halls
Village of Anmore 1
City of Burnaby 7
Bowen Island Municipality 1
City of Coquitlam 4
City of Delta 7
Electoral Area A 0
Township of Langley 7
City of Langley 1
Village of Lions Bay 1
City of Maple Ridge 4
City of New Westminster 3
Jurisdiction Fire halls
City of North Vancouver 1
District of North Vancouver 6
City of Pitt Meadows 1
City of Port Coquitlam 2
City of Port Moody 2
City of Richmond 8
City of Surrey 17
Tsawwassen First Nation 0
City of Vancouver 20
City of White Rock 1
District of West Vancouver 4
Total 98
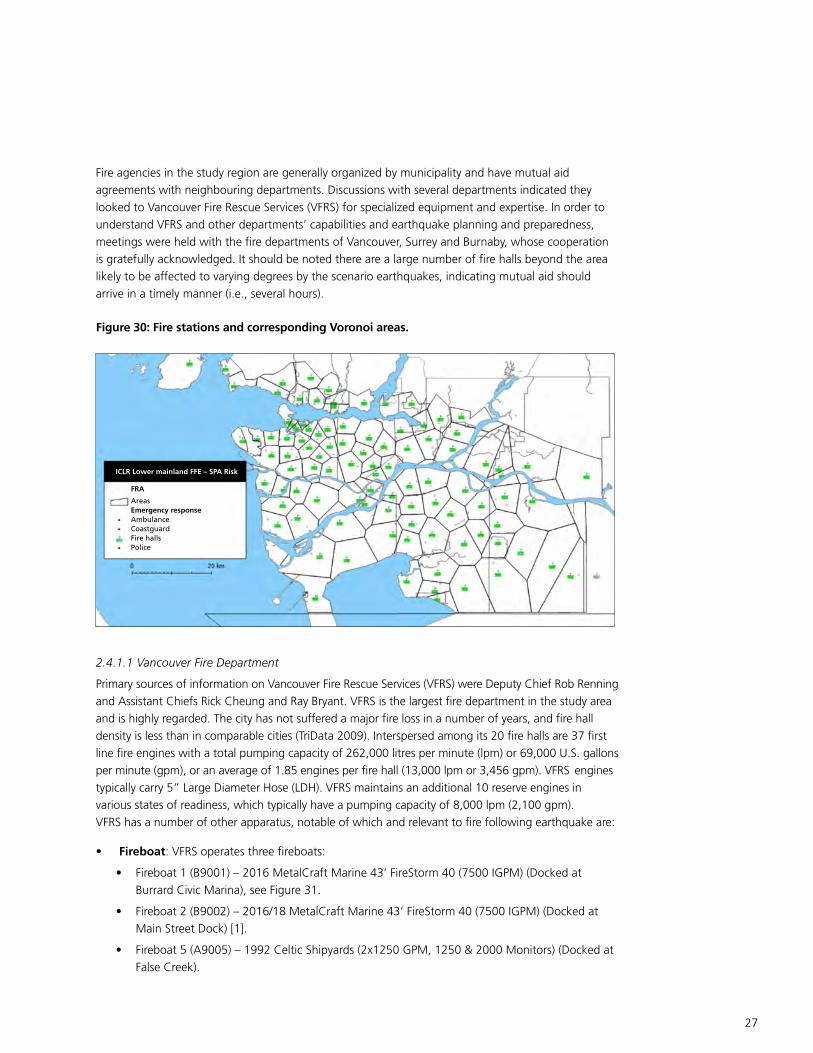
27
Fire agencies in the study region are generally organized by municipality and have mutual aid
agreements with neighbouring departments. Discussions with several departments indicated they
looked to Vancouver Fire Rescue Services (VFRS) for specialized equipment and expertise. In order to
understand VFRS and other departments’ capabilities and earthquake planning and preparedness,
meetings were held with the fire departments of Vancouver, Surrey and Burnaby, whose cooperation
is gratefully acknowledged. It should be noted there are a large number of fire halls beyond the area
likely to be affected to varying degrees by the scenario earthquakes, indicating mutual aid should
arrive in a timely manner (i.e., several hours).
Figure 30: Fire stations and corresponding Voronoi areas.
ICLR Lower mainland FFE – SPA Risk
FRA
AreasEmergency responseAmbulanceCoastguardFire hallsPolice
2.4.1.1 Vancouver Fire Department
Primary sources of information on Vancouver Fire Rescue Services (VFRS) were Deputy Chief Rob Renning
and Assistant Chiefs Rick Cheung and Ray Bryant. VFRS is the largest fire department in the study area
and is highly regarded. The city has not suffered a major fire loss in a number of years, and fire hall
density is less than in comparable cities (TriData 2009). Interspersed among its 20 fire halls are 37 first
line fire engines with a total pumping capacity of 262,000 litres per minute (lpm) or 69,000 U.S. gallons
per minute (gpm), or an average of 1.85 engines per fire hall (13,000 lpm or 3,456 gpm). VFRS engines
typically carry 5” Large Diameter Hose (LDH). VFRS maintains an additional 10 reserve engines in
various states of readiness, which typically have a pumping capacity of 8,000 lpm (2,100 gpm).
VFRS has a number of other apparatus, notable of which and relevant to fire following earthquake are:
• Fireboat: VFRS operates three fireboats:
• Fireboat 1 (B9001) – 2016 MetalCraft Marine 43’ FireStorm 40 (7500 IGPM) (Docked at
Burrard Civic Marina), see Figure 31.
• Fireboat 2 (B9002) – 2016/18 MetalCraft Marine 43’ FireStorm 40 (7500 IGPM) (Docked at
Main Street Dock) [1].
• Fireboat 5 (A9005) – 1992 Celtic Shipyards (2x1250 GPM, 1250 & 2000 Monitors) (Docked at
False Creek).

28
Figure 31: VFRS fireboat 1.
Figure 32: VFRS HydroSub.®
Figure 33: VFRS hose tender.
Fireboats are particularly valuable with regard to fire
following earthquake as they are floating pump
stations that can supply hose lines independent of the
buried water distribution network, from an
inexhaustible water source.
• HydroSub®: VFRS operates a diesel powered
hydraulically actuated pump (trade name
HydroSub®), Figure 32. HydroSubs® are operated
by other fire departments concerned about fire
following earthquake (San Francisco FD, Oakland
FD, Berkeley FD) and are essentially an onshore
fireboat, in the sense that they can draft water
beyond the reach of fire engines and supply hose
lines from large alternative water sources.
• Hose tender: VFRS operates one hose tender
carrying 5,000 ft. of 5” hose, Figure 33, which
essentially permits creation of an emergency
above-ground water distribution network.

29
• Hose reels: In lieu of additional hose tenders, VFRS recently acquired three towed hose reels
each carrying 6000 ft. of 6” hose, Figure 34, which provide a capacity essentially equivalent to a
hose tender (lacking important appurtenances, however, as discussed later).
Figure 34: VFRS hose reels.
Figure 35: Dedicated Fire Protection System (DFPS). Pump stations are at False Creek and Coal Harbour. The grey area represents a 1,000-ft buffer around the system’s water mains (red lines).
• DFPS: The City of Vancouver operates a Dedicated Fire Protection System (DFPS) to protect the
downtown and selected other high-density areas, Figure 35. The DFPS was constructed in the late
1990s and is a high-pressure water distribution network specially designed against earthquake.
It is relatively unique, the only comparable such system being San Francisco’s EFWS (Emergency
Firefighting Water System). The DFPS provides a seismically reliable redundant water supply
independent of the buried potable water distribution network. It is supplied from two pump
stations and can also be supplied by the fireboats.
False Creek crossing
Existing DFPS pipeline
DFPS coverage area (existing) for a 10,000 lgpm fire
Pump stations
Coal Harbour pump station
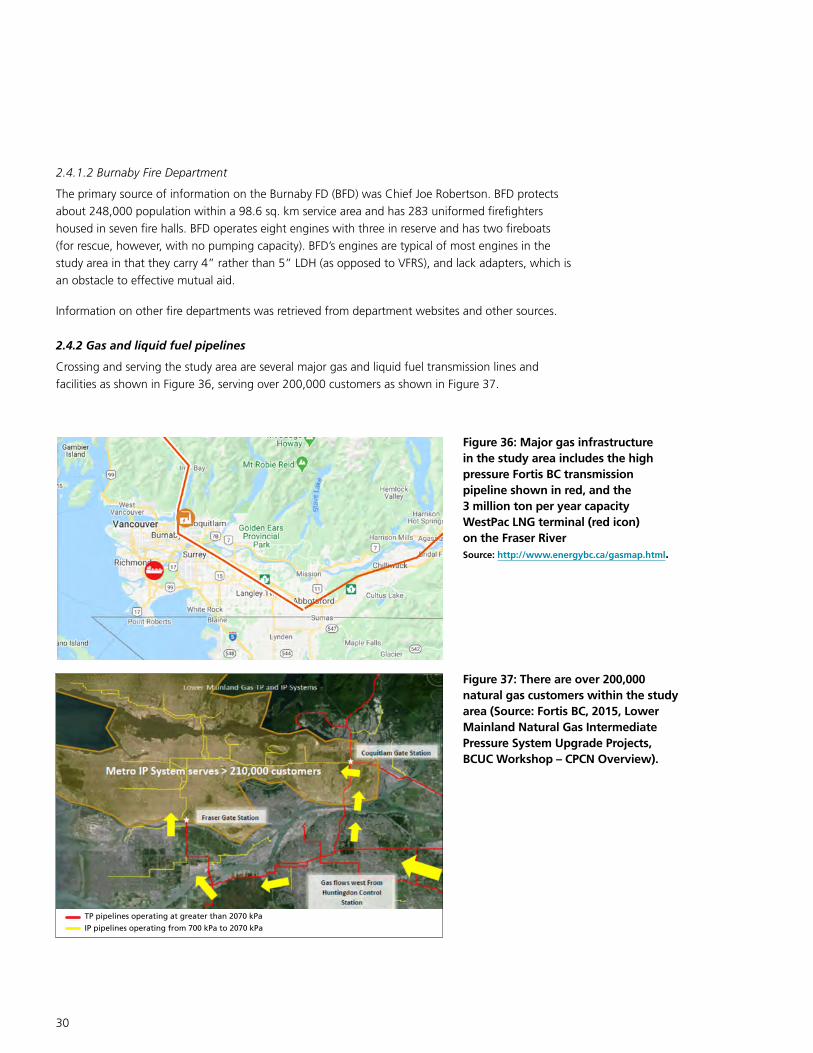
30
2.4.1.2 Burnaby Fire Department
The primary source of information on the Burnaby FD (BFD) was Chief Joe Robertson. BFD protects
about 248,000 population within a 98.6 sq. km service area and has 283 uniformed firefighters
housed in seven fire halls. BFD operates eight engines with three in reserve and has two fireboats
(for rescue, however, with no pumping capacity). BFD’s engines are typical of most engines in the
study area in that they carry 4” rather than 5” LDH (as opposed to VFRS), and lack adapters, which is
an obstacle to effective mutual aid.
Information on other fire departments was retrieved from department websites and other sources.
2.4.2 Gas and liquid fuel pipelines
Crossing and serving the study area are several major gas and liquid fuel transmission lines and
facilities as shown in Figure 36, serving over 200,000 customers as shown in Figure 37.
Figure 36: Major gas infrastructure in the study area includes the high pressure Fortis BC transmission pipeline shown in red, and the 3 million ton per year capacity WestPac LNG terminal (red icon) on the Fraser River Source: http://www.energybc.ca/gasmap.html.
Figure 37: There are over 200,000 natural gas customers within the study area (Source: Fortis BC, 2015, Lower Mainland Natural Gas Intermediate Pressure System Upgrade Projects, BCUC Workshop – CPCN Overview).
TP pipelines operating at greater than 2070 kPa
IP pipelines operating from 700 kPa to 2070 kPa

31
2.4.3 Water supply
Adequate firefighting water supply is essential to prevent ignitions from growing into conflagrations
following an earthquake. If water supply is severely impacted by the scenario event, firefighters will
not be able to access water from fire hydrants, and valuable time will be lost accessing alternative
water sources, during which fires may grow out of control.
The study area is supplied by Metro Vancouver from primary sources on the Capilano, Seymour and
Coquitlam river watersheds north of Burrard Inlet via large transmission lines, Figure 38. The
performance of these transmission lines is important following an earthquake, although fire hydrants
are supplied from the smaller distribution network, whose performance is most crucial and depends
on their materials of construction, diameter, joints and the types of ground they are buried in.
These aspects are discussed in Section 3, while pipe data is shown in Figure 39 (pipe data was
provided by NRCan).
Figure 38: The study area is supplied by Metro Vancouver from primary sources on the Capilano, Seymour and Coquitlam river watersheds north of Burrard Inlet via large transmission lines (Source: https://gis.metrovancouver.org/mvmaps/Water).
Figure 39: Water distribution network, differentiated by material (Sources: NRCan, Journeay 2020).
ICLR Lower mainland FFE – SPA Risk
Water distribution pipe network
Primary pipe materials
AC
Concrete
Cast iron
Ductile iron
HDPE
PVC
Steel
Wood

32
2.4.3.1 Alternative water supplies
Because water supply systems may sometimes fail, such as due to buried water pipe breaks in an
earthquake, it is good practice for fire departments to identify and practise accessing alternative
water supplies (AWS). Discussions with the study region’s fire departments indicated they follow this
practice, and VFRS provided an excellent compilation of their AWS. Based on a review of alternative
water sources, and the capability of fire departments to relay water from those sources to various
locations, an Alternative Water Supply Factor (AWSF) was determined and is shown in Figure 40,
where AWSF is the probability of receiving water from an alternative water source.
Figure 40: Study area Alternative Water Supply Factor, AWSF.
ICLR Lower mainland FFE – SPA Risk
Alternative WSF
<0.1
0.1…0.2
0.2…0.3
0.3…0.4
0.4…0.5
0.5…0.6
0.6…0.7
0.7…0.8
0.8…0.9
>0.9
2.4.4 Weather
An important factor in large conflagrations is weather (NFPA 1951; TCLEE 2005), where hot, dry,
windy weather (“red flag” days) are especially critical for the occurrence of large fires. The climate of
Vancouver may be summarized as:
“The climate of Vancouver, British Columbia, Canada, is a moderate oceanic climate (Köppen
climate classification Cfb) that borders on a warm-summer Mediterranean climate (Csb). Its
summer months are typically dry, often resulting in moderate drought conditions, usually in
July and August. In contrast, the rest of the year is rainy, especially between October and March.
Like the rest of the British Columbia Coast, the city is tempered by the North Pacific Current,
which has its origins in the milder Kuroshio Current and is also, to an extent, sheltered by the
mountains of Vancouver Island to the west.”9
9 https://en.wikipedia.org/wiki/Climate_of_Vancouver

33
These patterns are shown in Figure 41, while windspeed complementary cumulative distribution is
shown in Figure 42.
Figure 41: Vancouver weather pattern (Source: https://en.wikipedia.org/wiki/Climate_of_Vancouver).
Figure 42: Study area windspeed complementary cumulative distribution (for example, a windspeed of 5 mph has about 55% probability of being exceeded, and 10 mph about 7% probability of exceedance).
CD
F(x)
Wind speed (mph)
Pitt Meadows station
00 5 10 15 20 25
0.1
0.2
0.3
0.4
0.5
0.6
0.7
0.8
0.9
1
Station dataGamma model
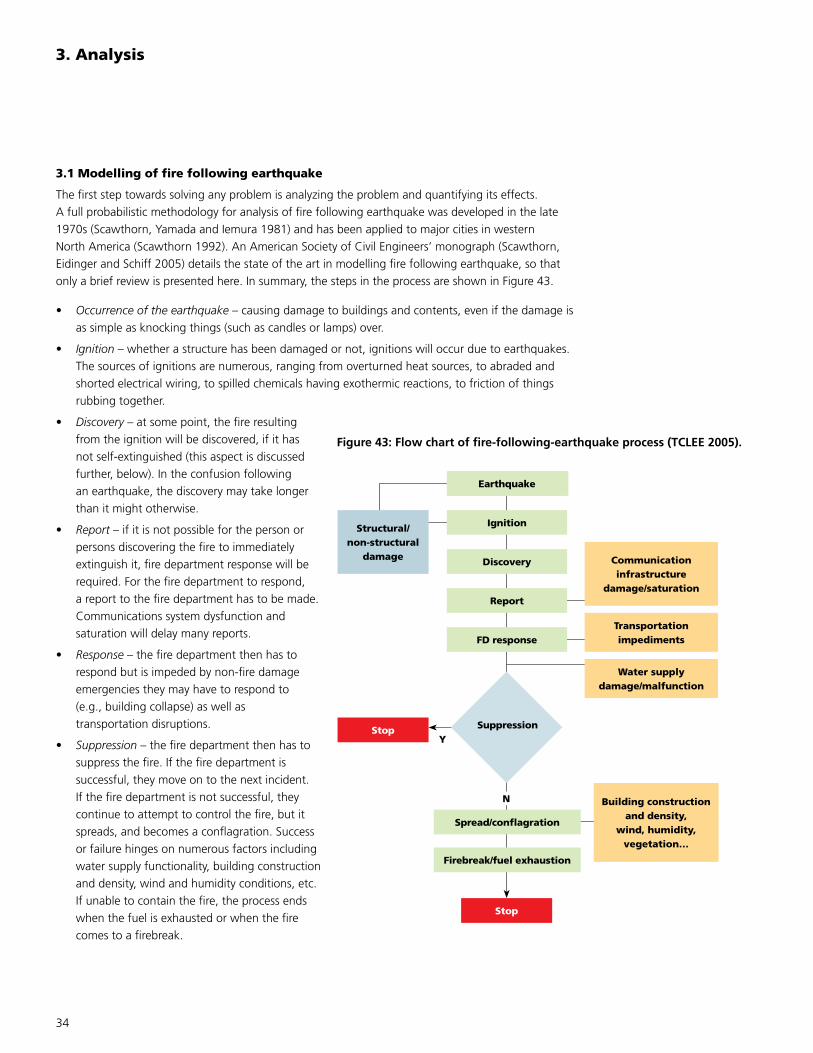
34
3. Analysis
3.1 Modelling of fire following earthquake
The first step towards solving any problem is analyzing the problem and quantifying its effects.
A full probabilistic methodology for analysis of fire following earthquake was developed in the late
1970s (Scawthorn, Yamada and Iemura 1981) and has been applied to major cities in western
North America (Scawthorn 1992). An American Society of Civil Engineers’ monograph (Scawthorn,
Eidinger and Schiff 2005) details the state of the art in modelling fire following earthquake, so that
only a brief review is presented here. In summary, the steps in the process are shown in Figure 43.
• Occurrence of the earthquake – causing damage to buildings and contents, even if the damage is
as simple as knocking things (such as candles or lamps) over.
• Ignition – whether a structure has been damaged or not, ignitions will occur due to earthquakes.
The sources of ignitions are numerous, ranging from overturned heat sources, to abraded and
shorted electrical wiring, to spilled chemicals having exothermic reactions, to friction of things
rubbing together.
• Discovery – at some point, the fire resulting
from the ignition will be discovered, if it has
not self-extinguished (this aspect is discussed
further, below). In the confusion following
an earthquake, the discovery may take longer
than it might otherwise.
• Report – if it is not possible for the person or
persons discovering the fire to immediately
extinguish it, fire department response will be
required. For the fire department to respond,
a report to the fire department has to be made.
Communications system dysfunction and
saturation will delay many reports.
• Response – the fire department then has to
respond but is impeded by non-fire damage
emergencies they may have to respond to
(e.g., building collapse) as well as
transportation disruptions.
• Suppression – the fire department then has to
suppress the fire. If the fire department is
successful, they move on to the next incident.
If the fire department is not successful, they
continue to attempt to control the fire, but it
spreads, and becomes a conflagration. Success
or failure hinges on numerous factors including
water supply functionality, building construction
and density, wind and humidity conditions, etc.
If unable to contain the fire, the process ends
when the fuel is exhausted or when the fire
comes to a firebreak.
EarthquakeEarthquake
IgnitionStructural/non-structural
damage Communicationinfrastructure
damage/saturation
Transportation impediments
Water supply damage/malfunction
Building construction and density,
wind, humidity, vegetation…
Discovery
Report
FD response
Spread/conflagration
Firebreak/fuel exhaustion
Stop
Stop
SuppressionY
N
Figure 43: Flow chart of fire-following-earthquake process (TCLEE 2005).

35
?
?
Conflagration?
This process is also shown in Figure 44, which is a fire department operations time line. Time is of
the essence for the fire following earthquake problem. In this figure, the horizontal axis is Time,
beginning at the time of the earthquake, while the vertical axis presents a series of horizontal bars of
varying width. Each of these bars depicts the development of one fire, from ignition through growth
or increasing size (size is indicated by the width or number of bars). Fire following earthquake is a
highly non-linear process, modelling of which does not have great precision and is such that in
many cases the only clear result is differentiation between situations of a few small fires, versus
major conflagration.
Figure 44: Chart of fire department operations time line. Horizontal axis is time, beginning at time of earthquake. Horizontal bars depict development of fires, from ignition through growth or increasing size (size is indicated by width or number of horizontal bars) (Scawthorn 1987).
3.2 Ignitions
The number and pattern of ignitions are based on methods in (SPA Risk 2009), which are further
discussed in (Scawthorn 2018a) and are shown in Figure 45. The cause of these ignitions will likely be
similar to causes in the 1994 Northridge earthquake, which is the best U.S. data set for recent fires
following an earthquake – about half of all ignitions would be electrical-related, a quarter gas-related,
and the other due to a variety of causes, including chemical reaction. Also based on the Northridge
experience, about half of all ignitions would typically occur in single-family residential dwellings,
with another 26% in multi-family residential occupancies – that is, about 70% of all ignitions
occur in residential occupancies. Educational facilities would be a small percentage of all ignitions
(3% in Northridge), and most of these are due to exothermic reactions of spilled chemicals in
chemistry laboratories.

36
10.00
5
Ign
itio
n r
ate
per
cen
sus
trac
t
6 7 8 9 10
1.00
0.10
0.01
A.NB2med
0.00
A.NB2med+sd
MMI
MMI
A.NB2med-sd SPA09
10.00
5
Ign
itio
n r
ate
per
cen
sus
trac
t
6 7 8 9 10
1.00
0.10
0.01
0.00
Figure 45: Ignition models, taken from (Scawthorn 2018a): comparison of ignition regression models (1) [Davidson 2009] and (3) [SPA 2009] using median values per census tract. Dotted lines are equation (1) plus and minus one standard deviation. Abscissas in the figure are Modified Mercalli Intensity (MMI), but analysis for this study employed peak ground acceleration (PGA) as the hazard measure.

37
3.3 Initial response
3.3.1 Citizen response
Ignitions requiring fire department response will initially be responded to by citizens – as noted, they will be able to suppress some fires, which are not included in the estimates in section 4. When citizens realize the fire is beyond their capabilities, they will endeavour to call the fire department, by telephone since fire alarm street pull boxes have largely disappeared from the North American urban landscape. Attempts to report via 911 will almost universally be unsuccessful, not so much due to damage to the telephone system as much as simple saturation of the system and 911 call centres. Citizens will then go by auto to the nearest fire station, but such “still alarms” will be largely unneeded, since the fire companies will have already responded to the nearest fire (“self-dispatched”), if not dispatched by 911.
Experience shows that citizens on scene will respond rationally (Van anne et al. 1994) rescuing as many people as possible and protecting exposures. Water supply from mains (discussed below) will often be unavailable.
3.3.2 Reporting
As noted above, 911 centres will be overwhelmed, and doing as much as possible to triage events and dispatch resources. Reports of fires during the initial period will be haphazard. Most fire departments do not have their own helicopters, and TV helicopter news reporting will be a valuable resource for a few major incidents, but not most. An anecdote demonstrates this – the first knowledge the San Francisco Fire Department EOC had of the Marina fire in the 1989 Loma Prieta earthquake was from television news reports (despite several companies having responded). Quickly gaining an accurate complete situational awareness is still a challenge.
3.3.3 Fire service initial response
The initial response of fire companies and personnel in the study area will be to protect themselves during violent shaking, and as soon as possible open the doors and remove apparatus (e.g., pumpers and ladder trucks) from the fire stations. Different departments have somewhat varying earthquake procedures but, in general, companies will remove apparatus to a pre-designated location, often simply in front of the fire station, check the station for damage and perform a radio check. By this time, typically within five minutes, they will either have self-dispatched to an observed smoke column, responded to a citizen still alarm, or been instructed to mobilize with other companies into a strike team.
Debris and bridge damage may block some roads and impede access to fire sites, although most cities are sufficiently redundant in street layout such that added travel time is limited to a few minutes, typically less than time lost due to delayed reporting. This has been specifically studied for a portion of Vancouver Island (Tamima and Chouinard 2017), finding that debris typically added about four minutes to travel time, with another four minutes added by bridge closures (i.e., a total of about eight minutes when both debris and bridge closures were considered).
Local fire service resources will be completely committed, and in need of assistance from outside the study area. The primary needs will be personnel, additional hose, hard suction hose (that is, hose that does not collapse when used to draft water from a source that is not already under pressure), foam, light equipment (gloves, hand tools, self-contained breathing apparatus [SCBA]) and heavy equipment (cranes, bulldozers, backhoes). Additional fire apparatus (pumpers and ladder trucks) will
not be the primary need initially, but will still prove useful as extra-regional strike teams arrive.
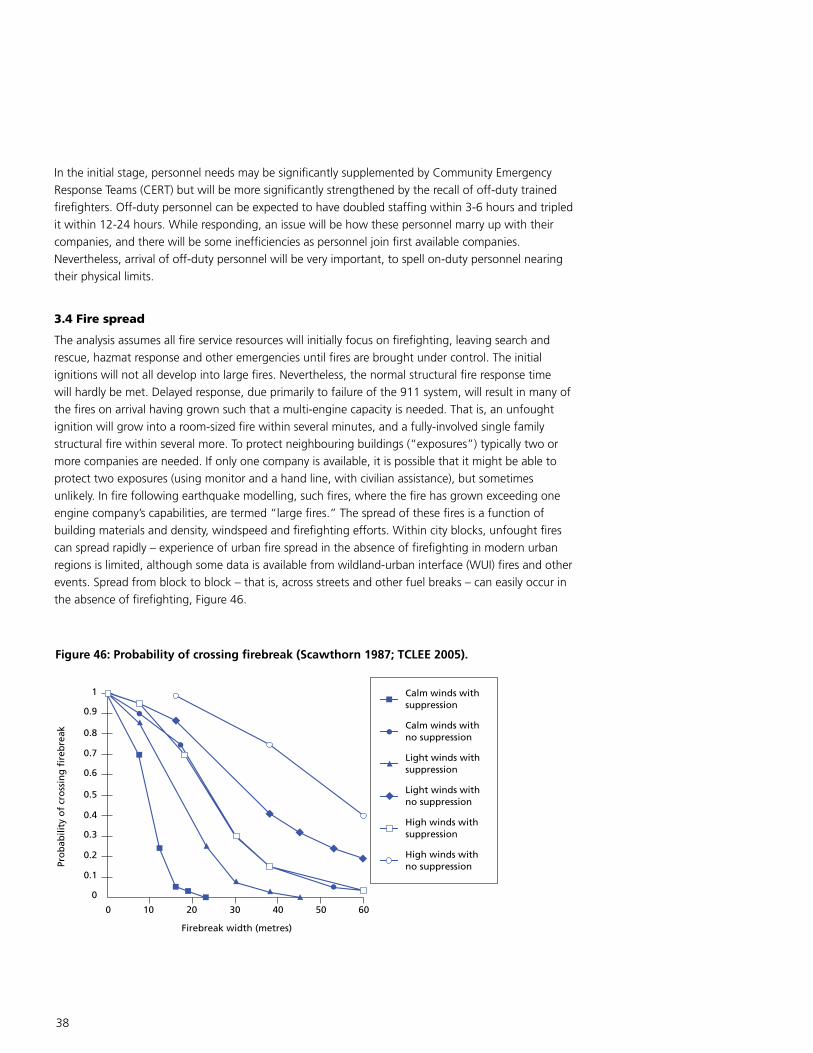
38
In the initial stage, personnel needs may be significantly supplemented by Community Emergency
Response Teams (CERT) but will be more significantly strengthened by the recall of off-duty trained
firefighters. Off-duty personnel can be expected to have doubled staffing within 3-6 hours and tripled
it within 12-24 hours. While responding, an issue will be how these personnel marry up with their
companies, and there will be some inefficiencies as personnel join first available companies.
Nevertheless, arrival of off-duty personnel will be very important, to spell on-duty personnel nearing
their physical limits.
3.4 Fire spread
The analysis assumes all fire service resources will initially focus on firefighting, leaving search and
rescue, hazmat response and other emergencies until fires are brought under control. The initial
ignitions will not all develop into large fires. Nevertheless, the normal structural fire response time
will hardly be met. Delayed response, due primarily to failure of the 911 system, will result in many of
the fires on arrival having grown such that a multi-engine capacity is needed. That is, an unfought
ignition will grow into a room-sized fire within several minutes, and a fully-involved single family
structural fire within several more. To protect neighbouring buildings (“exposures”) typically two or
more companies are needed. If only one company is available, it is possible that it might be able to
protect two exposures (using monitor and a hand line, with civilian assistance), but sometimes
unlikely. In fire following earthquake modelling, such fires, where the fire has grown exceeding one
engine company’s capabilities, are termed “large fires.” The spread of these fires is a function of
building materials and density, windspeed and firefighting efforts. Within city blocks, unfought fires
can spread rapidly – experience of urban fire spread in the absence of firefighting in modern urban
regions is limited, although some data is available from wildland-urban interface (WUI) fires and other
events. Spread from block to block – that is, across streets and other fuel breaks – can easily occur in
the absence of firefighting, Figure 46.
0
0 10
Firebreak width (metres)
20 30 40 50 60
Calm winds withsuppression
0.1
Pro
bab
ility
of
cro
ssin
g f
ireb
reak
0.2
0.3
0.4
0.5
0.6
0.7
0.8
0.9
1
Calm winds withno suppression
Light winds withsuppression
Light winds withno suppression
High winds withsuppression
High winds withno suppression
Figure 46: Probability of crossing firebreak (Scawthorn 1987; TCLEE 2005).

39
3.5 Lifelines
The performance of infrastructure or “lifelines,” such as water supply, gas integrity, electric power,
communications and transportation, is integral to the fire-following-earthquake process and is briefly
discussed here.
3.5.1 Water supply
Water supply systems have been discussed above and will be severely impacted by the scenario
events. Water supply is the sum of at minimum two sources: fire hydrants typically supplied by the
buried potable water distribution network and, if this source should fail, then from alternative water
sources (defined via AWSF, discussed above). Using methods in (Porter 2018), median estimates of
the number of buried pipe repairs in the study area were found to be as high as 15,000, the precise
number and location depending on the scenario event. Repairs in this case means leaks as well as
breaks – the general rule is about 20% of repairs are full breaks. Based on this data, the scenario
events severely impact the normal water supply in the study area, causing a lack of normal water
supply (“serviceability”), where serviceability is the probability of required flow actually being
delivered after the earthquake (Markov, Grigoriu and O’Rourke 1994; Porter 2018). Without normal
water, firefighters will have to resort to AWS as discussed above. Combining the effects of degraded
serviceability and the accessibility of AWS, this study characterizes the resulting availability of water in
each grid cell by a factor termed the Water Supply Factor (WSF) where a WSF of 1.0 means an
adequate (i.e., good) supply of water, and a WSF of zero means no water. The pattern of WSF for
one realization of EQ4, Mw 7.3 Georgia Strait is shown in Figure 47.
Figure 47: Water Supply Factor (WSF) for one realization of EQ4, Mw 7.3 Georgia Strait (effectively, likelihood of water at a fire considering buried pipe network and accessibility of AWS).
ICLR Lower mainland FFE – SPA Risk
WSF (Serviceability)
<0.1
0.1…0.2
0.2…0.3
0.3…0.4
0.4…0.5
0.5…0.6
0.6…0.7
0.7…0.8
0.8…0.9
>0.9
40
3.5.2 Gas and liquid fuels
As discussed earlier, Vancouver and portions of the neighbouring communities are served by a buried
gas distribution network. Gas distribution-related ignitions typically account for about 25% of the
total number of fire-following-earthquake ignitions (Scawthorn, Cowell and Borden 1997) and are
accounted for in this study. Breaks and ignitions of gas and liquid fuel transmission lines are not
accounted for in this study.
3.5.3 Communications
Communications systems, particularly telephone, will sustain some damage but not enough to reduce
functionality following the scenario event. However, saturation, especially of the 911 system, will reduce
functionality to a great degree, for several hours or more. This lack of telephone reporting will result in
delayed reports of fires, with consequences as discussed above.
3.5.4 Transportation
The transportation system most relevant to fire following earthquake is the road network, which is most
vulnerable at bridge crossings. Local and highway networks are typically sufficiently dense that redundant
pathways exist within the region such that emergency services will probably not be greatly impeded.
Mutual aid arriving from outside the study area, however, may be delayed due to traffic disruption,
particularly at water crossings. Another issue is winter conditions – Vancouver suffers occasional severe
snowstorms – the effect of these on response is complex and has not been considered.
3.6 Regional response
There is a large number of fire agencies within a few hours of Vancouver that can be assumed to be
sending fire companies within 12 hours or less. However, in our analysis and in the immediate post-
earthquake period, mutual aid will be largely ineffective, due to the following factors:
• Delayed time to fire scene
• Fire departments in the study area will husband resources and not be able to respond quickly.
• Mutual aid will have to come from further afield in the Lower Mainland, requiring at least
several hours. If arriving at night in blackout conditions (due to wide scale failure of electric
power), response will be further retarded.
• Water shortages
• Water tanker truck refills will be at some distance from fires, resulting in delays. However,
VFRS in particular is well-equipped with fireboats, hose tenders, hose reels, a HydroSub® and,
above all else, the DFPS, so at least the city of Vancouver will be better served.
• Aerial attack – effectiveness of aerial attack in urban areas is currently unclear.
• Foam is a “force-multiplier,” greatly increasing the effectiveness of a hose stream. However,
current local fire-department supplies of foam are limited.
• Access
• The Fraser and other rivers are all barriers if bridges are impassable, which they will be at least
initially due to the need to inspect for damage.

41
4. Findings
4.1 Final burnt area and loss
The above methods and data have been employed to estimate ignitions, fire agency response,
fire spread and final burnt area and losses for the five scenario events. To account for uncertainty,
100 trials were run for each scenario, with results presented below.
4.1.1 EQ1 Mw 9.0 CSZ
As seen above, the ground motions for the Cascadia Subduction Zone event are relatively modest
and result in, on average for the 1,000 realizations, about 15 ignitions with a distribution as shown
in Figure 48, with typically one or less of these becoming large fires – if so, primarily due to lack of
water for firefighting. The mean loss for this event is $162 million, with a distribution as shown in
Figure 49 and Figure 50.
Figure 48: EQ1 distribution of mean ignitions per FRA, entire study area.
Figure 49: EQ1 distribution of mean losses (in billions $) per FRA, entire study area.
ICLR Lower mainland FFE – SPA Risk
Results per FRA
Areas: EQ1 Ignitions<0.02
0.02…0.05
0.05…0.1
0.1…0.2
0.2…0.5
0.5…1
1…2
2…5
5…10
>10
Results per FRA
Areas: EQ1 Loss<0.01
0.01…0.02
0.02…0.05
0.05…0.1
0.1…0.2
0.2…0.5
0.5…1
1…2
2…5
>5
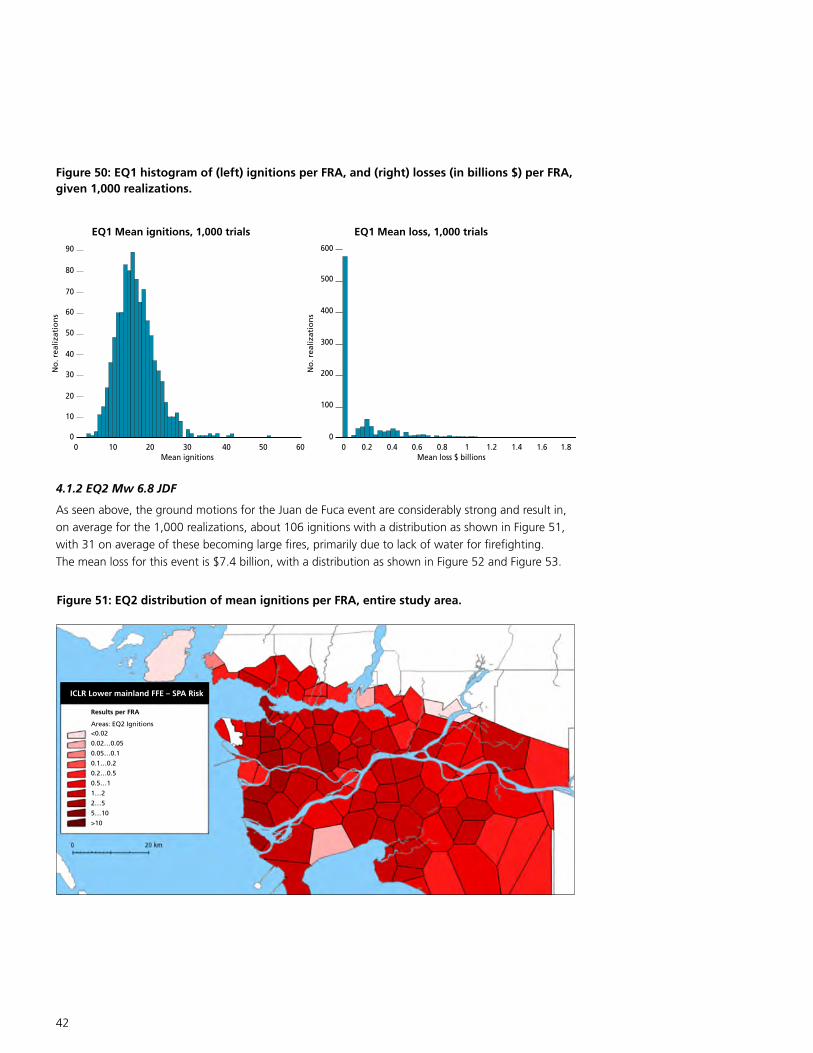
42
70
80
90
60
50
40
30
20
10
00 10 20 30 40 50 60
Mean ignitions
No
. rea
lizat
ion
s
600
500
400
300
200
100
00 0.2 0.4 0.6 0.8 1 1.2 1.4 1.6 1.8
Mean loss $ billions
No
. rea
lizat
ion
s
Figure 50: EQ1 histogram of (left) ignitions per FRA, and (right) losses (in billions $) per FRA, given 1,000 realizations.
EQ1 Mean ignitions, 1,000 trials EQ1 Mean loss, 1,000 trials
4.1.2 EQ2 Mw 6.8 JDF
As seen above, the ground motions for the Juan de Fuca event are considerably strong and result in,
on average for the 1,000 realizations, about 106 ignitions with a distribution as shown in Figure 51,
with 31 on average of these becoming large fires, primarily due to lack of water for firefighting.
The mean loss for this event is $7.4 billion, with a distribution as shown in Figure 52 and Figure 53.
Figure 51: EQ2 distribution of mean ignitions per FRA, entire study area.
ICLR Lower mainland FFE – SPA Risk
Results per FRA
Areas: EQ2 Ignitions<0.02
0.02…0.05
0.05…0.1
0.1…0.2
0.2…0.5
0.5…1
1…2
2…5
5…10
>10

43
Figure 52: EQ2 distribution of mean losses (in billions $) per FRA, entire study area.
Results per FRA
Areas: EQ2 Loss<0.01
0.01…0.02
0.02…0.05
0.05…0.1
0.1…0.2
0.2…0.5
0.5…1
1…2
2…5
>5
Figure 53: EQ2 histogram of (left) ignitions per FRA, and (right) losses (in billions $) per FRA, given 1,000 realizations.
70
80
60
50
40
30
20
10
050 100 150 200
Mean ignitions
No
. rea
lizat
ion
s
60
50
40
30
20
10
03 4 5 6 7 8 9 10 11 12
Mean loss $ billions
No
. rea
lizat
ion
s
EQ2 Mean ignitions, 1,000 trials EQ2 Mean loss, 1,000 trials
4.1.3 EQ3 Mw 7.3 LRDM
As seen above, the ground motions for the LRDM event are almost nil and result in, on average for
the 1,000 realizations, only a few ignitions typically being dealt with and resulting in no large fires.
The mean loss for this event is negligible. Given the low level of these losses, no figures are provided.
ICLR Lower mainland FFE – SPA Risk

44
4.1.4 EQ4 Mw 7.3 GS
As seen above, the ground motions for the Georgia Strait event are very strong, it having an
epicentre very close to downtown Vancouver, and result in, on average for the 1,000 realizations,
over 200 ignitions with a distribution as shown in Figure 54, with about 50 of these becoming large
fires, primarily due to lack of water for firefighting, as well as there being simply too few firefighters
and apparatus. The mean loss for this event is $10.7 billion, with a distribution as shown in Figure 55
and Figure 56.
Figure 54: EQ4 distribution of mean ignitions per FRA, entire study area.
ICLR Lower mainland FFE – SPA Risk
Results per FRA
Areas: EQ4 Ignitions<0.02
0.02…0.05
0.05…0.1
0.1…0.2
0.2…0.5
0.5…1
1…2
2…5
5…10
>10
Figure 55: EQ4 distribution of mean losses (in billions $) per FRA, entire study area.
Results per FRA
Areas: EQ4 Loss<0.01
0.01…0.02
0.02…0.05
0.05…0.1
0.1…0.2
0.2…0.5
0.5…1
1…2
2…5
>5
ICLR Lower mainland FFE – SPA Risk
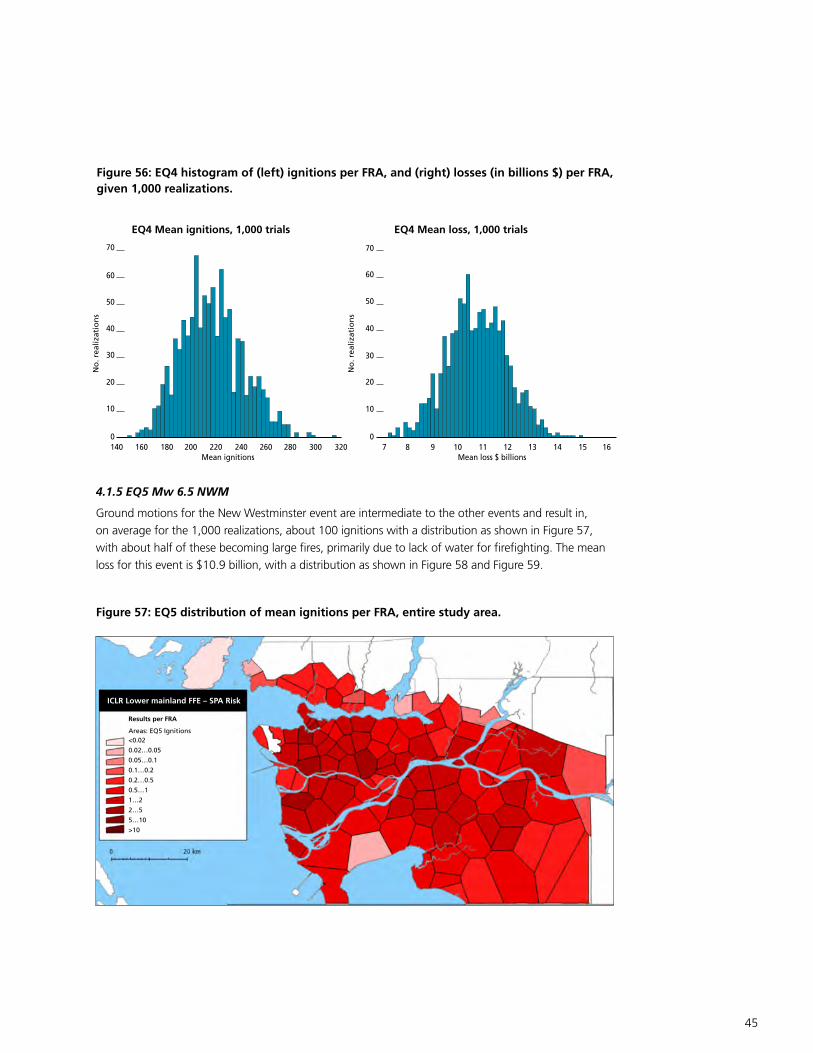
45
Figure 56: EQ4 histogram of (left) ignitions per FRA, and (right) losses (in billions $) per FRA, given 1,000 realizations.
70
60
50
40
30
20
10
0140 160 180 200 220 240 260 280 300 320
Mean ignitions
No
. rea
lizat
ion
s
70
60
50
40
30
20
10
07 8 9 10 11 12 13 14 15 16
Mean loss $ billions
No
. rea
lizat
ion
s
EQ4 Mean ignitions, 1,000 trials EQ4 Mean loss, 1,000 trials
4.1.5 EQ5 Mw 6.5 NWM
Ground motions for the New Westminster event are intermediate to the other events and result in,
on average for the 1,000 realizations, about 100 ignitions with a distribution as shown in Figure 57,
with about half of these becoming large fires, primarily due to lack of water for firefighting. The mean
loss for this event is $10.9 billion, with a distribution as shown in Figure 58 and Figure 59.
Figure 57: EQ5 distribution of mean ignitions per FRA, entire study area.
ICLR Lower mainland FFE – SPA Risk
Results per FRA
Areas: EQ5 Ignitions<0.02
0.02…0.05
0.05…0.1
0.1…0.2
0.2…0.5
0.5…1
1…2
2…5
5…10
>10

46
Figure 58: EQ5 distribution of mean losses (in billions $) per FRA, entire study area.
Results per FRA
Areas: EQ5 Loss<0.01
0.01…0.02
0.02…0.05
0.05…0.1
0.1…0.2
0.2…0.5
0.5…1
1…2
2…5
>5
ICLR Lower mainland FFE – SPA Risk
Figure 59: EQ5 histogram of (left) ignitions per FRA, and (right) losses (in billions $) per FRA, given 1,000 realizations.
70
60
50
40
30
20
10
040 60 80 100 120 140 160
Mean ignitions
No
. rea
lizat
ion
s
60
50
40
30
20
10
02 4 6 8 10 12 14
Mean loss $ billions
No
. rea
lizat
ion
s
EQ5 Mean ignitions, 1,000 trials EQ5 Mean loss, 1,000 trials

47
4.2 Summary of all scenario events
Median loss results for all scenarios are presented in Table 10 and Figure 60. Financial loss (total value
of structural, non-structural components and contents) varies from nil to $10 billion, depending on
the scenario.
Table 10: Median results by scenario.
Figure 60: Lower Mainland fire following earthquake scenario losses, plotted in ascending order.
ScenarioEQ1 Mw
9.0 CSZ
EQ2 Mw
6.8 JDF
EQ3 Mw
7.3 LRDM
EQ4 Mw
7.3 GS
EQ5 Mw
6.5 NWM
Mean ignitions 16 106 4 216 93
Mean no. large fires 0.6 31 0.02 47 29
Mean losses in billions $ $0.16 $7.4 $0.01 $10.7 $7.2
200
250
Ign
itio
ns
and
larg
e fi
res
Loss
$ b
illio
ns
LRDM CSZ NWM JDF GS
150
100
50
0 S–
S2
S4
S6
S8
S10
S12
Ignitions Large fires Loss
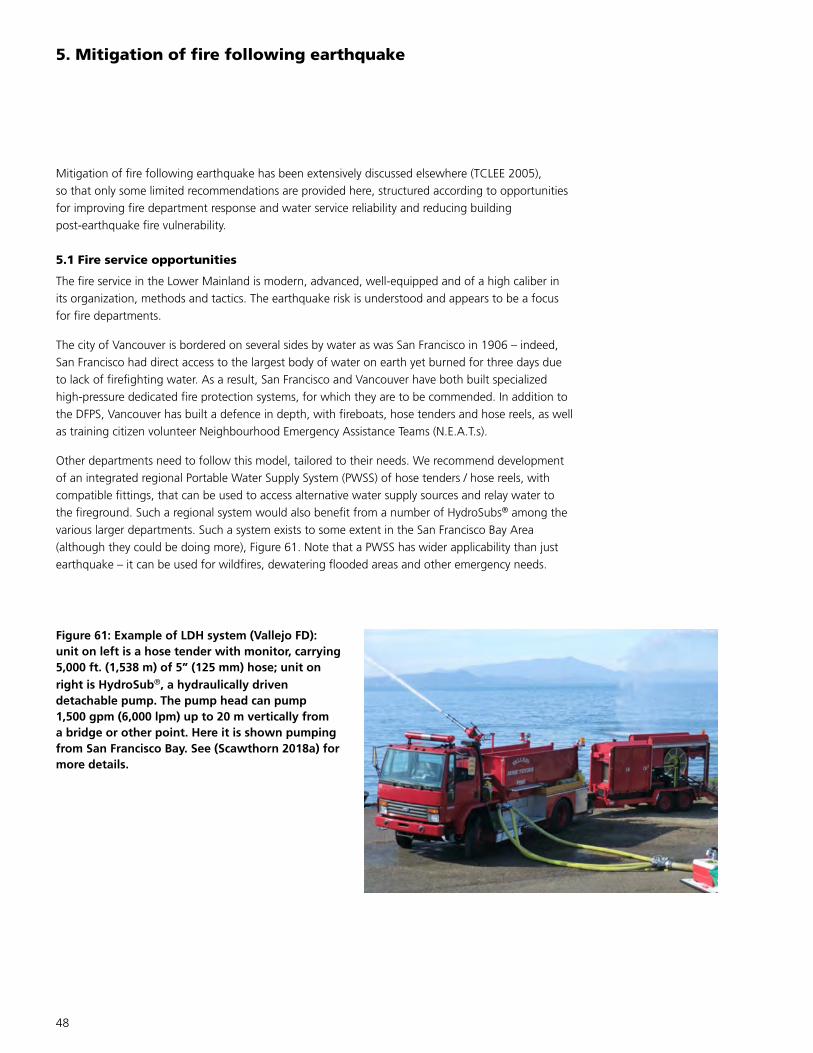
48
5. Mitigation of fire following earthquake
Mitigation of fire following earthquake has been extensively discussed elsewhere (TCLEE 2005),
so that only some limited recommendations are provided here, structured according to opportunities
for improving fire department response and water service reliability and reducing building
post-earthquake fire vulnerability.
5.1 Fire service opportunities
The fire service in the Lower Mainland is modern, advanced, well-equipped and of a high caliber in
its organization, methods and tactics. The earthquake risk is understood and appears to be a focus
for fire departments.
The city of Vancouver is bordered on several sides by water as was San Francisco in 1906 – indeed,
San Francisco had direct access to the largest body of water on earth yet burned for three days due
to lack of firefighting water. As a result, San Francisco and Vancouver have both built specialized
high-pressure dedicated fire protection systems, for which they are to be commended. In addition to
the DFPS, Vancouver has built a defence in depth, with fireboats, hose tenders and hose reels, as well
as training citizen volunteer Neighbourhood Emergency Assistance Teams (N.E.A.T.s).
Other departments need to follow this model, tailored to their needs. We recommend development
of an integrated regional Portable Water Supply System (PWSS) of hose tenders / hose reels, with
compatible fittings, that can be used to access alternative water supply sources and relay water to
the fireground. Such a regional system would also benefit from a number of HydroSubs® among the
various larger departments. Such a system exists to some extent in the San Francisco Bay Area
(although they could be doing more), Figure 61. Note that a PWSS has wider applicability than just
earthquake – it can be used for wildfires, dewatering flooded areas and other emergency needs.
Figure 61: Example of LDH system (Vallejo FD): unit on left is a hose tender with monitor, carrying 5,000 ft. (1,538 m) of 5” (125 mm) hose; unit on right is HydroSub®, a hydraulically driven detachable pump. The pump head can pump 1,500 gpm (6,000 lpm) up to 20 m vertically from a bridge or other point. Here it is shown pumping from San Francisco Bay. See (Scawthorn 2018a) for more details.
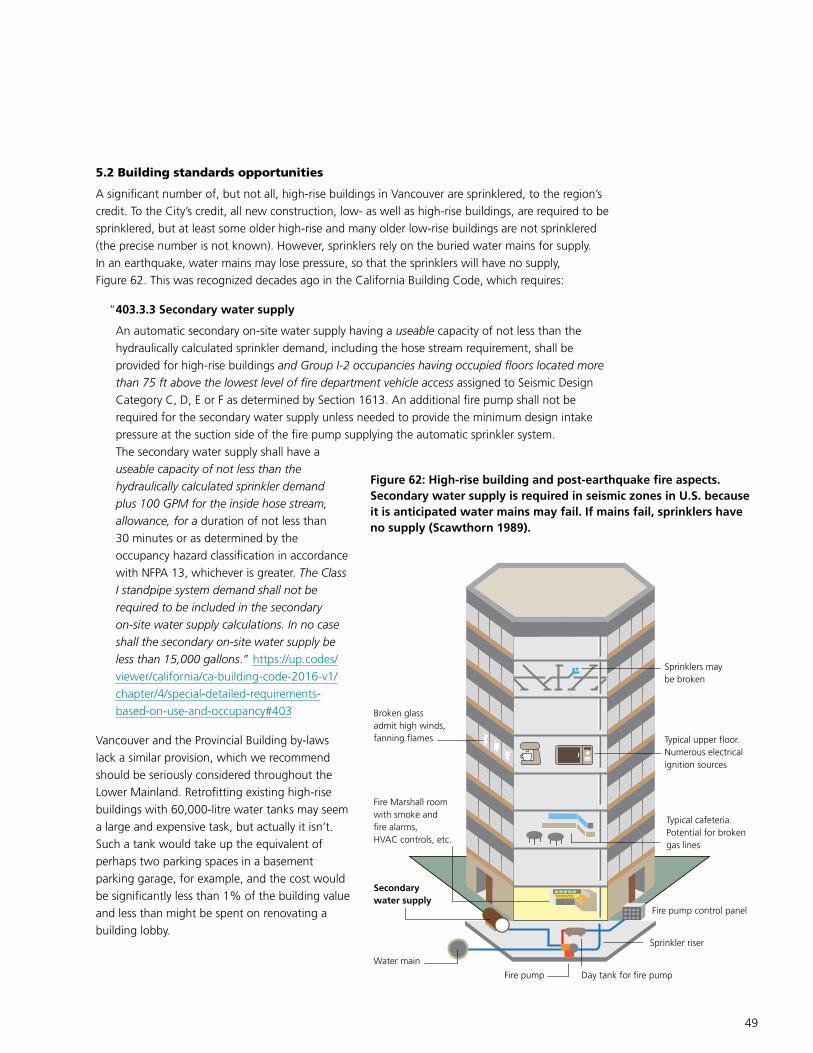
49
5.2 Building standards opportunities
A significant number of, but not all, high-rise buildings in Vancouver are sprinklered, to the region’s
credit. To the City’s credit, all new construction, low- as well as high-rise buildings, are required to be
sprinklered, but at least some older high-rise and many older low-rise buildings are not sprinklered
(the precise number is not known). However, sprinklers rely on the buried water mains for supply.
In an earthquake, water mains may lose pressure, so that the sprinklers will have no supply,
Figure 62. This was recognized decades ago in the California Building Code, which requires:
“403.3.3 Secondary water supply
An automatic secondary on-site water supply having a useable capacity of not less than the
hydraulically calculated sprinkler demand, including the hose stream requirement, shall be
provided for high-rise buildings and Group I-2 occupancies having occupied floors located more
than 75 ft above the lowest level of fire department vehicle access assigned to Seismic Design
Category C, D, E or F as determined by Section 1613. An additional fire pump shall not be
required for the secondary water supply unless needed to provide the minimum design intake
pressure at the suction side of the fire pump supplying the automatic sprinkler system.
The secondary water supply shall have a
useable capacity of not less than the
hydraulically calculated sprinkler demand
plus 100 GPM for the inside hose stream,
allowance, for a duration of not less than
30 minutes or as determined by the
occupancy hazard classification in accordance
with NFPA 13, whichever is greater. The Class
I standpipe system demand shall not be
required to be included in the secondary
on-site water supply calculations. In no case
shall the secondary on-site water supply be
less than 15,000 gallons.” https://up.codes/
viewer/california/ca-building-code-2016-v1/
chapter/4/special-detailed-requirements-
based-on-use-and-occupancy#403
Vancouver and the Provincial Building by-laws
lack a similar provision, which we recommend
should be seriously considered throughout the
Lower Mainland. Retrofitting existing high-rise
buildings with 60,000-litre water tanks may seem
a large and expensive task, but actually it isn’t.
Such a tank would take up the equivalent of
perhaps two parking spaces in a basement
parking garage, for example, and the cost would
be significantly less than 1% of the building value
and less than might be spent on renovating a
building lobby.
Broken glassadmit high winds,fanning flames
Fire Marshall roomwith smoke and fire alarms,HVAC controls, etc.
Secondarywater supply
Water main
Fire pump Day tank for fire pump
Sprinkler riser
Fire pump control panel
Typical cafeteria.Potential for brokengas lines
Typical upper floor.Numerous electricalignition sources
Sprinklers maybe broken
Figure 62: High-rise building and post-earthquake fire aspects. Secondary water supply is required in seismic zones in U.S. because it is anticipated water mains may fail. If mains fail, sprinklers have no supply (Scawthorn 1989).

50
5.3 Energy industry
This study did not assess the seismic vulnerability of the gas distribution or other energy industry
assets, many of which are concentrated in the highly liquefiable Fraser River Delta. There is a long
history of major energy facilities being damaged in earthquakes, including by fire, so this aspect
should not be ignored. Additionally, particularly in winter, millions of people are dependent on energy
services. While we didn’t address energy industry aspects, in this respect two actions have been de
rigueur in other regions, and should be considered in the Lower Mainland: (1) a review of the overall
seismic vulnerability and reliability of major energy facilities, Figure 63; (2) a review of the ability to
control and isolate the gas transmission and distribution networks in the event of a major earthquake
and consideration by the gas distribution operator of incorporating an automatic gas shutoff device in
gas meters.
Figure 63: Selected Lower Mainland large energy facilities.
Regarding the gas transmission and distribution networks, there are two levels of control that might be
considered: (a) “block” control, and (b) individual meter shutoff devices.
Block control consists of sub-dividing the network into a number of blocks, each of which can be
monitored for seismic intensity and automatically or remotely isolated if the intensity exceeds a
threshold. Such systems have been employed by Tokyo Gas and other utilities in Japan for decades and
function well (Katayama, Sato and Saito 1988), Figure 64.
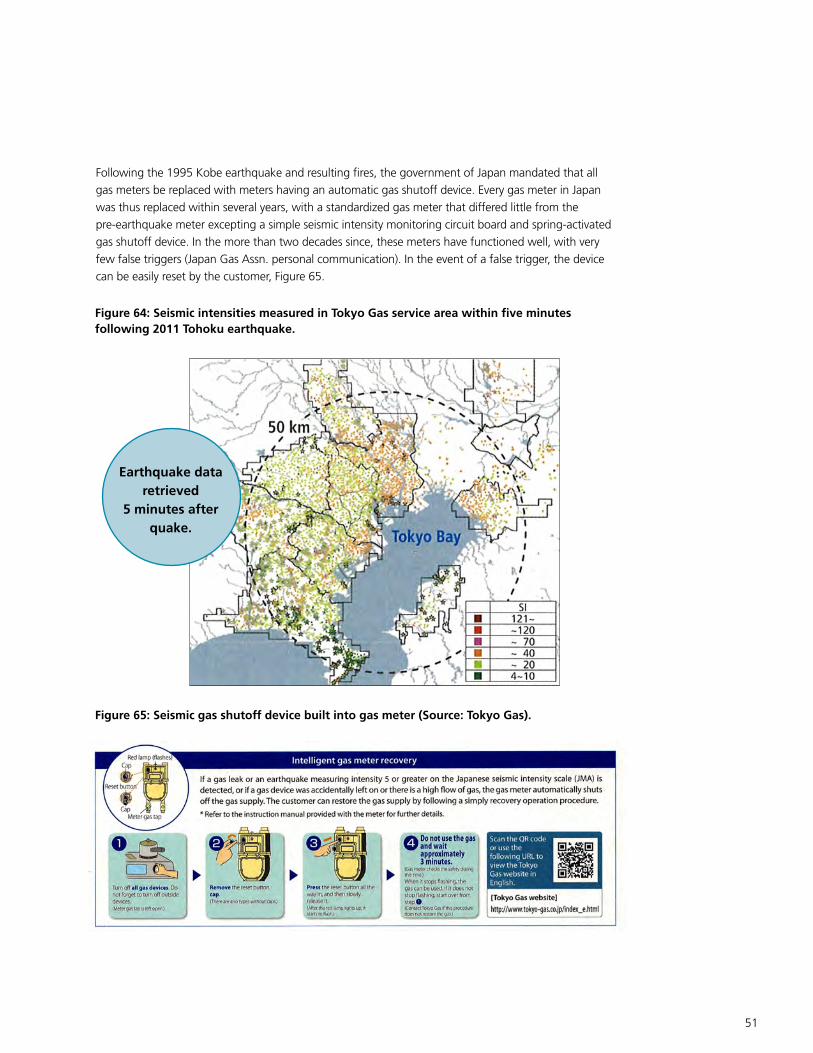
51
Following the 1995 Kobe earthquake and resulting fires, the government of Japan mandated that all
gas meters be replaced with meters having an automatic gas shutoff device. Every gas meter in Japan
was thus replaced within several years, with a standardized gas meter that differed little from the
pre-earthquake meter excepting a simple seismic intensity monitoring circuit board and spring-activated
gas shutoff device. In the more than two decades since, these meters have functioned well, with very
few false triggers (Japan Gas Assn. personal communication). In the event of a false trigger, the device
can be easily reset by the customer, Figure 65.
Figure 64: Seismic intensities measured in Tokyo Gas service area within five minutes following 2011 Tohoku earthquake.
Figure 65: Seismic gas shutoff device built into gas meter (Source: Tokyo Gas).
Earthquake data retrieved
5 minutes after quake.
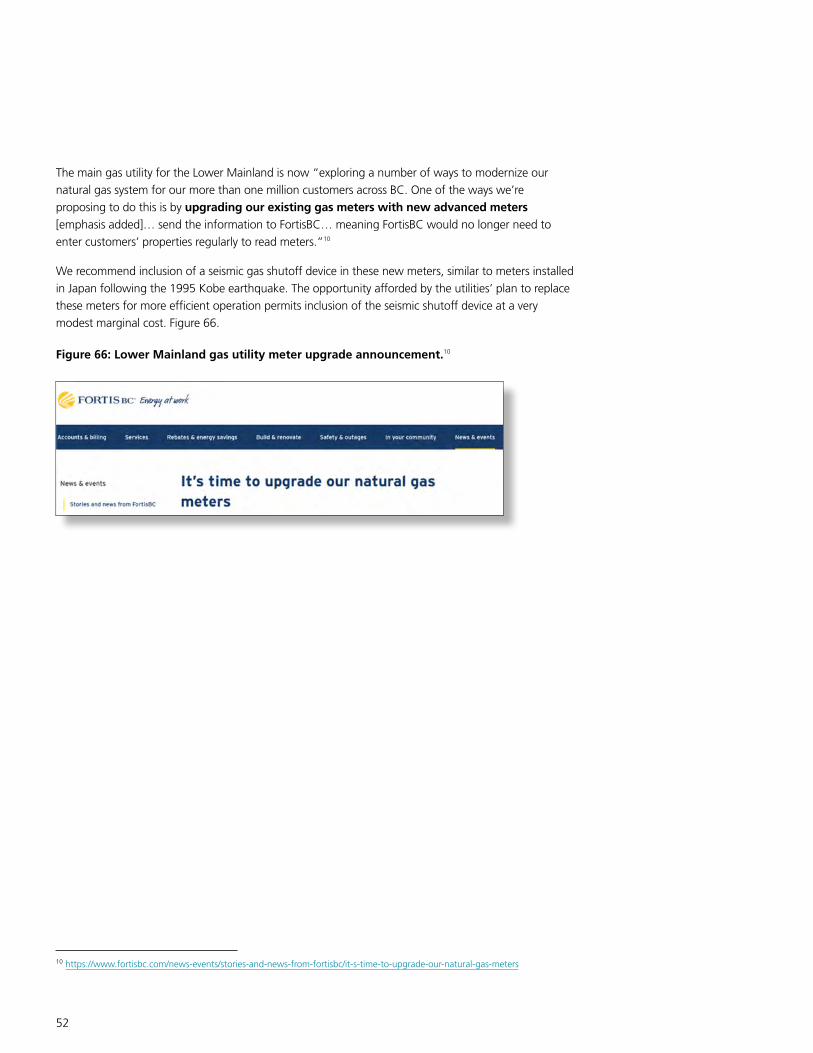
52
The main gas utility for the Lower Mainland is now “exploring a number of ways to modernize our
natural gas system for our more than one million customers across BC. One of the ways we’re
proposing to do this is by upgrading our existing gas meters with new advanced meters
[emphasis added]… send the information to FortisBC… meaning FortisBC would no longer need to
enter customers’ properties regularly to read meters.”10
We recommend inclusion of a seismic gas shutoff device in these new meters, similar to meters installed
in Japan following the 1995 Kobe earthquake. The opportunity afforded by the utilities’ plan to replace
these meters for more efficient operation permits inclusion of the seismic shutoff device at a very
modest marginal cost. Figure 66.
10 https://www.fortisbc.com/news-events/stories-and-news-from-fortisbc/it-s-time-to-upgrade-our-natural-gas-meters
Figure 66: Lower Mainland gas utility meter upgrade announcement.10
53
6. Concluding remarks
The Geological Survey of Canada assesses the Vancouver region as having significant earthquake
hazard and potential for ground motions that will cause significant damage to ordinary buildings and
infrastructure. The region suffered a magnitude 9.0 earthquake in 1700 on the Cascadia Subduction
Zone, which is considered likely to re-occur in the near future.
Earthquakes are sometimes followed by major fires, whose damage can greatly exceed the shaking
damage. To assess the risk of fire following earthquake and identify opportunities to reduce the risk,
ground motions for five scenario events – two distant events: a Mw 9.0 CSZ event and a relatively
distant Mw 7.3 event on the island of Vancouver; and three relatively nearby events: a deep in-slab
event on the subducting Juan de Fuca Plate, a Mw 7.3 event in the Georgia Strait just to the west of
the city of Vancouver, and a Mw 6.5 shallow crustal event centred on the city of New Westminster.
Accounting for fire department response, water system damage, weather and other conditions,
the growth and ultimate final burnt area of fires are estimated to result in median losses from nil to
$10 billion. These are median estimates – there are significant probabilities of greater or less damage,
and the range is a function of the specific earthquake scenario (i.e., location and magnitude), time of
day, weather and other factors.
This loss would be virtually fully insured and would have a very significant impact on the Canadian
insurance industry. Fire losses would come on top of shaking and other losses, which would be
insured to a lesser extent. A leading global reinsurer has stated that losses of this magnitude would
likely result in failure of some insurers, would entail secondary and contingent losses, and could
conceivably lead to financial contagion.
This risk need not be tolerated and indeed the Province of British Columbia, City of Vancouver, and
regional agencies such as Metro Vancouver and BC Hydro have implemented excellent programs
to reduce this risk. Further actions, however, can still be taken to reduce the risk of fire damage.
The potential loss involved represents a local, provincial and national threat that all involved in have
worked to reduce, but more still needs to be done.
This study was aided by many persons in the region – we met with a number of fire, water, city
and emergency planning and other officials, whose assistance was generously provided and is
gratefully appreciated.

54
Abrahamson, Norman A, Walter J Silva, and Ronnie Kamai. 2014. “Summary of the ASK14 ground motion
relation for active crustal regions.” Earthquake Spectra 30(3):1025-55.
Abrahamson, Norman, Nicholas Gregor, and Kofi Addo. 2016. “BC Hydro Ground Motion Prediction
Equations For Subduction Earthquakes.” Earthquake Spectra 32(1):23-44.
Adams, John, Trevor Allen, Stephen Halchuk, and Michal Kolaj. 2019. “Canada’s 6th Generation Seismic
Hazard Model, as Prepared for the 2020 National Building Code of Canada.” 8 pp. in 12th Canadian Conference on Earthquake Engineering. Quebec City.
AIR Worldwide. 2013. “Study of Impact and the Insurance and Economic Cost of a Major Earthquake in
British Columbia and Ontario/Québec.” 264 pp. Boston: Commissioned by the Insurance Bureau
of Canada.
Armstrong, J. E., Hicock, S.R. 1979 “Surficial Geology, Vancouver, British Columbia, “A” Series Map 1486A,
1 sheet, https://doi.org/10.4095/108876 “: Geological Survey of Canada.
Armstrong, John Edward. 1990 Vancouver Geology: Geological Association of Canada, Cordilleran Section.
Atkinson, Gail M., and David M. Boore. 2003. “Empirical Ground-Motion Relations For Subduction-Zone
Earthquakes And Their Application To Cascadia And Other Regions.” Bulletin of the Seismological Society of America 93(4):1703-29.
Boore, David M, Jonathan P Stewart, Emel Seyhan, and Gail M Atkinson. 2014. “NGA-West2 equations
for predicting PGA, PGV, and 5% damped PSA for shallow crustal earthquakes.” Earthquake Spectra
30(3):1057-85.
Borcherdt, R. D., and J. F. Gibbs. 1976. “Effects Of Local Geological Conditions In The San Francisco Bay
Region On Ground Motions And The Intensities Of The 1906 Earthquake.” Bulletin of the Seismological Society of America 66:467-500.
Campbell, Kenneth W, and Yousef Bozorgnia. 2014. “NGA-West2 ground motion model for the average
horizontal components of PGA, PGV, and 5% damped linear acceleration response spectra.”
Earthquake Spectra 30(3):1087-115.
Chiou, Brian S-J, and Robert R Youngs. 2014. “Update of the Chiou and Youngs NGA model for the
average horizontal component of peak ground motion and response spectra.” Earthquake Spectra
30(3):1117-53.
DHS. 2003. “Multi-Hazard Loss Estimation Methodology, Earthquake Model, Hazus-Mh Mr3 Technical
Manual.” 699 pp. Washington, DC.: Developed by: Department of Homeland Security, Emergency
Preparedness and Response Directorate, FEMA Mitigation Division Washington, D.C. Under a contract
with: National Institute of Building Sciences.
EQE. 2001. “Assessment of Risk due to Fire Following Earthquake, Lower Mainland, British Columbia.”
137 pp. Oakland: EQE International, for the Institute for Catastrophic Loss Reduction, Toronto.
EQE Engineering. 1990. “Emergency Planning Considerations, City of Vancouver Water System Master Plan,
prepared under subcontract to CH2M-Hill, for City Engineering Department, City of Vancouver, B.C.”
Goldfinger, C., C.H. Nelson, A.E. Morey, J.R. Johnson, J. Patton, E. Karabanov, J. Gutierrez-Pastor, A.T.
Eriksson, E. Gracia, G. Dunhill, R.J. Enkin, A. Dallimore, and T. Vallier. 2012. “Turbidite Event
History-Methods And Implications For Holocene Paleoseismicity Of The Cascadia Subduction Zone.”
170 pp. Washington: U.S. Geological Survey Professional Paper 1661-F, available at
http://pubs.usgs.gov/pp/pp1661/f.
References

55
Halchuk, Stephen, John Adams, Michal Kolaj, and Trevor Allen. 2019. “Deaggregation of NBCC 2015
Seismic Hazard for Selected Canadian Cities.” 9 pp. in 12th Canadian Conference on Earthquake Engineering. Quebec City.
Jayaram, Nirmal, and Jack W Baker. 2009. “Correlation model for spatially distributed ground-motion
intensities.” Earthquake Engineering & Structural Dynamics 38(15):1687-708.
Journeay, J.M., Yip, J.Z.K., Wagner, C.L. and Chow, W., …2020. “Urban Risk Models for the Greater
Vancouver Region of Southwest British Columbia: A shared data collection developed by the
Geological Survey of Canada to support disaster risk reduction planning in the Greater Vancouver
region as part of the DRR-Pathways Project. .” Natural Resources Canada.
Katayama, Tsuneo, Nobuhiko Sato, and Kimiraasa Saito. 1988. “SI-sensor for the identification of
destructive earthquake ground motion.” 667-72 pp. in Proceedings of the 9th World Conference on Earthquake Engineering.
Lee, Selina, Rachel Davidson, Norihito Ohnishi, and Charles Scawthorn. 2008. “Fire Following Earthquake –
Reviewing The State-Of-The-Art Of Modeling.” Earthquake Spectra 24(4): 933-67 pp.
Lovett, Richard A. 2010. “Risk of giant quake off American west coast goes up.” Nature Publishing Group.
Markov, I, Mircea Grigoriu, and TD O’Rourke. 1994. “An evaluation of seismic serviceability of water supply
networks with application to the San Francisco auxiliary water supply system.”
Matthews, J. 1960. “The Burning of Vancouver.…” Vancouver Historical Journal. 3:2-70.
National Commission on Fire Prevention and Control. 1973. “America Burning: The Report Of
The National Commission On Fire Prevention And Control.” 191pp: Report to the President of the
United States of America.
NBFU. 1905. “Report Of National Board Of Fire Underwriters By Its Committee Of Twenty On The City Of
San Francisco, Cal., Henry Evans, Chmn.” 64 pp.
NFPA. 1951. Conflagrations In America Since 1900: A Record Of The Principal Conflagrations In The United States And Canada During The First Half Of The Twentieth Century. Quincy, MA: National Fire
Protection Association.
Porter, K.A. 2018. “A new model of water-network resilience, with application to the HayWired scenario.”
in The HayWired earthquake scenario – Engineering Implications: chap. N edited by S.T. Detweiler,
and Wein, A.M.: U.S. Geological Survey Scientific Investigations Report 2017–5013–I–Q.
Robertson, John Nigel, and J Mehaffey. 1998. “Accounting for fire following earthquakes in the
development of performance based building codes.” University of British Columbia.
Scawthorn, C. 1989. “Fire Following Earthquake In High-Rise Buildings.” Council on Tall Buildings and
Urban Habitat, Bethlehem.
—. 2018a. “Fire following the Mw 7.05 HayWired earthquake scenario.” 367-400 pp. in The HayWired Earthquake Scenario – Engineering Implications, edited by Shane T. Detweiler and Anne M. Wein.
Washington: U.S. Geological Survey Scientific Investigations Report 2017–5013–I–Q.
Scawthorn, C., A. D. Cowell, and f. Borden. 1997. “Fire-Related Aspects Of The Northridge Earthquake.”
in Report prepared for the Building and Fire Research Laboratory: National Institute of Standards and
Technology, NIST-GCR-98-743, Gaithersburg MD 20899.
Scawthorn, C., J. M. Eidinger, and A.J. Schiff (Eds.). 2005. Fire Following Earthquake. Reston: American
Society of Civil Engineers.
56
Scawthorn, C., Khater M. 1992. “Fire Following Earthquake – Conflagration Potential In The Greater
Los Angeles San Francisco Seattle And Memphis Areas.” in prepared for the Natural Disaster Coalition by EQE International: San Francisco, CA. [EQE’s study for the Natural Disaster Coalition, Fire Following
Earthquake in the Greater Los Angeles, San Francisco, Seattle and Memphis Areas, is available from the
National Committee on Property Insurance, 75 Tremont Street, Suite 510, Boston, MA 02108-3910,
(617. 722-0200.].
Scawthorn, C., Yamada, Y., and Iemura, H. 1981. “A Model For Urban Postearthquake Fire Hazard.”
Disasters 5(2): pp. 125-32.
Scawthorn, C. 1987. Fire Following Earthquake: Estimates Of The Conflagration Risk To Insured Property In Greater Los Angeles And San Francisco. Oak Brook, Ill.: All-Industry Research Advisory Council.
—. 2018b. “Fire Following the Mw 7.05 Haywired Earthquake Scenario.” 12 pp. in Eleventh U.S. National Conference on Earthquake Engineering – Integrating Science, Engineering & Policy. Los Angeles,
California.
Seed, H.B., and I.M. Idriss. 1982. “Ground Motions and Soil Liquefaction during Earthquakes,
Monogr. 5” Berkeley: Earthquake Engineering Research Institute and the University of California.
SPA Risk. 2009. “Enhancements In Hazus-Mh Fire Following Earthquake, Task 3: Updated Ignition Equation“
74 pp. San Francisco: SPA Risk LLC, Berkeley CA. Principal Investigator C. Scawthorn. Prepared for
PBS&J and the National Institute of Building Sciences.
Tamima, Umma, and Luc Chouinard. 2017. “Systemic Seismic Vulnerability of Transportation Networks and
Emergency Facilities.” Journal of Infrastructure Systems 23(4):04017032.
TCLEE (Ed.). 2005. Fire Following Earthquake. Reston: American Society of Civil Engineers, Technical
Council for Lifeline Earthquake Engineering, Scawthorn et al (eds).
TriData. 2009. “Final Report, Consulting Services for Vancouver Fire and Rescue Services Operations
Review.” 97 pp. Arlington: TriData Division, System Planning Corporation, and Mercury Associates, Inc.
Van Anne, Craig, Charles Scawthorn, Dennis S. Mileti, and Geological survey (U.S.). 1994. The Loma Prieta, California, Earthquake Of October 17, 1989 : Fire, Police, Transportation, And Hazardous Materials. Washington.
Denver, CO: U.S. Geological Survey.
Wells, Donald L., and Kevin J. Coppersmith. 1994. “New Empirical Relationships Among Magnitude,
Rupture Length, Rupture Width, Rupture Area, And Surface Displacement.” Bulletin of the Seismological Society of America 84:974-1002.
Zhao, John X., Jian Zhang, Akihiro Asano, Yuki Ohno, Taishi Oouchi, Toshimasa Takahashi, Hiroshi Ogawa,
Kojiro Irikura, Hong K. Thio, Paul G. Somerville, Yasuhiro Fukushima, and Yoshimitsu Fukushima.
2006. “Attenuation Relations Of Strong Ground Motion In Japan Using Site Classification Based On
Predominant Period.” Bulletin of the Seismological Society of America 96(3):898-913.


www.iclr.org
www.PIEVC.ca
facebook.com/instituteforcatastrophiclossreduction
twitter.com/iclrcanada • twitter.com/citiesadapt
youtube.com/iclrinfo
Search: Institute for Catastrophic Loss Reduction (ICLR)
www.basementfloodreduction.com
www.reduirelesinondationsdesous-sol.com
www.backwatervalveinstallation.com
Toronto Office 20 Richmond Street EastSuite 210Toronto, Ontario, CanadaM5C 2R9
416-364-8677
416-364-5889
London OfficeWestern University Amit Chakma Building, Suite 44051151 Richmond StreetLondon, Ontario, CanadaN6A 5B9
519-661-3234
519-661-4273
Institute for Catastrophic Loss ReductionInstitut de prévention des sinistres catastrophiquesInstitute for Catastrophic Loss Reduction
Institut de prévention des sinistres catastrophiques