prepared for submission to jhep - arxiv.org · prepared for submission to jhep ... t. adam,a n....
TRANSCRIPT

Prepared for submission to JHEP
Measurement of the neutrino velocity with the
OPERA detector in the CNGS beam
T. Adam,a N. Agafonova,b A. Aleksandrov,c,1 O. Altinok,d P. Alvarez Sanchez,e
A. Anokhina,f S. Aoki,g A. Ariga,h T. Ariga,h D. Autiero,i A. Badertscher,j
A. Ben Dhahbi,j A. Bertolin,k C. Bozza,l T. Brugiere,i R. Brugnera,m,k F. Brunet,n
G. Brunetti,o,i,2 S. Buontempo,c B. Carlus,i F. Cavanna,q A. Cazes,i L. Chaussard,i
M. Chernyavsky,r V. Chiarella,s A. Chukanov,t G. Colosimo,u M. Crespi,u N.
D’Ambrosio,v G. De Lellis,w,c M. De Serio,x Y. Declais,i P. del Amo Sanchez,n F. Di
Capua,c A. Di Crescenzo,w,c D. Di Ferdinando,p N. Di Marco,v S. Dmitrievsky,t
M. Dracos,a D. Duchesneau,n S. Dusini,k T. Dzhatdoev,f J. Ebert,y
I. Efthymiopoulos,e O. Egorov,z A. Ereditato,h L.S. Esposito,j J. Favier,n ,T. Ferber,y
R.A. Fini,x T. Fukuda,aa A. Garfagnini,m,k G. Giacomelli,o,p M. Giorgini,o,p,3
M. Giovannozzi,e C. Girerd,i J. Goldberg,ab C. Gollnitz,y D. Golubkov,z
L. Goncharova,r Y. Gornushkin,t G. Grella,l F. Grianti,s,ac E. Gschwendtner,e
C. Guerin,i A.M. Guler,d C. Gustavino,ad C. Hagner,y K. Hamada,ae T. Hara,g
R. Enikeev,b M. Hierholzer,y,2 A. Hollnagel,y M. Ieva,x H. Ishida,aa K. Ishiguro,ae
K. Jakovcic,af C. Jollet,a M. Jones,e F. Juget,h M. Kamiscioglu,d J. Kawada,h
S.H. Kim,ag,4 M. Kimura,aa E. Kiritsis,ah N. Kitagawa,ae B. Klicek,af J. Knuesel,h
K. Kodama,ai M. Komatsu,ae U. Kose,k I. Kreslo,h C. Lazzaro,j J. Lenkeit,y
A. Ljubicic,af A. Longhin,s A. Malgin,b G. Mandrioli,p J. Marteau,i T. Matsuo,aa
V. Matveev,b N. Mauri,s A. Mazzoni,u E. Medinaceli,m,k F. Meisel,h A. Meregaglia,a
P. Migliozzi,c S. Mikado,aa D. Missiaen,e P. Monacelli,q K. Morishima,ae U. Moser,h
M.T. Muciaccia,aj,x N. Naganawa,ae T. Naka,ae M. Nakamura,ae T. Nakano,ae
Y. Nakatsuka,ae D. Naumov,t V. Nikitina,f F. Nitti,ak S. Ogawa,aa N. Okateva,r
A. Olchevsky,t O. Palamara,v A. Paoloni,s B.D. Park,ag,5 I.G. Park,ag A. Pastore,aj,x
L. Patrizii ,p,∗ E. Pennacchio,i H. Pessard,n C. Pistillo,h N. Polukhina,r M. Pozzato,o,p
K. Pretzl,h F. Pupilli,v R. Rescigno,l F. Riguzzi,al T. Roganova,f H. Rokujo,g
G. Rosa,am,ad I. Rostovtseva,z A. Rubbia,j A. Russo,c V. Ryasny,b O. Ryazhskaya,b
O. Sato,ae Y. Sato,an Z. Sahnoun,p,6 A. Schembri,v J. Schuler,a L. Scotto Lavina,h,7
J. Serrano,e I. Shakiryanova,b A. Sheshukov,t H. Shibuya,aa G. Shoziyoev,f
S. Simone,aj,x M. Sioli,o,p C. Sirignano,m,k G. Sirri,p J.S. Song,ag M. Spinetti,s
L. Stanco,k N. Starkov,r S. Stellacci,l M. Stipcevic,af T. Strauss,h S. Takahashi,g
M. Tenti,o,p,i F. Terranova,s,ao I. Tezuka,an V. Tioukov,c P. Tolun,d N.T. Tran,ii
S. Tufanli,h P. Vilain,ap M. Vladimirov,r L. Votano,s J.-L. Vuilleumier,h G. Wilquet,ap
B. Wonsak,y J. Wurtz,a V. Yakushev,b C.S. Yoon,ag J. Yoshida,ae Y. Zaitsev,z
S. Zemskova,t A. Zghichen
*Corresponding author: [email protected]
arX
iv:1
109.
4897
v4 [
hep-
ex]
12
Jul 2
012
aIPHC, Universite de Strasbourg, CNRS/IN2P3, F-67037 Strasbourg, FrancebINR-Institute for Nuclear Research of the Russian Academy of Sciences, RUS-327312 Moscow,
RussiacINFN Sezione di Napoli, I-80125 Napoli, ItalydMETU-Middle East Technical University, TR-06532 Ankara, TurkeyeEuropean Organization for Nuclear Research (CERN), Geneva, Switzerlandf (MSU SINP) Lomonosov Moscow State University Skobeltsyn Institute of Nuclear Physics, RUS-
119992 Moscow, RussiagKobe University, J-657-8501 Kobe, JapanhAlbert Einstein Center for Fundamental Physics, Laboratory for High Energy Physics (LHEP),
University of Bern, CH-3012 Bern, SwitzerlandiIPNL, Universite Claude Bernard Lyon I, CNRS/IN2P3, F-69622 Villeurbanne, FrancejETH Zurich, Institute for Particle Physics, CH-8093 Zurich, SwitzerlandkINFN Sezione di Padova, I-35131 Padova, ItalylDipartimento di Fisica dell’Universita di Salerno and INFN ”Gruppo Collegato di Salerno”, I-
84084 Fisciano, Salerno, ItalymDipartimento di Fisica dell’Universita di Padova, 35131 I-Padova, ItalynLAPP, Universite de Savoie, CNRS/IN2P3, F-74941 Annecy-le-Vieux, FranceoDipartimento di Fisica dell’Universita di Bologna, I-40127 Bologna, ItalypINFN Sezione di Bologna, I-40127 Bologna, ItalyqDipartimento di Fisica dell’Universita dell’Aquila and INFN ”Gruppo Collegato de L’Aquila”,
I-67100 L’Aquila, ItalyrLPI-Lebedev Physical Institute of the Russian Academy of Science, RUS-119991 Moscow, RussiasINFN - Laboratori Nazionali di Frascati, I-00044 Frascati (Roma), ItalytJINR-Joint Institute for Nuclear Research, RUS-141980 Dubna, RussiauArea di Geodesia e Geomatica, Dipartimento di Ingegneria Civile Edile e Ambientale dell’Universita
di Roma Sapienza, I-00185 Roma, ItalyvINFN - Laboratori Nazionali del Gran Sasso, I-67010 Assergi (L’Aquila), ItalywDipartimento di Scienze Fisiche dell’Universita Federico II di Napoli, I-80125 Napoli, ItalyxINFN Sezione di Bari, I-70126 Bari, ItalyyHamburg University, D-22761 Hamburg, GermanyzITEP-Institute for Theoretical and Experimental Physics RUS-117259 Moscow, RussiaaaToho University, J-274-8510 Funabashi, JapanabDepartment of Physics, Technion, IL-32000 Haifa, IsraelacUniversita degli Studi di Urbino ”Carlo Bo”, I-61029 Urbino - ItalyadINFN Sezione di Roma , I-00185 Roma, ItalyaeNagoya University, J-464-8602 Nagoya, Japanaf IRB-Rudjer Boskovic Institute, HR-10002 Zagreb, CroatiaagGyeongsang National University, ROK-900 Gazwa-dong, Jinju 660-701, KoreaahCrete Center for Theoretical Physics, Department of Physics, University of Crete, GR-71003
Heraklion, GreeceaiAichi University of Education, J-448-8542 Kariya (Aichi-Ken), JapanajDipartimento di Fisica dell’Universita di Bari, I-70126 Bari, ItalyakTheory Division APC, Universite Paris 7, Batiment Condorcet, F-75205, Paris Cedex 13, France

alIstituto Nazionale di Geofisica e Vulcanologia, Sez. CNT, I-00143 Roma, ItalyamDipartimento di Fisica dell’Universita di Roma Sapienza, I-00185 Roma, ItalyanUtsunomiya University, J-321-8505 Utsunomiya, JapanaoDipartimento di Fisica dell’ Universita di Milano-Bicocca, I-20126 Milano, ItalyapIIHE, Universite Libre de Bruxelles, B-1050 Brussels, Belgium1On leave of absence from LPI-Lebedev Physical Institute of the Russian Academy of Sciences,
119991 Moscow, Russia2Now at Albert Einstein Center for Fundamental Physics, Laboratory for High Energy Physics
(LHEP), University of Bern, CH-3012 Bern, Switzerland3Now at INAF/IASF, Sezione di Milano, I-20133 Milano, Italy4Now at Pusan National University, Geumjeong-Gu, Busan 609-735, Republic of Korea5Now at Asan Medical Center, 388-1 Pungnap-2 Dong, Songpa-Gu, Seoul 138-736, Republic of
Korea6Also at Centre de Recherche en Astronomie Astrophysique et Gophysique, Alger, Algeria7Now at SUBATECH, CNRS/IN2P3, F-44307 Nantes, France
Abstract: The OPERA neutrino experiment at the underground Gran Sasso Laboratory
has measured the velocity of neutrinos from the CERN CNGS beam over a baseline of about
730 km. The measurement is based on data taken by OPERA in the years 2009, 2010 and
2011. Dedicated upgrades of the CNGS timing system and of the OPERA detector, as
well as a high precision geodesy campaign for the measurement of the neutrino baseline,
allowed reaching comparable systematic and statistical accuracies.
An arrival time of CNGS muon neutrinos with respect to the one computed assuming
the speed of light in vacuum of (6.5± 7.4 (stat.)+8.3−8.0(sys.)) ns was measured corresponding
to a relative difference of the muon neutrino velocity with respect to the speed of light
(v− c)/c = (2.7± 3.1 (stat.) +3.4−3.3 (sys.))× 10−6. The above result, obtained by comparing
the time distributions of neutrino interactions and of protons hitting the CNGS target in
10.5 µs long extractions, was confirmed by a test performed at the end of 2011 using a
short bunch beam allowing to measure the neutrino time of flight at the single interaction
level.
Keywords: OPERA, CNGS, LNGS, neutrino velocity
– 1 –

Contents
1 Introduction 2
2 The OPERA detector and the CNGS neutrino beam 2
3 Principle of the neutrino time of flight measurement 4
4 Measurement of the neutrino baseline 8
5 Data selection 9
6 Neutrino event timing 11
6.1 Measurements performed during the 2011 CNGS winter shut down 15
7 Data analysis 18
8 Results 24
9 Test with a short-bunch wide-spacing beam 25
9.1 Results with the Target Tracker data 26
9.2 Results with the RPC data 28
10 Conclusions 29
11 Acknowledgements 30
– 1 –

1 Introduction
The OPERA neutrino experiment [1] at the underground Gran Sasso Laboratory (LNGS)
was designed to perform the first detection of neutrino oscillations in direct appearance
mode in the νµ → ντ channel, the signature being the identification of the τ− lepton created
by its charged current (CC) interaction [2].
In addition to its main goal, the experiment is well suited to determine the neu-
trino velocity with high accuracy through the measurement of the time of flight and of
the distance between the source of the CNGS neutrino beam at CERN (CERN Neutrino
beam to Gran Sasso) [3] and the OPERA detector at LNGS. For CNGS neutrino energies,
< Eν > = 17 GeV, the relative deviation from the speed of light c of the neutrino velocity
due to its finite rest mass is expected to be smaller than 10−19, even assuming the mass of
the heaviest neutrino eigenstate to be as large as 2 eV [4]. Hence, any larger deviation of
the neutrino velocity, v, from c would point to Lorentz invariance violation in the neutrino
sector.
In the past, a high energy (Eν > 30 GeV) and short baseline experiment was able to
test deviations down to (v − c)/c < 4 × 10⁻⁵ [5]. With a baseline analogous to that of
OPERA but at lower neutrino energies (Eν peaking at 3 GeV with a tail extending above
100 GeV), the MINOS experiment reported a measurement of (v−c)/c = (5.1±2.9)×10−5
[6]. At much lower energy, in the 10 MeV range, a stringent limit of |v − c|/c < 2 × 10⁻⁹
was set by the observation of (anti) neutrinos emitted by the SN1987A supernova [7].
In this paper we report on the determination of the neutrino velocity, defined as the
ratio of the measured distance from CERN to OPERA to the time of flight of neutrinos
traveling through the Earth’s crust. We used the high-statistics data taken by OPERA
in the years 2009, 2010 and 2011. Dedicated upgrades of the timing systems for the time
tagging and synchronisation of the CNGS beam at CERN and of the OPERA detector at
LNGS resulted in a reduction of the systematic uncertainties down to the level of the sta-
tistical error. The measurement also relies on a geodesy campaign that allowed measuring
the 730 km CNGS baseline with a precision of 20 cm.
Furthermore, in 2011 we conducted a measurement of the neutrino time of flight at
the single interaction level with a short bunch beam, obtaining consistent results. Mea-
surements obtained using two different OPERA subdetectors, namely the planes of plas-
tic scintillator strips constituting the Target Tracker (TT) and Resistive Plate Chambers
(RPC) are reported.
The results presented in this paper were obtained by taking into account the corrections
for instrumental effects discovered after the originally reported neutrino velocity anomaly
[8], see Section 6.1.
2 The OPERA detector and the CNGS neutrino beam
The OPERA neutrino detector at LNGS is composed of two identical Super Modules, each
consisting of an instrumented target section with a mass of about 625 tons followed by
a magnetic muon spectrometre. Each section is a succession of walls filled with emulsion
– 2 –
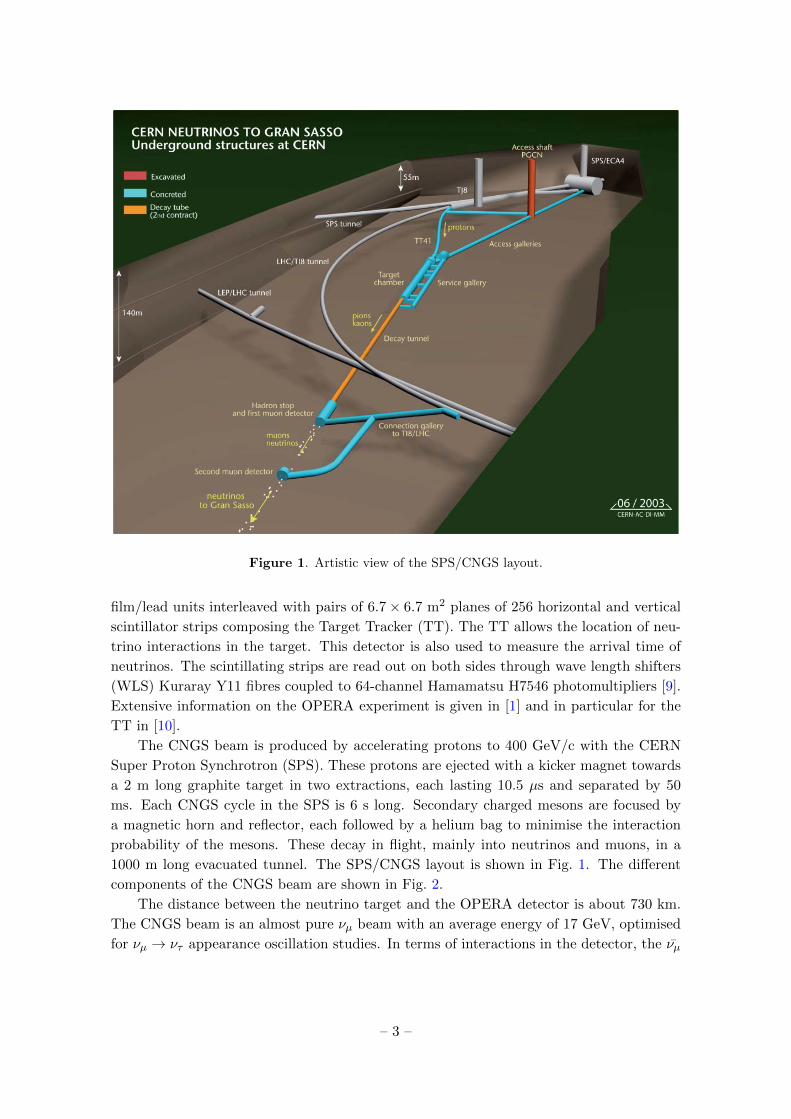
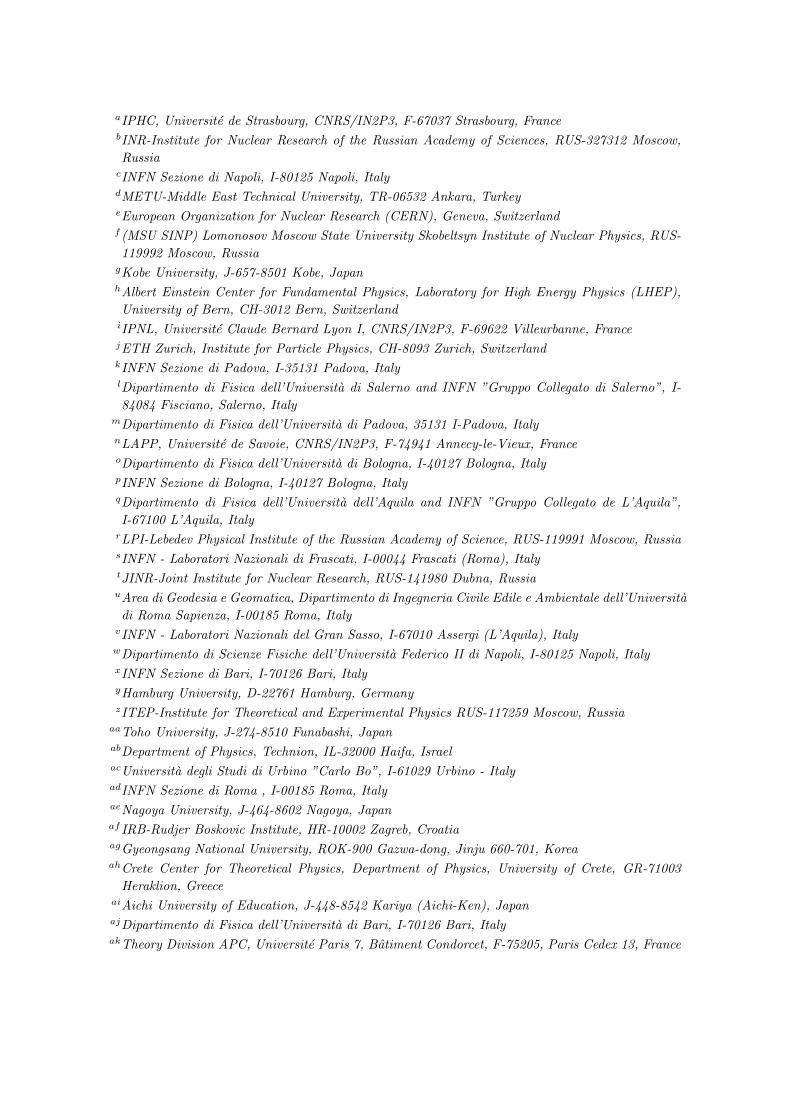
Figure 1. Artistic view of the SPS/CNGS layout.
film/lead units interleaved with pairs of 6.7× 6.7 m2 planes of 256 horizontal and vertical
scintillator strips composing the Target Tracker (TT). The TT allows the location of neu-
trino interactions in the target. This detector is also used to measure the arrival time of
neutrinos. The scintillating strips are read out on both sides through wave length shifters
(WLS) Kuraray Y11 fibres coupled to 64-channel Hamamatsu H7546 photomultipliers [9].
Extensive information on the OPERA experiment is given in [1] and in particular for the
TT in [10].
The CNGS beam is produced by accelerating protons to 400 GeV/c with the CERN
Super Proton Synchrotron (SPS). These protons are ejected with a kicker magnet towards
a 2 m long graphite target in two extractions, each lasting 10.5 µs and separated by 50
ms. Each CNGS cycle in the SPS is 6 s long. Secondary charged mesons are focused by
a magnetic horn and reflector, each followed by a helium bag to minimise the interaction
probability of the mesons. These decay in flight, mainly into neutrinos and muons, in a
1000 m long evacuated tunnel. The SPS/CNGS layout is shown in Fig. 1. The different
components of the CNGS beam are shown in Fig. 2.
The distance between the neutrino target and the OPERA detector is about 730 km.
The CNGS beam is an almost pure νµ beam with an average energy of 17 GeV, optimised
for νµ → ντ appearance oscillation studies. In terms of interactions in the detector, the νµ
– 3 –

Protonbeam
Helium bags Decay tube Hadron stop Muon detectors
ReflectorHornTarget
2.7m 43.4 m100 m
18 m 67 m1095 m
C FeMuonNeutrino
Pion / KaontoGranSasso
π /K - decay
5 m 5 m
Figure 2. Layout of the CNGS beam line.
contamination is 2.1%, while νe and νe contaminations are together smaller than 1%. The
FWHM of the neutrino beam at the OPERA location is 2.8 km.
The kicker magnet trigger-signal for the proton extraction from the SPS is UTC (Co-
ordinated Universal Time) time-stamped with a Symmetricom Xli GPS receiver [11]. The
schematic of the SPS/CNGS timing system is shown in Fig. 3. The determination of the
delays shown in Fig. 3 is described in Section 6.
The proton beam time-structure is accurately measured by a fast Beam Current Trans-
former (BCT) detector [12] (BFCTI400344) located (743.391 ± 0.002) m upstream of the
centre of the graphite target and read out by a 1 GS/s Wave Form Digitiser (WFD) Acqiris
DP110 with a 250 MHz bandwidth [13]. The BCT consists of toroidal transformers coaxial
to the proton beam providing a signal proportional to the beam current transiting through
it, with a 400 MHz bandwidth. The linearity of the device is better than 1% and it is
operated far from the saturation limit. The start of the digitisation window of the WFD
is triggered by the kicker magnet signal. The waveforms recorded for each extraction by
the WFD are stamped with the UTC and stored in the CNGS database.
The intensity of the proton beam in the SPS features a five-step structure reflecting
the five-turn (2.1 µs per turn) Continuous Transfer (CT) extraction mode from the CERN
Proton Synchrotron (PS), as seen in the left part of Fig. 4. The fine structure due to
the 200 MHz SPS radiofrequency is superimposed, which is actually resolved by the BCT
measurement (Fig. 4, right).
3 Principle of the neutrino time of flight measurement
A schematic description of the principle of the time of flight measurement is shown in
Fig. 5. The time of flight of CNGS neutrinos (TOFν) cannot be precisely measured at the
single interaction level since any proton in the 10.5 µs extraction time may produce the
neutrino detected by OPERA. However, by measuring the time distributions of protons for
each extraction for which neutrino interactions are observed in the detector, and summing
them together, after proper normalisation one obtains the probability density function
(PDF) of the time of emission of the neutrinos within the duration of extraction. Each
proton waveform is UTC time-stamped as well as the events detected by OPERA. The two
– 4 –

Figure 3. Schematic of the CERN SPS/CNGS timing system. Green boxes indicate detector time-
response. Orange boxes refer to elements of the CNGS-OPERA synchronisation system. Details
on the various elements are given in Section 6.
2000 4000 6000 8000 10000 12000time [ns]
arb
itra
ry u
nit
s
14000
-20
-15
-10
-5
0
5
10.5 μs
3250 3255 3260 3265 3270-18
-16
-14
-12
-10
-8
-6
-4
time [ns]
5 nsarb
itra
ry u
nit
s
Figure 4. Example of a specially selected proton extraction waveform measured with the BCT
detector BFCTI400344 to show the five-peak structure reflecting the proton losses in the PS Con-
tinuous Transfer extraction mechanism. This structure is more pronounced than for the majority of
the waveforms. A blow-up of the waveform (right plot) shows that the 200 MHz SPS radiofrequency
is resolved.
– 5 –

Figure 5. Schematic of the time of flight measurement.
time-stamps are related by TOFc, the expected time of flight assuming the speed of light
[14]. It is worth stressing that this measurement does not rely on the difference between a
start and a stop signal but on the comparison of two event time distributions.
The PDF distribution can then be compared with the time distribution of the interac-
tions detected in OPERA, in order to measure TOFν . The deviation δt = TOFc − TOFνis obtained by a maximum likelihood analysis of the time tags of the OPERA events with
respect to the PDF, as a function of δt. The individual measurement of the waveforms
reflecting the time structure of the extraction reduces systematic effects related to time
variations of the beam compared to the case where the beam time structure is measured
on average, e.g. by a near neutrino detector without using proton waveforms.
The total statistics used for the analysis reported in this paper is 15223 events detected
in OPERA, corresponding to about 1020 protons on target collected during the 2009, 2010
and most of the 2011 CNGS runs. This allowed estimating δt with a small statistical
uncertainty, presently comparable to the total systematic uncertainty.
The reference point used for the baseline measurement at CERN is the position of the
BCT which is 743.4 m upstream of the target. Assuming that 400 GeV protons travel at
the speed of light over this distance induces a negligible correction of 0.007 ns. The point
where the parent meson produces a neutrino in the decay tunnel is unknown. However,
– 6 –

Figure 6. Schematic of the OPERA timing system at LNGS. Blue delays include elements of the
time-stamp distribution; increasing delays decrease the value of δt. Green delays indicate detector
time-response; increasing delays increase the value of δt. Orange boxes refer to elements of the
CNGS-OPERA synchronisation system.
this introduces a negligible inaccuracy in the neutrino time of flight measurement, because
the produced mesons are ultra-relativistic. This affects TOFν by a correction of the order
of d/2cγ2, with d being the meson decay length, on average 450 m from the target, and
γ its Lorentz factor, on average as large as 190. By a full FLUKA-based simulation of
the CNGS beam [15] it was shown that the time difference computed assuming a particle
moving at the speed of light from the target down to LNGS, with respect to the value
derived by taking into account the speed of the relativistic parent meson down to its decay
point is less than 0.02 ns. Similar arguments apply to muons produced in muon neutrino
CC interactions occurring in the rock in front of the OPERA detector and seen in the
apparatus (external events). With a full GEANT simulation of external events it was
shown that ignoring the position of the interaction point in the rock introduces a bias
smaller than 2 ns with respect to those events occurring in the target (internal events),
provided that external interactions are selected by requiring identified muons in OPERA.
More details on the muon identification procedure are given in [16].
A key feature of the neutrino velocity measurement is the accuracy of the relative
– 7 –

time tagging at CERN and at the OPERA detector. The standard GPS receivers formerly
installed at CERN and LNGS would feature an insufficient 100 ns accuracy for the TOFνmeasurement. Thus, in 2008, two identical systems, composed of a GPS receiver for time-
transfer applications Septentrio PolaRx2e [17] operating in “common-view” mode [18] (a
method in which only signals emitted by GPS satellites seen simultaneously by the receivers
at both ends of the baseline are considered), and a Cs atomic clock Symmetricom Cs4000
[19] were installed at CERN and LNGS (see Figs. 3, 5 and 6).
The Cs4000 oscillator provides the reference frequency to the PolaRx2e receiver, which
is able to time-tag its “One Pulse Per Second” output (1PPS) with respect to the individual
GPS satellite observations. The latter are processed offline by using the CGGTTS format
[20]. The two systems feature a technology routinely used for high-accuracy time-transfer
applications by national time and frequency metrology laboratories around the world, in
order to compare atomic clocks [21]. These international time comparisons are the basis
of the UTC as defined by the Bureau International des Poids et Mesures (BIPM). The two
systems were calibrated in 2008 by the Swiss Federal Metrology Institute METAS (Bunde-
samt fur Metrologie) [22] and established a permanent time link at the 2 ns level between
two reference points (tCERN and tLNGS) of the timing chains at CERN and OPERA. This
time link was independently verified in 2011 by the German Federal Metrology Institute
PTB (Physikalisch-Technische Bundesanstalt) [23] by taking data at CERN and LNGS
with a portable time-transfer device commonly employed for relative time link calibrations
[24]. The difference between the time base of the CERN and OPERA PolaRx2e receivers
was measured to be (2.3 ± 0.9) ns [23]. This correction was taken into account in the
application of the time link.
All the other elements of the timing distribution chains of CERN and OPERA were
determined using different techniques, further described in the following, aiming to reach
a comparable level of accuracy.
4 Measurement of the neutrino baseline
The other fundamental ingredient for the neutrino velocity measurement is the knowledge
of the distance between the point where the proton time-structure is measured at CERN
and the origin of the reference frame for the OPERA underground detector at LNGS.
The relative positions of the elements of the CNGS beam line are known with millimetre
accuracy. When these coordinates are transformed into the global geodesy reference frame
ETRF2000 1 [25] by relating them to external GPS benchmarks at CERN, they are known
within 2 cm accuracy. This frame has a scale error at the level of 10−9 [26].
The analysis of the GPS benchmark positions was first done by extrapolating mea-
surements taken at different periods via geodynamical models [27], and then by comparing
1The International Terrestrial Reference System (ITRS) is a set of procedures defined by the International
Union of Geodesy and Geophysics; it allows to determine the coordinates of fixed points on the surface of
the Earth with a cm precision as well as their drift velocities. The European Terrestrial Reference Frame
(ETRF) is a particular realisation of the ITRS for measuring relative coordinates within Europe where the
Eurasian plate is taken as static.
– 8 –

simultaneous measurements taken in the same reference frame. The two methods yielded
the same result within 2 cm [26]. The travel path of protons from the BCT to the focal
point of the CNGS target is also known with millimetre accuracy.
The distance between the target focal point and the OPERA reference frame was
precisely measured in 2010 following a dedicated geodesy campaign. The coordinates of
the origin of the OPERA reference frame were measured by establishing GPS benchmarks
at the two sides of the 10 km long Gran Sasso highway tunnel and by transporting their
positions with a terrestrial traverse down to the OPERA detector. A common analysis
in the ETRF2000 reference frame of the 3D coordinates of the OPERA origin and of the
target focal point allowed the determination of this distance to be (730534.61 ± 0.20) m
[26]. The 20 cm uncertainty is dominated by the 8.3 km underground link between the
outdoor GPS benchmarks and the benchmark at the OPERA detector [26].
The accurate time-transfer GPS receiver PolaRx2e allows to continuously monitor tiny
movements of the Earth’s crust, such as continental drift that shows up as a smooth varia-
tion of less than 1 cm/year, and the detection of slightly larger effects due to earthquakes.
The April 2009 earthquake in the region of LNGS, in particular, produced a sudden dis-
placement of about 7 cm, as seen in Fig. 7. All mentioned effects are within the accuracy
of the baseline determination.
Tidal effects occurring during the geodesy measurements were corrected for by expres-
sing the results in a conventional tide-free frame [28]. Therefore, measurements taken at
different times can be directly compared. As far as the neutrino baseline is concerned, pe-
riodic tidal movements are below the 1 cm level and are averaged over the long data-taking
period [26].
The baseline considered for the measurement of the neutrino time of flight is then the
sum of (730534.61 ± 0.20) m between the CNGS target focal point and the origin of the
OPERA detector reference frame, and (743.391±0.002) m between the BCT and the focal
point, i.e. (731278.0± 0.2) m.
5 Data selection
The OPERA data acquisition system (DAQ) time-tags the TT detector hits with 10 ns
quantization with respect to the UTC [29]. The time of a neutrino interaction is defined as
that of the earliest hit in the TT. CNGS events are preselected by requiring that they fall
within a window of 20 µs with respect to the SPS kicker magnet trigger-signal, delayed by
the neutrino time of flight assuming the speed of light and corrected for the various delays
of the timing systems at CERN and at OPERA. The relative fraction of cosmic ray events
accidentally falling in this window is 10−4 and it is therefore negligible [1, 30].
Since TOFc is computed with respect to the origin of the OPERA reference frame,
located beneath the most upstream spectrometre magnet, the time of the earliest hit for
each event is corrected for its distance along the beam line from this point, assuming
time propagation at the speed of light. The UTC time of each event is also individually
corrected for the instantaneous value of the time link correlating the CERN and OPERA
timing systems, as obtained from the two PolaRx2e receivers. These corrections reflect the
– 9 –
Year2008.5 2009 2009.5 2010
Up
(m)
0
0.02
0.04
0.06
Year2008.5 2009 2009.5 2010
Eas
t (m
)
0
0.02
0.04
0.06
0.08
0.1
Year2008.5 2009 2009.5 2010
Nor
th (
m)
00.020.040.060.08
0.1
Figure 7. Monitoring of the PolaRx2e GPS antenna position at LNGS showing the slow earth
crust drift and the fault displacement due to the 2009 earthquake in the L’Aquila region. Units for
the horizontal (vertical) axis are years (metres).
instability of the standard GPS systems at CERN and LNGS, whose time bases may vary
by several tens of nanoseconds with respect to each other on a few hours scale.
The total statistics used for this analysis (15223 events) includes 7235 internal (charged
and neutral current interactions) and 7988 external (charged current) events. Internal
events, preselected by the electronic detectors with the same procedure used for neutrino
oscillation studies [31] constitute a subsample of the entire OPERA statistics accumulated
during the considered run time (about 70%), for which both time transfer systems at CERN
and LNGS were operational, as well as the database-logging of the proton waveforms. As
mentioned before, external events, in addition, are requested to have a muon identified in
the detector.
The final statistics of 15223 neutrino interactions does not include about 5% of the
preselected events, characterized by an earliest hit isolated in time and in position inside
the detector with respect to the bulk of the event hits, which were discarded. Such isolated
hits may be due to noise not included in the simulations and therefore constitute a potential
source of bias towards early arrival times. For the retained events there is a good agreement
between data and simulations as far as the timing of the earliest hit is concerned. This is
– 10 –
discussed in the next section.
6 Neutrino event timing
The schematic of the SPS/CNGS timing system is shown in Fig. 3. A general-purpose
timing receiver “Control Timing Receiver” (CTRI) at CERN [32] logs every second the
difference in time between the 1PPS outputs of the Xli and of the more precise PolaRx2e
GPS receivers, with 0.1 ns resolution. The Xli 1PPS output represents the reference point
of the time link to OPERA. This point is also the source of the “General Machine Timing”
chain (GMT) serving the CERN accelerator complex [33].
The GPS devices are located in the CERN Prevessin Central Control Room (CCR).
The time information is transmitted via the GMT to a remote CTRI device in Hall HCA442
used to UTC time-stamp the kicker magnet signal. This CTRI also produces a delayed
replica of the kicker magnet signal, which is sent to the adjacent WFD module. The UTC
time-stamp marks the start of the digitisation window of the BCT signal. The latter signal
is brought via a coaxial cable to the WFD at a distance of 100 m. Three delays characterise
the CERN timing chain:
1. The propagation delay through the GMT of the time base of the CTRI module logging
the PolaRx2e 1PPS output to the CTRI module used to time-tag the kicker pulse
∆tUTC = (10085± 2) ns;
2. The delay to produce the replica of the kicker magnet signal from the CTRI to start
the digitisation of the WFD ∆ttrigger = (30± 1) ns;
3. The delay from the time the protons cross the BCT to the time a signal arrives to
the WFD ∆tBCT = (580± 5) ns.
The kicker signal is used as a pre-trigger and as an arbitrary time origin. The measure-
ment of the TOFν is based instead on the BCT waveforms, which are tagged with respect
to the UTC.
The measurement of ∆tUTC was performed by means of a portable Cs4000 oscillator.
Its 1PPS output, stable to better than 1ns over a few hour scale, was input to the CTRI
used to log the Xli 1PPs signal at the CERN CCR. The same signal was then input to the
CTRI used to time-stamp the kicker signal at the HCA442 location. The two measurements
allowed the determination of the delay between the time bases of the two CTRI, and to
relate the kicker time-stamp to the Xli output. The measurements were repeated three
times during the last two years and yielded the same results within 2 ns. This delay was
also determined by performing a two-way timing measurement with optical fibres. The Cs
clock and the two-way measurements also agree within 2 ns.
The two-way measurement is a technique routinely used in this analysis for the deter-
mination of delays. Measuring the delay tA in propagating a signal to a far device consists
in sending the same signal via an optical fibre B to the far device location in parallel to
its direct path A. At this site the time difference tA− tB between the signals following the
– 11 –

two paths is measured. A second measurement is performed by taking the signal arriving
at the far location via its direct path A and sending it back to the origin with the optical
fibre B. At the origin the time difference between the production and receiving time of the
signal corresponds to tA + tB. In this procedure the optoelectronic chain used for the fibre
transmission of the two measurements is kept identical by simply swapping the receiver
and the transmitter between the two locations. The two combined measurements allow
determining tA [34]. For the ∆tUTC the two-way setup was left in operation since July
2011 to assess the time stability of the results. The measured ∆tUTC showed excursions
not exceeding 0.4 ns related to temperature variations of the 2 km long fibres and of the
associated electronics.
Measurements by two-way fibre and transportable Cs clock were systematically com-
pared for the determination of the various delays of the CERN and OPERA timing chains
and agreed within 1 ns. The two techniques are based on an inclusive measurement of the
delay between pairs of reference points. This does not introduce any bias that could be
related to the calibration of individual hardware elements of the chain.
∆ttrigger was estimated by an accurate oscilloscope measurement. The determination
of ∆tBCT was first performed by measuring the 1PPS output of the Cs4000 oscillator with
a digital oscilloscope and comparing it to a CTRI signal at the point where the BCT signal
arrives at the WFD. This was compared to a similar measurement where the Cs4000 1PPS
signal was injected into the calibration input of the BCT. The time difference of the 1PPS
signals in the two configurations led to the measurement of ∆tBCT = (581±10) ns.
Since the above determination through the calibration input of the BCT might not
be representative of the internal delay of the BCT with respect to the transit time of the
protons, and also because the error on this measurement was by far the largest contribution
to the overall systematic uncertainty, a more sophisticated method was then applied. The
proton transit time was tagged upstream of the BCT by two fast beam pick-ups BPK400099
and BPK400207 with a time response of 1 ns [35]. From the relative positions of the three
detectors (the pick-ups and the BCT) along the beam line and the signals from the two
pick-ups one determines the time the protons cross the BCT and the time delay at the level
of the WFD. In order to achieve an accurate determination of the delay between the BCT
and the BPK signals, a measurement was performed in the particularly clean experimental
condition of the SPS proton injection to the Large Hadron Collider (LHC) machine of 12
bunches with a width of about 1 ns and with 50 ns spacing, passing through the BCT
and the two pick-up detectors. This measurement was performed simultaneously for the
12 bunches and yielded ∆tBCT = (580 ± 5 (sys.)) ns. The systematic error also accounts
for uncertainties on the modelling of the time response of the BCT, including cables and
electronics, which results in a broadening of the digitised signal with respect to the proton
current pulse. This is illustrated in Fig. 8 for proton bunches of 1 ns.
The schematic of the OPERA timing system at LNGS is shown in Fig. 6. The official
UTC time source at LNGS is provided by a GPS system ESAT 2000 [36, 37] operating at
the surface laboratory. The 1PPS output of the ESAT is logged with a CTRI module every
second with respect to the 1PPS of the PolaRx2e, in order to establish a high-accuracy
time link with CERN. Every millisecond a pulse synchronously derived from the 1PPS of
– 12 –

-1.5
-1
-0.5
0
0.5
1
1.5
350 400 450 500time [ns]
arbi
trar
y un
its BCTFI.4000344BPK.400099
BPK.4000207
Figure 8. Comparison between the signals of the BCT and of the fast pick-up detectors after
compensating for ∆tBCT .
the ESAT (PPmS) is transmitted to the underground laboratory via an 8.3 km long optical
fibre. The delay of this transmission with respect to the ESAT 1PPS output down to the
OPERA Master Clock output was measured with a two-way fibre procedure in July 2006
and amounts to (40996 ± 1) ns. Additional measurements with a transportable Cs clock
were also performed in June 2007 yielding the same result. As we will see in Section 6.1,
a series of additional measurements on the OPERA timing system conducted during the
2011 CNGS winter shut down led to an effective fibre delay during the whole data taking
period 2008-2011 of 41069 ns. Based on the dispersion of the measured values during this
period (after August 2008 until December 2011, see Fig. 12), a systematic uncertainty of
3.7 ns on the fibre delay was estimated.
The OPERA Master Clock is disciplined by a Vectron OC-050 oscillator with an Allan
deviation of 2 × 10⁻¹² at an observation time of 1 s. This oscillator keeps the local time
during the 0.6 s DAQ cycle. The OPERA Master Clok is synchronised at every DAQ
cycle start with the PPmS signal coming from the external GPS. This signal is tagged
with respect to the uncorrelated internal frequency producing a ± 25 ns time jitter (this
jitter is only relevant for the low statistics run with the bunched beam, see Section 9). The
frequency of the Vectron oscillator was measured during the 2011 CNGS shut down and
found slightly larger (0.124 ppm) than specified (see Section 6.1).
The time base of the OPERA Master Clock is transmitted to the frontend cards of
– 13 –

the TT with the FPGA (see Fig. 6). This delay (∆tclock) was also measured with two
techniques, namely by the two-way fibre method, and by transporting the Cs4000 clock
to the two points. Both measurements provided the same result of (4263 ± 1) ns. The
frontend card time-stamp is performed in a Field Programmable Gate Array (FPGA) by
incrementing a coarse counter every 0.6 s and a fine counter with a frequency of 100 MHz.
At the occurrence of a trigger the content of the two counters provides a measure of the
arrival time. The fine counter is reset every 0.6 s by the arrival of the Master Clock signal
that also increments the coarse counter. The internal delay of the FPGA processing the
Master Clock signal to reset the fine counter was determined by a parallel measurement
of trigger and clock signals with the DAQ and a digital oscilloscope. This measured delay
(FPGA latency) is (24.5 ± 1.0) ns. This takes into account the 10 ns quantization effect
due to the clock period.
The delays in producing the Target Tracker signal including the scintillator response,
the propagation of the signals in the WLS fibres, the transit time of the photomultiplier
[9], and the time response of the OPERA analogue frontend readout chip (ROC) [38]
were inclusively calibrated by exciting the scintillator strips at known positions by a UV
picosecond laser [39]. The arrival time distribution of the photons at the photocathode
and the time walk due to the discriminator threshold in the analogue frontend chip as a
function of the signal pulse height were accurately determined in laboratory measurements
and included in the detector simulation. The total time elapsed from the moment photons
reach the photocathode, a trigger is issued by the ROC analogue frontend chip, and the
trigger signal arrives at the FPGA where it is time-stamped, was (50.2± 2.3) ns.
Since the time response to neutrino interactions depends on the position of the hits
in the detector and on their pulse height, the average TT delay was evaluated from the
difference between the exact interaction time and the time-stamp of the earliest hit for a
sample of fully simulated neutrino interactions. Starting from the position at which photons
are generated in each strip, the simulation takes into account all the effects determined in
laboratory measurements including the arrival time distribution of the photons for a given
production position, the time-walk of the ROC chip, and the measured delays from the
photocathode to the FPGA. This TT delay has an average value of 59.6 ns with a RMS
of 7.3 ns, reflecting the transverse event distribution inside the detector. The 59.6 ns
represents the overall delay of the TT response down to the FPGA and it includes the
quoted delay of 50.2 ns. The simulation procedure adds a 3 ns term to the systematic
error.
Several checks were performed by comparing data and simulated events as far as the
earliest TT hit timing is concerned. Data and simulations agree within the above-mentioned
systematic uncertainty of 3 ns for both the time differences between the earliest and all
the following hits, and for the difference between the earliest hit and the average timing
of muon tracks. This is shown in Fig. 9 where the distribution of the time difference
between the earliest TT hit and the average time of the event, and the average time of the
muon track are shown for internal and external events, respectively. The distributions are
corrected for the longitudinal position of the hits. Consequently, after correction, the truly
earliest hit used to time the event may appear to be preceded by more downstream hits,
– 14 –

aveDtALRfirstEntries 7168Mean 14.93RMS 8.747
Time (ns)-10 0 10 20 30 40 50 60
Eve
nts
/ bin
0
100
200
300
400
500
600
700
800
900 aveDtALRfirstEntries 7168Mean 14.93RMS 8.747
aveDtALRfirstEntries 7168Mean 14.93RMS 8.747
aveDtLRfirstdtTrkFirst
Entries 7493Mean 4.946RMS 5.526
Time (ns)-10 0 10 20 30 40 50 60
Eve
nts
/ bin
0
200
400
600
800
1000
1200dtTrkFirst
Entries 7493Mean 4.946RMS 5.526
dtTrkFirstEntries 7493Mean 4.946RMS 5.526
Figure 9. Distribution of the time difference between the earliest TT hit and: a) the average
time of the event, b) the average time of the muon track. Dots with error bars indicate data and
the dotted line simulated events. Plot a) includes only internal events while plot b) only external
events. The distributions are corrected for the longitudinal position of the hits.
hence the negative value occasionally taken by the time difference.
Corrections were also applied to take into account the Sagnac effect caused by the
rotation of the Earth around its axis. This yields an increase of TOFc by 2.2 ns, with a
negligible error. The Earth’s revolution around the Sun and the movement of the solar
system in the Milky Way induce a negligible effect, as well as the influence of the gravi-
tational fields of Moon, Sun and Milky Way, and the Earth’s frame-dragging [40]. The
relative effect of the Earth’s gravitational field on the Schwarzschild geodesic amounts to
10−8 and it is therefore totally negligible. The gravitational red-shift due to the different
CERN and LNGS altitudes produces an even smaller relative effect of 10−13 on the clocks
in between two common-view synchronisations [40].
More details on the neutrino timing and on the geodesy measurement procedures can
be found in [41].
6.1 Measurements performed during the 2011 CNGS winter shut down
At the end of the 2011 CNGS run the OPERA timing at LNGS was further checked in
order to test its stability over time [42].
Measurements were made, starting at the beginning of December 2011, of the time
delay in the 8.3 km optical fibre between the ESAT GPS 1PPS output and the OPERA
Master Clock output using the standard 2-way technique. A value 73.2 ns larger than the
one determined in 2006 and 2007 and a larger jitter of the Opera Master Clock latching
of the GPS signal were measured. Further investigations, that lasted until mid February
2012, revealed that the difference originated from an optical cable not properly connected
thus reducing the amount of light received by the optical/electrical converter of the Master
Clock. When proper connections were restored, during a technical intervention, the values
of the delay and of the jitter were found to agree with what was measured in 2006 and
2007, as listed below:
– 15 –

Test Pointearly stage of theamplifier circuit
Photodiode ETX100
Pre-Amplification Amplification
Reference Voltage
Comparator 5V
Optical GPS signalESAT PPmS
Numerical GPS signal
3.3V Buffer
Reference PointM.C. PPmS
Figure 10. A simplified scheme of the OPERA Master Clock opto-electronic circuit used to convert
the ESAT PPmS optical signal into an electric signal.
200 ns
1 V
200 ns
1 V
Figure 11. The ESAT 1PPS time reference propagated underground through an 8.3 km optical
path (blue), the Master Clock PPmS (green) and the Master Clock PPmS taken at an early stage
of the amplifier circuit (red). Top: signals taken with the connectors correctly plugged; bottom:
signals taken with connectors wrongly screwed in positions which provide an extra delay of ∼74 ns.
2006 tA = (40995.5± 0.3) ns RMS = 3.2 ns
2011: before fibre reconnection tA = (41068.6± 0.5) ns RMS = 6.0 ns
2011: after fibre reconnection tA = (40994.1± 0.3) ns RMS = 3.2 ns
Additional tests showed that the fibre delay could vary according to the amplitude of the
light signal at the Master Clock input (Fig. 10). By acting on the optical fibre connections
both rise time and plateau of the amplifier output signal varied depending on the input
light intensity (Fig. 11). The effect was related to the slow electronics and the time-walk
of the comparator.
The reset signal sent to the TT front end is delayed by the same amount as the Master
Clock PPmS, leading to an underestimation of the neutrino TOF.
During the CNGS winter shut down the delay ∆tclock from the OPERA Master Clock to
the last TT sensor (FPGA) of the first TT wall (taken as time reference) was re-measured.
– 16 –

The replica of the 1PPmS ESAT signal generated by the Master Clock (Fig. 10) taken as
time reference was transmitted through an extra (calibrated) path and compared to the
signal at point t10 in Fig. 6. A delay of 4262 ns was obtained confirming the previous
measurement.
An additional test used the same extra path and 1PPmS signal to inject a signal
equivalent to 100 p.e. at the PMT connector level by means of a 2.3 pF capacitor. The
analysis of the time-stamps of such generated events, recorded by the DAQ as it is done for
neutrino data taking, showed that the time delay between two consecutive events (separated
by 1 ms) was 0.124 ns larger than expected. As a consequence the event time stamp was
overestimated by a quantity which depends on the event position inside the DAQ cycle,
up to a maximum of 74 ns. This effect was due to a frequency offset between the OPERA
Master Clock and ESAT GPS2 oscillators, as proven by comparing them to a Cs Frequency
Standard (10 MHz). The 10 MHz Vectron OC-050 Oscillator of the OPERA Master Clock
frequency was slightly larger (0.124 ppm) than the specifications.
An additional independent information about the value of the LNGS fibre delay during
the 2009-2011 neutrino data taking came from an analysis tool developed to study cosmic
muon events in delayed coincidence in the OPERA and LVD detectors as a signature of
high pT events in cosmic rays [43]. The analysis had revealed no such events but confirmed
the existence of a significant flux of almost horizontal cosmic muons from the so called
“Teramo Valley”, a region in the massif orography with large zenith angles (θ > 80 deg)
and modest rock thickness (∼2200 m) [44]. The idea was to use these data to determine
when the above mentioned discrepancy in the fibre delay at LNGS occurred or started to
develop. Since single horizontal muons traverse first the OPERA detector and then, at
a distance of ∼160 m, the LVD apparatus, any change in the timing chain of one of the
two experiments would be reflected in a change of the cosmic muon time of flight over the
OPERA-LVD distance. The main results of the analysis from mid 2007 until March 2012,
are reported in [43].
In Fig. 12 (taken from [43]) the local time difference, ∆tµ, between the muon recorded
by OPERA and the same muon recorded by LVD is plotted versus time. The figure
indicates two abrupt changes in ∆tµ, one around August 2008 and the other in December
2011. In between ∆tµ stays constant thus corresponding to a stable configuration of the
detectors’ timing systems. The extracted value of (73.2 ± 9) nsec [43] is compatible with
the fibre recalibration described in Section 6.1. The observed ∆tµ decrease in December
2011 is related to proper reconnection of the optical fibre to the OPERA Master Clock
during a technical intervention. The increase of ∆tµ in August 2008 originated from an
anomalous set-up of the OPERA timing system which remained in a stable configuration
over the whole data taking period considered in the neutrino velocity analysis. The data
dispersion of Fig. 12 compared to a horizontal line in the flat region between 2008 and 2011
corresponds to 3.7 ns. This dispersion has been considered as the systematic error on the
8.3 km fibre delay.
As indicated in [43], by comparing the OPERA time stamps as a function of the time
within the OPERA DAQ cycle, a constant time drift of (114 ± 14) ns/s was observed,
compatible with the previously reported value of 124 ns/s. Grouping data year by year,
– 17 –

Year2007 2008 2009 2010 2011 2012 2013
(n
s)μtΔ
500
550
600
650
700
Figure 12. Distribution of the ∆tµ = tLVD − tOPERA. For each year all events are grouped into
one single point, but for 2008 they are subdivided into three periods: before May, May-August, and
after August.
this drift remains constant within the errors. The 14 ns uncertainty on the drift was used
to derive the systematic error on the ∆tclock delay between the Master Clock and the TT
sensors, i.e. (4262 ± 2) ns.
7 Data analysis
The parameters used to compute TOFν and yielding the final value of δt = TOFc−TOFνare summarised in Table 1. In order to ease the interpretation of the corrections a sign is
attributed to each calibration value: delays increasing (decreasing) the value of δt have a
positive (negative) sign.
For each neutrino interaction measured in the OPERA detector the analysis procedure
used the corresponding proton extraction waveform. These waveforms were individually
normalised to unity and summed up in order to build a PDF w(t). The noise present at the
level of individual waveforms (see the baseline of the pulses shown in Fig. 4) is averaged
out by summing them up. The 200 MHz radiofrequency structure is still present in the
final PDF, together with a coherent noise affecting its central part. This noise is due to an
electromagnetic disturbance of the electronics in Hall HCA442, occurring with a constant
delay with respect to the kicker magnet pulse. The same was observed independently by
a different WFD operating in parallel and reading out another BCT detector. The same
noise was observed during empty spills where SPS protons are not sent to the CNGS line
but to the beam dump. Since this noise is not related to the proton beam, it was filtered
– 18 –

Table 1. Summary of the time delay values used in the analysis.
Time delay (ns)
Baseline 2439280.9
Earth rotation (Sagnac effect) 2.2
UTC corrections at CERN:
CTRI signal propagation through GMT chain ∆tUTC 10085.0
Kicker magnet signal to WFD ∆ttrigger 30
BCT signal to WFD ∆tBCT -580
UCT corrections at Gran Sasso:
LNGS 8.3 km fibre to OPERA Master Clock -41068.6
TT response to FPGA 59.6
FPGA latency -24.5
Master Clock to FPGA ∆tclock -4262.9
GPS Corrections:
Time-link -2.3
out by a low-pass filter applied to the final PDF. Checks were performed throughout the
whole analysis chain to ensure that the filtering procedure did not affect the final results.
The WFD is triggered by the kicker magnet pulse, but the time of the proton pulses
with respect to the kicker trigger is different for the two extractions. In fact, for the second
extraction the kicker magnet pulse is anticipated with respect to the proton bunches,
profiting of the fact that the SPS ring is half-empty. The kicker trigger is just related to
the pulsing of the kicker magnet. The exact timing of the proton pulses stays within this
large window of the pulse.
A separate maximum likelihood procedure was then carried out for the two proton
extractions. The likelihood to be maximised for each extraction is a function of the single
variable δt to be added to the time tags tj of the OPERA events. These are expressed in
the time reference of the proton waveform digitiser (wk) assuming neutrinos traveling at
the speed of light, such that their distribution best coincides with the corresponding PDF:
Lk(δtk) =∏j
Wk(tj + δtk) k = 1, 2 extractions (7.1)
Near the maximum the likelihood function can be approximated by a Gaussian whose
variance is a measure of the statistical uncertainty on δt. The data used for the maximum
likelihood calculation are unbinned and the dependence on δt is computed by making a
scan in steps of 1 ns. A parabolic fit is performed on the log-likelihood function for the
evaluation of the maximum and of the statistical uncertainty (Fig. 13). As seen in Fig. 14,
the PDF representing the time-structure of the proton extraction is not flat but exhibits
– 19 –

t (ns)δ-60 -40 -20 0 20 40
Log
Like
lihoo
d
-66022
-66020
-66018
-66016First Extraction
t (ns)δ-60 -40 -20 0 20 40
Log
Like
lihoo
d
-66664
-66662
-66660
Second Extraction
Figure 13. Log-likelihood distributions for both extractions as a function of δt, shown close to the
maximum and fitted with a parabolic shape for the determination of the central value and of its
uncertainty.
a series of peaks and valleys, reflecting the features and the inefficiencies of the proton
extraction from the PS to the SPS via the Continuous Transfer mechanism [45]. Such
structures may well change with time. The way the PDF are built automatically accounts
for the beam conditions corresponding to the neutrino interactions detected by OPERA.
The results for δt from the two proton extractions obtained for the years 2009, 2010
and 2011 are compared in Fig. 15. They are compatible with each other. Data were also
grouped in arbitrary subsamples to look for possible systematic dependencies. For example,
by computing δt separately for events taken during day (from 8 AM to 8 PM) and night
hours, the absolute difference between the two calculations is (16.4± 15.8) ns providing no
indication for a systematic effect. In addition, with the presently available statistics we do
not have indications of variations in the daily-24 hour observations. A similar result was
obtained for a summer vs (spring plus autumn) dependence, possibly induced by thermal
effects in the setup, which yielded (15.6 ± 15.0) ns. An analysis was also conducted by
grouping events in two bins, corresponding to low- and high-intensity extractions (below
and above 1.97 × 10¹³ protons on target, respectively). The absolute difference between
the two bins is (6.8± 16.6) ns.
The maximum likelihood procedure was checked with a Monte Carlo simulation.
Starting from the experimental PDF, an ensemble of 100 data sets of OPERA neutrino
– 20 –
(ns)WFDt0 5000 10000 15000 20000
a.u.
0
0.2
0.4
0.6
0.8
1 Extraction 1: 2009-2011
(ns)WFDt0 5000 10000 15000 20000
a.u.
0
0.2
0.4
0.6
0.8
1Extraction 2: 2009-2011
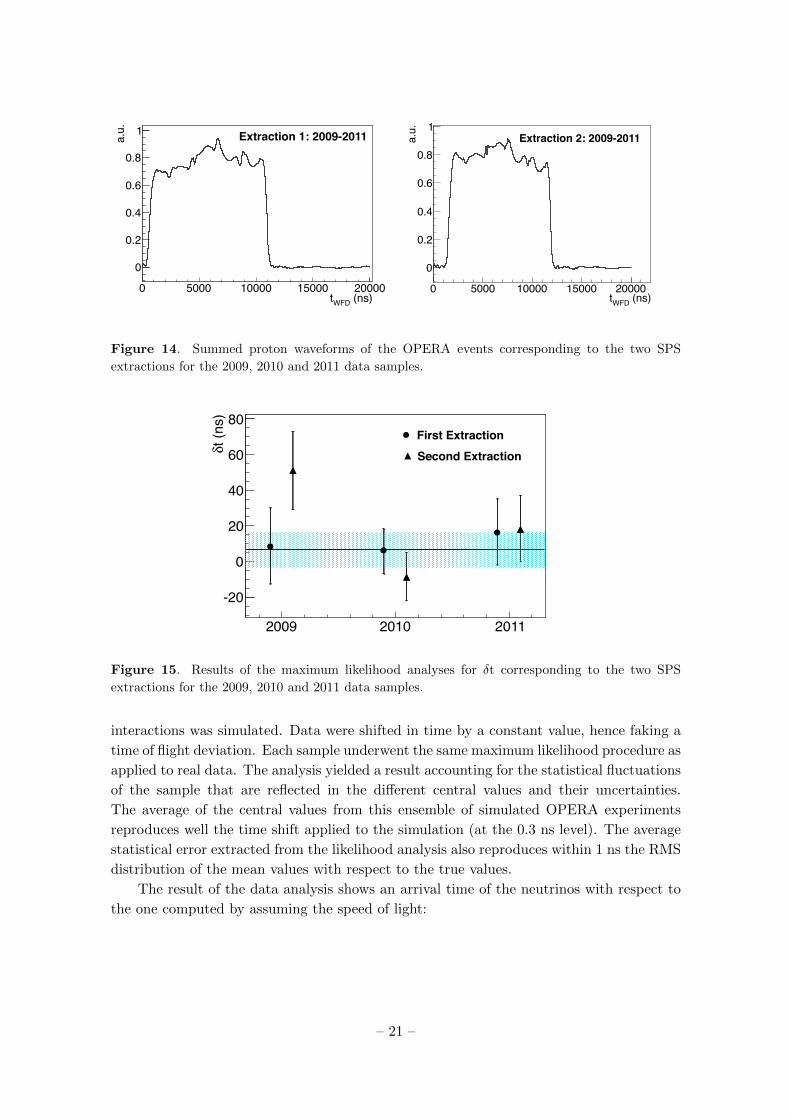
Figure 14. Summed proton waveforms of the OPERA events corresponding to the two SPS
extractions for the 2009, 2010 and 2011 data samples.
2009 2010 2011
t (ns
)δ
-20
0
20
40
60
80First Extraction
Second Extraction
Figure 15. Results of the maximum likelihood analyses for δt corresponding to the two SPS
extractions for the 2009, 2010 and 2011 data samples.
interactions was simulated. Data were shifted in time by a constant value, hence faking a
time of flight deviation. Each sample underwent the same maximum likelihood procedure as
applied to real data. The analysis yielded a result accounting for the statistical fluctuations
of the sample that are reflected in the different central values and their uncertainties.
The average of the central values from this ensemble of simulated OPERA experiments
reproduces well the time shift applied to the simulation (at the 0.3 ns level). The average
statistical error extracted from the likelihood analysis also reproduces within 1 ns the RMS
distribution of the mean values with respect to the true values.
The result of the data analysis shows an arrival time of the neutrinos with respect to
the one computed by assuming the speed of light:
– 21 –
t (ns)Δ0 5000 10000
Eve
nts
/ bin
0
20
40
60
80
100
120
140
160
t (ns)Δ0 5000 10000
Eve
nts
/ bin
0
20
40
60
80
100
120
140
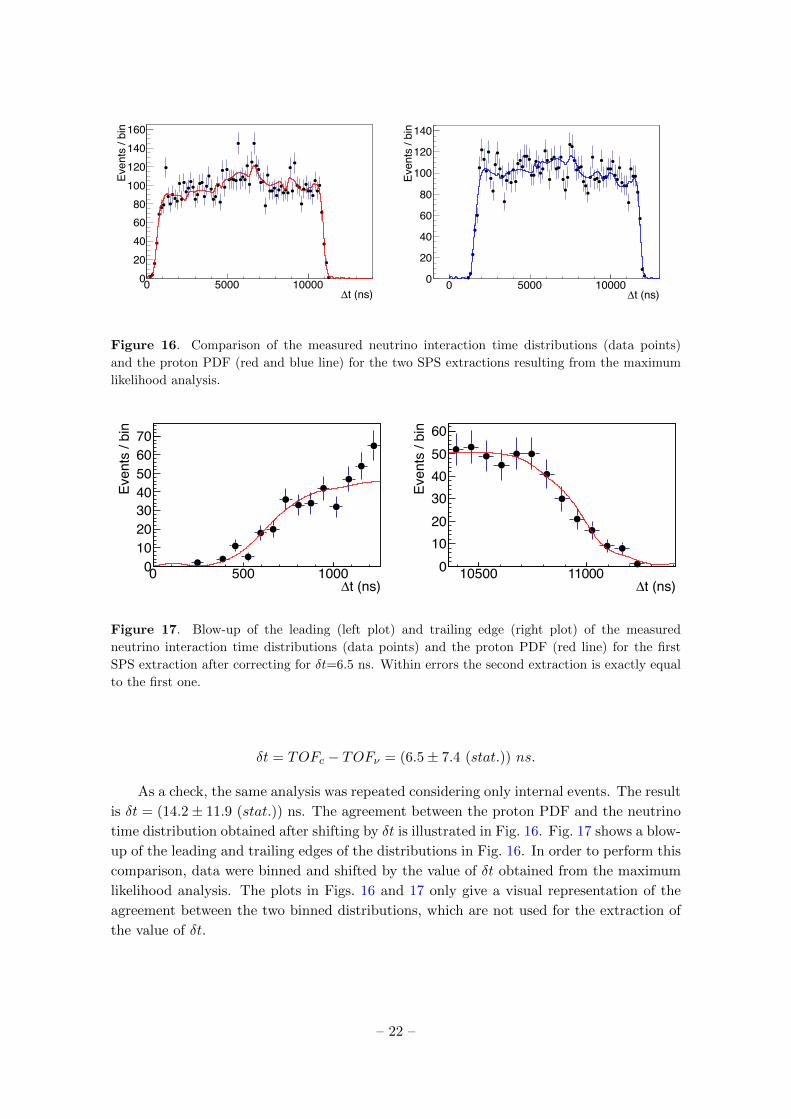
Figure 16. Comparison of the measured neutrino interaction time distributions (data points)
and the proton PDF (red and blue line) for the two SPS extractions resulting from the maximum
likelihood analysis.
t (ns)Δ0 500 1000
Eve
nts
/ bin
010203040506070
t (ns)Δ10500 11000
Eve
nts
/ bin
0
10
20
30
40
50
60
Figure 17. Blow-up of the leading (left plot) and trailing edge (right plot) of the measured
neutrino interaction time distributions (data points) and the proton PDF (red line) for the first
SPS extraction after correcting for δt=6.5 ns. Within errors the second extraction is exactly equal
to the first one.
δt = TOFc − TOFν = (6.5± 7.4 (stat.)) ns.
As a check, the same analysis was repeated considering only internal events. The result
is δt = (14.2± 11.9 (stat.)) ns. The agreement between the proton PDF and the neutrino
time distribution obtained after shifting by δt is illustrated in Fig. 16. Fig. 17 shows a blow-
up of the leading and trailing edges of the distributions in Fig. 16. In order to perform this
comparison, data were binned and shifted by the value of δt obtained from the maximum
likelihood analysis. The plots in Figs. 16 and 17 only give a visual representation of the
agreement between the two binned distributions, which are not used for the extraction of
the value of δt.
– 22 –

Figure 18. Residuals of the data points with respect to the PDF, after correcting for δt, as a
function of the time since the start of the extraction. A linear fit superimposed to the experimental
points gives results compatible with a flat distribution. The slope value is given in number of
events/ns. Within errors the second extraction is exactly equal to the first one.
The χ2/ndf for the full distribution is 1.1 for the first extraction and 1.0 for the second
one.
Fig. 18 shows the residuals of the data points with respect to the PDF as a function
of the time since the start of the extraction. No evidence is found for a time dependence.
Several additional statistical checks, such as the determination of δt by a χ2 fit of
the two distributions, or of parts of them separately (central region, leading and trailing
edges) were performed to compare the proton PDF with the neutrino event distribution.
These tests provided results comparable to those of the maximum likelihood analysis. None
of them revealed any systematic effect within the present statistical accuracy, confirming
the assumption that the neutrino event time distributions and the PDF are statistically
equivalent.
An alternative method to extract the value of δt consists in building the likeli-
hood function by associating each neutrino interaction to its waveform instead of using the
global PDF. This method can in principle lead to smaller statistical errors given the di-
rect comparison of each event with its related waveform. However, particular care must be
taken in filtering the electronic noise, white and coherent, that affects individual waveforms,
while it cancels out in the global PDF. The two extractions can be treated simultaneously
in the same likelihood function defined as :
L(δt) =∏j
Wj(tj + δt) (7.2)
Again, this procedure and the extraction of the statistical error were checked with a
simulation. This method leads to a value of δt = (3.5 ± 5.6 (stat.)) ns.
– 23 –

A systematic error of 4.4 ns is assigned to the different filtering methods and treatments
of the waveform baseline. This error and the errors listed in Table 2, add up to the total
systematic uncertainty of this result given in Section 8.
Finally, further investigations were conducted to search for possible systematic effects
in the neutrino production mechanism by the SPS proton beam as measured by the BCT.
The results are summarised below [46]:
1. The neutrino production target contains 13 graphite rods, each 10 cm long. The first
8 are interspaced by 9 cm, the last 5 by 2 mm. The diametre of the first two rods is 5
mm; the other rods have a diametre of 4 mm. The proton transfer from the BCT to
the target is practically lossless. The aiming accuracy to the target centre is within
50 (90) µm RMS on the horizontal (vertical) plane. The transport of the protons to
the target does not introduce any acceptance effect on the neutrino yield and on the
beam profile at LNGS, which is determined by the meson decay kinematics only.
2. Density variations of the target during the time of extraction are negligible. The
largest temperature increase in the graphite target corresponding to the point of
maximum energy deposition (occurring around the second and the third rod) was es-
timated with a detailed simulation based on FLUKA and on a finite-element thermo-
mechanical model of the target. This temperature increase corresponds on average
to 297 K, yielding a density reduction due to transverse dilatation of 0.3%, within
the 10.5 µs duration of the extraction. The total target thickness is 3.3 interaction
lengths. The local density variation at the point of maximum energy deposition trans-
lates into a small displacement of this point with a negligible effect on the number of
interacting protons, neutrino yield and timing distribution.
3. The current pulses of the horn and reflector magnets are 6.8 and 10 ms long, respec-
tively; this is well above the proton extraction duration of 10.5 µs. The timing of
the pulses is centred on the proton extractions and is continuously monitored. This
timing is not critical with respect to the focalisation efficiency: tests were performed
by artificially shifting the pulses of the magnets by as much as 100 µs. These extreme
conditions produced a decrease of the muon flux associated to the neutrino beam by
less than 1%, confirming the focalisation stability with respect to the pulse timing
under normal operating conditions.
8 Results
The delay values used to derive the final δt are summarised in Table 1. One then obtains
δt = TOFc − TOFν = (6.5 ± 7.4 (stat.)) ns. This result is also affected by an overall
systematic uncertainty of (-8.0, +8.3) ns coming from the combination of the different
terms already discussed and summarised in Table 2. The total systematic uncertainty
was computed numerically by taking into account the individual contributions and their
corresponding probability distributions. The dominant uncertainty is due to the calibration
of the BCT time response. The error in the CNGS-OPERA GPS synchronisation has
– 24 –

been computed by adding in quadrature the uncertainties on the calibration performed by
PTB and the internal errors of the two high-accuracy GPS systems. The final systematic
uncertainty is asymmetric. For external events, the position of the neutrino interaction in
the rock is unknown and, in particular, its transverse position with respect to the detector.
The distribution of the uncertainty on this position is flat. This systematically leads to an
apparent increase of the neutrino time of flight TOFν and thus to a systematic decrease of
δt.
The final result of the measurement is then:
δt = TOFc − TOFν = (6.5± 7.4 (stat.) +8.3−8.0 (sys.)) ns
The relative difference of the muon neutrino velocity with respect to the speed of light
is:
(v − c)/c = δt/(TOF ′c − δt) = (2.7± 3.1 (stat.) +3.4−3.3 (sys.))× 10−6
In performing this last calculation a baseline of 730.085 km was used, and TOF ′c cor-
responds to this effective neutrino baseline starting from the average meson decay point in
the CNGS-CERN tunnel as determined by simulations. Actually, the δt value is measured
over the distance from the BCT to the OPERA reference frame, and it is only determined
by neutrinos and not by charged pions and kaons, which introduce negligible delays.
The alternative analysis in which the likelihood function is built by associating each
neutrino interaction to its waveform instead of using the global PDF leads to a compatible
value of δt = (3.5 ± 5.6 (stat.)+9.4−9.1(sys.)) ns. The systematic uncertainty includes the
additional contribution of 4.4 ns resulting from more complex noise filtering and baseline
treatment of the waveforms.
The dependence of δt on the neutrino energy was also investigated, yielding a null
result.
9 Test with a short-bunch wide-spacing beam
In order to exclude possible systematic effects related to the use of the proton waveforms
as PDF for the distributions of the neutrino arrival times within the two extractions and to
their statistical treatment, a test was performed with a dedicated CNGS beam generated
by a proton beam set up on purpose for the neutrino velocity measurement. The modified
SPS super-cycle consisted of a single extraction including four bunches about 3 ns long
(FWHM) separated by 524 ns, yielding a total of 1.1× 10¹² protons per cycle. One typical
proton extraction read out by the BCT is shown in Fig. 19, while Fig. 20 shows an expanded
view of an individual bunch waveform. This beam is similar to the one used for the BCT
calibration discussed in Section 6 and it allowed performing time of flight measurements
at the single event level.
Running with the CNGS bunched beam lasted from October 22 to November 6, 2011
for a total integrated intensity of 4 × 10¹⁶ protons on target. A total of 35 beam-related
neutrino events were collected by OPERA. The events were then selected and reconstructed
– 25 –

Table 2. Contribution to the overall systematic uncertainty on the measurement of δt.
Error source ns Error distribution
Baseline (20 cm) 0.67 Gaussian
Meson decay point 0.2 Exponential (1 side)
Interaction point of external neutrino events 2.0 Flat (1 side)
CTRI signal propagation through GMT chain ∆tUTC 2.0 Gaussian
Kicker magnet signal to WFD ∆ttrigger 1.0 Gaussian
BCT calibration ∆tBCT 5.0 Gaussian
CNGS-OPERA GPS synchronisation 1.7 Gaussian
LNGS 8.3 km fibre to OPERA Master Clock 3.7 Gaussian
Master Clock to FPGA ∆tclock 1.0 Gaussian
TT PMT signal to FPGA 2.3 Gaussian
TT timing simulation of ν interactions 3.0 Gaussian
FPGA latency 1.0 Gaussian
RPC signal formation 5.0 Gaussian
RPC signal propagation 1.0 Gaussian
RPC FEB delay 1.0 Gaussian
RPC DAQ clock trasmission 2.0 Gaussian
RPC FPGA calibration 1.0 Gaussian
RPC plane disuniformity 3.9 Gaussian
Total systematic uncertainty for TT based analysis −8.0,+8.3
Total systematic uncertainty for RPC based analysis −9.6,+9.9
in the same way as those used for the main analysis. After selection, 6 internal and 14
external events were retained. Within the small statistics the events are evenly distributed
in the four bunches of the extraction.
Given the short bunch length and the relatively long inter-bunch distance one could
unambiguously associate each neutrino event to its corresponding proton bunch. The price
to pay for achieving such a high definition of the neutrino emission time is the very low
beam intensity, on the average about 60 times lower than for normal CNGS operation.
9.1 Results with the Target Tracker data
Fig. 21 shows the distribution of the values of δt obtained for the events detected by the
TT during the bunched beam test. The RMS is 16.5 ns and the average is (−1.9± 3.7) ns
in agreement with the value of (6.5± 7.4) ns obtained with the main analysis; it is also in
agreement with the ICARUS result reported in [47]. At first order, systematic uncertainties
related to the bunched beam operation are equal or smaller than those affecting the result
with the nominal CNGS beam. The main contributions to the dispersion are given by the
– 26 –

6000 6500 7000 7500 8000time [ns]
524 nsarb
itra
ry u
nit
s
-26
-24
-22
-20
-18
-16
-14
-12
-10
-8
Figure 19. Timing structure of the four-bunch proton extraction of the dedicated CNGS bunched
neutrino beam as read out by the BCT detector.
7600 7610 7620 7630 7640
-26
-24
-22
-20
-18
-16
-14
-12
-10
-8
time [ns]
σ∼1.8 ns
arb
itra
ry u
nit
s
Figure 20. Timing structure for one individual proton bunch (folded with the BCT time response).
TT response of 7.3 ns RMS, the DAQ time granularity of 10 ns full width, and the jitter
of ± 25 ns related to the tagging of the external GPS signal by the OPERA Master Clock.
The latter dominant term results in a RMS of 14.4 ns (50 ns/√
12). This dispersion is only
relevant for the bunched beam measurement; nevertheless the statistical accuracy on the
average δt is already as small as 3.7 ns with only 20 events.
This result largely excludes possible biases affecting the statistical analysis based on
the proton PDF. It also indicates the absence of significant biases due to the cumulative
– 27 –

Entries 20Mean -1.85RMS 16.49
t (ns)δ-80 -60 -40 -20 0 20 40 60 80
Eve
nts
/ 5 n
s bi
n
0
0.5
1
1.5
2
2.5
3 Entries 20Mean -1.85RMS 16.49
Figure 21. Distribution of the δt values obtained from the 20 TT events taken with the bunched
neutrino beam. The mean value is (−1.9± 3.7) ns.
response of the beam line to long proton pulses (target aiming accuracy, horns’ timing,
target temperature increase), as well as pulse duration effects in the BCT response. More-
over, since waveform filtering does not apply, the above considerations concern as well the
procedure adopted for removing the noise.
9.2 Results with the RPC data
Each of the two OPERA magnets is instrumented with 22 planes of Resistive Plate Cham-
bers (RPC) [1]. In each plane, copper readout strips measuring the electric signal generated
by the crossing of a charged particle through the gas gap provide horizontal and vertical
coordinates in the detector transverse plane. In addition, the DAQ records for each plane
the time stamp of the earliest signal reaching the readout electronics. An independent time
calibration of the RPC was performed in order to translate the time measured locally in
UTC time.
With the magnetic spectrometers the momentum and the charge sign of the high
energetic muons (mainly from νµ CC interactions) leaving the target are measured. Hits
not attached to a muon track are ignored as they can be due to noise or particles out of
time with respect to the neutrino interaction. Every RPC plane provides an independent
time measurement along each muon track at a known position along the detector. This
sequence of independent time measurements, corrected for all delays, can then be time
translated to the origin of the OPERA reference frame and averaged. As the number
of measurements ranges between about 20 to about 40 for a track crossing both Super
Modules the 10 ns DAQ time quantisation affecting single measurements is washed out.
For tracks crossing the full detector, two independent measurements can be extracted, one
– 28 –
for each Super Module separately. The distribution of the difference between the two mean
times was obtained for muon tracks collected during the full 2011 run. Its mean is 0.4 ns
with an RMS of 5.5 ns.
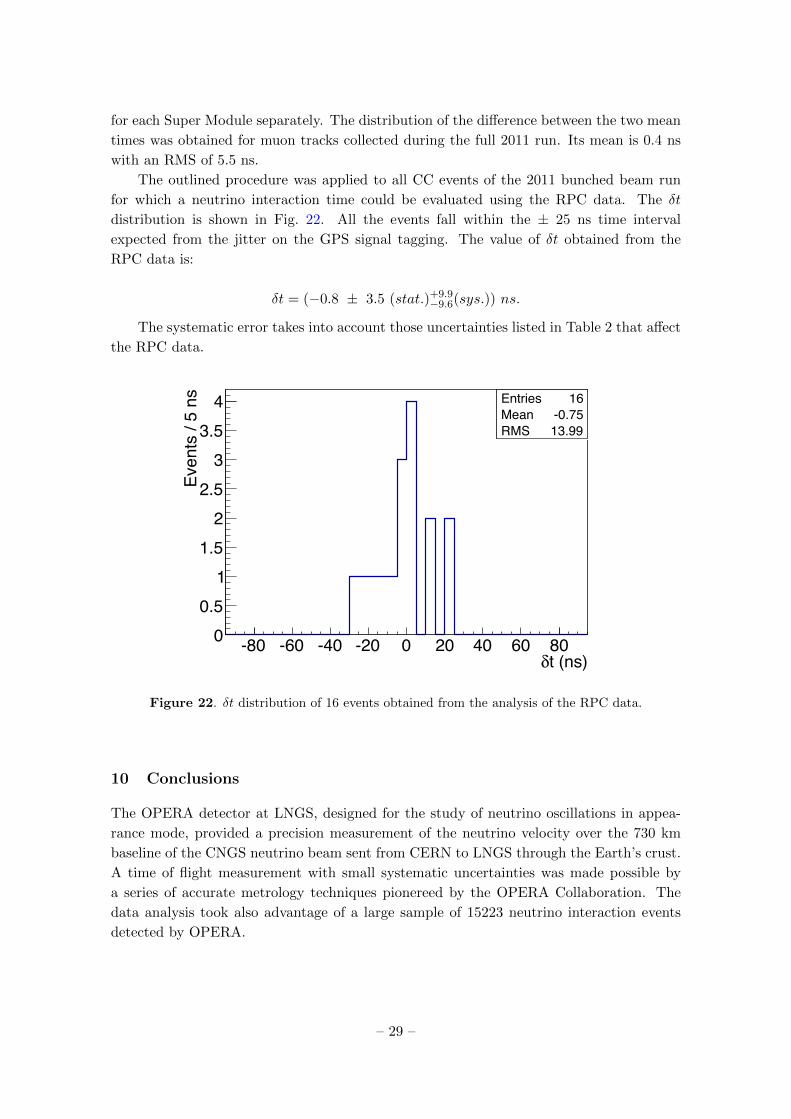
The outlined procedure was applied to all CC events of the 2011 bunched beam run
for which a neutrino interaction time could be evaluated using the RPC data. The δt
distribution is shown in Fig. 22. All the events fall within the ± 25 ns time interval
expected from the jitter on the GPS signal tagging. The value of δt obtained from the
RPC data is:
δt = (−0.8 ± 3.5 (stat.)+9.9−9.6(sys.)) ns.
The systematic error takes into account those uncertainties listed in Table 2 that affect
the RPC data.
Entries 16Mean -0.75RMS 13.99
t (ns)δ-80 -60 -40 -20 0 20 40 60 80
Eve
nts
/ 5 n
s
0
0.5
1
1.5
2
2.5
3
3.5
4 Entries 16Mean -0.75RMS 13.99
Figure 22. δt distribution of 16 events obtained from the analysis of the RPC data.
10 Conclusions
The OPERA detector at LNGS, designed for the study of neutrino oscillations in appea-
rance mode, provided a precision measurement of the neutrino velocity over the 730 km
baseline of the CNGS neutrino beam sent from CERN to LNGS through the Earth’s crust.
A time of flight measurement with small systematic uncertainties was made possible by
a series of accurate metrology techniques pionereed by the OPERA Collaboration. The
data analysis took also advantage of a large sample of 15223 neutrino interaction events
detected by OPERA.
– 29 –
The analysis of internal neutral current and charged current events, and external νµCC interactions from the 2009, 2010 and 2011 CNGS data was carried out to measure the
neutrino velocity, v. The sensitivity of the measurement of (v − c)/c is about one order of
magnitude better than former accelerator neutrino experiments.
The results of the study using CNGS muon neutrinos with an average energy of 17
GeV indicate a neutrino arrival time compatible within errors to the one computed by
assuming the speed of light in vacuum:
δt = (6.5± 7.4 (stat.)+8.3−8.0(sys.)) ns.
The corresponding relative difference of the muon neutrino velocity and the speed of
light is:
(v − c)/c = (2.7± 3.1 (stat.)+3.4−3.3(sys.))× 10−6.
An alternative analysis in which the likelihood function is built by associating each
neutrino interaction to its waveform instead of using the global PDF leads to a compatible
value of δt = (3.5 ± 5.6 (stat.)+9.4−9.1(sys.)) ns affected by an additional contribution to the
systematic error.
The dependence of δt on the neutrino energy was also investigated yielding a null effect.
To exclude possible systematic effects related to the use of the proton waveforms as
PDF for the distributions of the neutrino arrival times within the two extractions and
to their statistical treatment, a two-week long beam test was performed at the end of
2011. A dedicated CNGS beam was generated by an SPS proton beam set up for the
purpose of the neutrino velocity measurement. The modified beam consisted of a single
extraction including four bunches about 3 ns long (FWHM) separated by 524 ns. With an
integrated beam intensity of 4×10¹⁶ protons on target a total of 20 TT and 16 RPC events
were retained, leading to a value of δt measured from the average of the TT distribution
of (−1.9 ± 3.7) ns and (−0.8 ± 3.5) ns from the RPC, in agreement with the value of
(6.5 ± 7.4) ns obtained with the main analysis. At first order, systematic uncertainties
related to the bunched beam operation are equal or smaller than those affecting the result
obtained with the standard CNGS beam.
After several months of additional studies, with the new results reported in this paper,
the OPERA Collaboration has completed the scrutiny of the originally reported neutrino
velocity anomaly by identifying its instrumental sources and coming to a coherent inter-
pretation scheme.
11 Acknowledgements
We thank CERN for the successful operation of the accelerator complex and the CNGS
facility, and for the prompt setting up of the bunched proton beam. We are indebted to
INFN for the continuous support given to the experiment during the construction, instal-
lation and commissioning phases through its LNGS laboratory. Funding from our national
– 30 –

agencies is warmly acknowledged: Fonds de la Recherche Scientifique - FNRS and Insti-
tut Interuniversitaire des Sciences Nucleaires for Belgium; MoSES for Croatia; CNRS and
IN2P3 for France; BMBF for Germany; INFN for Italy; JSPS (Japan Society for the Promo-
tion of Science), MEXT (Ministry of Education, Culture, Sports, Science and Technology),
QFPU (Global COE program of Nagoya University, ”Quest for Fundamental Principles
in the Universe” supported by JSPS and MEXT) and Promotion and Mutual Aid Cor-
poration for Private Schools of Japan for Japan; The Swiss National Science Foundation
(SNF), the University of Bern and ETH Zurich for Switzerland; the Russian Foundation
for Basic Research(grant 09-02-00300 a), the Programs of the Presidium of the Russian
Academy of Sciences “Neutrino Physics” and “Experimental and theoretical researches of
fundamental interactions connected with work on the accelerator of CERN”, the Programs
of support of leading schools (grant 3517.2010.2), and the Ministry of Education and Sci-
ence of the Russian Federation for Russia (contract 12.741.12.0150); the Korea Research
Foundation Grant (KRF-2008-313-C00201) for Korea; and TUBITAK The Scientific and
Technological Research Council of Turkey, for Turkey. We are also indebted to INFN for
providing fellowships and grants to non-Italian researchers. We thank the IN2P3 Comput-
ing Centre (CC-IN2P3) for providing computing resources for the analysis and hosting the
central database for the OPERA experiment. We gratefully acknowledge the support of
the LNGS Computing Centre and of the INFN-Bologna Electronic Lab. We are indebted
to our technical collaborators for the excellent quality of their work over many years of
design, prototyping and construction of the detector and of its facilities.
References
[1] OPERA Collaboration, R. Acquafredda et al., JINST 4 (2009) P04018.
[2] A. Ereditato, K. Niwa and P. Strolin, “The emulsion technique for short, medium and long
baseline νµ → ντ oscillation experiments” 423, INFN-AE-97-06, DAPNU-97-07;
OPERA collaboration, H. Shibuya et al.,“Letter of intent: the OPERA emulsion detector for
a long-baseline neutrino-oscillation experiment”, CERN-SPSC-97-24, LNGS-LOI-8-97;
OPERA collaboration, M. Guler et al., “An appearance experiment to search for νµ → ντoscillations in the CNGS beam: experimental proposal”, CERN-SPSC-2000-028, LNGS
P25/2000;
OPERA collaboration, M. Guler et al., “Status Report on the OPERA experiment”,
CERN/SPSC 2001-025, LNGS-EXP 30/2001 add. 1/01;
OPERA Collaboration, N. Agafonova et al., Phys. Lett. B 691 (2010) 138;
OPERA Collaboration, N. Agafonova et al., New J. Phys. 14 (2012) 033017.
[3] Ed. K. Elsener, “The CERN Neutrino beam to Gran Sasso” (Conceptual Technical Design),
CERN98-02, INFN/AE-98/05;
R. Bailey et al., “The CERN Neutrino beam to Gran Sasso (CNGS)” (Addendum to CERN
98-02, INFN/AE-98/05), CERN-SL/99-034(DI), INFN/AE-99/05.
[4] Ch. Weinheimer et al., Phys. Lett. B 460 (1999) 219;
Ch. Weinheimer et al., Phys. Lett. B 464 (1999) 352;
M. Lobashev et al., Phys. Lett. B 460 (1999) 227.
[5] G. R. Kalbfleisch , Phys. Rev. Lett. 43, 1361 (1979);
– 31 –

J. Alspector et al., Phys. Rev. Lett. 36, 837 (1976).
[6] MINOS Collaboration, P. Adamson at al., Phys. Rev. D 76 (2007) 072005.
[7] K. Hirata et al., Phys. Rev. Lett. 58 (1987) 1490;
R. M. Bionta et al., Phys. Rev. Lett. 58 (1987) 1494;
M. J. Longo, Phys. Rev. D 36 (1987) 3276.
[8] OPERA Collaboration, T. Adam et al., “Measurement of the neutrino velocity with the
OPERA detector in the CNGS beam”, arXiv:1109.4897v2 [hep-ex].
[9] Hamamatsu Photonics K.K., Electron Tube Center, 314-5, Shimokanzo, Toyooka-village,
Iwata-gun, Shizuoka-ken 438–0193, Japan.
[10] T. Adam et al., Nucl. Instr. and Meth. A 577 (2007) 523.
[11] http://www.symmetricom.com/products/gps-solutions/
gps-time-frequency-receivers/XLi/.
[12] H. Jacob et al., “A 40 MHz bunch by bunch intensity measurement for the CERN SPS and
LHC”, CERN-AB 2003-056 BDI.
[13] Agilent Acqiris digitiser model DP110: http://www.agilent.com/; Technical support -
Manuals - Part number U1067A.
[14] K. Nakamura et al. (Particle Data Group), J. Phys. G 37, 075021 (2010).
[15] FLUKA software package: http://www.fluka.org/;
CNGS neutrino flux calculations: http://www.mi.infn.it/~psala/Icarus/cngs.html;
G. Battistoni et al., “The FLUKA code: Description and benchmarking”, AIP Conference
Proceedings, 896 (2007) 31.
[16] OPERA Collaboration, N. Agafonova et al., New J. Phys. 13 (2011) 053051.
[17] P. Defraigne et al., “Initial testing of a new GPS receiver, the PolaRx2e, for time and
frequency transfer using dual frequency codes and carrier phases”, in 35th Annual Precise
Time and Time Interval (PTTI) Meeting.
[18] D. W. Allan and M. A. Weiss, “Accurate time and frequency transfer during common-view
of a GPS satellite”, in: Proc. 34th Ann. Freq. Control Symposium, USAERADCOM, Ft.
Monmouth, WJ 07703, May 1980.
[19] “Symmetricon frequency standards, Symmetricom, Time and Frequency System”,
http://www.symmetricom.com/products/frequency-references/
cesium-frequency-standard/Cs4000/.
[20] D. Allan and C. Thomas, Metrologia 31, 1994;
J. Asoubin and W. Lewandowksi, CGGTTS GPS/GLONASS Data Format V02, BIPM
November 1998.
[21] P. Defraigne and G. Petit, Metrologia, 40, 184 (2003);
J. Levine, Metrologia, 45, 184 (2008).
[22] METAS Measurement Reports No 119-00210, No 119-00209, “Differential calibration of
matched GPS receiver, antenna and cable against reference GPS link METAS WAB2 CH01
for P3 common-view time transfer” , Physikalisch-Technische Bundesanstalt (PTB),
http://www.ptb.de.
– 32 –
[23] T. Feldmann, “Relative calibration of the GPS time link between CERN and LNGS, Report
calibration CERN-LNGS 2011”, OPERA public note 134 (2011),
http://operaweb.lngs.infn.it:2080/Opera/publicnotes/note134.pdf.
[24] T. Feldmann et al., “Advanced GPS-based time link calibration with PTB’s new GPS
calibration setup”, 42nd Annual Precise Time and Time Interval (PTTI) Meeting.
[25] IERS, http://www.iers.org/nn_11216/IERS/EN/IERSHome/home.html;
C. Boucher and Z. Altamimi, Memo “Specifications for reference frame fixing in the analysis
of a EUREF GPS campaign”, http://etrs89.ensg.ign.fr/memo-V7.pdf.
[26] G. Colosimo, M. Crespi, A. Mazzoni, F. Riguzzi, M. Jones and D. Missiaen, “Determination
of the CNGS global geodesy”, OPERA public note 132 (2011),
http://operaweb.lngs.infn.it:2080/Opera/publicnotes/note132.pdf.
[27] EUREF Permanent Network, http://www.epncb.oma.be/.
[28] IERS Conventions 2003,
http://www.iers.org/IERS/EN/Publications/TechnicalNotes/tn32.html.
[29] J. Marteau for the OPERA Collaboration, Nucl. Instr. and Meth. A 617 (2010) 291.
[30] OPERA Collaboration, R. Acquafredda et al., New J. Phys. 8 (2006) 303.
[31] A. Bertolin and N. T. Tran, “OpCarac: an algorithm for the classification of the neutrino
interactions recorded by OPERA”, OPERA public note 100 (2009);
http://operaweb.lngs.infn.it:2080/Opera/publicnotes/note100.pdf.
[32] P. Alvarez, The CTR user guide, 17 July 2007, CERN EDMS document of the beam timing
group; J. Serrano et al., “Nanosecond level UTC timing generation and stamping in the
CERN’s LHC”, proceedings of ICALEPCS2003, 119 (2003).
[33] J. Lewis et al., “The evolution of the CERN SPS timing system for the LHC era”,
proceedings of ICALEPCS2003, 125 (2003).
[34] J. Serrano et al., “Inter-laboratory synchronisation for the CNGS project”, proceedings of
EPAC2006, 3092 (2006).
[35] L. Jensen, “Beam instrumentation for the CNGS facility”, AB-Note-2006-022 BI.
[36] Master Clock GPS 2000, http://www.esat.it/EN/default.htm;
M. Ambrosio, et al., Phys. Rev. D 62 (2000) 052003.
[37] MACRO Collaboration, M. Ambrosio et al., Nucl. Instr. and Meth. A 486 (2002) 663.
[38] A. Lucotte et al., Nucl. Instr. and Meth. A 521 (2004) 378392.
[39] A. L.S. GmbH, “The picosecond laser diode systems”,
http://www.alsgmbh.com/pilas.htm.
[40] E. Kiritsitis and F. Nitti, “Special and general relativity corrections to the OPERA neutrino
velocity measurement”, OPERA public note 136 (2011),
http://operaweb.lngs.infn.it:2080/Opera/publicnotes/note136.pdf.
[41] G. Brunetti, PhD thesis, in joint supervision from Universite Claude Bernard Lyon-I and
Universita di Bologna, “Neutrino velocity measurement with the OPERA experiment in the
CNGS beams”, 2011, http://operaweb.lngs.infn.it:
2080/Opera/ptb/theses/theses/Brunetti-Giulia_phdthesis.pdf.
– 33 –

[42] OPERA Collaboration, “Report from the OPERA Collaboration to the scientific committees
on recent achievements concerning the neutrino velocity analysis”, memo to the SPS and
LNGS scientific committees, 28 March 2012, http://operaweb.lngs.infn.it:
2080/Opera/ptb/pubref/pubref/OPERAReport0312toSC.pdf.
[43] A. Zichichi and A. Ereditato on behalf of LVD-OPERA Collaboration, “Determination of a
time-shift in the OPERA set-up using high energy horizontal muons in the LVD and
OPERA detectors”, memo to the SPSC and LNGSSC scientific committees, 28 March
2012, http://operaweb.lngs.infn.it:
2080/Opera/ptb/pubref/pubref/LVD-OPERA_15_V1-Final.pdf;
N. Yu. Agafonova et al., “Determination of a time-shift in the OPERA set-up using high
energy horizontal muons in the LVD and OPERA detectors.”, arXiv:1206.2488 [hep-ex],
submitted to EPJ Plus.
[44] MACRO Collaboration, M. Ambrosio et al., Phys. Lett. B 434 (1998) 451.
[45] C. Bovet et al., “The fast shaping ejection for beam transfer from the CPS to the CERN 300
GeV machine”, proceedings of Particle Accelerator Conference, S. Francisco, IEEE Trans.
Nucl. Sci. 20 (1973) 438;
M. Giovannozzi et al., “The CERN PS multi-turn extraction based on beam splitting in
stable islands of transverse phase space”, Design Report, CERN-2006-011.
[46] J.-M. Cravero, E. Gschwendtner and I. Kozsar, “Setting up of the CNGS horns during the
yearly CNGS beam start up”, EDMS Nr. 1166177, OPERA public note 137 (2011),
http://operaweb.lngs.infn.it:2080/Opera/publicnotes/note137.pdf;
L. Bruno and I. Efthymiopoulos, “CNGS target – explained”, OPERA public note 138
(2011), http://operaweb.lngs.infn.it:2080/Opera/publicnotes/note138.pdf.
[47] ICARUS Collaboration, M. Antonello et al., Phys. Lett. B 713 (2012) 17.
– 34 –