prepared by us bureau of reclamation · prepared by us bureau of reclamation ... lp linear...
TRANSCRIPT
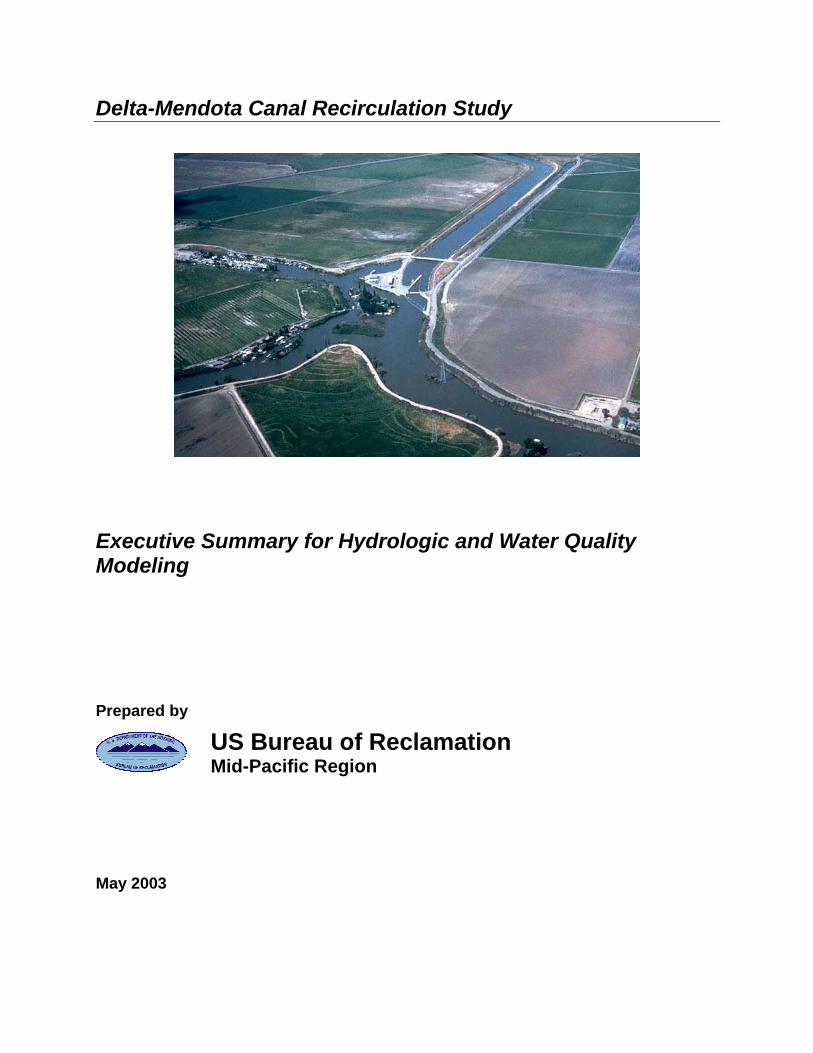
Delta-Mendota Canal Recirculation Study
Executive Summary for Hydrologic and Water QualityModeling
Prepared by
US Bureau of ReclamationMid-Pacific Region
May 2003

Delta-Mendota Canal Recirculation Study Executive Summary
USBR, Mid-Pacific Region I Delta-Mendota Canal Recirculation Study
TABLE OF CONTENTS
TABLE OF CONTENTS ................................................................................................................................ I
LIST OF TABLES .......................................................................................................................................... I
LIST OF FIGURES ........................................................................................................................................ I
ACRONYMS – ABREVIATION .................................................................................................................... II1. BACKGROUND.................................................................................................................................... 12. CONCEPT OF DMC RECIRCULATION .............................................................................................. 13. DEFINITION OF THE BASE CONDITION AND ALTERNATIVES ...................................................... 44. MODELING TOOLS USED .................................................................................................................. 55. FINDINGS OF THE HYDROLOGIC (WATER SUPPLY) MODELING.................................................. 6
5.1 Alternative 1 (VAMP Recirculation).............................................................................................. 66. FINDINGS OF THE WATER QUALITY MODELING .......................................................................... 14
6.1 Alternative 1 (VAMP Recirculation)............................................................................................ 146.2 Alternative 2 (Feb-Jun Vernalis Minimum Flow Recirculation)............................................... 15
Figure 6-1, DSM2 Sacramento/San Joaquin Delta Output Location ...............................................16
LIST OF TABLES
TABLE 5-1 (ALTERNATIVE 1 RESULTS) ............................................................................................................. 8TABLE 5-2 (ALTERNATIVE 2 RESULTS) ........................................................................................................... 11
LIST OF FIGURES
FIGURE 1-1. LOCATION MAP OF DELTA-MENDOTA CANAL RECIRCULATION STUDY AREA .................................... 2FIGURE 2-1. CONCEPTUAL REPRESENTATION OF DELTA-MENDOTA CANAL RECIRCULATION ............................... 3FIGURE 5-1. RECIRCULATION FLOW OF ALTERNATIVE 1 IN TAF......................................................................... 9FIGURE 5-2. RECIRCULATION FLOW OF ALTERNATIVE 2 IN TAF....................................................................... 12

Delta-Mendota Canal Recirculation Study Executive Summary
USBR, Mid-Pacific Region II Delta-Mendota Canal Recirculation Study
ACRONYMS – ABREVIATION
ANN Artificial Neural NetworkBay-Delta San Francisco Bay/Sacramento-San Joaquin Delta EstuaryBay-Delta Accord Principles for Agreement on Bay-Delta Standards between
The State of California and the Federal GovernmentBanks Pumping Plant Harvey O. Banks Pumping PlantCALSIM2 California Simulation Model IICCWD Contra Costa Water DistrictCFS cubicfoot per secondCVP Central Valley ProjectCVPIA Central Valley Project Improvement ActD-1641 Water Right Decision 1641Delta Sacramento – San Joaquin DeltaDFG Department of Fish and GameDMC Delta-Mendota CanalDSM2 Delta Simulation Model IIDWR California Department of Water ResourcesDWRSIM SWP/CVP Simulation ModelEOM End of MonthEWA Environmental Water AccountExchange Contractors San Joaquin River Exchange Contractors Water AuthorityJPOD joint point of diversionLOD Level of DevelopmentLP Linear ProgrammingM&I Municipal and IndustrialMerced ID Merced Irrigation DistrictMID Modesto Irrigation DistrictMILP Mixed Integer Linear ProgrammingNMFS National Marine Fisheries ServiceNOD North-of-DeltaOID Oakdale Irrigation DistrictPOA Plan of ActionPrinciples forAgreement
Principles for Agreement on Bay-Delta Standards betweenThe State of California and the Federal Government
PROSIM Project Simulation ModelReclamation Bureau of ReclamationROD Record of DecisionSANJASM San Joaquin River Simulation ModelSDWA South Delta Water AgencySJRA San Joaquin River AgreementSJRGA San Joaquin River Group AuthoritySJR10 San Joaquin River mass balance water quality modelSJTA San Joaquin Tributaries AssociationSOD South-of-DeltaSSJID South San Joaquin Irrigation DistrictStudy Delta-Mendota Canal Recirculation StudySWRCB State Water Resources Control BoardTAF thousand acre-footTID Turlock Irrigation DistrictUSACE United States Army Corps of EngineersUSFWS United States Fish and Wildlife ServicesVAMP Vernalis Adaptive Management PlanWQCP Water Quality Control Plan for San Francisco
Bay/Sacramento-San Joaquin Delta Estuary May 1995

Delta-Mendota Canal Recirculation Study Executive Summary
USBR, Mid-Pacific Region 1 Delta-Mendota Canal Recirculation Study
1. BACKGROUND
The Delta-Mendota Canal (DMC) Recirculation Study evaluates the benefits andimpacts of recirculating water pumped from the Sacramento-San Joaquin Delta (Delta)through a series of the Central Valley Project (CVP) facilities to the San Joaquin Riverto meet flow objectives at Vernalis. The Study was performed to satisfy therequirements set forth by the State Water Resources Control Board (SWRCB) throughits Water Right Decision 1641 (D-1641). Recirculation-related facilities include theTracy Pumping Plant, the DMC, the Newman Wasteway, and the San Luis Reservoir.Figure 1-1 shows the study area.
The Delta Mendota Canal (DMC) Recirculation study is an appraisal level study to beconducted in two phases. The first phase includes hydrologic (water supply) modelingand water quality modeling. The second phase includes fisheries studies, water andsediment sampling, a legal analysis, an economic analysis, public involvement, and thepreparation of a final study report. The scope of the modeling effort was to providesufficient information for Reclamation management to decide whether to proceed to thesecond phase of the project. If at the end of the appraisal study Recirculation appearsviable, then an extensive feasibility study, complete with environmental documentation,would be commenced. More detailed modeling to address unanswered questions fromthe appraisal study would also be conducted.
2. CONCEPT OF DMC RECIRCULATION
Recirculation uses water pumped at the CVP’s Tracy Pumping Plant to augment flow inthe San Joaquin River (Figure 2-1). Water is conveyed from Tracy Pumping Plant bythe DMC to milepost 54.38, where a portion is diverted to the Newman Wasteway andflows to the San Joaquin River near the San Joaquin/Merced River confluence. Once inthe San Joaquin River the water returns to the Delta meeting Vernalis flow and waterquality targets on the way.
The initiation of recirculation requires backfilling San Luis Reservoir water into theNewman Wasteway through operation of radial gates from Check Station 13 (nearO’Neill Forebay) to Check Station 10 (near the Newman Wasteway). This initiation ofrecirculation is termed “priming the system.” Once the recirculation operation hasended, the “priming” water is returned as soon as possible to the San Luis ReservoirCVP portion.
Recirculation imposes a new demand on the system, which depending on severalfactors, may be recoverable. The degree to which it is recoverable is estimated inmodel studies reported here and is manifested primarily in change in delivery to south ofdelta contractors and San Luis storage at its low point.

Delta-Mendota Canal Recirculation Study Executive Summary
USBR, Mid-Pacific Region 2 Delta-Mendota Canal Recirculation Study
Figure 1-1. Location Map of Delta-Mendota Canal Recirculation Study Area
G:\US_Bureau_Reclamation\DMC\DMCFinalReport_Regional.mxd
Delta-Mendota Canal
San Joaquin River
Figure 1-1. Location Map of DMC Recirculation Study Area
March 2003
Delta-Mendota Canal Recirculation Study
Newman Wasteway
$+Tracy Pumping Plant
San LuisReservoir
#
Merced River
Tuolumne River
Stanislaus River
California Aqueduct
Banks Pumping Plant
O'NeilForebay
New Don PedroReservoir
Lake McClure
New MelonesReservoir
E
Vernalis Gaging Station
Mendota Pool
±0 10 20 305
Miles
San Joaquin River

Delta-Mendota Canal Recirculation Study Executive Summary
USBR, Mid-Pacific Region 3 Delta-Mendota Canal Recirculation Study
Figure 2-1. Conceptual Representation of Delta-Mendota Canal Recirculation
Delta Outflow
Sacram
ento
River
BanksPumping Plant
TracyPumping Plant
San Luis Reservoirand O’Neil Forebay Newman
Wasteway
Stanislaus River
Tuolumne River
Merced River
New MelonesReservoir
New Don PedroReservoir
Lake McClure
MillertonLake
MendotaPool
San Joaquin River
San
Luis
Can
al
Del
ta-M
endo
ta C
anal
SSJID, OID
TID, MID
Merced IDEx
chan
g eC
o ntr
a cto
r s(S
JRE C
WA
)
Delta
Che
ck 1
3
Che
ck 9
Che
ck 1
0
Che
ck 1
1
Che
ck 1
2
O’N
eil F
oreb
ay
New
man
Was
tew
ay
Delta-Mendota Canal
Priming for Recirculation(Backfill from O’Neil Forebay to Newman Wasteway)
Major Waterway with FlowDirection
Major Storage/Facility withVAMP Flow Responsibility
Major Storage/Facility forRecirculation
Major Storage/Facility withoutVAMP Responsibility
Direction of San LuisPriming Flow
Direction of RecirculationReturn Flow
LEGEND
Direction of RecirculationFlow
Not to Scale
San
Joaq
uin
Rive
r

Delta-Mendota Canal Recirculation Study Executive Summary
USBR, Mid-Pacific Region 4 Delta-Mendota Canal Recirculation Study
3. DEFINITION OF THE BASE CONDITION AND ALTERNATIVES
Through continued consultation with the SWRCB, the Study has defined a BaseCondition and two recirculation alternatives that satisfy SWRCB’s requirements. Inaddition, fundamental guidelines for the Study are to observe current applicable waterrights, laws, regulations (including CVP and SWP pumping restrictions), contracts, andother operation principles and guidelines.
Base ConditionThe Base Condition is based on the CALSIM II September 2002 Benchmark Study for2001 level of development (ANN version). The Base Condition satisfies the studyrequirements listed in Condition 2 of D-16411, and study requirements listed inSWRCB’s March 21, 2000, letter2 to the USBR.
Alternative 1 (VAMP Recirculation)Alternative 1 includes the same assumptions as the Base Condition, except:
1. Recirculation will provide VAMP flow of up to 110 TAF per year during the April 15to May 15 pulse flow period per the SJRA. Recirculation flows are from Deltaexports of the Tracy Pumping Plant and, in some years, release from CVP San LuisReservoir storage. This action will relieve New Melones Reservoir, New Don PedroReservoir, Lake McClure, and the Exchange Contractors from VAMP flowresponsibility. It was assumed that fulfilling the VAMP flows had a higher prioritythan delivering water to CVP water contractors. Storage releases from San Luisreservoir would be required in years when Tracy export restrictions prevent thepumping of the total VAMP flow.
2. A storage release from San Luis Reservoir is required to initiate or prime therecirculation process.
Alternative 2 (Feb-Jun Vernalis Minimum Flow Recirculation) Alternative 2 includes the same assumptions as the Base condition, except:
1. Recirculation will provide flows to supplement releases from New Melones Reservoirto meet Vernalis minimum target flows (based on X2 position) during Februarythrough June, excluding the VAMP period. New Melones Reservoir will release forX2 minimum target flows of up to 75 TAF when storage and inflow conditions permit.Generally, the recirculation flow will be Delta export water from the Tracy PumpingPlant. In some years, Tracy export restrictions may prevent the pumping of the fullX2 augmentation flow in which case CVP storage will be released from San LuisReservoir.
1 SWRCB(2000), Revised Water Right Decision 1641, March 15, 2000, pg 153.2 SWRCB(2001), Letter of Acceptance of the Delta Mendota Canal Recirculation Study Plan of Action,addressed to Lester Snow, Bureau of Reclamation, Mid-Pacific Region, March 21, 2000, pg 153.

Delta-Mendota Canal Recirculation Study Executive Summary
USBR, Mid-Pacific Region 5 Delta-Mendota Canal Recirculation Study
4. MODELING TOOLS USED
The tools for hydrologic (water supply) and water quality evaluation are the CaliforniaSimulation Model (CALSIM) and the Delta Simulation Model 2 (DSM2), respectively.The outputs of CALSIM will be used as the hydrologic inputs of DSM2 for planningpurposes. These two models have very distinct model characteristics such assimulation time step and resolution in geographical representation.
4.1 The CALSIM II Model
The water supply analysis for the Study was accomplished using the CaliforniaSimulation Model II (CALSIM II). CALSIM II is a general-purpose planning simulationmodel under development by Reclamation and DWR to simulate operations ofCalifornia’s water resources system, specifically the CVP and SWP. On a monthly time-step, CALSIM II utilizes optimization techniques to route water through a network. Alinear programming (LP)/mixed integer linear programming (MILP) solver determines anoptimal set of decisions for each time period with a given set of weights and systemconstraints.
CALSIM II’s geographic coverage includes the valley floor drainage area of theSacramento and San Joaquin Rivers, the upper Trinity River, San Joaquin Valley,Tulare Basin, and southern California areas served by CVP and SWP. Although thefocus of CALSIM II is on major CVP and SWP facilities, operations of many otherfacilities are included to varying degrees.
4.2 The DSM2 Model
DSM2, developed by DWR, is a one-dimensional deterministic hydrodynamic and salttransport model for the Sacramento-San Joaquin Delta. DSM2 is comprised of anetwork of nodes and arcs, for which the channel geometry are specified. DSM2 hastwo modules: DSM2-HYDRO for hydrodynamics, and DSM2-QUAL for water quality.Electrical conductivity is used as a surrogate in salt transport calculation. The modelingarea of DSM2 covers the entire legal Delta: Sacramento River downstream of the Cityof Sacramento, San Joaquin River downstream of Vernalis, and Sacramento-SanJoaquin Delta east of the Benicia Bridge. The simulation time step is 15 minutes.
An extension of DSM2 along the mainstem of the San Joaquin River (DSM2-SJR) wasdeveloped by DWR in year 2000 because many Delta water supply, water quality, andfishery issues are closely linked to conditions in the San Joaquin River. The modelingarea of DSM2-SJR is along the San Joaquin River mainstem from the Bear Creekconfluence to Vernalis. The outputs of DSM2 include the flow, stage, and water qualityat selective reporting locations. The model linkage developed in this Study is limited toDSM2-SJR’s modeling area.

Delta-Mendota Canal Recirculation Study Executive Summary
USBR, Mid-Pacific Region 6 Delta-Mendota Canal Recirculation Study
5. FINDINGS OF THE HYDROLOGIC (WATER SUPPLY) MODELING
The findings of the water supply modeling are presented in the following paragraphsand tables. Before describing the findings, it is important to distinguish the actualimpacts to the system caused by an alternative from changes that are beyond theresolution of the model to calculate. Therefore, a 1-percent or 5.0 TAF threshold hasbeen designated for this study. Changes between an alternative and the base conditionthat are less than 1-percent or 5.0 TAF are not considered impacts due to recirculation.
5.1 Alternative 1 (VAMP Recirculation)
DMC recirculation could be used to supplement San Joaquin River flow during the 31-day pulse flow period (April 15 through May 15), in lieu of the releases from tributaryreservoirs (New Melones Reservoir, New Don Pedro Reservoir, and Lake McClure).The major impact would be to SOD CVP delivery, which would be reduced to facilitaterecirculation flow. Recirculation would have limited impacts on reservoir operation,CVP/SWP deliveries north of Delta, and reservoir storage in San Luis Reservoir.Results of the Alternative 1 modeling are summarized in Table 5-1.
The following are key findings regarding Alternative 1 hydrologic and water supplyimpacts:
1) Annual average recirculation flows are about 44 TAF, ranging from zero to 110TAF. For the 73 years used in the simulation, recirculation flow would have beenrequired in 54 years (Figure 5-1).
2) Average required flow for recirculation purposes is 10, 60, 80, 69, and 27 TAF forwet, above normal, below normal, dry, and critical years, respectively. This flowdirectly reduces south of delta CVP deliveries.
3) Annual average SOD CVP deliveries were reduced by 43.5 TAF, which isequivalent to the average annual volume required for DMC recirculation. Themajority of the reductions occur during April and May (VAMP period) with adecrease in deliveries of 13.6 TAF (-8.4%) and 19.6 TAF (-8.0%) respectively.
4) Average end-of-August (San Luis low-point) storage for CVP San Luis woulddecrease by 6.8 TAF (-3.5 %).
5) Changes to NOD CVP deliveries and SOD SWP deliveries were both below the1% threshold and were not considered significantly impacted.
6) Impacts to NOD CVP and NOD SWP reservoir storage, and SWP San LuisReservoir all fell within the 1% or 5.0 TAF threshold and were not consideredsignificant.
7) Changes to CVP and SWP exports, including CVP wheeling, all fell within the 1%or 5.0 TAF threshold and were not considered significant.

Delta-Mendota Canal Recirculation Study Executive Summary
USBR, Mid-Pacific Region 7 Delta-Mendota Canal Recirculation Study
8) Average end-of-September storage in New Melones Reservoir, New Don PedroReservoir, and Lake McClure would increase by 27.6 TAF, 15.5 TAF, and 57.2TAF, respectively.
9) Releases from eastside tributary reservoirs during the VAMP pulse flow periodwere reduced. Note that in this Study, no alternative uses of this saved waterwere identified. As a result, these unused flows could be released outside of theVAMP pulse flow period; for example, pre-releases prior to the flood controlseason or to meet instream flows.

Delta-Mendota Canal Recirculation Study Executive Summary
USBR, Mid-Pacific Region 8 Delta-Mendota Canal Recirculation Study
Table 5-1 (Alternative 1 Results)
Result Average1
Base(TAF)
Average1
Alt. 1(TAF)
Average1
Diff2(TAF)
%Diff
(%)
SOD CVP Total Deliveries 2,442 2,399 -43.5 -1.8
SOD CVP April Deliveries 165 151 -13.6 -8.4
SOD CVP May Deliveries 253 234 -19.6 -8.0
SOD SWP Total Deliveries 2,906 2,912 5.1 0.3
NOD CVP Total Deliveries 2,206 2,204 -1.8 -0.1
CVP (Tracy) Total Exports 2,256 2,263 7.1 0.3
SWP (Banks) Total Exports 3,251 3,256 5.2 0.1
SWP (Banks) Exports for SWP 3,021 2,028 7.7 0.2
SWP (Banks) Exports for CVP 132 130 -2.5 -1.8
CVP San Luis EOM Aug Storage 200 193 -6.8 -3.5
SWP San Luis EOM Aug Storage 301 304 2.6 1.3
CVP NOD Reservoirs3 EOM SepStorage
3,257 3,252 -4.1 -0.2
SWP NOD Reservoirs4 EOM SepStorage
1,989 1,989 -0.2 0.0
New Melones EOM Sep Storage 1,323 1,351 27.6 2.7
Don Pedro EOM Sep Storage 1,355 1,370 15.5 1.4
Lake McClure EOM Sep Storage 468 525 57.2 24.0
Notes:1 Average for all water year types (1922-1994)2 Average difference (Recirculation – Base) for all water year types, (1922-1994)3 Wiskeytown Lake, Shasta Lake, Keswick Reservoir, Folsom Lake, Lake Natomas4 Lake Oroville, Themalito Forebay

Delta-Mendota Canal Recirculation Study Executive Summary
USBR, Mid-Pacific Region 9 Delta-Mendota Canal Recirculation Study
Figure 5-1. Recirculation Flow of Alternative 1 in TAF
(a) April 15-31
21
6
33 33
11
52
28 27
7
22
8
47
83
61
44
11 12
28
15
5144
26
14
46 43
72
26 2619
25
6270
3946
3
17 17
0
6053
24
159 7
35
0
20
40
60
80
100
120
Water Year
Ann
ual F
low
in T
AF
(b) May 1-15
40
13
4752 48
58
34 36
48
28
18
2938
63
41
16
49
31
51
1923
38
28
57
4435
14
51
37 38 35
66
42
29 31
4840
5244
9
30
4
21 2319
26
7
5057
34
2315 11
34
0
20
40
60
80
100
120
Water Year
Ann
ual F
low
in T
AF
(c) Annual Total
61
19
8085
59
110
62 6455
50
26 2938
110
48
19
110
31
94
3035
66
43
109
88
60
27
96
80
110
61
92
6154
31
110 110
9190
12
30
4
21
4036
27
7
110 110
58
38
2418
69
0
20
40
60
80
100
120
Water Year
Ann
ual F
low
in T
AF
Average 44 TAF
Average 18 TAF
Average 26 TAF

Delta-Mendota Canal Recirculation Study Executive Summary
USBR, Mid-Pacific Region 10 Delta-Mendota Canal Recirculation Study
5.2 Alternative 2 (Feb –Jun Vernalis Minimum Flow Recirculation)
DMC recirculation could be used to supplement San Joaquin River flow in addition tothe releases from New Melones Reservoir during February through June, excluding the31-day pulse flow period (April 15 through May 15). Also, application of recirculation forOctober pulse/attraction flows was also investigated. The overall water supply impactfrom recirculation is minimal because the required recirculation flow is small. Asummary of results for Alternative 2 is given in Table 5-2. The following are key findingsregarding Alternative 2 hydrologic and water supply impacts:
1) The annual average recirculation flow was about 5.1 TAF, ranging from zero to76.6 TAF. For the 73 years of simulation used in the model, recirculation flowwould have been required in 22 years (Figure 5-2).
2) Average required flow for recirculation purposes was 1, 10, 1, 17, and 1 TAF forwet, above normal, below normal, dry, and critical years, respectively. However,recirculation flow is consistently provided by withdrawals from San Luis Reservoirand increases in Delta pumping.
3) The average end-of-August storage (San Luis Low Point) for CVP San Luiswould decrease by 3.0 TAF (-1.3%).
4) Impacts to SWP deliveries and SWP San Luis were both below the 1% thresholdand were not considered significant.
5) On an annual average basis, there would be insignificant impacts to CVPdelivery and storage (both NOD and SOD), Delta pump operation, and releasesfrom the tributary reservoirs (New Melones, New Don Pedro, and Lake McClure).
6) The October minimum flow of 1,000 cfs was always achieved throughpulse/attraction flows; thus recirculation was never required for this month.

Delta-Mendota Canal Recirculation Study Executive Summary
USBR, Mid-Pacific Region 11 Delta-Mendota Canal Recirculation Study
Table 5-2 (Alternative 2 Results)
Result Average1
Base(TAF)
Average1
Alt. 1(TAF)
Average1
Diff2(TAF)
%Diff
(%)
SOD CVP Total Deliveries 2,442 2,442 -0.1 0.0
SOD SWP Total Deliveries 2,906 2,909 2.7 0.1
NOD CVP Total Deliveries 2,206 2,206 -0.2 0.0
CVP (Tracy) Total Exports 2,256 2,260 4.1 0.2
SWP (Banks) Total Exports 3,251 3,257 5.6 0.1
SWP (Banks) Exports for SWP 3,021 3,026 5.7 0.1
SWP (Banks) Exports for CVP 132 132 0.1 0.8
CVP San Luis EOM Aug Storage 200 197 -3.0 -1.3
SWP San Luis EOM Aug Storage 301 303 2.0 0.6
CVP NOD Reservoirs3 EOM SepStorage
3,257 3,255 -1.6 -0.1
SWP NOD Reservoirs4 EOM SepStorage
1,989 1,989 -0.6 0.1
New Melones EOM Sep Storage 1,323 1,323 -0.2 0.0
Notes:1 Average for all water year types (1922-1994)2 Average difference (Recirculation – Base) for all water year types, (1922-1994)3 Wiskeytown Lake, Shasta Lake, Keswick Reservoir, Folsom Lake, Lake Natomas4 Lake Oroville, Themalito Forebay

Delta-Mendota Canal Recirculation Study Executive Summary
USBR, Mid-Pacific Region 12 Delta-Mendota Canal Recirculation Study
Figure 5-2. Recirculation Flow of Alternative 2 in TAF
(a) February
3
1814
0
20
40
60
80
100
120
Water Year
Ann
ual F
low
in T
AF
(b) March
32
22
3640
0
20
40
60
80
100
120
Water Year
Ann
ual F
low
in T
AF
(c) April 1-14
20
0
20
40
60
80
100
120
Water Year
Ann
ual F
low
in T
AF

Delta-Mendota Canal Recirculation Study Executive Summary
USBR, Mid-Pacific Region 13 Delta-Mendota Canal Recirculation Study
Figure 5-2. (Continued)
(d) May 16-31
17 14
4 19
2 2 10
20
40
60
80
100
120
Water Year
Ann
ual F
low
in T
AF
(e) June
0
9 10
26
0 0 2
27 27
0
20
40
60
80
100
120
Water Year
Ann
ual F
low
in T
AF
(f) Annual Total
49
148 9
16
3426
22
39
2
18
0 2 4
14
56
81 2 2
77
0
20
40
60
80
100
120
Water Year
Ann
ual F
low
in T
AF
Average 5 TAF

Delta-Mendota Canal Recirculation Study Executive Summary
USBR, Mid-Pacific Region 14 Delta-Mendota Canal Recirculation Study
6. FINDINGS OF THE WATER QUALITY MODELING
The California Department of Water Resources, Delta Modeling Group of the ModelingSupport Branch conducted a DSM2 water quality analysis on DMC Recirculation. Thewater quality analysis evaluated the impacts of recirculation on Lower San Joaquinwater quality as well as analyze the ability of recirculation to help meet flow objectives inthe South Delta and at Vernalis. For this study, the water quality analysis was limited tothe evaluation of salt transport using electrical-conductivity (EC) as a surrogate. Thecases analyzed included the Base Condition and Alternatives 1 and 2.
Electrical-conductivity was computed on the San Joaquin River at Vernalis and alsoimmediately upstream and downstream of the Merced/San Joaquin River confluence(see Figure 1-1 in Section 1). In the Delta region, EC was computed at the CVP exportfacility and also at Twitchell Island. In addition, flows were analyzed at Turner Cut,Columbia Cut, and the Old River at Highway 4 (see Figure 6-1) at the request of theCalifornia Department of Fish and Game. South Delta Barriers were modeled asdetermined by the DWR Delta Modeling and South Delta Improvements Group. Thebarriers in the Old River near Tracy, Middle River, and Grantline Canal were assumedto be temporary rock structures with weir and culvert flow as per 2002 installation. Thebase and two alternatives assumed identical barrier operations. Water qualitysimulations were conducted for the 16-year period 1976-1991, which is typical of DWRmodel runs using DSM2.
6.1 Alternative 1 (VAMP Recirculation)
Alternative 1 recirculates water during the VAMP period, and replaces some of the SJRtributary and exchange contractor water to meet Vernalis flow standards. The followingare key findings regarding Alternative 1 flow and water quality impacts:
1) There was little change in flows at Turner Cut, Columbia Cut, and Old River atHighway 4 between the base case and Alternative 1.
2) Recirculation can affect the local San Joaquin River salinity where the NewmanWasteway flows into the main stem. Modeling illustrated a substantial decreasein San Joaquin River EC just below the inflow of the wasteway. The NewmanWasteway flow diluted the saline water upstream of the Newman Wasteway. Afew miles downstream, however, the salinity improvement decreased withrecirculation and an increase in EC was shown. This was due to a decrease inMerced River inflow in Alternative 1 and a subsequent higher salinity releasefrom the Merced River into the San Joaquin River.
3) Changes in salinity at Vernalis, are a direct consequence of change in SanJoaquin River tributary flow and the recirculation flow down the NewmanWasteway. When water is recirculated, the EC at Vernalis increases especiallywhen tributary flow is decreased. Vernalis EC correspondingly decreases whentributary inflow is increased.

Delta-Mendota Canal Recirculation Study Executive Summary
USBR, Mid-Pacific Region 15 Delta-Mendota Canal Recirculation Study
4) Alternative 1 tends to cause either little or moderate increase in CVP Export ECduring the April - May period. Changes in salinity at the Tracy Pumping Plantwas a direct consequence of changes in Vernalis EC and changes in combinedCVP and State Water Project exports.
5) Period averaged EC at Twitchell Island changes little under Alternative 1, withthe exception of some winter months in water years 1979, 1980, and 1991. Thechanges in EC seen at these times correspond to changes in Delta outflow.
6.2 Alternative 2 (Feb-Jun Vernalis Minimum Flow Recirculation)
Alternative 2 recirculates water from February through June (excluding the VAMPperiod) to meet 1995 Water Quality Control Plan minimum flow requirements atVernalis. DSM2 simulations cover the time period 1976-1991, and it was found thatrecirculation for X2 flow augmentation would only occur in one month. Because ofhaving only one occurence, a general salinity trend for Alternative 2 recirculation cannotbe determined. However, there was a small increase in EC of 18 µS/cm during the oneperiod of recirculation; May 16-31 of 1990. The EC values for this period indicate thatthe trend for recirculation in Alternative 2 would follow Alternative 1 with a small tomoderate increase in salinity during recirculation.

Delta-Mendota Canal Recirculation Study Executive Summary
USBR, Mid-Pacific Region 16 Delta-Mendota Canal Recirculation Study
Figure 6-1, DSM2 Sacramento/San Joaquin Delta Output Location