prepared by: roger levy; levy associates 1 uscl corporation california spp results initiative on...
TRANSCRIPT

Prepared by:
Roger Levy; Levy Associates
1
USCLCorporation
California SPP ResultsInitiative on Demand Pricing and Critical Peak Pricing
July 2004
USCLCorporation
Prepared by:
Roger Levy; Levy Associates

Prepared by:
Roger Levy; Levy Associates
2
USCLCorporation
•Residential and Commercial / Industrial customers don't understand their current rates.
•Both groups overwhelmingly prefer the Critical Peak rates to their existing rates.
•Both groups respond to these rates with substantial peak load reductions
•Both groups respond to these rates with reduced overall energy use.
•A majority (roughly 80%) of all customers will see reduced monthly energy bills on the Critical Peak rates. Those that don’t are being charged for their peak load.
Results From the California State Pricing Pilot (SPP) Generally Show:

Prepared by:
Roger Levy; Levy Associates
3
USCLCorporation
California Vision
Rule Making CPUC, CEC, CPA joint proceeding June 2002[CPUC R.02-06-001, CEC 02-Demand Response-01]
CPUC, CEC, CPA joint proceeding June 2002[CPUC R.02-06-001, CEC 02-Demand Response-01]
How
1. Install advanced [interval capable] meters with communication links on all customers.
2. Establish Critical Peak Pricing as the default tariff for all customers.
3. Provide customers with options to ‘opt-out’ to real-time pricing or risk adjusted time-of-use, non-time varying tiered or other rate forms.
1
Objectives1. Improve system reliability and reduce energy
costs by encouraging demand response.
2. Provide customers with options to manage costs.
1. Improve system reliability and reduce energy costs by encouraging demand response.
2. Provide customers with options to manage costs.

Prepared by:
Roger Levy; Levy Associates
4
USCLCorporation
Problems
1. California utilities concerned that prior 25 years of pricing and demand response research not applicable.
2. California utilities need up-to-date demand elasticities to estimate system resource and procurement impacts.
3. The cost to implement advanced metering system wide requires a complete and thorough business case evaluation.
Solution
Statewide Pricing Pilot (SPP)Statewide Pricing Pilot (SPP)

Prepared by:
Roger Levy; Levy Associates
5
USCLCorporation
SPP Conclusions
1. Rates that reflect market price (Critical Peak Pricing), produce greater conservation and demand response impacts than TOU or inverted tier rate forms.
2. Residential and commercial/industrial customers with demands less than 200kW demonstrate substantial, statistically significant response to critical peak pricing.
3. Critical Peak rates will produce short-run residential peak demand reductions of 2,000 MW or more, energy conservation of up to 7% and even greater impacts in the long-term. At $85 per kW-year, these savings equal $3-$4 per customer per month.
4. Customers understand and respond favorably to Critical Peak rates.
5. At least 50% of residential customers will receive a lower energy bill under Critical Peak Pricing without any change in usage. Another 20% to 30% of residential customers will receive a lower energy bill under Critical Peak Pricing with only minor changes in usage.
6. The net investment to implement the advanced metering infrastructure to support Critical Peak Pricing should result in incremental residential charges substantially less than $1.00 per meter per month.

Prepared by:
Roger Levy; Levy Associates
6
USCLCorporation
California Vision – The Results
Costs & BenefitsUtility Business Case for Advanced Metering
Major Issues
System Impacts
System Wide - Procurement impacts
Conservation / Peak Load Impacts
Demand Elasticities
Customer Response
Customer Understanding
Customer Preferences
Bill Impacts

Prepared by:
Roger Levy; Levy Associates
7
USCLCorporation
System Impacts SPP Conclusions
CPP rates can, within five years of deployment reduce the California’s
residential peak load by 2,000 to 2,400 MW.
System Wide Procurement
ImpactsSP
P
Re
su
lts
CPP-V rates encourage greater conservation and peak demand impacts than conventional inverted tier, TOU or CPP-F rates.
Conservation and Peak Load
ImpactsSP
P
Re
su
lts
1. SPP short-run own-price demand elasticities are consistent with 25 years of historical findings in California and elsewhere.
2. Historical long-run own-price demand elasticities are typically about double short-run elasticities.
Demand ElasticitiesS
PP
R
es
ult
s
Confidence in Conclusion
Need for Further Tests
High Moderate Low
None Useful
Essential
High Moderate Low
None Useful
Essential
High Moderate Low
None Useful
Essential
High Moderate Low
None Useful
Essential

Prepared by:
Roger Levy; Levy Associates
8
USCLCorporation
California Vision – The Results
RESIDENTIAL CUSTOMERSRESIDENTIAL CUSTOMERS

Prepared by:
Roger Levy; Levy Associates
9
USCLCorporation
1. Customers show significant response to both the CPP-F and CPP-V rates
2. Impacts are higher in the hotter zones for both CPP and non CPP days
3. Responses are substantially higher on CPP days than on non-CPP days
4. For all zones, the CPP day impact is -12% and the non-CPP day impact is –2.3%
5. CPP day impacts differ slightly between the two experimental rates within the CPP-F rate
6. Results are generally similar across the two functional forms tested in this study
7. Customers do not respond to TOU rates
Source: SPP Summer 2003 Update Analysis, Charles Rivers Associates, June 9, 2004.
SPP Conclusions
Conservation and Peak Load
ImpactsSP
P
Re
su
lts RESIDENTIALRESIDENTIAL

Prepared by:
Roger Levy; Levy Associates
10
USCLCorporation
Historical Findings SPP Findings
Residential customer elasticities were higher than those for commercial customers. Confirmed.
Residential customer elasticities were typically higher for customers with higher usage, more appliances, and air conditioning load.
Confirmed.
Price response was typically significantly higher – approximately double – when automated control capability was available.
Confirmed.
Customers typically reduced total consumption by around three percent, with the range from zero percent to as high as 23 percent.
Confirmed.
Customers reduced peak demands by a four percent (low end of time-of-use range) to 59 percent (high end of critical peak pricing range).
Confirmed.
Commercial customer elasticities varied widely by business type. Confirmed.
Customer Response to Price
What Have We Learned ?
Source: Proposed Pilot Projects and Market Research to Assess the Potential for Deployment of Dynamic Tariffs for Residential and Small Commercial Customers, Report of Working Group 3 to Working Group 1, R.02-06-001, Final Version 5, December 10, 2002, p25.
Conservation and Peak Load
ImpactsSP
P
Re
su
lts RESIDENTIALRESIDENTIAL

Prepared by:
Roger Levy; Levy Associates
11
USCLCorporation
71.5
23.7
7.5
51.7
21.3
11.0
61.0
22.5
9.4
0
10
20
30
40
50
60
70
80
Ce
nts
/ k
Wh
CPP-F High Ratio CPP-F Low Ratio Average
Residential Price For Consumers At Midpoint of Tier 3
(Weighted Average, Climate Zone 2)
CPP Period Peak Period Off-Peak Period
Control Group Average Price 13.3 cents/kWh
RESIDENTIALRESIDENTIALConservation and Peak Load
ImpactsSP
P
Re
su
lts
Rates

Prepared by:
Roger Levy; Levy Associates
12
USCLCorporation
SPP Residential Rate Forms( Example TOU & CPP High Options )
Conservation and Peak Load
ImpactsSP
P
Re
su
lts
CPP Tariff- (high)TOU Tariff- (high)
$0.7336
$0.2336
$0.0886
0
10
20
30
40
50
60
70
80
Ce
nts
pe
r k
Wh
Existing RatesAvg. Summer Price
13.36 ¢/kWh
$0.2596
$0.1026
2:00-7:00pmWeekdays
Other Weekday & Weekend hours
2:00-7:00pmWeekdays
Other Weekday & Weekend hours
Dispatched2:00-7:00pm
1,500 hrs/yr 7,260 hrs/yr Maximum 75 hrs/yr 1,425 hrs/yr 7,260 hrs/yr
Critical Peak
Summer Peak
Summer Off-Peak
RESIDENTIALRESIDENTIAL

Prepared by:
Roger Levy; Levy Associates
13
USCLCorporation
0
500
1000
1500
2000
2500
3000
2005 2006 2007 2008 2009 2010 2011 2012 2013 2014 2015 2016 2017 2018 2019
Avo
ided
MW Pure CPP 75 Universal
CPPF 75 Universal
TOU 1.5:1 Ratio Mandatory
TOU 2.5:1 Ratio Voluntary
SPP Residential Rate Options System Wide Potential Peak Demand Impacts
Source: Charles Rivers Working Group 3 presentation, March 30, 2004.
System Wide Procurement
ImpactsSP
P
Re
su
lts RESIDENTIALRESIDENTIAL

Prepared by:
Roger Levy; Levy Associates
14
USCLCorporation
Probabilistic System Wide CPP Residential Potential Peak Demand Impacts
Source: Charles Rivers Working Group 3 presentation, March 30, 2004.
Assumptions:
Illustrative CPP and TOU rates are constructed, building upon the rates used in the SPP; the rates are revenue neutral for the typical California investor-owned utility residence
Marginal capacity cost of $85/kW-year are used in the analysis, along with energy costs of 15¢ /kWh in the CPP period, 4.7¢ /kWh in the peak period, and 4.0 ¢ /kWh in the off peak period.
The pure CPP rate will reduce the state’s residential peak load by 2,400 MW in the year 2007 with a probability of 50% and almost certainly meet that target by the year 2012
Avoided MW – All Weather Zones
0.000.90
0.800.700.600.50
0.400.300.200.10
1.00
1,758 2,058 2,358 2,658 2,958 MW
Pro
bab
ilit
y o
f D
R I
mp
act
2007
2012
The pure CPP rate will reduce residential peak load by 2,000 MW in the year 2007 with a probability of 95% and almost certainly meet that target by the year 2012
System Wide Procurement
ImpactsSP
P
Re
su
lts RESIDENTIALRESIDENTIAL

Prepared by:
Roger Levy; Levy Associates
15
USCLCorporation
TRC NPV Benefits – All Zones
0.00
0.10
0.20
0.30
0.40
0.50
0.60
0.70
0.80
0.90
1.00
1.10
$1,009 $1,359 $1,709 $2,059 $2,409
Millions of Dollars
Pro
bab
ility The pure CPP rate will almost certainly
produce more than a billion dollars worth of Total Resource Cost benefits.Note: TRC benefit estimates exclude utility operating savings.
System Wide Pricing ImpactsDemand Response Dollar Value of Impacts
Source: Charles Rivers Working Group 3 presentation, March 30, 2004.
System Wide Procurement
ImpactsSP
P
Re
su
lts RESIDENTIALRESIDENTIAL

Prepared by:
Roger Levy; Levy Associates
16
USCLCorporation
Residential Coincident Critical Peak Demand Impacts
By SPP Rate Treatment
Source: Statewide Pricing Pilot Summer 2003 Impact Analysis, Charles Rivers Associates, March 9, 2004.
0%
10%
20%
30%
40%
50%P
eak
Lo
ad R
edu
ctio
n49.4%
19.5%
CPPF
(Critical Peak Fixed)
23.5%
TOU
(Time-of Use)
CPPV
(Critical Peak Variable w/Automated Controls)
Conservation and Peak Load
ImpactsSP
P
Re
su
lts RESIDENTIALRESIDENTIAL

Prepared by:
Roger Levy; Levy Associates
17
USCLCorporation
Percent Change In Energy Use By Rate Period
For Average Experimental Prices On Non-CPP Days
-9.3
-2.3
3.82.2
3.8
-6.2
1.2
4.3
7.3
4.2
-12-10-8-6-4-202468
10
Zone 1 Zone 2 Zone 3 Zone 4 All
%
Ch
an
ge
In
kW
h
Peak Period Off-Peak Period
Source: SPP Summer 2003 Update Analysis, Charles Rivers Associates, June 9, 2004.
Conservation and Peak Load
ImpactsSP
P
Re
su
lts RESIDENTIALRESIDENTIAL

Prepared by:
Roger Levy; Levy Associates
18
USCLCorporation
Percent Change In Energy Use During
The Peak Period On CPP Days By Price Ratio
-23.5
-11.5-8.1
-17.8
-11.7
-24.5
-5.1
3.4
-1.9
-22.8
-30
-25
-20
-15
-10
-5
0
5
Zone 1 Zone 2 Zone 3 Zone 4 All
%
Ch
an
ge
In
kW
h
High Ratio Low Ratio
Source: SPP Summer 2003 Update Analysis, Charles Rivers Associates, June 9, 2004.
Conservation and Peak Load
ImpactsSP
P
Re
su
lts RESIDENTIALRESIDENTIAL

Prepared by:
Roger Levy; Levy Associates
19
USCLCorporation
Conservation vs. Peak Period Impacts
By SPP Rate Form
Source: Statewide Pricing Pilot Summer 2003 Impact Analysis, Charles Rivers Associates, March 9, 2004.
Peak Period kWh Impacts
( Example: Weather Zone 3 )
0
- 4
- 6
- 8
- 10
- 2
Conservation
Non-Critical Days
Peak Period Impact
Demand Response
Critical Days
Peak Period Impact
-0.5
-1.4
-3.6 -3.3
-1.9 -2.0
-5.4
-9.9
kW
h P
eri
od
Im
pa
ct
CPPF
TOU
CPPV, Smart Thermostat
CPPV, > 600 kWh/mo
Conservation and Peak Load
ImpactsSP
P
Re
su
lts RESIDENTIALRESIDENTIAL

Prepared by:
Roger Levy; Levy Associates
20
USCLCorporation
-38.8-28.0CPP - Variable
-22.0-9.4CPP – Fixed
-16.0-16.0Time-of-Use
CPP DaysNon-CPP
DaysRate Form
-49.4-1.4
-19.5-0.2
-23.5-0.3
PercentkWh
`Change in Coincident
Peak DemandPercent Change in Peak Consumption
SPP Impacts on Peak Consumption and Coincident Peak Demand
Source: Statewide Pricing Pilot, Summer 2003 Impact Analysis, Charles Rivers Associates, January 16, 2004, Tables 1-1 and 1-2.
Conservation and Peak Load
ImpactsSP
P
Re
su
lts

Prepared by:
Roger Levy; Levy Associates
21
USCLCorporation
Conservation and Peak Load
ImpactsSP
P
Re
su
lts
Weather Related Impacts Load Impacts
CPP Days (Percentage Change in Usage)
4.85.1
-13.4
3.1
-16
-9.7
-20
-15
-10
-5
0
5
10
Peak Period Off-Peak Period
%
Ch
an
ge
In
kW
h
Average Top Quintile Bottom Quintile
Interpreting This graph:
As seen, the percent reduction in peak-period energy use on CPP days based on average weather for the treatment period is 13.4 percent. Based on weather conditions representing the top 20 percent of CPP days (as measured by system load conditions), the percent reduction is –16 percent, whereas the reduction falls to 9.7 percent on the cooler, lowest system-load days.
Source: Charles Rivers Associates Analysis memo, June 24, 2004.

Prepared by:
Roger Levy; Levy Associates
22
USCLCorporation
Conservation and Peak Load
ImpactsSP
P
Re
su
lts
Weather Related Impacts Load Impacts
Non-CPP Days (Percentage Change in Usage)
Source: Charles Rivers Associates Analysis memo, June 24, 2004.
4.74.8
-2.4
4.2
-4.8
-2
-6
-4
-2
0
2
4
6
Peak Period Off-Peak Period
%
Ch
an
ge
In
kW
h
Average Top Quintile Bottom Quintile
Interpreting This graph:
On non-CPP days, the percent reduction in peak-period energy use is 4.8 percent based on weather conditions representing high-load days and 2 percent on low-load days.

Prepared by:
Roger Levy; Levy Associates
23
USCLCorporation
-20.2
-16
-2.6
-14.6
-9.7
-25.3
-7.2
0.02
-1.4
-21.2
-30
-25
-20
-15
-10
-5
0
5
Zone 1 Zone 2 Zone 3 Zone 4 All
%
Ch
an
ge
In
kW
h
Top Quintile Bottom Quintile
Conservation and Peak Load
ImpactsSP
P
Re
su
lts
Weather Related Impacts Load Impacts
By Weather Zone on CPP Days(Percentage Change in Usage)
Source: Charles Rivers Associates Analysis memo, June 24, 2004.
Interpreting This graph:
This graph shows the variation in percentage impacts across climate zones for peak-period energy use on CPP days. The percent impact is clearly much larger in the hotter climate zones than in the cooler zones. However, the change in the percentage impact between the top and bottom quintile load days is greater in zone 2 than it is in zones 3 and 4.

Prepared by:
Roger Levy; Levy Associates
24
USCLCorporation
-2.04
-1.09
-0.09
-0.78-0.41
-3.11
-0.35
0
-0.04
-1.25
-3.5
-3
-2.5
-2
-1.5
-1
-0.5
0
Zone 1 Zone 2 Zone 3 Zone 4 All
C
ha
ng
e In
kW
h
Top Quintile Bottom Quintile
Conservation and Peak Load
ImpactsSP
P
Re
su
lts
Weather Related Impacts Load Impacts
By Weather Zone on CPP Days(Change in Actual kWh)
Source: Charles Rivers Associates Analysis memo, June 24, 2004.
Interpreting This graph:
This graph shows the absolute impact, in kilowatt-hours, resulting from the SPP prices by climate zone and for the state as a whole. Clearly, the difference in the absolute impact on high-load and low-load days is much larger than the difference in percentage impacts, as customers in the hotter zones are both more responsive high-load days and larger energy users. When these two factors are combined, the impact on high load days in zone 2 is nearly four times higher than on low-load days. In zones 3 and 4, the impact is roughly 2½ times higher on high-load days than on low-load days. Statewide, the impact is roughly 2.7 times higher on high-load days than on low-load days. It is also worth noting that the absolute impact on high-load days in the hottest zone 4 is almost nine times greater than the impact in the moderate zone 2.
Prepared by:
Roger Levy; Levy Associates
25
USCLCorporation
California Vision – The Results
COMMERCIAL / INDUSTRIAL CUSTOMERS
COMMERCIAL / INDUSTRIAL CUSTOMERS

Prepared by:
Roger Levy; Levy Associates
26
USCLCorporation
SPP Commercial / Industrial Rate Forms( TOU & CPP High Options )
Conservation and Peak Load
ImpactsSP
P
Re
su
lts
Average Prices For C&I Customers During Treatment Period ($/kWh)
Customer Segment
Rate Treatment
Price Ratio
Non-CPP Day CPP-Day
Peak Period
Off-Peak Period
Peak Period
Off-Peak Period
LT20 Control n/a 0.186 0.186
TOU High 0.272 0.094 0.272 0.094
Low 0.325 0.159 0.325 0.159
CPP-V High 0.200 0.095 1.07 0.091
Low 0.256 0.169 0.813 0.166
GT20 Control n/a 0.154 0.154
TOU High 0.224 0.100 0.224 0.100
Low 0.254 0.144 0.254 0.144
CPP-V High 0.187 0.086 0.820 0.084
Low 0.212 0.137 0.629 0.136
Source: SPP Summer 2003 Update Analysis, Charles Rivers Associates, June 9, 2004.
Commercial / IndustrialCommercial / Industrial

Prepared by:
Roger Levy; Levy Associates
27
USCLCorporation
Price For Typical C&I Customer On CPP-V Rate(Weighted Average For Treatment Customers)
106.0
20.0
9.5
80.4
25.6
16.9
81.6
18.7
8.6
62.5
21.113.7
0
20
40
60
80
100
120
ce
nts
/kW
h
LT20-High Ratio LT20-Low Ratio GT20-High Ratio GT20-Low Ratio
CPP Period Peak Period Off-Peak Period
Control Group Average Price 15.3 cents/kWh
Control Group Average Price 18.3 cents/kWh
Source: SPP Summer 2003 Update Analysis, Charles Rivers Associates, June 9, 2004.
Conservation and Peak Load
ImpactsSP
P
Re
su
lts Commercial / IndustrialCommercial / Industrial

Prepared by:
Roger Levy; Levy Associates
28
USCLCorporation
Percent Change In Energy During Peak Period
(Average Experimental Prices On CPP Days)
-26
-14.7
-27.8
-9.1
-13.3
-33.1
-25.2
-11.3
-35
-30
-25
-20
-15
-10
-5
0
LT20 kW Separate Dispatch
GT20 kW Separate Dispatch
LT20 kW Common Dispatch
GT20 kWCommon Dispatch
%
Ch
an
ge
In
kW
h
Log-Log SpecificationCES Specification
* Estimates for the CPP-V tariff may not represent the impacts of the general population of customers
Source: SPP Summer 2003 Update Analysis, Charles Rivers Associates, June 9, 2004.
Conservation and Peak Load
ImpactsSP
P
Re
su
lts Commercial / IndustrialCommercial / Industrial

Prepared by:
Roger Levy; Levy Associates
29
USCLCorporation
Percent Change In Energy Use By Rate Period For Average Experimental Prices On CPP Days
(Based on Log-Log Model)
-26
7 5.7
-9.1-13.3
-33.1
2.1 3.8
-40-35-30-25-20-15-10-505
10
LT20 kW
Separate Dispatch
GT20 kW
Separate Dispatch
LT20 kW
Common Dispatch
GT20 kW
Common Dispatch
%
Ch
an
ge
In
kW
h
Peak Period
Off-Peak Period
Source: SPP Summer 2003 Update Analysis, Charles Rivers Associates, June 9, 2004.
* Estimates for the CPP-V tariff may not represent the impacts of the general population of customers
Conservation and Peak Load
ImpactsSP
P
Re
su
lts Commercial / IndustrialCommercial / Industrial

Prepared by:
Roger Levy; Levy Associates
30
USCLCorporation
Percent Change In Energy Use During Peak Periods On CPP Days By Price Ratio
(Based on Log-Log Model)
-26.8
-18.9
-24.4
-1-5.5
-35.7
-30
-15.1
-40
-35
-30
-25
-20
-15
-10
-5
0
LT20 kW
Separate Dispatch
GT20 kW
Separate Dispatch
LT20 kW
Common Dispatch
GT20 kW
Common Dispatch
%
Ch
an
ge
In
kW
h
High Ratio
Low Ratio
Source: SPP Summer 2003 Update Analysis, Charles Rivers Associates, June 9, 2004.
Conservation and Peak Load
ImpactsSP
P
Re
su
lts Commercial / IndustrialCommercial / Industrial
* Estimates for the CPP-V tariff may not represent the impacts of the general population of customers

Prepared by:
Roger Levy; Levy Associates
31
USCLCorporation
California Vision – The Results
INDUSTRY WIDE EXPERIENCEINDUSTRY WIDE EXPERIENCE

Prepared by:
Roger Levy; Levy Associates
32
USCLCorporation
0%
10%
20%
30%
40%
50%P
eak
Lo
ad R
edu
ctio
n
22%
Dynamic Pricing (CPP)
32%
AC Load Control
45%
Dynamic Pricing (CPP) with AC Control
Source: ISSUES IN DEMAND RESPONSE, Combining Residential Dynamic Pricing and Load Control: The Literature Chris King, December 2003
Comparison of Pricing Only, Load Control Only and Combined Programs
Conservation and Peak Load
Impacts
Industry ExperienceIndustry Experience

Prepared by:
Roger Levy; Levy Associates
33
USCLCorporation
Cost EffectivenessCPP Rates Dominate TOU Rates
Total Resource Cost - Net Present Value
32.9 30.3
2.6
111.8
30.3
81.5
0
20
40
60
80
100
120
Benefits Costs Net Benefits
$ M
illi
on
s
TOU CPP
Source: [ Northern State Power Case Study ]
Creating Value Through Dynamic Pricing in Mass Markets, Peak Load Management Alliance Fall Conference, Annapolis, Maryland, Ahmad Faruqui and Steve George, Charles River Associates, October 8, 2002
Industry ExperienceIndustry ExperienceConservation and Peak Load
Impacts

Prepared by:
Roger Levy; Levy Associates
34
USCLCorporation
Own-Price Elasticities
California SPP vs. Nationwide Historical Results
1980 1985 1990 1995 2000 2005
-0.5
0.0
-0.1
-0.2
-0.3
-0.4
-0.6
-0.7
-0.8
-0.9
California 2003 SPP CPP-F Critical Peak Days
Nationwide Historical Results
Average = -0.30
Source: Predicting California Demand Response, Chris King and Sanjoy Chatterjee, Public Utilities Fortnightly, July 1, 2003, p.27-32.
Demand ElasticitiesS
PP
R
es
ult
s Industry ExperienceIndustry Experience

Prepared by:
Roger Levy; Levy Associates
35
USCLCorporation
Climate Zone
CPP-FCPP Days*
CPP-FNon-CPP
Days
TOUAll
Weekdays
Zone 1 -0.14 -0.21 +0.03
Zone 2 -0.24 -0.26 -0.13
Zone 3 -0.34 -0.50 -0.59
Zone 4 -0.25 -0.25 -0.27
Statewide Pricing Pilot (SPP)Own-Price Elasticity Results
Source: Charles Rivers Associates, SPP Summer 2003 Impact Analysis, January 27, 2004.
Climate Zone
Short-Run Elasticity1
Long-Run Elasticity
Low -0.12 -0.60
Medium -0.20 -0.90
High -0.35 -1.20
Historical StudiesOwn-Price Elasticity Results
1. Short-run – customers make no change in appliance holdings.
Source: Predicting California Demand Response, Chris King and Sanjoy Chatterjee, Public Utilities Fortnightly, July 1, 2003, p.27-32.
Own-Price Elasticity of Demand
SPP Compared to Historical Industry Results
Demand ElasticitiesS
PP
R
es
ult
s Industry ExperienceIndustry Experience

Prepared by:
Roger Levy; Levy Associates
36
USCLCorporation
• A variety of experiments, quasi-experiments and demonstration programs have been conducted during the past quarter century to assess customer response to innovative pricing options.
• On average, if the on-peak price is doubled, on-peak usage drops by 20%. The drop in usage varies based on factors such as appliance ownership and climate.
• Puget Sound Energy has shown that if the on-peak price is raised about 15%, on-peak usage drops by 5%.
• Salt River Project has shown that coincident peak demand drops by 28% if the on-peak energy price is doubled.
• GPU has shown that enabling technologies can double the magnitude of customer response.
There Is Ample Evidence That US Customers Respond To Dynamic Pricing Rates
Source:
Creating Value Through Dynamic Pricing in Mass Markets, Peak Load Management Alliance Fall Conference, Annapolis, Maryland, Ahmad Faruqui and Steve George, Charles River Associates, October 8, 2002
Demand Elasticities
Industry ExperienceIndustry Experience

Prepared by:
Roger Levy; Levy Associates
37
USCLCorporation
Customer Demand Response Estimates
Program Type Range of ElasticitiesRange of Peak
Demand ReductionRange of Total
Usage Reduction
Residential time-of-use
-0.05 to -1.3(SCE; North Carolina)
4% to 35% (Ontario; Duke)
0% to 23%(PG&E; Connecticut)
Residential critical peak
pricing
-0.35 to -0.82(GPU; EdF France)
42% to 59%(Gulf Power; AEP)
0% to 6.5%(AEP; Gulf Power)
Small commercial time-
of-use-0.03 to -0.04
(SCE; PG&E)
SPP Results in Process
2.1% to 5% (McKinsey multi-utility
data; Finland)
Small commercial dynamic pricing No studies
SPP Results in Process
SPP Results in Process
Source:
Proposed Pilot Projects and Market Research to Assess the Potential for Deployment of Dynamic Tariffs for Residential and Small Commercial Customers, Report of Working Group 3 to Working Group 1, R.02-06-001, Final Version 5, December 10, 2002, Table 2-2.
Demand Elasticities
Industry ExperienceIndustry Experience

Prepared by:
Roger Levy; Levy Associates
38
USCLCorporation
California Vision – The Results
CUSTOMER KNOWLEDGE,
PREFERENCES and BILL IMPACTS
CUSTOMER KNOWLEDGE,
PREFERENCES and BILL IMPACTS

Prepared by:
Roger Levy; Levy Associates
39
USCLCorporation
Customer Response
SPP Conclusions
1. Customers do not understand the relationship between how they use energy and what they pay.
2. Customers understand and accept the concept of time-differentiated pricing.
Customer KnowledgeS
PP
R
es
ult
s
1. Customers resist change due to uncertainty regarding their present usage and billing situation.
2. Residential and business customers support rates that match price with electricity demand.
Customer PreferencesS
PP
R
es
ult
s
1. Low and moderate use residential customers will receive reduced energy bills under a CPP rate without any change to their usage pattern because they already use less on-peak energy.
2. CPP rates will provide all customers with a clear option for managing their energy cost.
Bill Impacts
SP
P
Re
su
lts
Confidence in Conclusion
Need for Further Tests
High Moderate Low
None Useful
Essential
High Moderate Low
None Useful
Essential
High Moderate Low
None Useful
Essential

Prepared by:
Roger Levy; Levy Associates
40
USCLCorporation
“..most respondents could easily understand the logic of time-differentiated electricity prices,..”
1
“..customers understood time-differentiated pricing (at least the on-peak / off-peak variety) more easily than they understood the notion of inclining block [tiered] or declining block pricing.”
2
Source: 1- Residential Customer Understanding of Electricity Usage and Billing, Momentum Market Intelligence, WG3 Report, January 29, 2004.p16.
Conventional vs. Time-Differentiated Pricing
Customer KnowledgeS
PP
R
es
ult
s

Prepared by:
Roger Levy; Levy Associates
41
USCLCorporation
Customer Knowledge Findings
What it means.
• Customers don’t understand how electricity use is measured.
• Customers don’t understand how electricity is priced.
• There is an uncertain and inaccurate link between how customers use energy, what they pay and what they get in service value.
• Bill accuracy – customer’s must trust their supplier. No other choice.
Lack of meaningful feedback on usage and usage pattern.
Complicated rates mask the time and/or volume vs. cost relationship.
The inability to clearly link cost with value contributes to improper / inefficient usage and impedes better investment decisions.
Creates a fragile, tenuous relationship.
Results from the SPP 1 What it means2
Source: 1- Residential Customer Understanding of Electricity Usage and Billing, Momentum Market Intelligence, WG3 Report, January 29, 2004.pviii-ix.
2 – CEC interpretation.
Customer KnowledgeS
PP
R
es
ult
s

Prepared by:
Roger Levy; Levy Associates
42
USCLCorporation
SPP Customer Rate Preference
Source: SPP End-of-Summer Survey Report, Momentum Market Intelligence, WG3 Report, January 21, 2004, p23-24.
Customer PreferencesS
PP
R
es
ult
s
Original Inverted Tier Rate Time-Differentiated Rate
Res
iden
tialCPP-V
CPP-F
TOU
80%
81%
20%
23%
19%
Co
mm
erci
al
CPP-V
TOU
77%
71%
70%
20406080 20 40 60 80
30%
29%
Percent that Prefer 0
Prepared by:
Roger Levy; Levy Associates
43
USCLCorporation
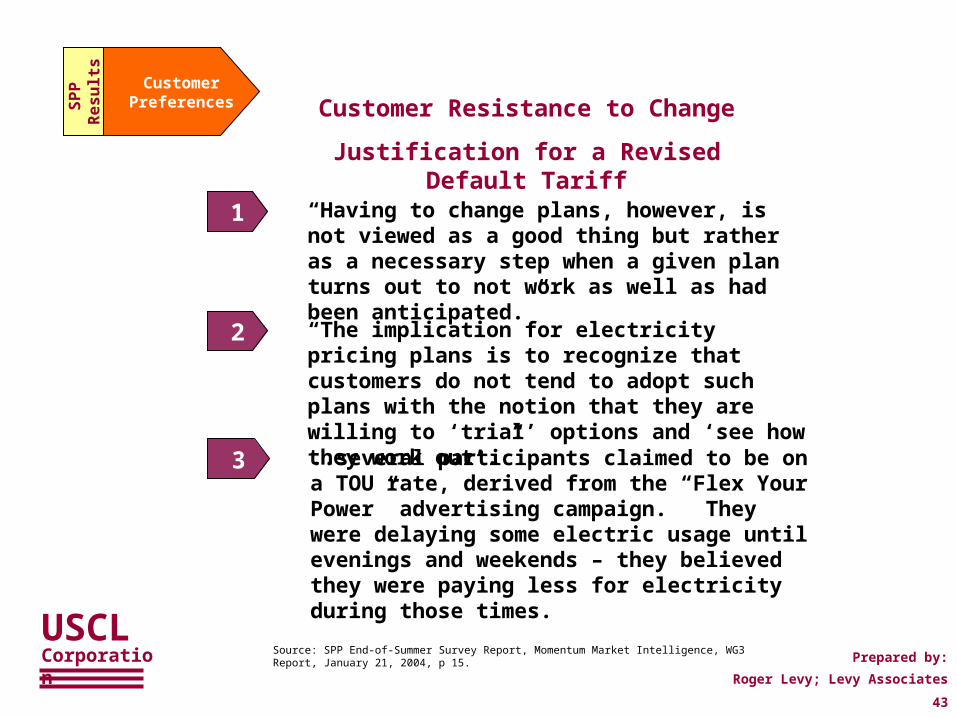
Customer Resistance to Change
Justification for a Revised Default Tariff
“Having to change plans, however, is not viewed as a good thing but rather as a necessary step when a given plan turns out to not work as well as had been anticipated.”
1
“The implication for electricity pricing plans is to recognize that customers do not tend to adopt such plans with the notion that they are willing to ‘trial’ options and ‘see how they work out’.”
2
..several participants claimed to be on a TOU rate, derived from the “Flex Your Power” advertising campaign. They were delaying some electric usage until evenings and weekends – they believed they were paying less for electricity during those times.
3
Customer PreferencesS
PP
R
es
ult
s
Source: SPP End-of-Summer Survey Report, Momentum Market Intelligence, WG3 Report, January 21, 2004, p 15.

Prepared by:
Roger Levy; Levy Associates
44
USCLCorporation
Average Bill Impacts
Residential and Commercial / Industrial Savings (summer / winter 2003)
Bill ImpactsS
PP
R
es
ult
s
CPPV CPPF TOUInfo Only
Participants (%) 71.1% 73.7% 70.0% 79.0%
Average Monthly Savings (%)
5.1% 5.5% 4.5% 5.4%
Average Monthly Savings ($)
$53 $35 $29 $19
CPPV TOU
80.3% 58.2%
12.2% 9.6%
$1,521 $869
Participants (%) 28.9% 26.3% 30.0% 21.0%
Average Monthly Increase (%)
4.0% 6.2% 3.0% 10.0%
Average Monthly Increase ($)
$39 $44 $30 $9
19.7% 41.8%
5.0% 10.0%
$224 $600
ResidentialCommercial /
Industrial
Bill Savings
Bill Increases
Source: Statewide Pricing Pilot, Shadow Bill Results, WG3 report, June 9, 2004.

Prepared by:
Roger Levy; Levy Associates
45
USCLCorporation
Potential Impacts from Systemwide Implementation
Existing Inverted Tier vs. SPP CPP Rate (Summer)( Assumes no customer response )
Bill ImpactsS
PP
R
es
ult
s
$20
$120
$100
$80
$60
$40
MO
NT
HL
Y S
UM
ME
R B
ILL
($
)
Typical Utility Residential Population2 TURN Target Group1
321 kWh/MoLow User
286 kWh/MoLow User
562 kWh/MoModerate User
923 kWh/MoHigh User
$39.58$37.59 $35.26
$33.08
$69.29 $70.67
$113.81
$119.71
Inverted Tier
CPP Rate
Baseline = 373 kWh
Savings$1.99
Savings$2.18
Increase$1.38
Increase$5.90
1. Target Population identified: Financial Externalities and “Peak Hogs”: New Consideration for Energy Efficiency and Rate Design Policy, by William B. Marcus, Principle Economist, JBS Energy, Inc., March 2001.
2. Target Population identified from PG&E SPP rate design exercise.

Prepared by:
Roger Levy; Levy Associates
46
USCLCorporation
Typical Utility Residential Population by Average Monthly Electric Usage
Low Use Moderate Use High Use
0
0.05
0.1
0.15
0.2
0.25
0.3
0.35
0.4
0.45
Per
cen
t
<399 400-599 600-799 800-1,199 1,200-1,599 >1,600
Single Family
Multi-Family
44% 69% 82% 94% 97% 100%Cumulative
Percent
~ 500 kWh/moReduced Bill
With no ChangeIncreased Bill
With no Change
Customer Bill ImpactsBill ImpactsS
PP
R
es
ult
s

Prepared by:
Roger Levy; Levy Associates
47
USCLCorporation
California Vision – The Results
Cost Benefit IssuesCost Benefit Issues

Prepared by:
Roger Levy; Levy Associates
48
USCLCorporation
Costs & Benefits Advanced Metering
Infrastructure System CostS
PP
Is
su
e
Cost Allocation
SP
P
Iss
ue
Outsourcing
SP
P
Iss
ue
Full system wide deployment is too expensive. Implementation should be targeted to select customers or programs.
Concern:Concern:
Response:Response:U.S. utilities have deployed over 15 million units based on utility operating savings alone.
Small customers will be adversely and disproportionately impacted by monthly fixed meter charges.
Concern:Concern:
Response:Response:Allocating meter costs using kWh usage reduces monthly impacts to under $0.50.
Outsourcing offers no benefits to utilities.Concern:Concern:
Response:Response:Two-thirds of U.S. deployments are outsourced at lower cost and risk to the utility.

Prepared by:
Roger Levy; Levy Associates
49
USCLCorporation
Infrastructure System CostS
PP
Is
su
e
Advanced Metering
Improved Data Access Impacts all Utility Functions
Data Preparation
[VEE]
System Operations
Meter Maintenance
Customer Service
Accounting and Billing
Energy Information
Services
Demand Response
Management
Demand Response
Management
Work OrderProcessingWork OrderProcessing
ESCOServicesESCO
Services
ServiceCalls
ServiceCalls
Meter ReadingMeter
Reading
System DispatchSystem Dispatch
Load Forecasts
Load Forecasts
EnergyReconciliation
EnergyReconciliation
SettlementsSettlements
EMSServices
EMSServices
PerformanceMonitoring
PerformanceMonitoringOutage
ManagementOutage
Management
MarketingSupport
MarketingSupport
Cash Management
Cash Management
Theft Management
Theft Management
Electronic Billing and
Presentment
Electronic Billing and
Presentment
RateDesignRate
Design
DataWarehouse

Prepared by:
Roger Levy; Levy Associates
50
USCLCorporation
Infrastructure System CostS
PP
Is
su
eAdvanced Metering
Establishing the Business Case
UTILITYUTILITY
CUSTOMER
SOCIETY
Business Case Perspective Emphasis
•Operational Costs
•Operational Savings
•System Integration
•Value of Services
•Value of Information
•Bill Management
•Value of Information
•Responsiveness
•Risk Management
Traditional Scope
Expanded Scope
Protect Revenue
Requirement
Improve Value of Service
Reduce Total System Cost

Prepared by:
Roger Levy; Levy Associates
51
USCLCorporation
Meter System Costs (Example)
ResidentialCommercial
Industrial
Solid State Meter and communication module $45-$75 $50-$800
Installation Cost $5-$150 $10-$300
Information and Communication Systems *
$10-$40 $10-$40
Total $ Cost per Meter $85-$265 $90-$1,000
Infrastructure System CostS
PP
Is
su
e
Per Customer / Month Incremental Cost
$1.00 to $1.50 per meter
Today’s Metering Cost$2.50 - $3.50 / meter / month
Source: WG3, industry presentation, 2003.

Prepared by:
Roger Levy; Levy Associates
52
USCLCorporation
Infrastructure System CostS
PP
Is
su
e
Advanced Metering - Utility Benefits
Cumulative Utility Benefits
$0.00
$1.00
$2.00
$3.00
$4.00
$5.00
$6.00
$7.00M
on
thly
Ben
efit
s P
er M
eter
Field Service
Administrative Customer Service
System Operations+ + +
$5.69
$7.34
$7.76
Low Benefit
High Benefit
$1.65
$0.72$0.95 $1.15 $1.22
Source: “Capturing the Value: The Future of Advanced Metering and Energy Information”, Cambridge Energy Research Associates (CERA), Final Report, Spring 1999, Chapter VI, Figure VI-6 (Levy Associates Working papers).
Industry ExperienceIndustry Experience

Prepared by:
Roger Levy; Levy Associates
53
USCLCorporation
Electric System Benefits
Puget Sound Energy
Electric System Benefits
Puget Sound Energy
47%
8%6%
4%
4%
27%
4%
Meter Reading
DiversionProcess
Improvement
Call Center
Outage Management
Revenue Enhancement
Other
Source: California Experiential Workshop, Presentation by Puget Sound Energy, Brian Pollom and Todd Starnes, September 10, 2002.
Infrastructure System CostS
PP
Is
su
e Industry ExperienceIndustry Experience

Prepared by:
Roger Levy; Levy Associates
54
USCLCorporation
Infrastructure System CostS
PP
Is
su
e Industry ExperienceIndustry Experience
Advanced Metering - System Benefits
Standards and Construction
Collections
Field Work Management
Safety
Load Forecasting
Meter Management
Demand Response
Vegetation Management
Outage and Restoration
Tariff and Regulatory
Asset Management
Billing and Customer Care
System Control
Settlement
0
Reported Percentage Reduction in System Costs
5 10 15 20 25
Source: “Distribution Technology Roadmap”, Report for the Canadian Electrical Association & Consortium, by Cap Gemini Ernst & Young, U.S. LLC, 2003.

Prepared by:
Roger Levy; Levy Associates
55
USCLCorporation
Reduce System Meter Reading Costs NO YES
Improve Billing Information, Reduce Estimated Bills LIMITED YES
Improve Financial Management NO YES
Reduce / Improve Call Center Operation NO YES
Reduce Diversion and Theft LIMITED YES
Improve System Outage Response NO YES
Better Information for Planning, Forecasting &
EvaluationLIMITED YES
Better Information for T&D Planning / Management LIMITED YES
Expanded Demand Response Planning and Evaluation LIMITED YES
System-Wide ImplementationSystem-Wide
ImplementationImproved Utility
OperationsImproved Utility
OperationsTargeted
ImplementationTargeted
Implementation
1
2
3
4
5
6
7
8
9
B
Infrastructure System CostS
PP
Is
su
eAdvanced Metering
Full vs. Targeted Deployment – Impact on Benefits(Example)

Prepared by:
Roger Levy; Levy Associates
56
USCLCorporation
Cost AllocationS
PP
Is
su
e
Advanced Metering - Cost Allocation
PROBLEMPROBLEMFixed meter charges disproportionately impact low use customer bills.
SOLUTIONSOLUTION kWh based volumetric cost allocation method.
Total Cost Per Residential Meter
Option #1.
Fixed Charge
$ / Meter / Month
Option #2.
Volumetric Charge
$ / Meter / Month
$85 - $265 $1.05 - $2.25
Monthly Usage Monthly Charge
0 - 300 kWh $0.33
301 - 500 kWh $0.56
501 – 1,000 kWh $1.12
> 1,000 kWh $1.67

Prepared by:
Roger Levy; Levy Associates
57
USCLCorporation
Meter System Economics
Financing Impacts on NPV and Payback
Source: Private communication between Levy Associates and Invensys, background data for a utility highlighted at the Distributech 2001 Utility Conference.
Outsourcing
SP
P
Iss
ue
$20
$15
$10
$5
$0
$5
$10
$15
1 2 3 4 5 6 7 8 9 10 11 12 13 14 15
OutsourceOutsource
Pay-for-ReadSynthetic Lease
Year
NP
V
($m
illi
on
s)
PurchasePurchase
1.0 3.5 11.0
Payback year

Prepared by:
Roger Levy; Levy Associates
58
USCLCorporation
Next Steps Options
1. Regulatory Process
2. Legislation
3. Settlement
4. Policy Decision