prepared by: jamal husein c h a p t e r 12 © 2005 prentice hall business publishingsurvey of...
TRANSCRIPT

© 2005 Prentice Hall Business Publishing© 2005 Prentice Hall Business Publishing Survey of Economics, 2/eSurvey of Economics, 2/e O’Sullivan & SheffrinO’Sullivan & Sheffrin
Prepared by: Jamal Husein
C H A P T E R
1212
Why Do Economies Why Do Economies Grow?Grow?

© 2005 Prentice Hall Business Publishing Survey of Economics, 2/e O’Sullivan & Sheffrin 2
Capital Deepening and Technological Capital Deepening and Technological ProgressProgressCapital Deepening and Technological Capital Deepening and Technological ProgressProgress
There are two basic mechanisms which increase GDP per capita over the long term:
1. Capital deepening
2. Technological progress
© 2005 Prentice Hall Business Publishing Survey of Economics, 2/e O’Sullivan & Sheffrin 3
Capital Deepening and Technological Capital Deepening and Technological ProgressProgressCapital Deepening and Technological Capital Deepening and Technological ProgressProgress Capital deepening refers to an
increase in the economy’s stock of capital—plant and equipment—relative to its workforce (capital per worker)
Technological progress is the ability to produce more output without using any more inputs—capital or labor

© 2005 Prentice Hall Business Publishing Survey of Economics, 2/e O’Sullivan & Sheffrin 4
The Diversity of Economic ExperienceThe Diversity of Economic ExperienceThe Diversity of Economic ExperienceThe Diversity of Economic Experience
Throughout the world, there are vast differences in standards of living and in rates of economic growth.

© 2005 Prentice Hall Business Publishing Survey of Economics, 2/e O’Sullivan & Sheffrin 5
Measuring Economic GrowthMeasuring Economic GrowthMeasuring Economic GrowthMeasuring Economic Growth
A meaningful measure of the standard of living in a given country is real GDP per capita, or real GDP per person.
The growth rate (or percentage change) of real GDP per capita is a widely used measure of economic growth.
% G D PG D P in year 2 G D P in year 1
G D P in year 1
x1 0 0 %

© 2005 Prentice Hall Business Publishing Survey of Economics, 2/e O’Sullivan & Sheffrin 6
The Rule of 70The Rule of 70The Rule of 70The Rule of 70 How many years would it take for GDP to
double? The answer is given by the rule of 70
(derived from the mathematics of logarithms):
Y ears to d o ub lep ercentage gro w th ra te)
7 0
(
For example, for an economy that grew at 5% a year, it would take
Y ears to d o ub le5
years 7 0
1 4

© 2005 Prentice Hall Business Publishing Survey of Economics, 2/e O’Sullivan & Sheffrin 7
The Diversity of Economic ExperienceThe Diversity of Economic ExperienceThe Diversity of Economic ExperienceThe Diversity of Economic Experience
Making comparisons of real GDP across countries is difficult. Each country has its own currency and its own price system.
It is difficult, therefore, to calculate the true variations in the cost of living across countries.
It takes a large team of economists to collect data on prices, identify identical quality products, and express the GDP of each country in U.S. prices.
© 2005 Prentice Hall Business Publishing Survey of Economics, 2/e O’Sullivan & Sheffrin 8
Growth Rates & Patterns of GrowthGrowth Rates & Patterns of GrowthGrowth Rates & Patterns of GrowthGrowth Rates & Patterns of Growth
One question economists ask is whether poorer countries can close the gap between their level of GDP per capita and the GDP per capita of richer countries.
Closing the gap is called convergence. To converge, poorer countries have to grow at more rapid rates than richer countries are growing.

© 2005 Prentice Hall Business Publishing Survey of Economics, 2/e O’Sullivan & Sheffrin 9
GDP Per Capita & Economic GrowthGDP Per Capita & Economic GrowthGDP Per Capita & Economic GrowthGDP Per Capita & Economic Growth
Country GDP per Capita in 1999 Dollars
Average per Capita Growth Rate, 1960-1999 (%)
United States $31,910 2.13
Japan 25,170 4.43
France 23,020 2.76
Italy 22,200 2.07
United Kingdom 22,000 3.00
Mexico 8,070 2.36
Costa Rica 7,880 2.23
Pakistan 1,860 1.04
Zimbabwe 2,610 1.28
India 2,230 1.98
Zambia 720 -1.31
© 2005 Prentice Hall Business Publishing Survey of Economics, 2/e O’Sullivan & Sheffrin 10
GDP Per Capita and Economic GrowthGDP Per Capita and Economic GrowthGDP Per Capita and Economic GrowthGDP Per Capita and Economic Growth
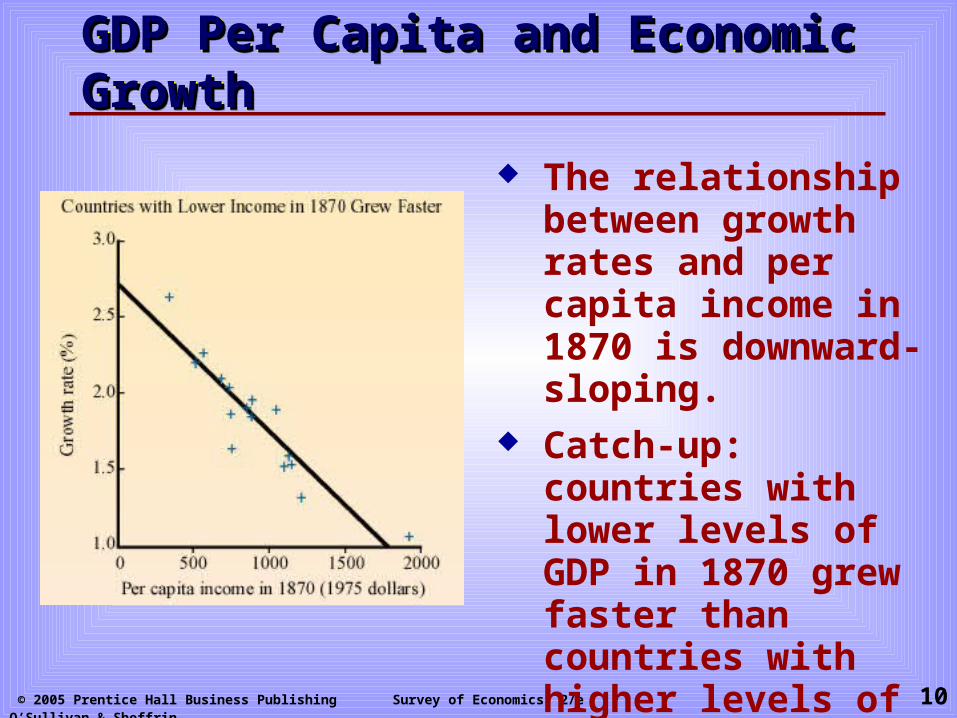
The relationship between growth rates and per capita income in 1870 is downward-sloping.
Catch-up: countries with lower levels of GDP in 1870 grew faster than countries with higher levels of GDP.

© 2005 Prentice Hall Business Publishing Survey of Economics, 2/e O’Sullivan & Sheffrin 11
Capital DeepeningCapital DeepeningCapital DeepeningCapital Deepening
With a given supply of labor, increases in the stock of capital raise real wages and lead to increases in output.
How does an economy increase its stock of capital?
The economy must increase its net investment. To increase net investment, gross investment must
also rise. The amount of income available for investment
comes from saving.

© 2005 Prentice Hall Business Publishing Survey of Economics, 2/e O’Sullivan & Sheffrin 12
Capital DeepeningCapital DeepeningCapital DeepeningCapital Deepening
By definition, consumption plus saving equals income.
S = I
Y = C + I
Y = C + S
Thus, saving must equal investment:
At the same time, income—which is equivalent to output—also equals consumption plus investment:
© 2005 Prentice Hall Business Publishing Survey of Economics, 2/e O’Sullivan & Sheffrin 13
Capital DeepeningCapital DeepeningCapital DeepeningCapital Deepening
The stock of capital increases with any gross investment spending but decreases with any depreciation.
It follows that in order for the stock of capital to increase, gross investment must exceed depreciation.
However, as capital grows, depreciation also grows, eventually catching up to the level of gross investment, and putting a stop to the growth of capital deepening.
© 2005 Prentice Hall Business Publishing Survey of Economics, 2/e O’Sullivan & Sheffrin 14
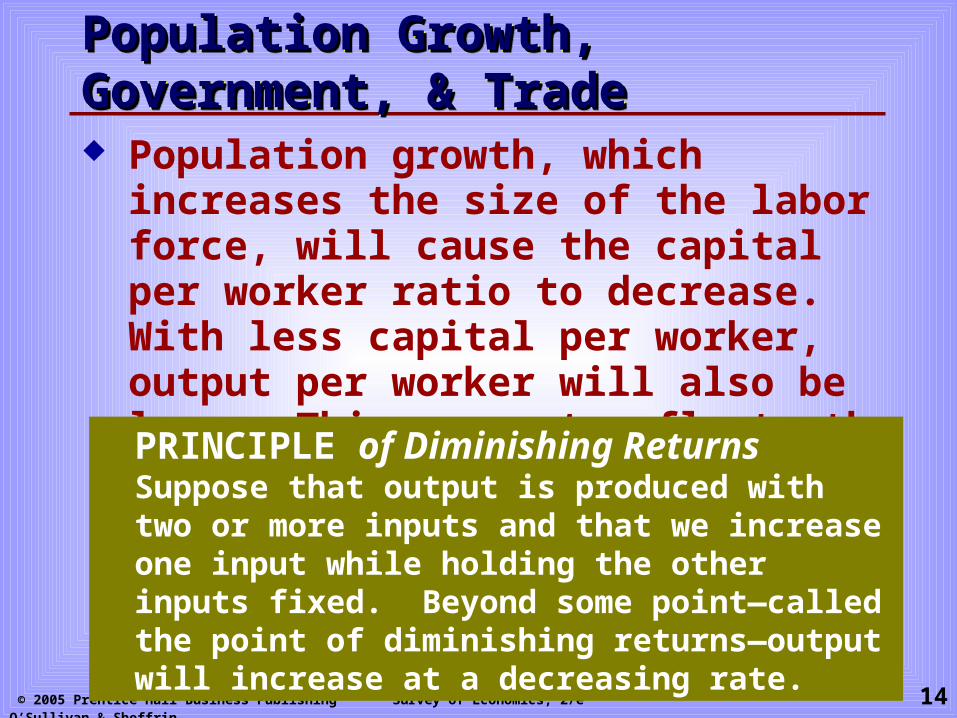
Population Growth, Government, & Population Growth, Government, & TradeTradePopulation Growth, Government, & Population Growth, Government, & TradeTrade Population growth, which increases the size
of the labor force, will cause the capital per worker ratio to decrease. With less capital per worker, output per worker will also be less. This concept reflects the principle of diminishing returns.
PRINCIPLE of Diminishing ReturnsSuppose that output is produced with two or more inputs and that we increase one input while holding the other inputs fixed. Beyond some point—called the point of diminishing returns—output will increase at a decreasing rate.

© 2005 Prentice Hall Business Publishing Survey of Economics, 2/e O’Sullivan & Sheffrin 15
Population Growth, Government, & Population Growth, Government, & TradeTradePopulation Growth, Government, & Population Growth, Government, & TradeTrade
As the government drains savings from the private sector, the amount of total investment decreases, and there is less capital deepening.
This occurs when the government uses the taxes collected from the private sector to engage in consumption spending, not investment.
Assuming that households save a fixed fraction of their income, an increase in taxes will cause savings—the amount of money that would have been available for investment—to fall.

© 2005 Prentice Hall Business Publishing Survey of Economics, 2/e O’Sullivan & Sheffrin 16
Population Growth, Government, and Population Growth, Government, and TradeTradePopulation Growth, Government, and Population Growth, Government, and TradeTrade
The foreign sector can also play a role in capital deepening.
An economy can run a trade deficit and import investment goods to aid capital deepening.
The economy can finance the purchase of those goods by borrowing and, as investment raises, GDP and economic wealth rises, and the country can afford to pay back the borrowed funds.
If the government taxes the private sector to increase investment—for example, to build valuable infrastructure such as roads, buildings, and airports, it is promoting capital deepening.

© 2005 Prentice Hall Business Publishing Survey of Economics, 2/e O’Sullivan & Sheffrin 17
There are natural limits to capital deepening. Capital is subject to diminishing returns just as labor.
Population Growth, Government, and Population Growth, Government, and TradeTradePopulation Growth, Government, and Population Growth, Government, and TradeTrade

© 2005 Prentice Hall Business Publishing Survey of Economics, 2/e O’Sullivan & Sheffrin 18
The Key Role of Technological ProgressThe Key Role of Technological ProgressThe Key Role of Technological ProgressThe Key Role of Technological Progress
Technological progress is the ability of an economy to produce more output without using any more inputs.
With higher output per person, we enjoy a higher standard of living.
Technological progress, or the birth of new ideas, is what makes us more productive. Per- capita output will rise when we discover new and more effective uses of capital and labor.

© 2005 Prentice Hall Business Publishing Survey of Economics, 2/e O’Sullivan & Sheffrin 19
Growth AccountingGrowth AccountingGrowth AccountingGrowth Accounting
Robert Solow, a Nobel laureate in economics from MIT, developed a method for determining the contributions to economic growth from increased capital, labor, and technological progress, called growth accounting.

© 2005 Prentice Hall Business Publishing Survey of Economics, 2/e O’Sullivan & Sheffrin 20
Growth AccountingGrowth AccountingGrowth AccountingGrowth Accounting
Technological progress is difficult to measure, but if we know how much are the contributions of capital and labor to economic growth, the remaining growth which we cannot explain must have been caused by increases in technological progress.
© 2005 Prentice Hall Business Publishing Survey of Economics, 2/e O’Sullivan & Sheffrin 21
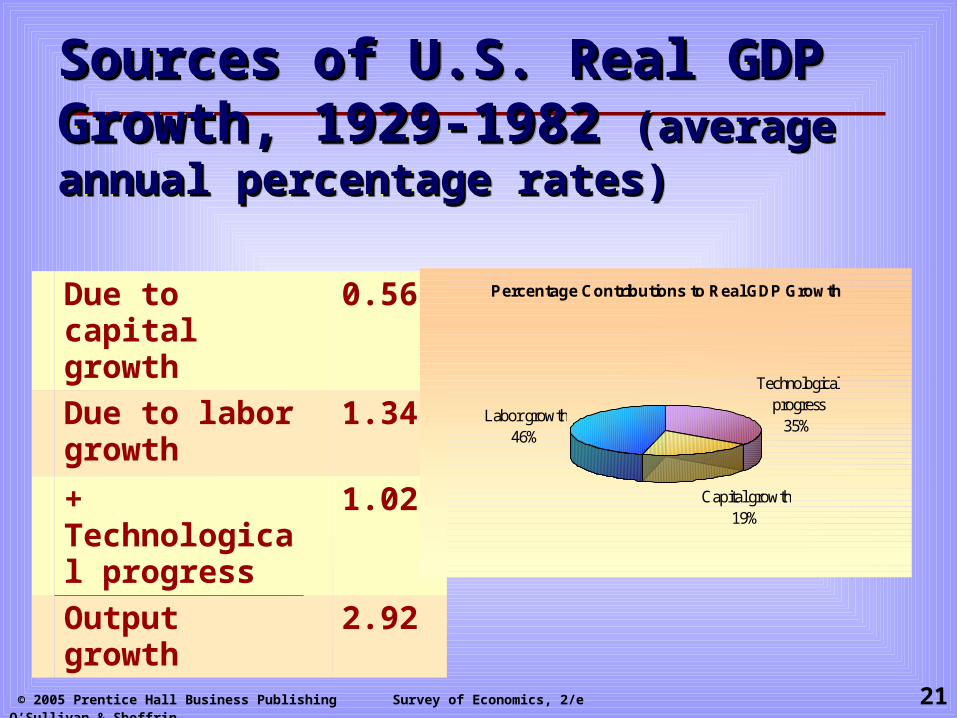
Sources of U.S. Real GDP Growth, Sources of U.S. Real GDP Growth, 1929-1982 1929-1982 (average annual percentage (average annual percentage rates)rates)
Sources of U.S. Real GDP Growth, Sources of U.S. Real GDP Growth, 1929-1982 1929-1982 (average annual percentage (average annual percentage rates)rates)
Due to capital growth
0.56
Due to labor growth
1.34
+ Technological progress
1.02
Output growth 2.92
Percentage Contributions to Real GDP Growth
Technological progress
35%
Capital growth19%
Labor growth46%

© 2005 Prentice Hall Business Publishing Survey of Economics, 2/e O’Sullivan & Sheffrin 22
Growth Accounting: Three ExamplesGrowth Accounting: Three ExamplesGrowth Accounting: Three ExamplesGrowth Accounting: Three Examples
From 1980 to 1985, the economies of Hong Kong and Singapore both grew at impressive rates of about 6%, yet the causes and results of growth in each country were very different.

© 2005 Prentice Hall Business Publishing Survey of Economics, 2/e O’Sullivan & Sheffrin 23
Growth Accounting: Three ExamplesGrowth Accounting: Three ExamplesGrowth Accounting: Three ExamplesGrowth Accounting: Three Examples
Singapore’s growth was attributed to increases in labor and capital, while in Hong Kong technological progress was the key to growth.
This means that residents of Hong Kong could enjoy the same level of GDP but consume, not save, a higher fraction of their GDP.

© 2005 Prentice Hall Business Publishing Survey of Economics, 2/e O’Sullivan & Sheffrin 24
Labor ProductivityLabor ProductivityLabor ProductivityLabor Productivity
Labor productivity is defined as output per hour of work for the economy as a whole.
It measures how much a typical worker can produce with the current amount of capital and given the state of technological progress.

© 2005 Prentice Hall Business Publishing Survey of Economics, 2/e O’Sullivan & Sheffrin 25
U.S. Annual Productivity Growth,U.S. Annual Productivity Growth,1959-20001959-2000
U.S. Annual Productivity Growth,U.S. Annual Productivity Growth,1959-20001959-2000
Years Annual Growth Rate
1959-1968 3.5
1968-1973 2.5
1973-1980 1.2
1980-1986 2.1
1986-1994 1.4
1994-2000 2.5

© 2005 Prentice Hall Business Publishing Survey of Economics, 2/e O’Sullivan & Sheffrin 26
U.S. Annual Productivity Growth,U.S. Annual Productivity Growth,1959-20001959-2000U.S. Annual Productivity Growth,U.S. Annual Productivity Growth,1959-20001959-2000
Productivity growth was extremely high during the 1960s. It slowed down a bit in the late 1960s and then slowed dramatically after the oil shocks in the 1970s.
In recent years there has been a resurgence in productivity growth, which reached 2.5% from 1994-2000.

© 2005 Prentice Hall Business Publishing Survey of Economics, 2/e O’Sullivan & Sheffrin 27
A new EconomyA new Economy??A new EconomyA new Economy??
Proponents of the “new economy” claim that the computer and Internet revolution had led to a permanent increase in productivity growth.
Skeptics question whether the increase in productivity growth was truly permanent or temporary
© 2005 Prentice Hall Business Publishing Survey of Economics, 2/e O’Sullivan & Sheffrin 28
U.S. Annual Productivity Growth,U.S. Annual Productivity Growth,1959-20001959-2000U.S. Annual Productivity Growth,U.S. Annual Productivity Growth,1959-20001959-2000
The slowdown in productivity growth also meant slower growth in real wages since 1973.
Employees received lower wages but higher benefits, but the rate of growth of total compensation was less than the growth rate of real hourly earnings in the pre-1973 period.

© 2005 Prentice Hall Business Publishing Survey of Economics, 2/e O’Sullivan & Sheffrin 29
Real Hourly Earnings and Total CompensationReal Hourly Earnings and Total CompensationReal Hourly Earnings and Total CompensationReal Hourly Earnings and Total Compensation

© 2005 Prentice Hall Business Publishing Survey of Economics, 2/e O’Sullivan & Sheffrin 30
U.S. Annual Productivity Growth,U.S. Annual Productivity Growth,1959-20001959-2000U.S. Annual Productivity Growth,U.S. Annual Productivity Growth,1959-20001959-2000
The slowdown in labor productivity, in the United States and abroad, cannot be explained by reduced rates of capital deepening or changes in the quality and experience of the labor force.
The failure of productivity growth to increase despite rapid investment in new technology is a mystery that has baffled many economists.

© 2005 Prentice Hall Business Publishing Survey of Economics, 2/e O’Sullivan & Sheffrin 31
What Causes Technological Progress?What Causes Technological Progress?What Causes Technological Progress?What Causes Technological Progress?
1. Research and development (R&D) in science.
2. Monopolies that reward high profits spur innovation (Joseph Schumpeter).
3. The scale of the market is important for economic development (Adam Smith).
4. Induced innovations, or inventive activity designed specifically to reduce costs.
5. Education and accumulation of knowledge.

© 2005 Prentice Hall Business Publishing Survey of Economics, 2/e O’Sullivan & Sheffrin 32
R&D as a Share of GDP, 1998R&D as a Share of GDP, 1998R&D as a Share of GDP, 1998R&D as a Share of GDP, 1998
Research and Development as a Share of GDP, 1995
2.58
2.28 2.34
2.05
1.14
1.61
2.2 2.2
1.78
1.11
1.58
3.00
0.0
0.5
1.0
1.5
2.0
2.5
3.0
United States Japan Germany France UnitedKingdom
Italy Canada
Per
cent
Total
Non-defense

© 2005 Prentice Hall Business Publishing Survey of Economics, 2/e O’Sullivan & Sheffrin 33
Human CapitalHuman CapitalHuman CapitalHuman Capital Human capital is an investment in human
beings—in their knowledge, skills and health.
In terms of understanding economic growth, human capital investment has too implications: Not all labor is equal. Individuals with more
education will, on average, be more productive.
Health and fitness affect productivity. If workers are frail and ill, they can’t contribute much to national output.