prepare reports for paper and online tests
TRANSCRIPT

EXAMVIEW ASSESSMENT SUITE © FSCreations, Inc. 74
PREPARE REPORTS FOR PAPER AND ONLINE TESTS
The ExamView Test Manager enables you to prepare a variety of reports based on your students’ assignment results data. You can print a report for a single assignment, a group of assignments, or all assignments. You can also easily customize a report to include selected students filtered by various criteria. Many of the reports include graphs and charts that provide a visual analysis of the data.
Use the ExamView Test Manager to generate the following class and reports.
Class Reports
Assignment Results
Class Assignment Summary
Open-Ended Responses Worksheet
Item Analysis Summary
Item Remediation Summary*
Class Roster
Learning Focus
Performance Summary
Class Performance Progress Chart
Student Reports
Assignment Results
Assignment Review
Student Progress Report
Learning Focus
Performance Summary
For each report, you can choose reporting options to control the information included
in the report. Using the filter option, you can generate reports for selected students or
a group of students that match the criteria you set.
Class Reports
The ExamView Test Manager provides numerous reports to help you understand and
evaluate your students’ performance. Depending on your needs, you may prepare one
or more of the class reports to provide useful performance data that allows you to
assess your class as a whole and then determine appropriate strategies to achieve the
learning objectives/standards. With each report, you can control numerous reporting
options to customize the report as desired. This section includes a brief overview and
a sample of each class report.

EXAMVIEW ASSESSMENT SUITE © FSCreations, Inc. 75
Assignment Results
The Assignment Results report provides performance data for each student for a particular assignment. The report includes the student’s name, ID, points earned, and percentage achieved. For online test, the report also includes attempts to complete the assignment, the start time (date and time), and the duration of the assignment (i.e., the total time to complete the assignment).
The report also includes a separate page with the assignment statistics for the entire class (i.e., median, mean, low score, high score, range, and standard deviation) and a graph of the frequency distribution. When you choose this report, you can control various reporting options. For example, you can choose to show all of the student information or you can include the ID or alias for each student.
Using the statistical data in the Assignment Results report, you can see how the majority of the students performed on the assignment. The duration data provides useful information for future reference; you can calculate the approximate amount of time required for the students to complete the assignment. Finally, you might use the Assignment Results report to post the results of an assignment.
EXAMVIEW ASSESSMENT SUITE © FSCreations, Inc. 76
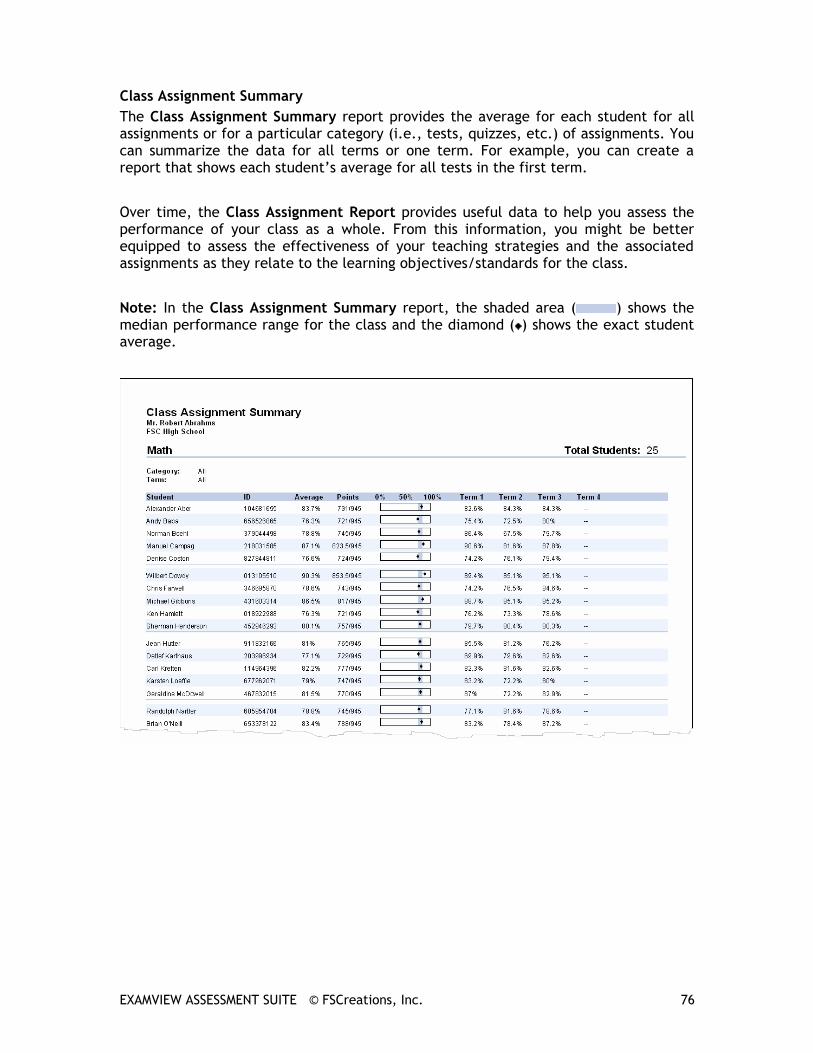
Class Assignment Summary
The Class Assignment Summary report provides the average for each student for all assignments or for a particular category (i.e., tests, quizzes, etc.) of assignments. You can summarize the data for all terms or one term. For example, you can create a report that shows each student’s average for all tests in the first term.
Over time, the Class Assignment Report provides useful data to help you assess the performance of your class as a whole. From this information, you might be better equipped to assess the effectiveness of your teaching strategies and the associated assignments as they relate to the learning objectives/standards for the class.
Note: In the Class Assignment Summary report, the shaded area ( ) shows the median performance range for the class and the diamond ( ) shows the exact student average.

EXAMVIEW ASSESSMENT SUITE © FSCreations, Inc. 77
Open-Ended Responses Worksheet
The Open-Ended Responses Worksheet report allows you to score the open-ended
questions that your students complete as part of an online test. Follow these steps to
score open-ended questions and enter the scores into the ExamView Test Manager.
1.! After all of your students finish an online test, use the option to get the results
into the ExamView Test Manager. This process reads all of the student responses
for the assignment including the open-ended questions (essay, short answer, etc.).
2.! Print the Open-Ended Responses Worksheet. The report includes the open-ended
responses for each student and space for you to write the points earned for each
question.
3.! After you complete the worksheet, use the Edit Scores option to enter the results
into the program.
You can use the Open-Ended Responses Worksheet report to work away from your
computer. You can score open-ended questions anywhere and then enter the scores
into the ExamView Test Manager at a convenient time.

EXAMVIEW ASSESSMENT SUITE © FSCreations, Inc. 78
Item Analysis Summary
The Item Analysis Summary report provides the percent of the class that answered each question correctly. For multiple choice questions, the report also shows the percent of the class that selected each response (or answer choice). You can use the response analysis in the Item Analysis Summary to identify areas in which you may want to focus a re-teaching activity so that you can better address particular learning objectives/standards. For questions with a high, correct response rate, you can use the information to validate the question. On the other hand, if students consistently answered a question incorrectly, you can assess whether this points to a problem with the question. For example, suppose students answered a question overwhelmingly (e.g., 60%) with an incorrect response. This may have occurred because you recorded an incorrect answer for the question, the question was unclear, or you did not cover the information adequately in class. If, in a particular multiple choice question, the student responses are evenly distributed for all of the answer choices, the analysis may indicate that students randomly selected a response. If, in another multiple choice question, students selected the correct response at 65% followed by 30% for the next response. This response analysis data may point to a common mistake students made in determining the correct answer for the question. On a question-by-question basis, you should look for similar patterns; such information can provide insight into your students’ understanding of the material covered by the assignment. Note: In the Item Analysis Summary report, a warning icon appears next to any question answered incorrectly by a percent of the class that is greater than the threshold level.

EXAMVIEW ASSESSMENT SUITE © FSCreations, Inc. 79
Item Remediation Summary
The Item Remediation Summary report provides a summary of questions that the class answered incorrectly at a rate higher than the set threshold level. The report pinpoints questions that may require re-teaching. The report also provides links to remedial instruction resources. Look for the globe icon to indicate that content hyperlinks are supported.
Note: Remediation hyperlinks are only available for keywords and state standards. The
state standard information must include an alignment code in order to link to remedial
instruction. The ExamView® Learning Series questions include state standard
alignment codes. Learn more at www.fscreations.com.
You can use the Item Remediation Summary to identify problem areas for your class
and locate remedial instruction activities to help with re-teaching. The report shows
the questions that fall above your set threshold, the question type, class average,
state or learning objective, and hyperlinked keywords and state standards associated
with the questions.
Remedial instruction is provided through netTrekker d.i. You must have an active
netTrekker d.i. account to access the resources. To learn more about netTrekker visit
www.netTrekker.com

EXAMVIEW ASSESSMENT SUITE © FSCreations, Inc. 80
Class Roster
The Class Roster report generates an alphabetical list of the students in a particular class. You can create a filter to include all of the class or selected students. Additionally, you can customize the Class Roster report by choosing to include the supplemental student information (i.e., ID/alias, password, grade, date of birth, sociological/economic, etc.).
You might use this report to have a printed record of the ID/alias and password for each of the students in each class. You could then conveniently reference this printout if a student forgets their ID, alias, or password. However, to maintain privacy of the IDs, you would want to keep the printout in a safe place where students and others could not access the information.
Learning Focus
The Learning Focus report provides a wealth of information to help you identify areas where your class (as a whole) needs to focus their learning efforts. To use this report effectively, the assignments you create must consistently include data for one or more of the following fields: learning objective, local standard, state standard, or national standard.

EXAMVIEW ASSESSMENT SUITE © FSCreations, Inc. 81
One of the key advantages for using the ExamView Test Manager is that you can easily gather performance data over multiple assessments. The report shows the number of items for each standard, allowing you to gauge whether a standard was adequately covered. You can select one or more assignments by category or by date. You must also identify a focus range (e.g., 0% - 70%). The program produces a report that shows each standard (or learning objective), the number of questions assessed for that standard, class average, and how many students are in the focus range.
Similar to the Item Remediation Summary report, remedial content links may be
available for the Learning Focus report when the focus is set to Learning Objective
or State Standard. Remedial instruction is provided through netTrekker d.i. You must
have an active netTrekker d.i. account to access the resources. To learn more about
netTrekker visit www.netTrekker.com
Note: The shaded area ( ) shows the performance for the median 70% of the students in your class. For example, if there are 20 students in your class, the top 3 scores (15%) and lowest 3 scores (15%) would not be included. The range of scores represents 14 students or 70% of the class. The diamond ( ) shows the actual class average. Use the graphs to see how the majority of students performed. If the area is relatively short, students’ scores were similar.

EXAMVIEW ASSESSMENT SUITE © FSCreations, Inc. 82
Performance Summary
The Performance Summary report provides a summary of your class’ performance for all class assignments in a category over a specified date range. The Performance Summary report lists a learning objective/standard, the number of items (i.e., questions) that assess that objective/standard, and the proficiency level that the class as a whole has attained.
To use the Performance Summary report effectively, you must consistently include question information for one or more of the following fields in each of the items you create: learning objective, local standard, state standard, or national standard. (Many publishers include this information for the questions they provide.)
You can customize the Performance Summary report to generate the performance data that best meet your needs. You can select the date range for the class assignments, and you can set an appropriate proficiency target (e.g., 70% and above) for the class assignments at a particular time in the term. As an example, you might set the proficiency target at 70% with the first class assignment that covers a particular learning objective/standard. Then, on a subsequent class assignment on the same learning objectives/standards, you might set the proficiency target at 80%.

EXAMVIEW ASSESSMENT SUITE © FSCreations, Inc. 83
Class Performance Progress Chart
The Class Performance Progress Chart report shows at a glance how each student is performing on each of the learning objectives/standards for all assignments in a category over a specified date range. The report lists a learning objective/standard, the number of items (i.e., questions) that assess that learning objective/standard, and a proficiency indicator for each of the students.
To use the Class Performance Progress Chart report effectively, you must consistently include question information for one or more of the following fields in each of the items you create: learning objective, local standard, state standard, or national standard. (Many publishers include this information for the questions they provide.)
To customize the Class Performance Progress Chart, you can set the category of assignments, the date range of the class assignments, and the proficiency level based on your performance criteria. The report shows one of three icons ( ) to indicate each student’s performance on each of the learning objectives/standards.

EXAMVIEW ASSESSMENT SUITE © FSCreations, Inc. 84
Student Reports
The ExamView Test Manager provides five reports that highlight each student’s individual performance for one or more assignments. This section includes a brief overview and a sample of each student report.
Assignment Results
The Assignment Results report reflects a student’s performance for one assignment. The report includes the following information: assignment average, points earned for each question, and the student’s response for each question.
If you select the option for performance results for learning objectives/standards, the Assignment Results report also includes each learning objective and the following performance data for that learning objective/standard: the average, points earned, the proficiency level, and the specific questions in the class assignment. To use the Assignment Results report effectively, you must consistently include question information for one or more of the following fields in each of the items you create: learning objective, local standard, state standard, or national standard. (Many publishers include this information for the questions they provide.)
You can use this report to identify each student’s proficiency level for each of the learning objectives/standards for each assignment. This information may also help you to identify areas in which a student may need remedial work.

EXAMVIEW ASSESSMENT SUITE © FSCreations, Inc. 85
Assignment Review
The Assignment Review report provides a tool to help your students understand the mistakes they made on an assignment. For each question answered incorrectly, the report shows the following: points earned, student’s response, correct answer, explanation, study tip, and focus area (depending on the information available).
To use the Assignment Review report effectively, you must consistently include extra question information for each of the items you create. (Many publishers include this information for the questions they provide.) For example, a study tip such as Refer to pp. 23-25 is the information in the Reference field for a question. Students, in this example, could use the report to refer to the specified pages in their textbook as they review the questions that they answered incorrectly.
Students can use the Assignment Review report to review the completed assignments and to learn from their mistakes.

EXAMVIEW ASSESSMENT SUITE © FSCreations, Inc. 86
Student Progress Report
The Student Progress Report shows a student’s progress for one or more terms. The report organizes the results by term and provides the following information for each assignment: assignment description, date assigned, category, points earned, percent achieved, and class average. A summary shows the term average by listing the total points earned out of the total possible points, the equivalent percent, and the class average.
You can use the Student Progress Report to depict the student’s progress over time.

EXAMVIEW ASSESSMENT SUITE © FSCreations, Inc. 87
Learning Focus
The Learning Focus report identifies areas where a student needs to focus his/her learning efforts. Based on a proficiency level you set, the report lists the learning objective/standards that a student has not mastered. For each of the learning objectives/standards the student has not yet mastered, the Learning Focus report lists the learning objective/standard, the associated number of items, the points earned on items, and the proficiency level that the student has attained.
You can customize the Learning Focus report to generate the performance data that best meet your needs. You can select one or more class assignments by category and the date range for the assignments. You can set an appropriate focus range (e.g., 0% - 70%) for the class assignments at a particular time in the term. As an example, you might set the focus range at 0% to 70% with the first class assignment that covers a particular learning objective/standard. Then, on a subsequent class assignment on the same learning objectives/standards, you might set the focus range to 0% to 80%.
You can use the Learning Focus report to help a student know exactly what to study in order to attain mastery level on the identified learning objectives/standards.
Note: The shaded area ( ) shows the performance for the median 70% of the students in a class. For example, if there are 20 students in a class, the top 3 scores (15%) and lowest 3 scores (15%) would not be included. The range of scores for 14 students (70%) would be represented. The diamond ( ) shows your student’s actual performance. Use the graphs to see how a student performed in relation to his/her class. For example, if the diamond appears near or past the right edge of the shaded area, the student’s performance is in the upper range for the class. If the shaded area is relatively short, students’ scores were similar.

EXAMVIEW ASSESSMENT SUITE © FSCreations, Inc. 88
Performance Summary
The Performance Summary report shows at a glance how a student is performing on all learning objectives/standards for all assignments in a category over a specified date range. The Performance Summary report lists each learning objective/standard, the number of items (i.e., questions) that assess each learning objective/standard, a proficiency score for each learning objective/standard, whether the student is proficient based on the proficiency target, and the average for each learning objective/standard.
To use the Performance Summary report effectively, you must consistently include question information for one or more of the following fields in each of the items you create: learning objective, local standard, state standard, or national standard. (Many publishers include this information for the questions they provide.)
You can use the Performance Summary report to identify specific learning objectives/standards where the student needs to focus his/her learning efforts.

EXAMVIEW ASSESSMENT SUITE © FSCreations, Inc. 89
Print a Report
After ExamView Test Manager prepares a report, you can print the report in just a few simple steps. When you are ready to print a report, follow these general instructions. Numerous report options allow you to customize the information that appears on the printout. For detailed instructions and options, see the corresponding help topic in the application.
To print a report…
1. Click the Report menu and choose a report.
2. Select the report options.
3. Click the OK button to display the report.
4. While viewing the report, click the Print button to
send the report to the printer.
Export Assignment Results
The ExamView Test Manager lets you export the students’ results data for an assignment. You can export summary data (e.g., student name, ID, and percentage) or detailed data (e.g., student information, all responses, answer key, etc.). With the export option you can export student results in order to import them into your gradebook or a spreadsheet. For more advanced users, you can export the results for use with a student information system.
To export the results for an assignment…
1. Select an assignment.
2. On the File menu, point to Export, and then click the Assignment Results as Text
or Assignment Results as XML option.
Use the as Text option to export results for use with a gradebook or a spreadsheet
program. Use the as XML option to export results to a student information system.
3. Set the options (if necessary) and then enter a file name.
Note: You can also use the Copy All Class Records option in the Edit menu to copy
all of the information in the work area. Then, you can paste that information into a
spreadsheet document.
You can set a filter to print only selected students based on
various criteria.