preparation and characterization of activated … chemical science journal, 2(4): 136-160, 2012 139...
TRANSCRIPT

____________________________________________________________________________________________
*Corresponding author: Email: [email protected];
American Chemical Science Journal2(4): 136-160, 2012
SCIENCEDOMAIN internationalwww.sciencedomain.org
Preparation and Characterization of ActivatedCarbons Obtained from Maize Cobs by Zinc
Chloride Activation
J. M. Ketcha1, D. J. D. Dina1,2*, H. M. Ngomo1 and N. J. Ndi1
1Department of Inorganic Chemistry, University of Yaoundé I, P.O Box 812,Yaoundé- Cameroon.
2Department of Chemistry, University of Douala, P.O Box 24157, Douala-Cameroon.
Authors’ contributions
This work was carried out in collaboration between all authors. Author DJDD designed thestudy, wrote the first draft and managed the literature searches. Authors JMK and HMN
managed all the analysis of the study and corrected the first manuscript. Author NJN alsocorrected the manuscript. All authors read and approved the final manuscript.
Received 16th July 2012Accepted 5th November 2012
Published 20th November 2012
ABSTRACT
Aims: To set up high adsorbent materials at lower cost from agricultural wastes in thiscase maize cobs and to characterize these materials.Study Design: Determination of the textural and physicochemical properties of theprepared materials.Place and Duration of Study: Technological University of Chalmers, Nuclear ChemistryLaboratory, Goteborg, Sweden, between November 2010 and January 2011.Methodology: Five activated carbon samples of maize cobs were prepared by chemicalactivation with zinc chloride (ZnCl2). They were characterized and the values of theirtextural (SEM images and XRD patterns) and physicochemical properties (specific surfacearea, pore volume, pore size and functional groups) were determined and compared withthose of a commercial activated carbon of animal origin.Results: The results showed that the part of the cob used, the residence time, the quantityand the state of the activating agent affected the activated carbon produced. Thus, thecarbon material obtained from the woody belt (hard part of the cob) showed the mostsignificant properties with a specific surface area of 701.68 m2/g and a porous volume of
Research Article

American Chemical Science Journal, 2(4): 136-160, 2012
137
about 0.39 cm3/g. On the other hand, samples obtained from the soft part of the cob mixedwith small particles of woody belt, gave low specific surface area (0.43-11.62 m2/g) andporous volumes (0.00028-0.11 cm3/g). In addition, all these chars presented acidicfunctions at their surfaces.Conclusion: The study revealed that maize cobs particularly the hard part of the cobs, anagricultural waste, can be used as raw material for the preparation of activated carbon.
Keywords: Activated carbon; maize cobs; chemical activation; physicochemical properties.
1. INTRODUCTION
Human activity is at the origin of immense environmental degradation as seen throughwidespread contamination and pollution. Well known and frequently used techniques forelimination of wastes from gas and liquid streams include oxidation, precipitations, filtrations,ions exchange, ultra filtration, reverse osmosis, electrochemical deposits and adsorption(Lallemand-Barrès, 2000; Masclet, 2005; Meunier and Liang-Ming, 2003) on the compoundssuch as zeolites, clays, silica gel, the resins, alumina activated or the activated carbon arefound in literature (Meunier and Liang-Ming, 2003; Thibault-Starzyk, 2004). Most of thesetechniques are not achievable in very expensive, small and medium-size companies hencethe need to choose technologies which are simple, economic, effective and, especially non-polluting such as adsorption (Meunier and Liang-Ming, 2003; Thibault-Starzyk, 2004). Thus,adsorption with porous surfaces has frequently being used for the elimination ofcontaminants found at low concentrations in the environment and in the industrial effluents.
In view of the above, a diversity of adsorbent materials has been tested for their suitability inthe elimination of contaminants. Activated carbons turned out to be the most used, not onlybecause of its high adsorptive capacity (Kadirvelu et al., 2003; Marsh and Rodriguez-Reinoso, 2006; Sircar et al., 1996) and its intrinsic physicochemical properties such asporosity, specific surface area and the nature of surfaces, but also because of theabundance of raw material from which it can be prepared. Activated carbon is used inseveral industrial applications; in the extraction of organic and inorganic pollutants found inaqueous or in gas phase, water and waste water treatment, metal extraction, sugarcanejuice decolourization, in the pharmaceutical and agro based industrial waste (Lynch, 2001;Marsh and Rodriguez-Reinoso, 2006; Van der Hoek, 1999; Wrench, 2007).
The activated carbons, distinguishable by their conditions of preparation, and consequentcharacteristics were prepared from maize cobs; a raw material which had not been usedbefore in our lab. The preference for maize cobs is due to several reasons. Maize, the rawmaterial chosen for this study, is widely grown in Cameroon and in the central African sub-region. Reason for the choice of maize cobs is twofold; availability and thermodynamicsfactor. In most cases, the residues from the primary processing of maize, which consists offoliage, stalks and cobs, except in the arid Sahel North of the country where they are usedas fuels for domestic heating or for cattle nutrition, are usually disposed in the open air.Thus, a huge amount of maize cobs are harvestable for the preparation of activated carbon.Secondly, on purely thermodynamic considerations, maize cob has a low combustion energyvalue and, thus, a low carbonization temperature compared to other biomass residues(Zych, 2008).
American Chemical Science Journal, 2(4): 136-160, 2012
138
Through the years, activated carbon has been prepared by two stage process involvingchemical activation. That is the impregnation of the carbonaceous material with a chemicalspecies-usually an inorganic salt-followed by carbonization. The challenge has been first, thesearch for suitable chemical species for impregnation and, second, determining the mostappropriate operating carbonization conditions that will favour the production of the mostdesirable properties per surface area in the activated carbon. Whereas carbonizationremoves volatile matters from the raw material, activation serves to develop the porosity ofthe material in the course of the carbonization. The carbonization process is very energydependent and constitutes a significant cost component in industrial production. Therefore, araw material such as maize cob, requiring lower carbonization is preferable to otherbiomass.
Usually, carbonization and activation take place separately and several authors such asChilton et al. (2003) and Koutcheiko et al. (2007) have adopted that strategy. Recently, thetendency has been, rather, to prepare the activated carbon resulting from agricultural wastesby chemical activation (carbonization and activation simultaneously) (Adinata et al., 2007;Avom, 1982; Avom et al., 2001; Boudrahem et al., 2009; Ibañez, 2002). The development ofthe pores during the preparation is very difficult to observe and the majority of the authorssuch as Tang and Bacon (1964) and Soltes and Elder (1981) were limited like in this work tothe interpretation of the phenomena observed during the preparation such as the releases ofgas and the liquids rejected by this preparation according to time and of the temperature.
Temperature is known to be a determinant factor in the activated carbon structure produced.Carbonization which takes place at low temperatures, generally, gives a material having lowporosity (Avom, 1982; Avom et al., 2001) and a disordered structure, whereas the activationwhich takes place at high temperatures develop porosity (Avom, 1982; Avom et al., 2001).Literature on the preparation of activated carbon from diverse sources, particularlyagricultural residues, under different experimental conditions and methods are abundant(Acharya et al., 1999; Cronje et al., 2002; Kumar et al., 2010; Rastogi et al., 2007; Sahu etal., 2009). Usually, such studies have involved the comparison of the performance of theensuing activated carbon with a commercial activated carbon with respect to the eliminationof ions at low concentration. Results reveal some lack of correlation between carbonizationtemperature and its duration, and between chemical species loading to well known factorsas porosity, site pore concentration, adsorptive capacity etc (Lazano-Castello et al., 2001).Data on preparation of activated carbon from maize cobs, even with the widespread use ofmaize is not known to enable the exploitation of its residue for industrial scale preparation.
The innovation of this work resides not only on the raw material the maize cobs ofCameroon, but also in the mode of obtaining the activated carbon. Indeed in former work onthe preparation of the activated carbon from maize cobs (Chang et al., 2000; Tsai et al.,1998; Tsai et al., 2001), the cobs were directly mixed with the precursor whereas in thiswork, the activated carbon are obtained starting from the various parts of the cobs (the hardpart and the soft part). In addition, the activating agent (zinc chloride) was used in solutionand in solid state which is an innovation because the majority of the authors in the same linefor the preparation of AC (Boudrahem et al., 2009; Tsai et al., 1998) used zinc chloride onlyin the liquid state. In addition contrary to the authors such as Qiang et al. (2007) whose aimsare to obtain materials with very significant porosity characters, this work, in teals andimprovement in chemical properties like surface functional groups. These activated carbonsare designed to improve environment and hygienic status in Cameroon where there arepollution problems mainly water pollution.

American Chemical Science Journal, 2(4): 136-160, 2012
139
The objective of this work was to prepare and characterize activated carbon from maizecobs in order to relate the preparation conditions (carbonization and chemical activation) tothe carbon's essential physicochemical properties. The chemical species used here was zincchloride. Thus, in this work, powder samples of maize cobs with different ZnCl2 loading willbe subjected to carbonization at different time duration. Carbonization and activation will becarried out simultaneously.
2. EXPERIMENTAL DETAILS
2.1 Preparation of Activated Carbon from Maize Cobs
The maize cob is, structurally, made up of two distinct parts—the soft part consisting of theperiphery and marrow; the woody belt which constitutes the hard part of the cob.
2.1.1 Crushing and separation into different particle sizes
The maize cobs used in this work came from a field located at SOA, a University townlocated about 10 km from Yaoundé, the capital of Cameroon. Upon harvesting, the maizecobs contained several impurities, particularly earth. It was thus necessary to wash themabundantly to get rid of all the impurities which could influence the final composition ofmaterial. The washing was followed by drying for a long period open air in order to removethe residual water from washing as well as to reduce the moisture content of the fresh cobs.They were then crushed and sieved (sieve type; AFNOR X11-501) and then distributed in adistributor of the type RETSCH and then they were crushing into different particle sizes. Thefinest particles resulted from the soft part of the cob and largest of the hard part. Thedistributor distributed the raw material particles in definite intervals of sizes while separatingthose particles not within the desired interval. The particles were divided into two partsaccording to their particle sizes. One part was primarily made up of the soft part of the cobs(periphery and marrow) and fine particles of the hard part (thicknesses ranging between 1.25and 1.75 mm). The other part was made up, exclusively, of the hard part of the cobs (woodypart) having particle sizes higher than 1.75 mm. The two parts were visible not only by thephysical appearance (left soft and part lasts) and also by the colour (the soft part was grayand white and the hard part was ox-blood coloured). Thus the soft parts with some hardparticles passed in first through the sieve while the hard parts recognizable by theirappearance and colour were retained on the sieve.
2.1.2 Chemical activation with zinc chloride salt
After obtaining the crushed particles, they were separated into the following 5 sampleslabelled on the basis of the concentration or state of the activation salt and the activationtime M10-60-100, M10-24-100, MAPZC3, MAPZC4 and MAPZC5. Thus, the first twosamples, M10-60-100 and M10-24-100, activated by use of a 10% solution of ZnCl2 and forduration of 60 minutes (one hour) and 24 hours, respectively. The samples labelledMAPZC3, MAPZC4 and MAPZC5 were activated with solid ZnCl2 (2g, 3g and 1grespectively) for 60 minutes (Table 1).
To activate a sample, the following procedure was carried out. The crushed particles (20g)were weighed on an electronic balance with high sensitivity. The material was dried in adesiccators to remove the high initial moisture content before transferring to a drying ovenset at 120ºC for 24 hours. After 24 hours it was assumed that all the moisture and some of

American Chemical Science Journal, 2(4): 136-160, 2012
140
the volatile material had left. The material was then re-dried in the desiccator and weighedonce again. It was then impregnated with the activating agent (zinc chloride). According tothe sample, the activating agent was mixed with the matter by agitating for one hour toensure the access of ZnCl2 to the interior of the precursor until a homogeneous mixture isobtained. The impregnation ratios and the state of the activating agent are found in Table 1.After the impregnation the mixture (raw material and activating agent) was returned to theoven for 24 hours. A dried mixture ready to be carbonized was thus obtained.
Table 1. Mode of preparation of the activated carbon of maize cobs by ZnCl2 activation
Adsorbent aM10-60-100
bM10-24-100
cMAPZC3 dMAPZC4 eMAPZC5
Particles size (mm) 1.25-1.75 1.25-1.75 1.25-1.75 1.25-1.75 ≥1.75Concentration (%) or massesof activating agent (g)
10% 10% 2 3 1
Impregnation ratio(wZnCl2/wmaize cobs)
1/200 1/200 1/10 3/20 1/20
Residence time (h) 1 24 1 1 1Mass of obtained material onthe outlet side of the furnace(g)
5.312 4.9839 7.2157 10.1365 7.6081
Mass of activated carbon afterwashing and drying (g)
5.284 4.8613 6.0252 8.5830 7.1270
Physical aspect of theactivated carbon obtained
soft andblack seeds
soft andblack seeds
Blackseeds
Blackseeds
Large blackseeds
aM10-60-100: Maize cobs activated carbon (light part) obtained with 10%ZnCl2 solution and timeresidence=60minutes; bM10-24-100: Maize cobs (light part) activated carbon obtained with 10% ZnCl2
solution and time residence=24 hours; cMAPZC3: Maize cobs (light part) activated carbon obtainedwith 2g of solid ZnCl2; dMAPZC4: Maize cobs (light part) activated carbon obtained with 3g of solid
ZnCl2; eMAPZC5: Maize cobs activated carbon (hard part) obtained with 1g of solid ZnCl2. Operatingconditions: Impregnation duration: 1hour; heating rate: 10ºC/min; Carbonization temperature: 500ºC;
temperature of cooling: 100ºC.
2.1.3 Carbonization
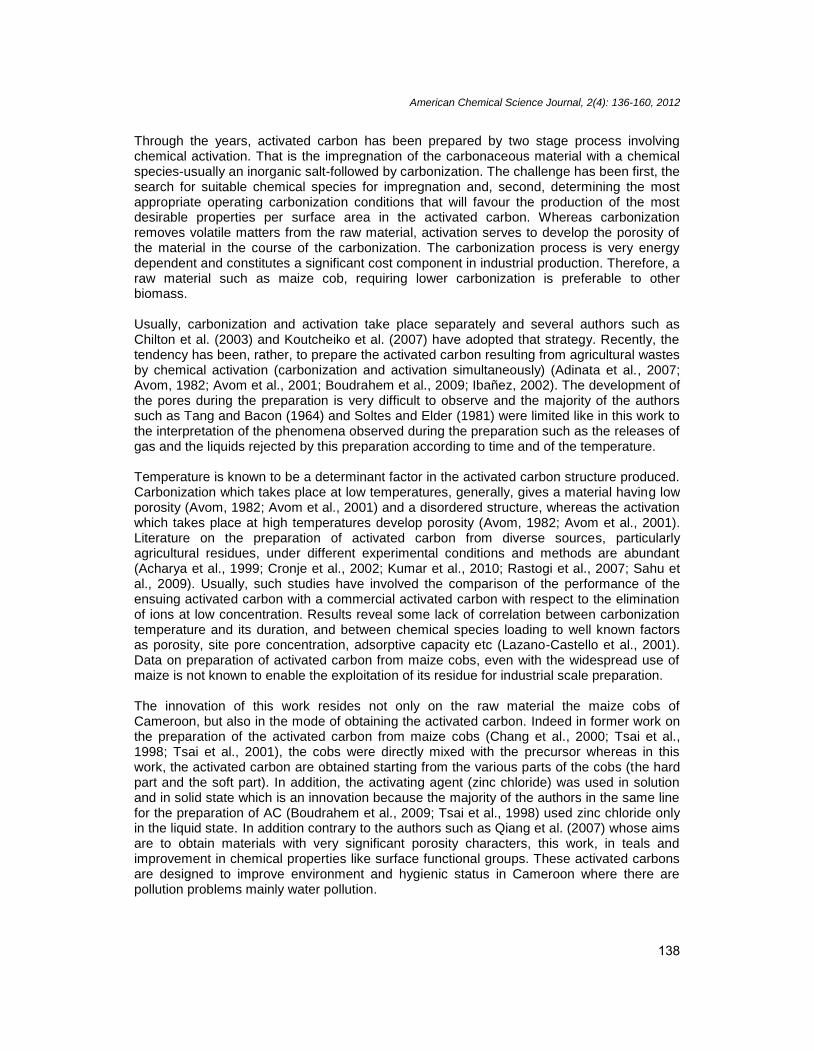
The experimental set up for carbonization is shown in Fig. 1. This experimental deviceconsisted of a continuous steel pipe (F) of type AVANTEC model 92884 which can reach atemperature of 1200ºC and having a device regulating the temperature according to time (T),of a quartz tube (Q) having an opening (A) in which the mixture (M) obtained previously wasintroduced for carbonization using a spatula. The Pyrex tube (P) having two openings ofwhich one was connected to the quartz tube (Q) in (A) this supplements experimental set up.The purpose of this tube provided with a valve (V) was to control the exit of gases.Carbonization in itself consisted of the introduction into the quartz tube (Q) of the mixture(M). The tube (Q) was then introduced into the furnace (F) heated beforehand at 100ºC. Thespeed of heating (regulated on the level of (T)) was maintained at 10ºC/min. The duration ofimpregnation was maintained at 1 hour and the maximum temperature at 500ºC for all thesamples.
American Chemical Science Journal, 2(4): 136-160, 2012
141
Fig. 1. Experimental set up in the preparation of the activated carbon of maize cobs(F): Continuous steel pipe; (T): Temperature regulator; (Q): Quartz tube; (A): Opening; (M): Mixture;
(P): Pyrex tube; (V): Valve.
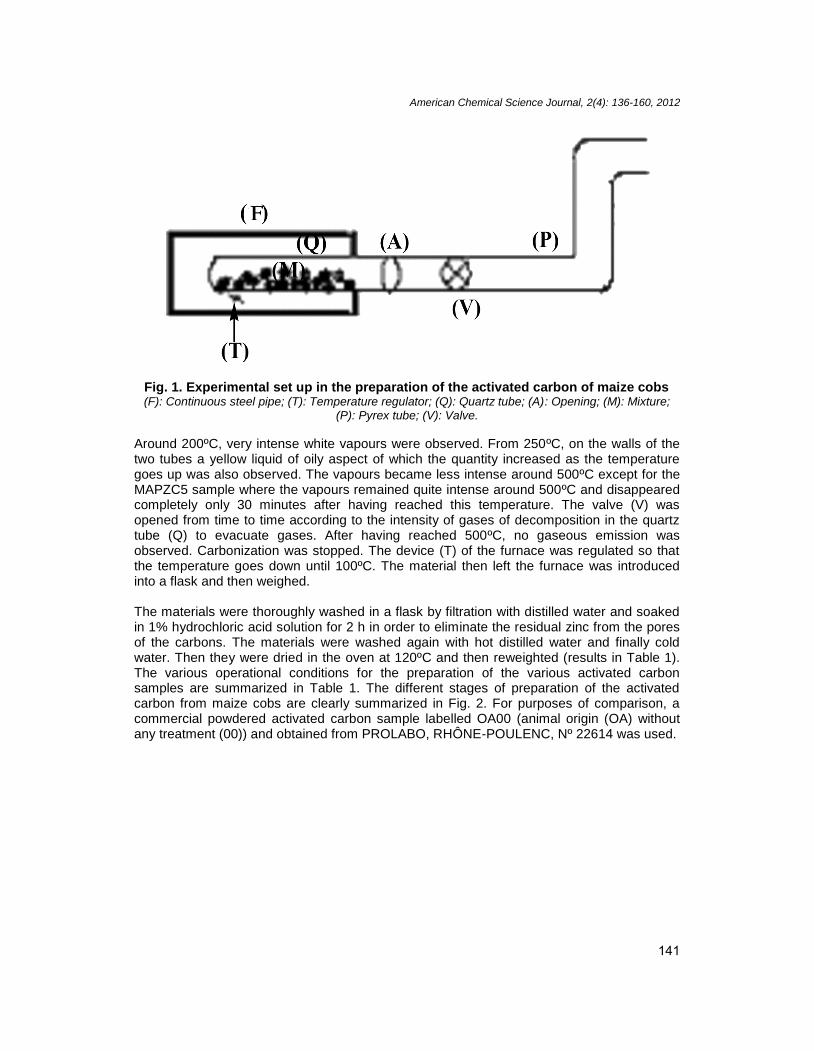
Around 200ºC, very intense white vapours were observed. From 250ºC, on the walls of thetwo tubes a yellow liquid of oily aspect of which the quantity increased as the temperaturegoes up was also observed. The vapours became less intense around 500ºC except for theMAPZC5 sample where the vapours remained quite intense around 500ºC and disappearedcompletely only 30 minutes after having reached this temperature. The valve (V) wasopened from time to time according to the intensity of gases of decomposition in the quartztube (Q) to evacuate gases. After having reached 500ºC, no gaseous emission wasobserved. Carbonization was stopped. The device (T) of the furnace was regulated so thatthe temperature goes down until 100ºC. The material then left the furnace was introducedinto a flask and then weighed.
The materials were thoroughly washed in a flask by filtration with distilled water and soakedin 1% hydrochloric acid solution for 2 h in order to eliminate the residual zinc from the poresof the carbons. The materials were washed again with hot distilled water and finally coldwater. Then they were dried in the oven at 120ºC and then reweighted (results in Table 1).The various operational conditions for the preparation of the various activated carbonsamples are summarized in Table 1. The different stages of preparation of the activatedcarbon from maize cobs are clearly summarized in Fig. 2. For purposes of comparison, acommercial powdered activated carbon sample labelled OA00 (animal origin (OA) withoutany treatment (00)) and obtained from PROLABO, RHÔNE-POULENC, Nº 22614 was used.

American Chemical Science Journal, 2(4): 136-160, 2012
142
Fig. 2. General Scheme for the preparation of the activated carbon of Crop origin(in this case, maize cob)
Preparation of the raw material:the maize cobs (washing,drying, crushing)
Impregnation with ZnCl2
M10-60-10010% ZnCl2
M10-24-100 10%ZnCl2
MAPZC32g ZnCl2
MAPZC43g ZnCl2
MAPZC51g ZnCl2
Carbonization and pyrolysis (100ºC-400ºC); chemical activation under
gas of decomposition (400ºC-500ºC); maximum temperature:
500ºC; Speed of heating: 10ºC/min
Cooling (500ºC-100ºC)
Washing with a solution of HCl 1% thenwith distilled water and hot distilled water
and finally with cold distilled water
Drying in the oven (120ºC)
Activated carbons of maize cobs

American Chemical Science Journal, 2(4): 136-160, 2012
143
2.2 Characterizations Techniques
Four techniques of characterization have been used to characterize the activated carbons ofmaize cobs according to the furnished information’s (structure, chemistry, morphology andporosity (Crini and Badot, 2007; Dresselhaus et al., 1992).
2.2.1 SEM-EDX analysis
Characterization was performed by electron microscopy with EDX detection for thedetermination of relevant elements using a FEI Quanta 200 FEG (Field Emission Gun)ESEM operated at 15-20 kV and coupled to an Oxford Inca 300 EDX system. The detectionlimit of EDX-system was about 1 wt% and the penetration depth was about 1 μm. Themicrographs of the activated carbon of maize cobs (size 20 µm) and of sample OA00 (size 2µm) provided by the SEM and the elementary chemical compositions are found in the thirdpart.
2.2.2 XRD analysis
The main crystalline compounds in samples were identified by qualitative X-ray powderdiffractometry (XRD) using a Siemens D5000 X-ray powder diffractometer with thecharacteristic copper radiation and a scintillation detector. The identification of compoundswas performed through comparison with standards in the Joint Committee of PowderDiffraction Standards issue 2010 (IUPAC, (2010)). XRD patterns of the studied activatedcarbons are found in the third part.
2.2.3 FTIR analysis
The Fourier transform Infra red (FTIR) analysis of maize cobs was carried out by a FTIRequipment of mark SPECTRUM ONE FT-IR incorporated with software (Perkin ElmerInstruments version 3.02.01) for the examination of the spectra. For sample analysis, 0.5 gof activated carbon was mixed with about the same amount of potassium bromide KBr. Themixture thus obtained was crushed in a mortar to obtain a homogeneous powder which wasthen introduced into a mould to obtain very fine plates. The plates were then introduced intothe spectrophotometer for analysis. The wave number was found to vary between 4000 and450 cm-1. FTIR spectra of the studied activated carbon are found in the third part.
2.2.4 Specific surface area and porosity
Specific surfaces area and porosity were determined by physical adsorption of nitrogen N2on the surface of the activated carbon. Nitrogen adsorption measurements were carried outwith an ASAP 2020 instrument from Micromeritics, USA. This equipment measuredautomatically, the adsorption and desorption isotherms at T=77 K and from the data, itcalculated a Brunauer-Emmett-Teller (BET) model fitting for specific surface area. Theporosity included total volume and surface area of mesopores and lower range ofmacropores (measurable size range: 2-300Å) were also measured.
Before the analyses, samples of about 0.1 g were degassed at vacuum (about 5μm Hg) andat T=353 K for 3 hours. For the measurement of the samples, a program was used thatcollects about 100 data points (50 each for adsorption and desorption) evenly distributedbetween P/P0=0.02 and P/P0=1. For some graphite samples only BET models could be fittedto the data.

American Chemical Science Journal, 2(4): 136-160, 2012
144
2.2.5 Determination of the pH
A mass of 0.05g of activated carbon was mixed in 50 ml of distilled water at a temperature of25ºC to determine the pH of the solution containing the activated carbon. After agitation, thepH of each sample was measured.
3. RESULTS AND DISCUSSION
3.1 Influence of Preparation Parameters
Five activated carbon samples labelled M10-24-100, M10-60-100, MAPZC3, MAPZC4, andMAPZC5 were obtained. The parameters varied in the preparation of the activated carbonsamples (yields, impregnation ratio (IR) and CR chemical recovery for each sample) arepresented in Fig. 3. This Fig. shows the parameters that determine the influence of theactivating agent ZnCl2, its physical status and on the basis of activation in the procedureprocessing of the activated carbon. It also makes it possible to investigate the part of thecobs which would give the best activated carbon taking into account the fact that the maizecob has rather a complex natural structure (a hard part and a light part). Cagnon et al.(2009) showed that the calculated yields do not take into account the amount of raw materialused and that the weight contribution of the hemicelluloses ranges between 14.1% and24.5%, the cellulose from 5.6% and 27.6% and the lignin from 55.0% to 79.0%. Theseauthors concluded that lignin can be considered as being the major weight contributor to allchars and the cellulose and hemicellulose weight contribution not negligible. Thus the worksof Cagnon et al. (2009) explain why the materials M10-60-100 and M10-24-100 preparedfrom the soft part of the cobs (consisting mainly of cellulose and hemicelluloses) (Maha et al.(2010)) have low yields compared to the other materials. Furthermore the carbon MAPZC5produced from hard part of cob, which contained a great amount of lignin gives a yield ofabout 35.63% far greater than the yield of samples M10-60-100, M10-24-100 and MAPZC3.The yield of the sample MAPZC4 42.91% is explained by the high content of zinc chlorideZnCl2 (3g) used in the preparation of this material even though the raw material used in itspreparation.
During the preparation of the activated carbon of maize cobs, several parameters werevaried (Table 1)—particles size of the particles, concentration or mass of the activatingagent, physical state of the activating agent (solid or liquid), time of residence, part of thecobs used (light part or girdles woody).With practically the same experimental conditions,several authors such as Aber et al. (2009) (activation with K2HPO4 at 700ºC), Boudrahem etal. (2009) (activation with ZnCl2 at 600ºC with a rate of 10ºC/min), Adinata et al. (2007)(activation with K2CO3 at 600-800ºC with a rate of 10ºC/min), Kumar et al. (2010) (activationwith 24% NaOH at 165ºC), Qiang et al. (2007) (activation with ZnCl2 at 400-900ºC) andKoutcheiko et al. (2007) (activation with NaOH at 600ºC with a rate of 5ºC/min) obtainedactivated carbon with very good characteristics with activated carbon sample having specificsurfaces reaching 2170 m2/g and porous volumes being able to reach 1.70 cm3/g in the caseof the work of Qiang et al. (2007) for example.
Taking into account previous works referred to the above preparation of activated carbonstarting from vegetable precursors, parameters such as the maximum temperature, heatingrate, the temperature of cooling, were maintained at constant values in this work. Theimpregnation ratios retained in this work are those having provided better results in theliterature (Avom, 1982; Avom et al., 2001; Ibañez, 2002; Nono, 1989). Indeed, according to

American Chemical Science Journal, 2(4): 136-160, 2012
145
Tsai et al. (1998), the most important parameter in chemical activation of maize cobs withzinc chloride (ZnCl2) was found to be impregnation ratio (IR), this is why a particular accentwas related to this parameter. The other parameters are rather traditional and practicallystandard in the majority of works with maize cobs (Chang et al., 2000; Tsai et al., 1998; Tsaiet al., 2001). In addition, the cobs with soft structure do not require high carbonizationtemperature values (compared to the temperatures generally used in the preparation of theactivated carbon by physical activation for example), thus, 500ºC is a satisfactorytemperature for this process. As for heating rate, 10ºC/min is considered slow. At this rate,very few volatile compounds are observed to be present in final material and the originalstructure of material is generally preserved (Ibañez, 2002; Soltes and Elder, 1981). The useof zinc chloride ZnCl2 as activating agent prevents the formation of tars which blocks thepores (Avom, 1982). Chemical activation by ZnCl2 improves the pore development in thecarbon structure, and because of the chemical effects, the yields of the obtained activatedcarbon are usually high (Ahmadpour and Do, 1997) (Fig. 3). The decomposition gases weremaintained in the apparatus because they make it possible to obtain activated carbon withbetter adsorbent properties than those obtained in vacuum (or in inert atmosphere) or withother gases such as O2, CO2, N2 (Avom, 1982).
As observed previously, intense vapours appeared during the preparation of the variousactivated carbon samples between 200ºC and 400ºC. These vapours are stabilized around400ºC and then stop completely at this temperature except for the MAPZC5 sample wherethe vapours stop only after having reached the maximum temperature of 500ºC. It is thedecomposition of the various components of vegetal cells combined with the simultaneousactivation of zinc chloride which are in all the cases at the origin of these intense vapours(Avom, 1982; Soltes and Elder, 1981). Indeed between 150ºC and 300ºC, the celluloseloses its structural water (Avom, 1982) between 200ºC and 260ºC occurred thedecomposition of hemicelluloses, and that of cellulose between 240ºC and 350ºC. Duringthese two decompositions, rupture of the C-O and C-C bonds occurs, as well as the ruptureof the chains or depolymerisation (Tang and Bacon, 1964). The degradation of lignin isobserved from 280ºC and is completed only after 500ºC. This explains why in the MAPZC5sample, which consists primarily of the woody belt (hard part of the cob), intense vapoursare observed even after having reached the maximum temperature because this precursorwould contain more lignin than all the others in which the vapours practically stop in thevicinity of 400ºC. The samples containing less zinc chloride ZnCl2 produce more vapoursthan the others.
Fig. 3 represents the impregnation ratios (I.R), the chemical recovery C.R and the yields ofthe activated carbon of maize cobs. Generally, this data reveals that the I.R stronglyinfluences the yield. Indeed, the higher the impregnation ratio, the higher the yield of the finalmaterial. Except for the M10-60-100 sample, the CR for all the samples is higher than theyield. The time of residence also influences the yield of the final material; the higher theactivated carbon is maintained at the maximum temperature, the lower the yield (sampleM10-60-100 and M10-24-100).

American Chemical Science Journal, 2(4): 136-160, 2012
146
Fig. 3. I.R, yields and C.R of the activated carbon of maize cobsYield is obtained from the values of Table 1 by using equation yield (%) =mass of obtained activatedcarbon/initial mass of maize cobs×100; IR is obtained from the values of Table 1 by using the equationIR=mass of ZnCl2/initial mass of maize cobs; CR is obtained from the data of Table using the formulaCR= (mass of carbon before washing-mass of carbon after washing)/mass of impregnated ZnCl2
3.2 pH of the Activated Carbon of Maize Cobs
The pHs of all the studied activated carbons are found on Fig. 4. This Fig. also representsthe values of pH of the various prepared activated carbon samples according to theimpregnation ratio I.R. It is observed that the impregnation ratio influences these pH values.All the pH values were found to lie between 2 and 12.5 thus the activated carbon of maizecobs cannot be considered priority as hazardous wastes matters and are not corrosive(University of Monreal-Quebec, 2008). It is noted that for all materials, the pH’s are not veryacid as they are higher than 5, except for the MAPZC5 sample which has a pH lower than 5.This could be explained once again by the part of the cob used for the preparation of thissample. As explained previously, the woody part (hard part of the cob) was used,exclusively, for the preparation of this material. This part of the maize cob is predominantlymade up of lignin (Igwe and Abia, 2003; Suresh and Jackson, 1971; Tuah and Orskov,2010) and the carbonization of lignin produces very small quantity of ash (Ibañez, 2002;Nono, 1989; Suresh and Jackson, 1971). This weak ash content explains the high yield ofthis sample (Fig. 3) and for this reason the pH of this material is more acid than that of theothers. Indeed, the activated carbon resulting from the precursors having low ash contentshave weak pH (Montanher et al., 2005; Suziki et al., 2007). In addition, the four sampleswhose precursors and particles thickness are identical (M 10-60-100, M10-24-100,MAPZC3, MAPZC4), it’s observed on Fig. 4 that the higher the pH, the more the I.R is large,thus the quantity of ZnCl2 used for the activation of the cobs influences slightly the pH of theactivated carbon. Commercial sample OA00 has a basic pH of 9.34 contrary to the pH of theactivated carbon of maize cobs (Fig. 4). This value of pH is due to the rather high ashcontent of this sample. This ash content is explained by the presence of minerals in materialOA00 (see XRD spectrum result), particularly silica (Zawadzki, 1989).
MAPZC3
I.R 0.1yield 0.30126C.R 0.595251
American Chemical Science Journal, 2(4): 136-160, 2012
146
Fig. 3. I.R, yields and C.R of the activated carbon of maize cobsYield is obtained from the values of Table 1 by using equation yield (%) =mass of obtained activatedcarbon/initial mass of maize cobs×100; IR is obtained from the values of Table 1 by using the equationIR=mass of ZnCl2/initial mass of maize cobs; CR is obtained from the data of Table using the formulaCR= (mass of carbon before washing-mass of carbon after washing)/mass of impregnated ZnCl2
3.2 pH of the Activated Carbon of Maize Cobs
The pHs of all the studied activated carbons are found on Fig. 4. This Fig. also representsthe values of pH of the various prepared activated carbon samples according to theimpregnation ratio I.R. It is observed that the impregnation ratio influences these pH values.All the pH values were found to lie between 2 and 12.5 thus the activated carbon of maizecobs cannot be considered priority as hazardous wastes matters and are not corrosive(University of Monreal-Quebec, 2008). It is noted that for all materials, the pH’s are not veryacid as they are higher than 5, except for the MAPZC5 sample which has a pH lower than 5.This could be explained once again by the part of the cob used for the preparation of thissample. As explained previously, the woody part (hard part of the cob) was used,exclusively, for the preparation of this material. This part of the maize cob is predominantlymade up of lignin (Igwe and Abia, 2003; Suresh and Jackson, 1971; Tuah and Orskov,2010) and the carbonization of lignin produces very small quantity of ash (Ibañez, 2002;Nono, 1989; Suresh and Jackson, 1971). This weak ash content explains the high yield ofthis sample (Fig. 3) and for this reason the pH of this material is more acid than that of theothers. Indeed, the activated carbon resulting from the precursors having low ash contentshave weak pH (Montanher et al., 2005; Suziki et al., 2007). In addition, the four sampleswhose precursors and particles thickness are identical (M 10-60-100, M10-24-100,MAPZC3, MAPZC4), it’s observed on Fig. 4 that the higher the pH, the more the I.R is large,thus the quantity of ZnCl2 used for the activation of the cobs influences slightly the pH of theactivated carbon. Commercial sample OA00 has a basic pH of 9.34 contrary to the pH of theactivated carbon of maize cobs (Fig. 4). This value of pH is due to the rather high ashcontent of this sample. This ash content is explained by the presence of minerals in materialOA00 (see XRD spectrum result), particularly silica (Zawadzki, 1989).
MAPZC3 MAPZC4 MAOZC5 M10-60-100
M10-24-100
0.15 0.05 0.01 0.0050.30126 0.42915 0.35635 0.2642 0.2430650.595251 0.517801 0.4811 0.14 1.226
American Chemical Science Journal, 2(4): 136-160, 2012
146
Fig. 3. I.R, yields and C.R of the activated carbon of maize cobsYield is obtained from the values of Table 1 by using equation yield (%) =mass of obtained activatedcarbon/initial mass of maize cobs×100; IR is obtained from the values of Table 1 by using the equationIR=mass of ZnCl2/initial mass of maize cobs; CR is obtained from the data of Table using the formulaCR= (mass of carbon before washing-mass of carbon after washing)/mass of impregnated ZnCl2
3.2 pH of the Activated Carbon of Maize Cobs
The pHs of all the studied activated carbons are found on Fig. 4. This Fig. also representsthe values of pH of the various prepared activated carbon samples according to theimpregnation ratio I.R. It is observed that the impregnation ratio influences these pH values.All the pH values were found to lie between 2 and 12.5 thus the activated carbon of maizecobs cannot be considered priority as hazardous wastes matters and are not corrosive(University of Monreal-Quebec, 2008). It is noted that for all materials, the pH’s are not veryacid as they are higher than 5, except for the MAPZC5 sample which has a pH lower than 5.This could be explained once again by the part of the cob used for the preparation of thissample. As explained previously, the woody part (hard part of the cob) was used,exclusively, for the preparation of this material. This part of the maize cob is predominantlymade up of lignin (Igwe and Abia, 2003; Suresh and Jackson, 1971; Tuah and Orskov,2010) and the carbonization of lignin produces very small quantity of ash (Ibañez, 2002;Nono, 1989; Suresh and Jackson, 1971). This weak ash content explains the high yield ofthis sample (Fig. 3) and for this reason the pH of this material is more acid than that of theothers. Indeed, the activated carbon resulting from the precursors having low ash contentshave weak pH (Montanher et al., 2005; Suziki et al., 2007). In addition, the four sampleswhose precursors and particles thickness are identical (M 10-60-100, M10-24-100,MAPZC3, MAPZC4), it’s observed on Fig. 4 that the higher the pH, the more the I.R is large,thus the quantity of ZnCl2 used for the activation of the cobs influences slightly the pH of theactivated carbon. Commercial sample OA00 has a basic pH of 9.34 contrary to the pH of theactivated carbon of maize cobs (Fig. 4). This value of pH is due to the rather high ashcontent of this sample. This ash content is explained by the presence of minerals in materialOA00 (see XRD spectrum result), particularly silica (Zawadzki, 1989).

American Chemical Science Journal, 2(4): 136-160, 2012
147
Fig. 4. I.R and pH of the activated carbon of maize cobspH of solution containing each maize cobs activated carbon; IR is obtained from the values of Table 1
by using the equation IR=mass of ZnCl2/initial mass of maize cobs
Several authors in the past limited their characterization of activated carbon to traditionaltechniques such as determination of iodine numbers (Aygün et al., 1989), X-ray fluorescence(Bhagavathy et al., 1991), the determination of specific surface area by B.E.T only (Khalili etal., 2000). This work has the advantage of employing a diverse number of state of the arttechniques of characterization which provide results with much greater precision.
The methods of characterization particularly simultaneous SEM-EDX analysis are a majorinnovation. In fact in the literature (Malarvizhi and Sulochana, 2008; Prahas et al., 2008),these analyses are usually made separately and EDX analysis in this work which givesqualitative and quantitative chemical composition takes into account the heterogeneity of thesurfaces what is not taken into account by EDX analysis traditional met in the literatureinsofar as in the majority of work it is the x-ray fluorescence which was generally used(Abiko, 2011). Thus in this work, these analyses are much more precise. In addition thestudy of porosity is also an innovation because in the majority of work (Prahas et al., 2008)this analysis gives only quantities adsorbed according to the partial pressures and specificsurfaces and the other parameters of porosities such as porous volumes, the size of theparticles are given in an indirect way. In this work, all the results (specific surfaces (B.E.T,B.J.H, and single point), porous volume, and sizes of the particles) are directly given.
3.3 SEM-EDX Analysis-Samples' Surface and Chemical Compositions
SEM micrographs of surfaces of the studied activated carbon represented by Fig. 5 showsthat the activated carbon of maize cobs presents all of the cavities to the level of theirsurfaces. Samples M10-60-100, M10-24-100, MAPZC3 and MAPZC4 show surfaceheterogeneity and have very varied structures.
MAPZC3
pH 5.96I.R 0.1
American Chemical Science Journal, 2(4): 136-160, 2012
147
Fig. 4. I.R and pH of the activated carbon of maize cobspH of solution containing each maize cobs activated carbon; IR is obtained from the values of Table 1
by using the equation IR=mass of ZnCl2/initial mass of maize cobs
Several authors in the past limited their characterization of activated carbon to traditionaltechniques such as determination of iodine numbers (Aygün et al., 1989), X-ray fluorescence(Bhagavathy et al., 1991), the determination of specific surface area by B.E.T only (Khalili etal., 2000). This work has the advantage of employing a diverse number of state of the arttechniques of characterization which provide results with much greater precision.
The methods of characterization particularly simultaneous SEM-EDX analysis are a majorinnovation. In fact in the literature (Malarvizhi and Sulochana, 2008; Prahas et al., 2008),these analyses are usually made separately and EDX analysis in this work which givesqualitative and quantitative chemical composition takes into account the heterogeneity of thesurfaces what is not taken into account by EDX analysis traditional met in the literatureinsofar as in the majority of work it is the x-ray fluorescence which was generally used(Abiko, 2011). Thus in this work, these analyses are much more precise. In addition thestudy of porosity is also an innovation because in the majority of work (Prahas et al., 2008)this analysis gives only quantities adsorbed according to the partial pressures and specificsurfaces and the other parameters of porosities such as porous volumes, the size of theparticles are given in an indirect way. In this work, all the results (specific surfaces (B.E.T,B.J.H, and single point), porous volume, and sizes of the particles) are directly given.
3.3 SEM-EDX Analysis-Samples' Surface and Chemical Compositions
SEM micrographs of surfaces of the studied activated carbon represented by Fig. 5 showsthat the activated carbon of maize cobs presents all of the cavities to the level of theirsurfaces. Samples M10-60-100, M10-24-100, MAPZC3 and MAPZC4 show surfaceheterogeneity and have very varied structures.
MAPZC3 MAPZC4 MAPZC5 M10-60-100
M10-24-100
5.96 4.4 5.6 5.50.15 0.05 0.01 0.005
American Chemical Science Journal, 2(4): 136-160, 2012
147
Fig. 4. I.R and pH of the activated carbon of maize cobspH of solution containing each maize cobs activated carbon; IR is obtained from the values of Table 1
by using the equation IR=mass of ZnCl2/initial mass of maize cobs
Several authors in the past limited their characterization of activated carbon to traditionaltechniques such as determination of iodine numbers (Aygün et al., 1989), X-ray fluorescence(Bhagavathy et al., 1991), the determination of specific surface area by B.E.T only (Khalili etal., 2000). This work has the advantage of employing a diverse number of state of the arttechniques of characterization which provide results with much greater precision.
The methods of characterization particularly simultaneous SEM-EDX analysis are a majorinnovation. In fact in the literature (Malarvizhi and Sulochana, 2008; Prahas et al., 2008),these analyses are usually made separately and EDX analysis in this work which givesqualitative and quantitative chemical composition takes into account the heterogeneity of thesurfaces what is not taken into account by EDX analysis traditional met in the literatureinsofar as in the majority of work it is the x-ray fluorescence which was generally used(Abiko, 2011). Thus in this work, these analyses are much more precise. In addition thestudy of porosity is also an innovation because in the majority of work (Prahas et al., 2008)this analysis gives only quantities adsorbed according to the partial pressures and specificsurfaces and the other parameters of porosities such as porous volumes, the size of theparticles are given in an indirect way. In this work, all the results (specific surfaces (B.E.T,B.J.H, and single point), porous volume, and sizes of the particles) are directly given.
3.3 SEM-EDX Analysis-Samples' Surface and Chemical Compositions
SEM micrographs of surfaces of the studied activated carbon represented by Fig. 5 showsthat the activated carbon of maize cobs presents all of the cavities to the level of theirsurfaces. Samples M10-60-100, M10-24-100, MAPZC3 and MAPZC4 show surfaceheterogeneity and have very varied structures.

American Chemical Science Journal, 2(4): 136-160, 2012
148
(a) (b)
(c) (d)
(e) (f)Fig. 5. Images of the activated carbons by SEM
(a) carbon M10-60-100 (Magnitude: 3051x ; HD: 20.0kV; W.D: 9.8mm; Size: 20.0µm); (b) carbon M10-24-100 (Magnitude: 2986x ; HD: 20.0kV; W.D: 9.6mm; Size: 20.0µm); (c) carbon MAPZC3 (Magnitude:2999x ; HD: 20.0kV; W.D:9.6mm; Size: 20.0µm); (d) carbon MAPZC4 (Magnitude: 2999x ; HD: 20.0kV;W.D: 9.8mm; Size: 20.0µm); (e) carbon MAPZC5 (Magnitude: 3067x ; HD: 20.0kV; W.D: 9.3mm; Size:
20.0µm); (f) carbon OA00 (Magnitude: 18085x ; HD: 15.0kV; W.D: 9.7mm; Size: 2.0µm)
All these material are porous in appearance. Sample MAPZC4 presents pores which are,apparently, more open (broad) compared to MAPZC3 material, which is explained bydifference in mass of the activating agent used in these materials (3g for MAPZC4 and 2g forMAPZC3) (Table 1). Indeed, the zinc chloride ZnCl2 permits the development of the porosity

American Chemical Science Journal, 2(4): 136-160, 2012
149
of materials, so the more there is in the precursor, the more the pores of the activatedcarbon are opened (Ahmadpour and Do, 1997). The activated carbon MAPZC5 has acompact structure and its surface is different from the first samples although the precursor isthe same for all these chars. However, it is the hard part of the cob which was used for thelatter sample which is what certainly explains this difference in surface structure. In addition,MAPZC5 has a homogeneous structure with a more developed porosity when compared tothe other similar samples because in this material some micropores are observed. Thecommercial sample of animal origin labelled OA00 is similar to the MAPZC5 sample with acompact and homogeneous surface on which a few micropores are observed.
For the activated carbon having heterogeneous surfaces, analysis EDX was carried out onseveral zones of material. The results of analysis EDX of studied coals (Table 2) show thatthese materials primarily consist of carbon and oxygen to very varied proportions. It’simportant to note the presence of the rather high Zn contents in materials MAPZC4,MAPZC3, M10-60-100 and M10-24-100 coming from the activating agent ZnCl2. TheMAPZC4 sample, particularly, shows zinc contents going up to 57% per region on its surfacewhat could considerably reduce the adsorbent properties of this material. This excess zinccould, for example, block certain active sites and prevent the adsorption of some compoundsand metals. EDX analysis of the sample MAPZC5 practically does not show the presence ofZinc; neither does it show chlorine which could explain the rather good adsorbent propertiesobserved particularly for this activated carbon (Dina et al., 2012).
Table 2. Qualitative and quantitative analysis (into % massic) of the activated carbonby EDX
Sample C O Sifmax gmin hmea max min mea max min mea
M10-60-100 90 60 80 18 3 7 14 0 2M10-24-100 90 70 80 16 2 9 3 0 1MAPZC3 90 80 80 21 4 10 1 0 0MAPZC4 80 40 60 10 2 6 1 1 1MAPZC5 90 70 80 27 6 16 4 0 1OA00 30 10 10 57 31 40 - - -Sample Ca Zn P
Max min mea max min mea max min meaM10-60-100 2 0 0 17 0 2 - - -M10-24-100 - - - 13 1 3 - - -MAPZC3 - - - 10 0 2 1 0 0MAPZC4 - - - 57 4 25 - - -MAPZC5 - - - - - - - - -OA00 70 19 29 - - - 30 10 15
fmax=maximum; gmin=minimum; hmea=mean
3.4 X-rays Studies
For each activated carbon sample, XRD analysis was carried out several times. XRDpatterns of the activated carbon of maize cobs are represented on Figs. 6a-6b). Thesereveal that all these coals are amorphous. The amorphism observed is explained by therupture of multiple bonds C-C (mainly those of the aromatic rings) and the formations of thegroups and functions on the surface (see result FTIR on Fig. 7) during the preparation. Inaddition, the observation of these spectra makes it possible to explain the characteristic ofthe material MAPZC5. Just like samples M10-60-100, M10-24-100, MAPZC3 and MAPZC4,

American Chemical Science Journal, 2(4): 136-160, 2012
150
the MAPZC5 material is amorphous but has other humps on the base line than the previousfour (Fig. 6b). This characteristic could be explained not only by the precursor beingpredominantly made up of the woody belt, as explained previously, but also by theelementary chemical composition of this sample (EDX results, Table 2). Indeed, theproportions of cellulose, hemicellulose and lignin are different in the two parts of the maizecob. Taking into account the phenomena observed during the preparation of this activatedcarbon (gases and liquid released), it appears that the soft part of the cob contains mainlycellulose and hemicellulose, both having linear polymeric structures of residues of glucose(Igwe and Abia, 2003; Nangole et al., 1983). The hard part also contains lignin with rigidcovalent bonds between various phenolic groups; that’s why the elementary chemicalcomposition of the sample MAPZC5 (EDX result on Table 2) is different from that of theother maize cobs activated carbon with a diversity of elements compared to the othersamples. This characteristic could also produce particular properties (specific surface area,porous volume, surface function, and textural structure and EDX results) of this samplecompared to the others.
(a)

American Chemical Science Journal, 2(4): 136-160, 2012
151
(b)
(c)
Fig. 6. XRD patterns of the studied activated carbon(a) Samples M10-60-100, M10-24-100, MAPZC3, MAPZC4 obtained from the light part of the
cobs (b) Sample MAPZC5 obtained from the hard part (c) commercial activated carbon sampleOA00

American Chemical Science Journal, 2(4): 136-160, 2012
152
Tangjuank et al. (2009) obtained practically identical XRD spectra with activated carbonobtained from cashew nuts shells by physico-chemical activation (KOH/CO2). These resultsconfirm the fact that the activated carbon obtained from agricultural wastes are for themajority of times amorphous because of the existence of probable surface functions fromwhich the crystallization is difficult.
X-ray pattern of the commercial sample, OA00, (Fig. 6c) unlike the activated carbon of maizecobs, represent a material which crystallizes. The examination of this spectrum highlights thepresence of minerals such as hydroxyapatite, quartz, feldspar traces (microcline and whitefeldspar). The presence of these minerals could explain the adsorbent properties of thismaterial particularly hydroxyapatite (Amer et al., 2010; Liao et al., 2010; Mobasherpour etal., 2011).
3.5 FTIR Analysis-Functional Groups Study
The surface of the activated carbon generally consists of functional groups which areoxygenated sites and possibly of the amino sites (Ibañez, 2002; Shen, 2008). The IRabsorption spectra in solid phase recorded of the activated carbon of maize cobs and ofcommercial sample OA00 are presented in Fig. 7.
At low temperature range of carbonization of the activated carbon, some functional groupsare observed on the surface of these coals. For all the maize cobs activated carbons, FTIRspectra (Figs. 7a-7b) showed that there are two bands characteristic of aliphatic groups -CH3 and - CH2- around 2846 cm-1 and 2950 cm-1 (Tang and Bacon, 1964; Vinke el al.,1994). Around 3200-3500 cm-1 vibration of OH appears in all the samples, suggesting thepresence of the hydroxyls groups and chemically absorbed water on the surface. Thepresence of the peaks around 1600 and 1620 cm-1 suggests the presence of carbonyls C=Ogroups coming from the stretching of the C=C bond (Akhter et al., 1985; Tuah and Orskov,2010). Indeed under the effect of heat, there is rupture of C=C bonds and the presence ofOH bonds leads to the formation of C=C groups. Most researchers like Ibañez (2002)(prepared the activated carbon by chemical activation with sulphuric acid H2SO4 on the olivecores and apple pulps) and Bikales and Segal (1971) (studied the carbonization of celluloseand cellulose derivatives) have estimated that one of the intermediate products leading tothe passage of the C=C bond to C=O is levoglucosan whose formation takes place between200 and 400ºC (Vinke et al., 1994). The association of OH bonds and C=O predicts theexistence of carboxylic acid groups–COOH which further explains the acidity of the activatedcarbon of maize cobs. The peaks observed around 1290 cm-1 are characteristic of ν (CO)vibrations coming from the ether or aliphatic groups (Ibañez, 2002; Serrano et al., 1999).The vibration of deformation ν (CH2) is observed around 1420 cm-1 (Ibañez, 2002; Zawadzki,1989). The lines observed around 1450-1500 cm-1 could correspond to the vibrations in theplan of the aromatic rings (Khalil, 1999). The samples M10-60-100, M10-24-100, MAPZC3and MAPZC4 present all of the lines around 1050 cm-1 and 1100 cm-1 characteristicrespectively of primary and secondary alcohols (Fig. 7a). The series of lines between 700and 800 cm-1 is characteristic of the vibration ν (CH) correspondent with systems with 1,2,3,4or 5 adjacent hydrogen atoms (Brand and Eglinton, 1945) (Figs. 7a and 7b). Tangjuank etal. (2009) in the same work mentioned above obtained similar IR spectra and obtained thesame functional groups.
The spectra of the samples M10-60-100 and M10-24-100 are practically identical and thuspresent the same groups on the surface, as deduced from the similar method of preparationand the precursor. However, the overlapping of lines observed between 1809 and 1034 cm-1

American Chemical Science Journal, 2(4): 136-160, 2012
153
in the spectrum of the M10-60-100 material is less marked in the M10-24-100 sample; anobservation which leads us to predict a reduced number of functional groups in this sample.The relatively long residence time (24 hours at 500ºC) of the M10-24-100 samplecharacterized by the reduction of surface functions, could explain this difference (Darnell etal., 1990).
Samples MAPZC3 and MAPZC4 have similar spectra for the same reasons as previouslyexplained but in this case MAPZC3 seems to have a greater number of groups. This couldbe explained by its impregnation ratio (I.R) which is lower than that of MAPZC4 (Fig. 3).Indeed, the zinc excess observed by EDX in char MAPZC4 would certainly have preventedthe formation of certain groups (oxides for example) in great number. In addition the bandaround 3500 cm-1 of sample MAPZC3 is lower than that of MAPZC4 what marks thepresence of the relatively strong hydrogen bridges in MAPZC3 (Biniak et al., 1997).
Fig. 7b show peaks characteristic of aliphatic esters, of the groups C=O and C-O which areaccentuated and more visible in this sample (MAPZC5) obtained from the woody belt (hardpart of the cob). This may further explain why the pH of this material is most acid (pH=4.4).
FTIR spectrum of the commercial sample OA00 is completely different from that of theactivated carbon of maize cobs (Fig. 7c). This spectrum presents nevertheless, certaingroups present in the maize cobs activated carbons such as OH characterized by the bandof vibration at 3446 cm-1, aliphatic groups - CH3 and - CH2- around 2880 and 2950 cm-1, andthe vibrations ν (CH) between 700-800 cm-1. The presence of a very significant number ofgroups CO (very intense peak at 1034 cm-1) is observed. At 1664 cm-1 a bendingcharacteristic of the NH is observed which explains the basicity of this material. Three bandscharacteristic of groups C=C (1498, 1457 and 1416 cm-1) being certainly in aromatic ringsare also observed.
There exists coherence between the values of pH of various materials (Fig. 3) and theidentified functional groups. The acid groups found on the activated carbon of maize cobsexplain explicitly, why the pH’s of these chars are all acid.
3.6 Brunauer-Emmett-Teller (BET) Surface Area and Porosity Studies
The specific surfaces area determined by BET, the total pore volume obtained by adsorptionat a given point (definite relative pressure) and for a given pore size are summarized inTable 3. The pore size obtained by BET using the relation 4V/A of activated carbon of maizecobs and commercial sample OA00 are also shown in Table 3.
Specific surfaces area of the chars obtained from the soft part of the cobs (periphery andmarrow) associated with negligible particles of woody belt are very weak and especially verydifficult to determine because of the volatility of these materials. These values vary between0.43 m2/g for the M10-60-100 sample and 11.62 m2/g for the sample MAPZC4 (Table 3).These low values of specific surfaces show that the entry of the gas molecules N2 in theexisting pores is very restricted and even impossible for these samples such as M10-60-100.In addition, the comparison of specific surface area of the samples M10-60-100 (0.43 m2/g)and of the sample M10-24-100 (5.26 m2/g) makes it possible to explain the influence of thetime of residence on the preparation of the activated carbon of maize cobs. Indeed, thelonger the residence time, the higher the specific surface area and the more the pores areopened (0.000279 cm3/g for M10-60-100 with residence time of 1 hour and 0.002713 cm3/gfor M10-24-100 with a residence time of 24 hours).

American Chemical Science Journal, 2(4): 136-160, 2012
154
(a)
(b)
010002000300040005000Wavenumbers cm-1
MAPZC4 M10-24-100 MAPZC3 M10-60-100
3415 292528272390
159114291243
882733
010002000300040005000
Tran
smitt
ance
%
Wavenumbers cm-1
34222915 2403 1772
16001396
1157
723

American Chemical Science Journal, 2(4): 136-160, 2012
155
(c)
Fig. 7. FTIR spectra of the activated carbon of the maize cobs(a) M10-60-100, M10-24-100, MAPZC3, MAPZC4, (b) MAPZC5 and (c) sample OA00
The impregnation ratio (IR) also affects the specific surface area and porosity. The higherthe IR, the higher the specific surface area and porous volume for materials produced fromthe same precursor. Thus, samples MAPZC3 with impregnation ratios of 0.1 has a specificsurface area of 7.13 m2/g and pore volume of 0.0022 cm3/g while MAPZC4 with animpregnation ratio of 0.15 has a specific surface area of 11.62 m2/g and a porous volume of0.11 cm3/g. Consistent with the described trend, the specific surfaces area of MAPZC3 andMAPZC4 are by far higher than those of the M10-60-100 and M10-24-100 with 0.005 asimpregnation ratio (IR).
It is interesting to note that the MAPZC5 sample obtained from the woody belt has a higherspecific surface of about 701.68 m2/g and a porous volume of 0.39 cm3/g; values by farhigher than those given with the chars obtained with the light part of the cob. Tangjuank etal. (2009) quoted above obtained similar results with agricultural wastes (cashew nut shells)activated carbon with a maximum specific surface area by B.E.T of about 627 m2/g whileQiang et al. (2007), with the same activating agent as in this work, obtained a high value ofspecific surface area of about 2170 m2/g and porous volume of about 1.70 cm3/g. Thesehigh values could be explained may be by the raw materials used by Qiang et al. (2007)(cattle-manure compost) or by the temperatures used which attained 900ºC. Somedifferences in preparation techniques like the treatment of the raw material and theimpregnation ratio (I.R) could also explained these high values.
The BET specific surface area and porous volume values of sample MAPZC5 are significantthan those of the commercial sample OA00 (81.09 m2/g and 0.18 cm3/g for specific surfaceand porous volume, respectively).
010002000300040005000
Tran
smitt
ance
%
Wavenumbers cm-1
34462938 2397 2019
166414571416
1048
871749
1498

American Chemical Science Journal, 2(4): 136-160, 2012
156
Table 3. Specific surfaces area and porosities of the activated carbon of maize cobsand of commercial sample OA00
Adsorbent iB.E.T specificsurface area (m2/g)
jPores volumes(cm3/g)
Pores sizes (Å)
M10-60-100 0.4312 0.00028 25.8580M10-24-100 5.2605 0.00271 20.6325MAPZC3 7.1314 0.00220 12.3190MAPZC4 11.6202 0.10817 72.3636MAPZC5 701.6853 0.3938 22.4505OA00 81.8638 0.1766 85.2648
iBET specific surface area: Brunau-Emmett-Teller specific surface area obtained using BET lineartransformer equation from the data of Fig. 7; jporous volume obtained using BET equation
4. CONCLUSION
The activated carbons from agricultural wastes, maize cobs, were obtained under differentoperating conditions and characterized. The structural properties of samples obtained fromthe soft part and some particles of woody belt are not significant (very weak specific surfacesvarying in the interval 0.43 m2/g-11.62 m2/g and porous volumes between 0.0002 cm3/g and0.11 cm3/g and absence of microporosity). But some acidic functional groups are observedat the surface of these materials. On the other hand, MAPZC5 obtained from the woody beltshowed higher values of physico-chemical properties; a specific surface area of about701.68 m2/g and a porous volume of approximatively 0.39 cm3/g. These values are higherthan those of the commercial sample of which the specific surface area and the porousvolume are respectively equal to 81.09 m2/g and 0.18 cm3/g). SEM micrograph of theMAPZC5 material reveals a structure completely different from the four other samplesresulting from the same precursor with appearance of some micropores what explains thegreat difference at the level of the values in specific surface area and volume porous.
On the surface of all the activated carbons produced from maize cobs, some acidicfunctional groups are observed. It is shown that the long residence time considerablydecreased the number of functional groups on the surface of these chars as well as theZnCl2 content in the precursor. Some micropores and basic functional groups are observedon the surface of the commercial activated carbon OA00. This material is the only one whichcrystallized and some minerals such as quartz and hydroxyapatite mainly responsible for thestrong adsorption capacity are observed. In addition, the values of pH showed that theseactivated carbons are neither dangerous nor corrosive; that is why they can be used in thepurification of water, waste water and in agribusiness industries. The experimental resultsindicated that this method of preparation of chars is easy, economic and activated carbonobtained particularly from the hard part of the cob has very significant physico-chemical andstructural properties. Agricultural wastes, particularly maize cobs can be an alternative.These activated carbons can mainly be used in the purification of the consumption of waterin Cameroon where water sources are abundant but requires treatment.
ACKNOWLEDGEMENTS
The authors thank Professor Christian Ekberg of the Nuclear Chemistry laboratory of theTechnological University of Chalmers which placed at their disposal all equipment necessaryfor the realization of this work. They also thank Professors Britt-Marie Steari and MarkForeman for their availability.

American Chemical Science Journal, 2(4): 136-160, 2012
157
COMPETING INTERESTS
Authors have declared that no competing interests exist.
REFERENCES
Aber, S., Khataee, A., Sheydaie, M. (2009). Optimization of activated carbon fiberpreparation from Kenaf using K2HPO4 as chemical activator for adsorption of phenoliccompounds. Bioresource Tech, 100, 6528-6291.
Abiko, H. (2011). Water vapor adsorption and desorption isotherms of activated carbonproducts used in Japanese gas respirators. Tanso, 248, 127-132.
Acharya, M., Strano, M.S., Matthews, J.P., Billinge, S.J.L., Petkov, V., Subramoney, S.,Foley, H.C. (1999). Simulation of nanoporous carbons: a chemically constrainedstructure. Phil Mag B, 79, 1499.
Adinata, D., Mohd, W., Wan Daud, A., Arouna, M.K. (2007). Preparation andcharacterization of activated carbon from palm shell by chemical activation K2CO3.Bioresource Tec, 98, 145-149.
Ahmadpour, A., Do, D.D. (1997). The preparation of activated carbon from Macademianutshells by chemical activation. Carbon, 35, 1723-1732.
Akhter, M.S., Chughtai, J., Smith, D.M. (1985). The structure of hexane soot I: Spectroscopicstudies. Appl Spectro. Carbon, 39, 143-153.
Avom, J. (1982). Preparation and physicochemical study of activated carbon of palms cobs.Doctorat thesis. University of Yaoundé.
Avom, J., Ketcha, M.J., Matip, M.L.R, Germain, P. (2001). Isotherm adsorption of the aceticacid by the activated carbon of vegetal origin. African J Sci Tec., 2, 1.
Aygün, A., Yenisoy-Karakas, S., Duman, I. (2003). Production of granular activated carbonfrom fruit stones and nutshells and evaluation of their physical, chemical andadsorption properties. Micro Meso Mat, 66, 1989-195.
Bhagavathy,V., Reddy, L.L.P., Sai, P.S.T., Prasada Rao, T., Damodaran, A.D. (1991).Preconcentration of rare earth quinolin-8-ol complexes onto activated carbon anddetermination by first-order derivative x-ray fluorescence spectrometry. AnalyticaChemica Acta, 242, 215-220.
Bikales, N.H., Segal, L. (1971). Cellulose and Cellulose Derivatives, Wiley- Interscience,New York.
Biniak, S., Szymaúski, G., Siedlewski, J., Swiatkowski, A. (1997). The characterization ofactivated carbons with oxygen and nitrogen surface groups. Carbon, 12, 1799-1810.
Boudrahem, F., Aissani-Benissad, F., Ait-Amar, H. (2009). Batch sorption dynamics andequilibrium for the removal of lead ions from aqueous phase using activated carbondeveloped from coffee residue activated with zinc chloride. J Environ Manag, 90,3031-3039.
Brand, J.C.D, Eglinton, G. (1945). Application of spectroscopy to organic chemistry. OldBourne Press, London.
Cagnon, B., Py, X., Guillot, A., Stoeckli, F., Chambat, G. (2009). Contributions ofhemicellulose, cellulose and lignin to the mass and the porous properties of chars andsteam activated carbons from various lignocellulosic precursors. Biores Technol, 100,292-298.
Chang, C.F., Chang, C.Y., Tsai, W.T. (2000). Effects of burn-off and activation temperatureon preparation of activated carbon from corn cob agrowaste by CO2 and steam. J ofColloid and Interface Sci., 232, 45-49.

American Chemical Science Journal, 2(4): 136-160, 2012
158
Chilton, Ng, Wayne, E.M., Rao, R.M., Ramsode, R.R., Losso, N. (2003). Activated carbonfrom pecan shell: process description and economic analysis. J Ind Crops Prod, 17,209-217.
Crini, G., Badot, P.P. (2007). Treatment and purification of polluted industrialwater:Membrane processes, bioadsorption and chemical oxidation, Presses Univ,Franche-Comté.
Cronje, G.L., Beeharry, A.O., Wentzel, M.C., Ekama, G.A. (2002). Active biomass inactivated sludge mixed liquor. Water Res, 36, 439-444.
Darnell, J., Lodish, H., Baltimore, D. (1990). Molecular Cell Biology, second Ed. ScientificAmerican Books, New York.
Dina, D.J.D., Ntieche, A.R., Ndi, J.N., Ketcha J.M. (2012). Adsorption of acetic acid ontoactivated carbons obtained from maize cobs by chemical activation with zinc chloride(ZnCl2). Res J Chem Sci, 2(9), 42-49.
Dresselhaus, M.S., Fung, A.W.P., Rao, A.M., DiVittorio, S.L., Kuriyama, K., Dressselhaus,G., Endo, M. (1992). New characterization techniques for activated carbon fibers.Carbon, 30, 1065-1073.
Ibañez, E.F. (2002). Study of the carbonization and the activation of hard and soft vegetableprecursors. Doctorat thesis. University of Neuchatel.
Igwe, J.C., Abia, A.A. (2003). Maize cob and husk as Adsorbents for removal of cadmiumlead and zinc ions from wastewater.The Phys Scientist, 2, 210-215.
IUPAC. (2010). The powder diffraction files and related products.Kadirvelu, K., Kavipriya, M., Karthika, C., Radhika, M., Vennilamani, N., Pattabhi, S. (2003).
Utilization of various agricultural wastes for activated carbon preparation andapplication for the removal of dyes and metal ions from aqueous solutions. Biores Tec,98, 32-129.
Khalil, B.L. (1999). Surface area and pore structure of hardened Portland cement/silica fumepastes. Adsorp Sci Tec, 9, 729-740.
Khalili, N.R., Campbell, M., Samdi, G., Golas, J. (2000). Production of micro- andmesoporous activated carbon from paper mill sludge - I. Effect of zinc chlorideactivation. Carbon, 38, 1905-1915.
Koutcheiko, S., Monreal, C.M., Kodama, H., Cracken, T.M., Kotlyar, L. (2007). Preparationand characterization of activated carbon derived from the thermo-chemical conversionof chicken manure. Bioresource Tec, 98, 2459-2464.
Kumar, S., Upadhyaya, J.S., Yuvraj, S.N. (2010). Preparation of nanoparticules from corncobs by chemical treatment methods. BioRes, 5, 1292-1300.
Lallemand-Barrès, A. (2000). Methods of depollution of subsoil waters, Brgm, Paris.Lozano-Castello, D., Lillo-Rodenas, M.A., Cazorla-Amoros, D., Linares-Solano, A. (2001).
Preparation of activated carbons from Spanish anthracite: I. Activation by KOH.Carbon, 39, 741-749.
Lynch, J. (2001). Analyse physico-chimique des catalyseurs industriels: Manuel pratique decharacterisation, Edition TECNIP, Paris.
Maha, M.I., Agblevor, F.A., El-Zawoswy. (2010). Isolation and characterization of celluloseand lignin from steam-exposed lignocellulosic biomass. Biores Technol, 5, 397-418.
Malarvizhi, M., Sulochana, N. (2008). Sorption isotherm and kinetic studies of methyleneblue Uptake onto activated carbon prepared from wood apple shell. J Environ Sci, 2,40-46.
Marsh, H., Rodriguez-Reinoso, F. (2006). Activated Carbon, Hardcover, Elsevier Scienceand Technology, London.
Masclet, P. (2005). Air pollution: causes, consequences, solutions, perspectives,Technosup, Paris.

American Chemical Science Journal, 2(4): 136-160, 2012
159
Meunier, F., Liang-Ming, S. (2003). Adsorption-Theoretical Aspects, Techniques del’Ingénieur, J2730.
Montanher, S.F., Oliveira, E.A., Rollemberg, M.C. (2005). Removal of lead (II) from metalions from aqueous solutions by sorption onto rice bran. J Haz Mater, 117, 207–211.
Nangole, F.N., Kayongo-Male, H., Said, A.N. (1983). Chemical composition, digestibility andfeeding value of maize cobs. Animal Feed Sci Tec, 9, 121-130.
Nono, M.M.C. (1989). Preparation and adsorbent properties of the activated carbon ofmanioc stems, Master thesis, University of Yaoundé.
Picqué, N., Guelachvili, G. (2007). The Spectroscopy by Fourier Transform. Comprendre,29, 5.
Prahas, D., Kartika, Y., Indraswati, N., Ismadji, S. (2008). The use of activated carbonprepared from jackfruit (Artocarpus heterophyllus) peel waste for methylene blueremoval. J Environ, 2, 1–10.
Qian, Q., Machida, M., Tatsumoto, H. (2007). Preparation of activated carbons from cattle-manure compost by zinc chloride activation. Bioresource Tec, 98, 353-360.
Rastogi, N.K., Raghavaroa, K.S.M.S., Balasubramaniam, V.M., Niranjan, K., Knorr, D.(2007). Opportunities and challenges in high pressure processing of food. CriticalReviews in food science and nutrition, 47, 69-112.
Sahu, A.K., Sridhar, P., Pitchumani, S. (2009). Mesoporous carbon polymer electrolyte fuelcell electrodes. J of the Indian Institute of Sci, 89, 437-445.
Serrano, G.V., Almeida, F.P., Duran-Valle, C.J., Pastor-Villegas, J. (1999). Formation ofoxygen structures by air activation. A study by FT-IR spectroscopy. Carbon, 37, 1517-1528.
Shen, W., Li, Z., Liu, Y. (2008). Surface chemical functional groups modification ofporous carbon. Recent Patents on Chem Eng, 1, 27-40.
Sircar, S., Golden, T.C., Rao, B. (1996). Activated carbon for gas separation and storage.Carbon, 34, 1-12.
Soltes, E., Elder, T. (1981). Pyrolysis in organic chemicals from biomass, CRC press, BocaRaton.
Suresh, C., Jackson, M.G. (1971). A study of various chemical treatments to remove ligninfrom coarse roughages and increase their digestibility. The J Agricul Sci, 77, 11-17.
Suzuki, R.M., Adrade, A.D., Sousa, J.C., Rollemberg, M.C. (2007). Preparation andcharacterization of activated carbon from rice bran. Bioresource Tec, 98, 1985-1991.
Tang, M.M., Bacon, R. (1964). Carbonization of cellulose fibers–I Low temperature pyrolysis.Carbon, 2, 11-20.
Tangjuank, S., Insuk, N., Udeye, V., Tontrakoon, J. (2009). Chromium (III) sorption fromaqueous solutions using activated carbon prepared from cashew nut shells. Int J PhysSci, 4, 412-417.
Thibault-Starzyk, F. (2004). Micro and mesoporous materials caractérisation, EDP Sciences,Paris.
Tsai, W.T., Chang, C.Y., Lee, S.L. (1998). A low cost adsorbent from agricultural waste corncob by zinc chloride activation. Biores Technol, 64, 211-217.
Tsai, W.T., Chang, C.Y., Chang, C.F., Chien, S.F., Sun, H.F. (2001). Cleaner production ofcarbon adsorbents by utilizing agricultural waste corn cob. Resources Conservationand Recycling, 32, 43-53.
Tuah, A.K., Orskov, E.R. (2010). The degradation of untreated and treated maize cobs andcocoa pod husks in the rumen, FAO Corporate Document Repository.

American Chemical Science Journal, 2(4): 136-160, 2012
160
UQAM (Montreal University (Quebec)). (2008). Characterization of two types of activatedcarbons BRITA and millipores. University of Montreal (Quebec) Department ofSciences of the Earth and the Atmosphere.Characterization of the Grounds andGeological Residues.
Van der Hoek, J.P., Hofman, J., Graveland, A. (1999). The use of biological activated carbonfiltration for the removal of natural organic matter and organic micropollutants fromwater. Water Sci Tec, 40, 257-264.
Vinke, P., Van der Eijk, M., Verbree, M., Voskamp, A.F., Bekkum, H. (1994). Modification ofthe surfaces of a gas-activated carbon and a chemically activated carbon with nitricacid, hypochlorite, and ammonia. Carbon, 32, 675-686.
Wrench, J. (2007). Origin. J. of the american Oil Chemists’Society, 8, 441-453.Zawadzki, J. (1989). Chemistry and physics of carbon, Ed. By P.A. Thrower, New York.Zych, D. (2008). The viability of corn cobs as a bioenergy feedstock, University of
Minnesota: Part of a summer internship on renewable energy at the West CenterResearch and Outreach Center.
________________________________________________________________________© 2012 Ketcha et al.; This is an Open Access article distributed under the terms of the Creative CommonsAttribution License (http://creativecommons.org/licenses/by/3.0), which permits unrestricted use, distribution, andreproduction in any medium, provided the original work is properly cited.
Peer-review history:The peer review history for this paper can be accessed here:
http://www.sciencedomain.org/review-history.php?iid=149&id=16&aid=689.