premise: ablation debris control with use of closed liquid
TRANSCRIPT

Ablation debris control by means of closed thick film filtered water immersion.
Colin Dowding *
Jonathan Lawrence *
Andrew Holmes †
* Wolfson School of Mechanical and Manufacturing Engineering, Loughborough
University, Loughborough, Leicestershire. LE11 3TU. United Kingdom.
† Department of Electrical and Electronic Engineering, Imperial College London, South
Kensington Campus, SW2 2AZ, United Kingdom.
Correspondence
Mr. Colin Dowding
Wolfson School of Mechanical and Manufacturing Engineering,
Loughborough University,
Leicestershire,
LE11 3TU,
Great Britain.
Tel : +44 (0)1509 227593
Fax : +44 (0)1509 227648
e-mail : [email protected]

Abstract:
The performance of laser ablation generated debris control by means of open immersion
techniques have been shown to be limited by flow surface ripple effects on the beam and the
action of ablation plume pressure loss by splashing of the immersion fluid. To eradicate these
issues a closed technique has been developed which ensured a controlled geometry for both
the optical interfaces of the flowing liquid film. This had the action of preventing splashing,
ensuring repeatable machining conditions and allowed for control of liquid flow velocity. To
investigate the performance benefits of this closed immersion technique bisphenol A
polycarbonate samples have been machined using filtered water at a number of flow
velocities. The results demonstrate the efficacy of the closed immersion technique: a 93%
decrease in debris is produced when machining under closed filtered water immersion; the
average debris particle size becomes larger, with an equal proportion of small and medium
sized debris being produced when laser machining under closed flowing filtered water
immersion; large debris is shown to be displaced further by a given flow velocity than
smaller debris, showing that the action of flow turbulence in the duct has more impact on
smaller debris. Low flow velocities were found to be less effective at controlling the
positional trend of deposition of laser ablation generated debris than high flow velocities; but,
use of excessive flow velocities resulted in turbulence motivated deposition. This work is of
interest to the laser micromachining community and may aide in the manufacture of 2.5D
laser etched patterns covering large area wafers and could be applied to a range of
wavelengths and laser types.

Introduction
Laser ablation has proven to be a revolution in the micro and nano manufacturing industries
[1-3]. Technology has been continuously refined and improved in terms of laser fluence,
optical resolution and production speed since the emergence of the technique in the late
1970‟s [3]. However, one area has continued to plague the laser ablation pattern machining
sector: laser ablation generated debris [4]. Debris provides a number of technical obstacles:
during machining [5]; after machining [6]; to the production tooling and facility [7] and
potentially to the health of the facility workers [8]. These above issues make an efficient and
general solution a desirable prospect.
Previously, the typical control solution for ablation generated debris is post process removal
by the employment of one of a number of cleaning techniques: ultrasonic bathing [9],
surfactant jetting [10], contact scrubbing [11], laser cleaning passes [12] and chemical
interactions [13]. They are all limited in two ways: possible damage of a wafer that has
already had significant manufacturing effort expended upon it [12] and post process cleaning
can only remove debris left behind after machining has finished - it cannot prevent the effects
of debris during machining. Because of this, an in-line technique is preferential. A number of
in-line techniques have been detailed in literature that cover two main groups: positive
pressure gas jetting (using a number of flow geometries, ranging from crossflow to vortex
[14, 15]) and vacuum gas removal [16].
All of these variations on two themes are limited by one factor: the low viscosity of the fluid
used as a debris control medium (typically air or N2 for shorter wavelength laser machining).
Low viscosity dictates a low drag force is imparted by the flowing fluid onto the debris
particles to be controlled; thus, it is perceived that the use of a fluid with greater viscosity will
perform more effectively [17].

Much work has been conducted to glean understanding of the mechanism of adhesion
between particles and surfaces. In a dry system, there are three primary adhesion forces: Van
der Waals [18, 19]; electrostatic (of which there are two forms – long range (image forces)
[20], and contact (double-layer) [21]); and capillary forces (where the surface tension of
liquid meniscus between particles holds a particle to the surface [22]). Van der Waals and
long range electrostatic interactions act to attract a floating particle to a larger surface. Once
lodged to the surface the action of Van der Waals, electrostatic double layer and capillary
forces combine to adhere the particle to the surface [12]. The action of capillary adhesion can
increase the adhesion force by a factor of 5-7 and even prolonged baking in an attempt to
evaporate the liquid forming the meniscus that binds a particle a surface only acts to increase
the adhesion force [23]. Immersion in water has been shown to reduce the Van der Waals
attraction by as much as 50% [21] and will massively reduce or negate the action of capillary
adhesion during immersion due to closer correlation of liquid viscosities between the
adhesion meniscus and the immersing fluid [12]. The use of a conducting fluid for
immersion negates or even reverses the action of electrostatic forces by action of the Yukawa
repulsion [24].
Further understanding can be gleaned by exploring the use of immersed ablation in other
applications. A technique for delivering long wavelength laser radiation by use of a fine jet of
water proves that use of such mediums does not pose unacceptable attenuation of the beam
[25]. Others [26] have used a novel technique known as laser induced backside wet etching
(LIBWE), to machine laser wavelength transparent materials by passing the beam through
and focussing it just beyond the far surface of the material that is immersed in a liquid
medium. The production of nano and micro particles has also caused immersion of the
sample during lasing to be experimented with, proving to entirely capture all ablation
generated debris [18, 19], so use of a liquid medium to control ablation generated debris
during machining appears achievable. Sattari et al. [27] used ablation of ceramics immersed
in 4 to 6 mm of distilled water running at a constant flow rate of 116 ml/min to produce a
controlled collection of nanoparticles at the surface of the immersing liquid, Dowding and
Lawrence [28] cite the action of surface tension at the perimeter of microbubbles formed by
ablation plume gas trapped in the immersing liquid as a cause for larger colloidal debris
products that are resultant of liquid immersed ablation [21, 29]. Particle productivity has been
shown to be proportional to liquid flow velocity [27]. The dependence of particle size is less
clear, Sattari et al. state that laser fluence was inversely proportional to the size of
nanoparticles produced (supporting the dominance of a photomechanical etching mechanism
of a confined ablation plume as described by Berthe et al [30]). Katto et al. [31] found that
particle size was governed by the wavelength of the laser (a result common with traditional
laser machining in gaseous mediums) and was proportional to the fluence of the beam.
Dowding and Lawrence [28] used open thin film immersion to successfully demonstrate
control of debris from the ablation spot, with 90% of debris found deposited downstream of
the ablation spot whilst using only a low flow velocity. The use of open immersion has
significant limitations: surface ripple, rolling turbulence and limited flow velocity. Zhu et al.
[32] have shown that the immersion depth has a critical influence on the interaction between
the laser beam and the material. This means that particles may be both generated and ejected
in different ways, dependent on the flow thickness at a specific point in the beam cross-
section.
Once generated, debris particles experience a drag force that is proportional to the viscosity
and velocity of the flow surrounding it [33]. The particles are ejected away from the substrate
surface at high velocity [34], and so considerable work must be imparted on the travelling
particle by the surrounding liquid to transform the particles original vector to that of the fluid
flow. If the flow is rippled, some debris will have less working distance available for the

liquid to impart work on the particles original vector than can be offered to other particles
produced at other locations in the cross section of the beam.
Inertial, capillary and viscous effects along with the proportionally large contribution of
surface tension (due to the small thickness of the film) combine within the flow at a
molecular scale to generate significant flow ripple. Also, the large gradient of drag between
the material-flow interface and the flow meniscus – ambient air interface causes a tendency
for eddies to develop within the flow that roll into the material surface. In an open flow,
turbulence commences following a characteristic distance measured between the contact
point of a fluid on a flat plate and the point at which the flow becomes turbulent [33];
however, this case requires all dimensions of the flow, including film depth, to be large
compared to the characteristic distance. In the case of this flow, the meniscus defines the flow
geometry; thus, the effect of rolling eddies alone are not responsible for the deposition
patterns evidenced by Dowding and Lawrence [28], where debris distribution appeared to lie
in ripple patterns downstream of the feature machined. Instead, large inertial, capillary and
viscous contributions complicated the flow path.
A closed immersion technique dictates that the flow is confined within a duct; and so, in turn,
will significantly improve the efficiency of debris control. A closed immersion technique
allows control of film thickness; hence, the ratio between laser beam etching and compressed
plume etching can be modified, [32, 35-38]; thus, the ejection vector mode and velocity can
also be altered. A closed geometry immersion flow ensures the minimum traverse distance
for debris to travel and have work imparted on its original vector and speed as a constant.
Wang et al [39] have developed mathematical models to predict the impact of individual laser
ablation interactions on the resultant machined feature geometry and therefore the production
of debris from the material. This work shows that minor modification to the beam focal point
can cause a marked change in the cross sectional geometry of the machined feature. This is
an outcome that is confirmed by the poor geometry of the features machined using open thin
film flowing liquid immersed KrF excimer laser ablation [28], which had a rippled and
variable surface. Furthermore, there is the ability to control (and increase) the flow velocity
of the fluid though the duct; this will increase the drag force imparted on a debris particle by
the flow. Last, the symmetry of the closed immersion technique will remove the meniscus
dominated flow characteristics present in the open immersion technique. Equal drag is
imparted to all flow boundaries; hence the characteristic distance of a flow in a closed duct is
described by cross sectional dimensions. Lower turbulence means debris captured in the flow
is less likely to collide with the duct walls and be deposited in an unwanted position.
Experimental Procedures
Material Details
Bisphenol A polycarbonate (Holbourne Plastics, Ltd), was as received in 1200 x 1000 mm2
sheets of 0.5 mm thickness. Prior to excimer laser processing, the bisphenol A polycarbonate
sheet was cut into rectangular sections of 8 x 12 mm2 using scissors - a shear cutting
technique which avoids production of debris. Protective cover sheets were then peeled off
each sample.
Laser Details and Experimental Set-Up.
For both closed immersion and ambient air processing, an excimer laser (LPX200; Lambda
Physique, GmbH) using KrF as the excitation medium was used to produce a beam with a
wavelength of 248 nm. Thereafter, the beam was supplied to a laser micromachining centre
(M8000; Exitech, Ltd), where it was passed through a stainless steel mask to produce a 201 x
203 µm2 rectangular image. The masked beam was then demagnified through a 4x optic
(Francis Goodhall, Ltd) to produce an ablation spot with a depth of focus (DoF) of 6 μm. A
profile of the masked beam was obtained using a beam profiler (SP620U; Spiricon, Ltd),

which showed that the beam shape had an even distribution, with only a slight positive skew
across the y-axis; demonstrating good positioning of the mask in the raw beam.
Focus was found by narrowing the focal rage until satisfactory focus was achieved. Pulse
energy was measured out of focus, using a power meter head (J50LP-2; Molectron Detector,
Inc.) connected to a reader unit (Energy Max 400; Molectron Detector, Inc.). Spot energies
were measured six times for each sample – three times before the sample was machined and
three readings were taken after the sample was machined. Each reading was taken after the
system attenuator had been reset. In this way any change in the beam between measurements
and any inaccuracy in the positioning of the attenuator were accounted for.
Six sites were machined on all samples, each produced using an increasing number of pulses
(3, 6, 12, 60, 120 and 480 pulses) to produce an ablation rate matrix. The feature of interest
for debris analysis in this study was the feature machined using six pulses. Six pulses were
used for producing the samples that are the subject of this work to allow direct comparison to
samples produced in earlier work by Dowding and Lawrence [28]. In this instance the beam
was attenuated by a tool attenuator set at 126° from minimum transmission, resulting in a
beam fluence of 580.7 mJ/cm1 and 578.1 mJ/cm
1 for ablation in ambient air and under
filtered water immersion respectively, that produced features of 203 x 205 µm2. This fluence
data was calculated from pulse energy data taken using the technique detailed above.
All features examined in this work had two neighbours: every one lying 200 µm away from
the sample on either side. Critically, these features are aligned across the direction of liquid
flow. One feature is produced before each of the samples inspected in this work using just
three pulses, the feature inspected in this work is produced using six pulses, then following
this, another feature is machined to the right of the feature of interest using twelve pulses.
The use of neighbouring samples is important in the context of this work: when machining
features into a sample industrially, it is common for multiple features to be machined at
separate times or even during separate phases of manufacture [3]; thus, the importance of
preventing cross contamination of debris produced from one feature impacting the quality of
another is high.
Ambient Air Laser Processing
Samples machined in ambient air were produced using the same laser and micromachining
equipment as the closed immersion ablation samples. The bisphenol A polycarbonate samples
were mounted directly to the vacuum chuck inside the micromachining station (M8000;
Exitech, Ltd). After lasing ended the sample was removed and placed into the cell of a sealed
sample tray to protect them from atmospheric dust.
Closed Thick Film Filtered Water Immersion Laser Processing Procedure
Figure 1(a) describes the critical experimental layout of the sample once clamped inside the
flow rig, which was mounted to the side of the sample vacuum chuck of the laser micro-
processing centre (M8000; Exitech, Ltd.). The sample was positioned in the centre of the flat
aluminium table between the water supply and exit holes. The sample was retained by a
recess in a spacer plate (to provide a 1.5 mm thick water film) that lay in contact with the
aluminium sample table. An O-ring cord, located by a rectangular groove in the sample table,
provided a seal between the sample table and the spacer plate. On the top of the spacer plate a
second oval O-ring groove was machined to locate another O-ring cord. This acted as a
gasket between the spacer plate and the beam window – a 25 x 25 x 5 mm3 ultra-violet grade
fused silica sheet (Comar Instruments, Ltd). The beam window was retained by a diamond
shaped recess in a third aluminium plate, 8 mm in thickness to provide stiffness to the whole
sandwich.
Figure 1(b) shows the water filtering and supply system. Water originated from normal mains
supply by wall tap. The water was poured into a domestic water filter (Britta, Inc.) situated at
the top the water supply assembly to remove typical corrosive elements present in mains
water. The water was then retained in a header tank located above the pump and, under the
action of gravity, was forced into the 700 W pump chamber (CPE100P; Clarke Power
Products, Ltd.). The pump forced the water through a water flow rate meter (FR4500; Key
Instruments, Inc.) and then along a 3 m distance through a 6 mm outer diameter nylon tube to
the inlet push-in elbow fitting on the bottom of the sample table. Last, the water was returned
along a further 3 m through a 6 mm outer diameter nylon tube to a collection bucket. The
pump was capable of producing 4.2 bar at the outlet, equating to a maximum flow velocity
through the ablation chamber of 3.89 m/s, given losses along the supply and return tubing.
Precise control of the flow velocity was provided by a variable valve in the flow-meter. Flow
velocities of 0.03, 0.11, 1.85, 2.78, 3.24 and 3.70 m/s were used for this work.
Sample Analysis Techniques
For numerical data to be produced from solid samples, a number of steps had to be taken to
achieve the resolution of data across the broad area of samples machined for this work. Each
sample was imaged digitally as an uncompressed bitmap in 9 sectors (bottom left, bottom,
bottom right, left, centre, right, top left, top and top right) using reflective illumination and an
optical microscope (Optiphot; Nikon Corp.), at 20x magnification onto a CCD photosensor
(GXCAM-5; GT Vision, Ltd.). A blank micrograph was also taken to account for any dirt
that may have been present in the microscope optics and to record the image brightness
gradient produced by the illumination technique. The sector images were then digitally
corrected in terms of brightness gradient and erroneous marks using software (Image Pro 6.2;
Media Cybernetics, Inc.) and the blank micrograph as a datum image. The corrected sector
images were then combined to a single, large, high resolution bitmap. This full colour bitmap
was then converted to a binary data plot using software (Visilog Xpert 6.1; Noesis, SA.) The
numerical data of the three samples produced by each processing condition were then
combined and averaged using code programmed in a matrix processing suite (MATLAB
2008b; The MathWorks, Inc.) to produce six final data sets for samples produced in ambient
air and under closed thick film filtered water immersion at flow velocities of: 0.03, 0.11, 1.85,
2.78 and 3.70 m/s). This final averaged data was separated into ten groups classified by area
size. This data could then be manipulated to produce general population density data, local
population density data by sector or displacement data.
Results and Discussion
Impact of flowing closed thick film filtered water immersion on debris deposition with
comparison to samples machined in ambient air.
The distribution of debris generated by laser ablation in ambient air is dictated by the beam
shape [28], as one can see from Figure 2(i), Figure 3(i) and Figure 4(i), four high density
mushroom shaped deposition areas can clearly be seen extending at a normal to the edges of
the square feature machined. Dowding and Lawrence have explored the relationship between
beam shape and debris distribution, finding that debris is ejected, then deposited at normals to
linear edges of features. This tendency for preferential debris distribution was repeated when
using triangular beam shapes and a circular beam geometry [28]. Debris has been shown to
be transported in the laser ablation plume shockwave [40, 41], the deposition patterns
witnessed have a beam shape dependency because separate shockwaves, generated and
expanding simultaneously from different locations in the beam, collide and intersect as they
expand; depositing debris either at the location of shockwave collision or at the periphery of
individual shockwave range [28]. For a square, four seed points form separate shockwaves,
one from each corner of the feature, as described in Figure 5. As these expand they intersect,
dropping debris as they collide in the shaded areas indicated.
The existence of a neighbour is obvious for the sample shown in Figure 2(i), which was
machined in ambient air. Debris from the sample‟s neighbour to the right has been deposited
along with the debris of the feature being inspected to produce a significantly increased
debris density to the right of the feature. The same cross contamination is not evident for any
of the closed thick film filtered water immersion samples (Figure 2(ii) to Figure 2(v)). This
work demonstrates that the use of closed thick film filtered water immersion changes the
primary parameters that dictate the deposition trend of debris from a group of ablation
characteristics that are difficult for a user to control, to a set of separate flow parameters that
are easy for the user to control independently of the laser ablation mechanisms used for
machining.
Figure 3 and Figure 4 are groups of contour plots representing the total particle population
density per 486.6 µm2 area (which corresponds to a 10000 pixel box). Figure 3 shows contour
plots for all the samples seen in Figure 2. Figure 3(i) clearly demonstrates the characteristic
high density distinct deposition pattern of the sample machined in ambient air; this
distribution pattern is not present on any of the closed thick film filtered water immersion
ablated samples shown in Figure 3(ii) to Figure 3(v). This removal of high density localized
deposited debris smears was caused by the action of increased suspension and subsequent
retention of particulate debris by filtered water immersion. Furthermore, drag imparted on the
particles was much greater when using filtered water, a fluid offering two orders of
magnitude greater viscosity than air [33], afforded a marked increase in removal of debris
from the sample.
The results produced using closed thick film flowing filtered water immersed KrF excimer
laser ablation shown in Figure 2 show that the features machined are regular and repeatable
and the debris deposition patterning is minimal. This is in contrast to the performance of open
thin film liquid immersed KrF laser ablation machining attempted previously [28], where the
geometry of the features machined and the debris deposition patterns produced were non-
repeatable. This confirms that use of a closed duct to confine the geometry of the flowing

immersion fluid results in greatly increased stability and repeatability of the laser ablation
mechanism.
Impact of closed thick film filtered water immersion on total debris population.
A visual comparison of particle numbers present on the samples is given by Figure 4.
Comparison of Figure 4(i) to the closed thick film filtered water immersion machined
samples (Figure 4(ii) to Figure 4(v)) demonstrates a marked difference in deposited debris
population: the legends show a 96% reduction of the debris population generated by ablation
in ambient air when closed thick film filtered water immersion was applied.
Previously [28] it has been found that the use open de ionized (DI) water immersion ablation
produced proportionally fewer small debris than ablation in ambient air; a greatly increased
proportional population of medium debris particles and a similarly small proportion of large
debris. The same analysis has been conducted on the closed thick film filtered water
immersion samples in this work and compared to samples machined in ambient air. Figure 6
demonstrates that the total debris population size produced when using closed thick film
filtered water immersion ablation across all size classes (see detail plot given inside Figure
6), at any flow velocity, was 4603 compared to the 65553 produced by ablation in ambient
air. This is a reduction in debris deposition across the inspected surface of 93%. The use of
closed thick film filtered water immersion was even more effective at reducing debris
deposition in terms of frequency than the open technique described by Dowding and
Lawrence [28]. Once again, debris deposition for closed thick film filtered water immersion
is dictated by the flow parameters of the immersion liquid.
Feature floor characteristics.
When machining using ambient air as a medium, the debris was ejected away from the
feature, as evidenced by Figure 2(i). Whereas all features machined in ambient air showed an

even and clear floor, as can be clearly seen in Figure 2(ii) to Figure 2(iv) and Figure 7(a). All
samples machined under closed thick film filtered water immersion ablation displayed a dark,
opaque floor, as shown in Figure 7(b). Under flowing closed thick film filtered water
immersion, the debris was also ejected outwards in all directions, including the upstream
direction; this debris was assumed to be forced back over the feature by the oncoming flow of
immersing filtered water. It was assumed turbulent eddies, caused by the step change in
surface level at the feature wall, deposited debris on the feature floor. To confirm this, a
sample machined using closed filter water immersion ablation was cleaned using ultra-sonic
bath excitation, a well documented technique of removing a wide range of particulate sizes
from a surface [13]. The result of cleaning the sample for 10 minutes in fresh DI water
demonstrated identical floor patterning before (Figure 7(b)) and after (Figure 7(c)) treatment.
This shows that the apparent darkening of the feature floor is not a result of debris, rather it is
the result of an alteration to machined surface topography by the action of closed thick film
filtered water immersion machining. The micrographs used in this work rely on reflective
lighting, therefore increased diffusion of the light by the sample feature floor would make it
appear darker. This will be investigated in more exhaustive detail in a future publication.
Impact of flow velocity on deposition trend.
The results displayed in Figure 8 show the number of particles of three specific size ranges
for each closed thick film filter water immersion flow velocity tested discretely by use of
contour plot. Each group of result plots have been generated by taking a mean average of the
deposition frequency of three separate machined samples to guard against experimental
inaccuracy. The full results are split into 10 debris particle size classes, with the smallest,
middling and second largest (1st, 5
th and 9
th) debris size plots being given for illustration of
the findings of this work.

Again, all closed thick film filtered water immersion ablation sample results shown in Figure
8(b - f) show a contrast to the typical ambient air deposition tendency displayed in Figure
8(a). None of the closed thick film filtered water immersion samples, that were all produced
using different flow velocities, display either the high deposition density or the characteristic
debris size distribution (that was dominated by a majority of small debris). The closed thick
film filtered water immersion samples (Figure 8(b) to Figure 8(f)) all show an equal
population of both small and medium size debris and a proportionally increased population of
large debris deposited when compared to the samples produced in ambient air.
When inspecting and comparing the debris distribution of the closed thick film filtered water
immersion samples there is an obvious contrast in distribution between the three high flow
velocity samples displayed in Figure 8(b) to Figure 8(d) produced using 3.70, 2.78, and 1.85
m/s respectively, and the lower flow velocity samples shown in Figure 8(e) and Figure 8(f)
that were produced using 0.11 and 0.03 m/s respectively. The higher flow velocity samples
all demonstrate a clear propensity for debris deposition downstream of the feature, whereas
the low flow velocity samples both appear to show an even distribution upstream and around
to the sides of the feature across the direction of the flow. The samples displayed in Figure
8(f) also show a significant population of debris upstream. This would suggest that the
tendency for debris to be deflected and transported by a liquid is directly dependent upon the
liquid flow velocity. This interpretation is strongly supported by close inspection of the high
flow velocity samples: increased flow velocity, such as the plot in Figure 8(b), results in
decreased debris deposition, as can be identified by the magnitude of frequencies registered
in the legends for each group of plots. Flow turbulence also appears to become important, as
one can see from Figure 8(b), where stream lines of debris can be identified for the medium
sized debris to the top right of the feature.
The Reynolds numbers of the flows in this chamber have been calculated using both
rectangular duct and parallel plate approximations; these have been plotted in Figure 9. All of
the samples machined at a high liquid flow velocity experienced turbulence in the flowing
filtered water medium. The two samples machined at lower flow velocities were both
machined in the laminar regime. Turbulence generated at high flow velocities may cause
debris particles trapped in the flow of water to be directed back towards the sample surface
downstream of its production and ejection site. Increased flow velocity results in increased
turbulence [33]: thus it stands to reason that a greater proportion of debris deposited at high
flow velocities will be deposited as a result of turbulence. The results for the high flow
velocity samples in Figure 8(b-d) support this hypothesis, showing an inverse relationship
between total debris population size and flow velocity, but more localized streak pattern
grouping of debris downstream of the feature as the flow velocity was increased. The samples
produced using laminar flows do not show this characteristic, instead they demonstrate a
more even deposition trend. Reduced flow velocity even allows deposition upstream of the
feature, as can be seen in Figure 8(f), suggesting that this flow velocity only offers a level of
control to maintain suspension of the ejected debris in the fluid, rather than providing strong
positional control also.
Impact of flow velocity on debris population by size class
Figure 10 shows the population size of debris produced using immersed ablation with respect
to debris size class. The results given in Figure 10 make it clear that increased flow velocity
results in decreased deposition frequency. This is perhaps to be expected as increased flow
velocity means increased drag on particulates to provide motive force upon them, despite any
turbulence issues discussed above. Figure 10 also demonstrates that low flow velocity,
laminar closed thick film filtered water immersion produced a majority population of medium
sized (1.765 – 28.46 µm2) debris particles. This result can be attributed to the action of

colloidal debris interaction, as described by others [21, 28, 31]. Closed thick film filtered
water immersion produces a larger majority of medium sized debris than that displayed by
open thin film immersion [28]: the closed technique provided a more stable medium
geometry for particles to interact and combine within. Use of open thin film immersion
caused potential cohesion to be avoided by the action of medium rupture and splashing. A
closed thick film filtered water immersion structure allows more of the small debris to
combine to form medium size colloids [12]. Large multiple colloid debris are uncommon:
the adhesion forces become overwhelmed by the action of gravity and drag forces for
particles larger than 5 µm in diameter [9], a value at which the population sizes drop off
rapidly in Figure 10, instead they gather small debris, explaining the low small debris
population. Generally, increased flow velocity results in reduced total debris population;
however the samples machined at the lowest flow velocity (0.03 m/s) do not follow this
trend, showing a smaller population than the immediately higher flow velocity. The lowest
flow velocity used was chosen as it resulted in a flow velocity insufficient to traverse the
entire length of the feature between pulses, hence debris suspended in the flow produced by
one pulse would obstruct the course of the following pulse, thus resulting in decreased
average fluence across the feature. This would reduce the laser etch rate and therefore the
volume of debris produced by the lowest flow velocity in a way not experienced by the 0.11
m/s samples. This is what causes the abnormally low debris population of the lowest flow
velocity.
Relationship between debris size and deposition displacement
To interpret the action flowing closed thick film filtered water immersion had on debris with
respect to positional control of deposition, the distribution of deposition displacement from
the site of production by particle frequency with respect to debris particle size and flow
velocity was inspected. This can be deduced effectively using two differing techniques.
A statistical technique can be used: distribution skew, a numerical value that denotes the
shape of the distribution about the mean of a frequency distribution. A positive skew value is
the result of a distribution where a greater proportion of the population lies between the mean
and infinity; a negative skew value is the result of a distribution where a greater proportion of
the population lies between the origin and the mean. A large magnitude of skew denotes a
strong population „lean‟ about the mean, a lower skew value denotes a distribution of the
population that is more evenly balanced about the mean. In Figure 11, plots of the magnitude
of skew for all the immersed samples are displayed with respect to displacement from the top
edge of the feature as viewed in Figure 2. The plots of the samples machined in turbulent
flow displayed in Figure 11 all show correlating trends. Small debris has a large positive
skew, which drops away to a smaller positive skew for medium size debris. This means the
displacement of debris before deposition increases with size. This finding is contrary to the
expected trend, where the ratio of surface area to volume decreases with size, causing the
action of drag against mass dominated inertia to reduce with increasing particle size. An
explanation of this interesting trend can be given using turbulence and adhesion science: the
action of turbulence does not effect large debris as easily as small debris due to the
contrasting relationships between size, surface area and mass; thus, large debris more readily
follows the general vector of the flow than small debris and is therefore less commonly
smeared onto the sample surface [32]. Also, the drag on a particle with respect to the size of
the adhesion forces acting upon it will be favourable for easy removal of larger debris [12].
The samples produced using laminar flow velocities display much less predictable plots, but
broadly follow those of the turbulent flow velocity samples suggesting that the immersing
liquid volume provides less stable debris transportation mode than the turbulent flows,
perhaps as a result of the interaction of ablation plumes generated by subsequent laser pulses
with the surrounding immersion fluid before it has fully cleared the feature location. It must

be noted that the skew measure is limited to only the lower seven debris sizes as there are
fewer large particles available for reliable plots above the debris particle size of 129 µm2.
Another, less simple measurement of the positional tendency was made to verify the previous
statistical analysis. The centre position of the debris population density peak can be plotted
for each designated debris size class. This information is plotted for each flow velocity in
Figure 12. These plots tally well with indications presented by the skew magnitude data,
where the displacement of the debris from the top edge of the machined feature increases
with debris size up to a maximum debris size of 129 µm2. However, the use of the median
measure of the top 5% of the normalized frequency distribution allows interpretation of the
larger debris deposition displacement. Inspection of these points shows the larger debris is
deposited with larger displacement from the machined feature than small debris. The
unreliable trend demonstrated by the skew measurement for laminar flow velocities in Figure
11 is more interpretable when plotted using the median measure of the top 5% of the
normalized frequency distribution shown in Figure 12. This data appears to tie well with the
trend of increased displacement for medium sized debris over smaller debris in the same flow
conditions for debris up to 129 µm2 in area; however, the data becomes unreliable for larger
debris sizes due to small numbers making this measurement technique susceptible to
significant distortion by outliers.
In Figure 11 the flow velocity of 1.85 m/s has the largest magnitude of positive skew; in
Figure 12, it has the highest displacement for every size class of debris measured. This
demonstrates that the optimum flow velocity for maximum displacement of debris before
deposition occurs at 1.85 m/s. The 3.70 and 2.78 m/s samples display similar displacements
for each debris size class as the laminar flow samples. This can be attributed to the effect of
turbulence causing unnecessary deposition at excessive flow velocities and a lack of motive
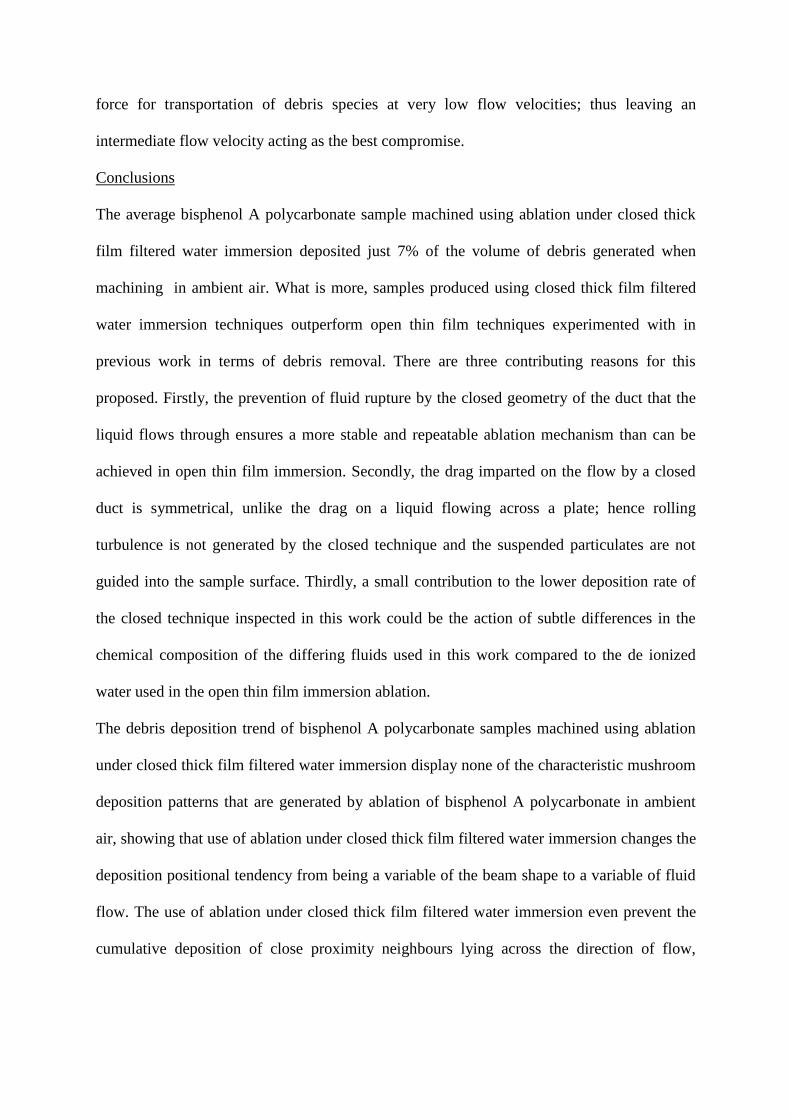
force for transportation of debris species at very low flow velocities; thus leaving an
intermediate flow velocity acting as the best compromise.
Conclusions
The average bisphenol A polycarbonate sample machined using ablation under closed thick
film filtered water immersion deposited just 7% of the volume of debris generated when
machining in ambient air. What is more, samples produced using closed thick film filtered
water immersion techniques outperform open thin film techniques experimented with in
previous work in terms of debris removal. There are three contributing reasons for this
proposed. Firstly, the prevention of fluid rupture by the closed geometry of the duct that the
liquid flows through ensures a more stable and repeatable ablation mechanism than can be
achieved in open thin film immersion. Secondly, the drag imparted on the flow by a closed
duct is symmetrical, unlike the drag on a liquid flowing across a plate; hence rolling
turbulence is not generated by the closed technique and the suspended particulates are not
guided into the sample surface. Thirdly, a small contribution to the lower deposition rate of
the closed technique inspected in this work could be the action of subtle differences in the
chemical composition of the differing fluids used in this work compared to the de ionized
water used in the open thin film immersion ablation.
The debris deposition trend of bisphenol A polycarbonate samples machined using ablation
under closed thick film filtered water immersion display none of the characteristic mushroom
deposition patterns that are generated by ablation of bisphenol A polycarbonate in ambient
air, showing that use of ablation under closed thick film filtered water immersion changes the
deposition positional tendency from being a variable of the beam shape to a variable of fluid
flow. The use of ablation under closed thick film filtered water immersion even prevent the
cumulative deposition of close proximity neighbours lying across the direction of flow,

further underlining the control of species generated by ablation using closed thick film
filtered water immersion.
The use of frequency scaled intensity distribution contour plots demonstrated that both the
total population of debris and the deposition positional tendency are effected by immersion
liquid flow velocity. Most obviously, there is significant difference between the particulate
distribution generated by turbulent flow velocity and laminar flow velocity; turbulent flow
guides debris downstream effectively, laminar flow merely causes the debris to achieve a
more even distribution than that given by ambient air. The population size of debris produced
is inversely proportional to the flow velocity. For high flow velocity regimes an increase in
flow velocity of 100% from 1.85 to 3.70 m/s results in a 33.8% decrease in total debris
population size. Laminar flow velocity resulted in larger total debris population, with an
average total debris population 156% greater than the total population of the lowest turbulent
flow velocity. Of significance is the observation that the population of debris is greater for the
higher laminar flow velocity. This is proposed to be caused by the interaction of suspended
debris in the flow with the ablation plume: at very low flow velocities the suspended debris
intercepts the beam en-route to the feature, lowering the laser fluence across the feature area,
reducing the etch rate of the material achieved and therefore the volume of debris produced.
At the increased laminar flow velocity, the suspended debris is displaced more rapidly,
preventing beam interception by suspended debris, allowing maximum laser etching.
The use of closed thick film filtered water immersion modified the typical debris population
by size class. Ablation in ambient air generated a large majority of small sized particulate
debris; ablation under closed thick film filtered water immersion negated this majority of
small sized debris, as an equal proportion of the total debris population were medium sized
particles. Large particles were still found to be uncommon when using closed thick film
filtered water immersion ablation. This change in debris size population trend is accredited to

the action of colloidal particle interactions, where small debris was collected across the walls
of gas micro-bubbles in the immersing liquid volume, which were generated as the ablation
plume dispersed. As the micro-bubble gas cools and contracts the action of capillary and van
der Waals forces bind the collection of small particles to form a single medium sized
colloidal item. Once formed these colloidal particles tend not to combine to form large debris,
as the small adhesion forces are not high enough in magnitude to reliably bind these together.
The interaction between debris with regards to size and any given flow velocity is also
interesting. Measures of frequency distribution skew magnitude and inspection of the median
of the 95 percentile of the normalised distribution of the debris frequency demonstrate that
large debris is displaced further by any given turbulent flow than a small debris particle. This
is a confusing result when considering the drag imparted by a flow onto a particle with
respect to that particles mass. It is proposed that the action of turbulence does not effect large
debris as easily as small debris: large debris follows the general vector of the flow more
readily than small debris and is therefore less commonly smeared onto the sample surface.
Also, the drag on a particle with respect to the size of the adhesion forces acting upon it will
be favourable for easy removal of larger debris. This analysis technique also showed that
there was an optimum removal flow velocity, where the displacement of any given debris
size was at a maximum in the filtered water medium. This flow velocity is shown to be
approximately 1.85 m/s.

References
1. Rizvi, N. H., Apte, P. “Developments in laser micro-machining techniques”, Journal
of Materials Processing Technology, 2002, 127 (2), pp.206-210
2. Dyer, P. E. “Excimer laser polymer ablation: twenty years on”, Applied Physics A,
2003, 77 (2), pp.167-173
3. Gower, M. C. “Excimer laser microfabrication and micromachining”, Laser Precision
Microfabrication, RIKEN Review, 2001, pp.50-56.
4. Braun, A., Zimmer, K., Hösselbarth, B., Meinhardt, J., Bigl, F., Mehnert, R. “Excimer
laser micromachining and replication of 3D optical surfaces”, Applied Surface
Science, 1998, 127-129, pp.911-914
5. Izatt, J. A., Sankey, N. D., Partovi, F., Fitzmaurice, M., Rava, R. P., Itzkan, I., and
Feld, M. S. “Ablation of Calcified Biological Tissue Using Pulsed Hydrogen Fluoride
Laser Radiation”, IEEE Journal of Quantum Electronics, 1990, 26 (12), pp.2261-
2270.
6. Ghantasala, M. K., Hayes, J. P., Harvey, E. C., and Sood, D. K. “Patterning,
electroplating and removal of SU-8 moulds by excimer laser micromachining”,
Journal of Micromechanics and Microengineering, 2001, 11 (2), pp.133-139.
7. Lankard J. R., and Wolbold, G., “Excimer Laser Ablation of Polyimide in a
Manufacturing Facility”, Applied Physics A, 1992, 54 (4), pp.355-359
8. Lobo, L. M., “Solid Phase By-Products of Laser Material Processing”, Doctoral
Thesis, 2002, Wolfson School of Mechanical and Manufacturing Engineering,
Loughborough University.
9. Mizes, H., Ott, M., Eklund, E., and Hays, D. “Small particle adhesion: measurement
and control”, Colloids and Surfaces A, 2000, 165 (1-3), pp.11-23.

10. Stowers, I. F., and Patton, H. G. “Techniques for removing contaminants from optical
surfaces”, Proceedings of the 4th
Conference on Contamination, Washington DC,
12/10/1978, OSTI. pp.127-141.
11. Hutcheson, G. D. “Recent trends in clean technology”, Microcontamination, 1988, 8,
pp.33-41
12. Bowling, R. A. “Behaviour and detection of particles in vacuum processes”, Journal
of the Electrochemical Society, 1987, 134 (3), pp.122-133.
13. Bardina, J. “Methods for surface particle removal: a comparative study”, Particulate
Science and Technology, 1988, 6 (2), pp.121-131.
14. Rizvi, N. H. “Production of Novel 3D Microstructures Using Excimer Laser Mask
Projection Techniques”, In: Courtois, B., Crary, S.B., Ehrfeld, W., Fujita, H., Karam,
J.E. and Markus, K.W. (eds), Proceedings of SPIE, Design, Test, and
Microfabrication of MEMS and MOEMS, 1999, 3680, pp.546-552, SPIE, Belligham,
WA, USA .
15. Pedder, J. E., Holmes, A. S., Booth, H. J. “Pulsed Laser Ablation of Polymers for
Display Applications”, In: Holmes, A. S., Meunier, M., Arnold, C. B., Niino, H.,
Geohegan, D. B., Träger, F., Dubowski, J. J. (eds), Proceedings of SPIE Photonics
West: Lasers and Applications in Science and Engineering, 2008, 6879. SPIE
Bellingham, WA, USA.
16. Exitech EUV microstepper tool for resist testing and technology evaluation
presentation, 2004, International SEMATECH Litho Forum, Los Angeles,
SEMATECH Inc.
17. Scaggs, M. J. Method and apparatus for fine liquid spray assisted laser material
processing, 2003, WO/2003/028943, USA.

18. London. F. “The general theory of molecular forces”, Transactions of the Faraday
Society, 1937, 33, 8, pp.8-37.
19. Lifshitz, E. M. “The theory of molecular attractive forces between solids”, Soviet
physics JETP-USSR, 1956, 2 (1), pp.73-83.
20. Leite, F. L., and Herrmann, P. S. P. “Application of atomic force spectroscopy to
studies of adhesion phenomena: a review”. Journal of Adhesion Science and
Technology, 2005, 19 (3-5), pp.365-405.
21. Visser, J. “The Adhesion of Colloidal Polystyrene Particles to Cellophane as a
Function of pH and Ionic Strength”, Journal of Colloid and Interfacial Science, 1976,
55 (3), pp.664-667.
22. Fuller, K. N. G., and Taber, D. “The Effect of Surface Roughness on the Adhesion of
Elastic Solids”, Proceedings of the Royal Society: A, 1975, 345 (3), pp.327-342.
23. Feiler, A. A., Jenkins, P., and Rutland, M. W. “Effect of relative humidity on
adhesion and frictional properties of micro and nano-scopic contact”, Journal of
adhesion science and technology, 2005, 19 (3-5), pp.165-179.
24. Yukawa. H. “Quantum theory of non-local fields: Part 1. Free fields”, Physical
Review, 1950, 77 (2), pp.219-226.
25. Richerzhagen, B. Material shaping device with a laser beam which is injected into a
stream of liquid, Synova S.A., 1999, WO/1999/056907, Switzerland.
26. Wang. J., Niino. H., Yabe. A. “Micromachining of transparent materials with super-
heated liquid generated by multiphotonic absorption of organic molecule” Applied
Surface Science, 2000, 154–155, pp.571–576.
27. Sattari, R., Sajti, C. L., Kahn, S., and Barcikowski, S. “Scale-up of nanoparticle
production during laser ablation of ceramics in liquid media”, The proceedings of The
27th
International Congress on Application of Lasers and Electro-Optics: Laser
Materials Processing Section, Temecula, CA, Laser Institute of America, 20th
-23rd
September 2008, pp.49-54.
28. Dowding, C. F., and Lawrence, J. “Use of thin laminar liquid flows above ablation
area for control of ejected material during excimer machining”, IMECHE Proceedings
B, 2009, 223 (7), pp.759-774
29. Bickel, W. S. and Wentzel, T. M. “Adhesion due to a meniscus in a crossed-fibre
system”, in Mittal, K. L. (Ed) “Particles on surfaces 2: detection, adhesion and
removal”, 1989, 1, Plenum, New York, pp.35-48.
30. Berthe, L., Fabbro, R., Peyre, P., and Tollier, L. “Shock waves from a water-confined
laser-generated plasma”, Journal of Applied Physics, 1997, 82 (6), pp.2826-2832
31. Katto, M., Kuroe, Y., Kaku, M., Kubodera, S., Yokotani, A., Katayama, H., and
Nakayama, T. “Nano-particles of hydroxyapatite formed by underwater laser ablation
method” The proceedings of The 27th
International Congress on Application of Lasers
and Electro-Optics: Laser Materials Processing Section, Temecula, CA, Laser
Institute of America, 20th
-23rd
September 2008, pp.65-67.
32. Zhu, S., Lu, Y. F., Hong, M. H., Chen, X. Y., “Laser ablation of solid substrates in
water and ambient air”, Journal of Applied Physics, 2001, 89 (3), pp.2400-2403
33. Munson, B. R., Donald, F. Y., and Theodore, H. O. Fundamentals of Fluid
Mechanics, 2002, 4, John Wiley & Sons Inc., NY.
34. Dyer, P. E., Key, P. H., Sands, D., Snelling, H. V., and Wagner, F. X. “Blast-wave
studies of excimer laser ablation of ZnS”, Applied Surface Science, 1995, 86, pp.18-
23.
35. Fabbro, R., Peyre, P., Berthe, L., and Scherpereel, X. L. “Physics and applications of
laser-shock processing“, Journal of Laser Applications, 1998, 10 (6), pp.265-269.

36. Elaboudi, I., Lazare, S., Belin, C., Talaga, D., and Labrugere C. “Underwater excimer
laser ablation of polymers”, Applied Physics A, 2008, 92 (4), pp.743-748.
37. Elaboudi, I., Lazare, S., Belin, C., Talaga, D., and Labrugere C. “From polymer films
to organic nanoparticles suspensions by means of excimer laser ablation in water”,
Applied Physics A, 2008, 93 (4), pp.827-831.
38. Elaboudi, I., Lazare, S., Belin, C., Talaga, D., and Labrugere C. “Organic
nanoparticles suspensions preparation by underwater excimer laser ablation of
polycarbonate”, Applied Surface Science, 2007, 253 (13), pp.7835-7839.
39. Wang, W. J., Mei1, X. S., Jiang1, G. D., and Yang, C. J. “Shape characteristics of
microstructures in femtosecond laser multi-pulse ablation of metals”, IMECHE
Proceedings B, 2008, 222 (7), pp.837-848.
40. Dyer, P. E., Karnakis, D. M., Key, P. H., and Tait, J. P. “Excimer laser ablation of low
and high absorption index polymers”, Applied Surface Science, 1996, 96–98 (2),
pp.167–173.
41. Dyer, P. E., Karnakis, D. M., Key, P. H., and Sands, D. “Fast photography of UV
laser ablated metal films”, Applied Surface Science, 1997, 109–110, pp.168–173.

Figure 1(a): the closed thick film filtered water immersion ablation assembly: (1) sample; (2)
base plate; (3) sample clamp and flow chamber spacer; (4) U.V. grade fused silica window
for laser beam; (5) window clamp; (6) clamping bolts that squeeze components together.
Figure 1(b): the fluid supply unit: (1) source water; (2) filtering; (3) filtered water storage; (4)
centrifugal pump; (5) flow rate control valve; (6) high pressure flow rate controlled filtered
water outlet to flow rate ablation chamber.
Figure 2: Micrographs, stitched and software enhanced for smooth illumination: (i) Ambient
air; (ii) 3.70 m/s; (iii) 2.78 m/s; (iv) 1.85 m/s; (v) 0.03 m/s.
Figure 3: contour plots of discrete particle density measures over 100 pixel square areas
(separate legends for each sample): (i) Ambient air; (ii) 3.70 m/s; (iii) 2.78 m/s; (iv) 1.85 m/s;
(v) 0.03 m/s.
Figure 4: contour plots of discrete particle density measures over 100 pixel square areas
(single legend calibrated to maximum particle density measured from any of the samples): (i)
Ambient air; (ii) 3.70 m/s; (iii) 2.78 m/s; (iv) 1.85 m/s; (v) 0.03 m/s.
Figure 5: A schematic illustrating four ablation plumes emanating from the corners of the
square image. Debris lands in higher concentrations where they meet
Figure 6: Plots describing the total particle population of samples produced under ambient air
and the relative population of debris produced by closed thick film filtered water immersion
ablation.

Figure 7: micrographs displaying the clear floor of sample machined in ambient air (a); the
dark floor of sample machined under closed thick film filtered water immersion, before the
sample was cleaned using ultrasonic bathing for 10 minutes (b); the dark floor of sample
machined under closed thick film filtered water immersion, after the sample was cleaned
using ultrasonic bathing for 10 minutes (c).
Figure 8: Discrete contour plots of debris particle density. The frequency of particles is
measured over 400 pixel square cells and denoted by one of 28 greyscale shades with white
being 0 particles counted.
Figure 9: Plots of two Reynolds number regimes: one for a wide duct, the other for a
rectangular duct. The specific flow velocities used in this work are indicated.
Figure 10: The distribution debris frequency across the whole area by size class for all
immersed samples. This clearly shows that medium sized debris is prominent when using
immersed ablation.
Figure 11: A plot of the x position distribution skew of the frequency data for the small to
medium size debris. There were too few large debris particles measured to give reliable data
for this type of analysis.
Figure 12: Another useful graphical technique to demonstrate the shift in distribution of the
debris with increasing debris size: this time using the median of 95th
percentile of normal
distribution of distribution frequency data.
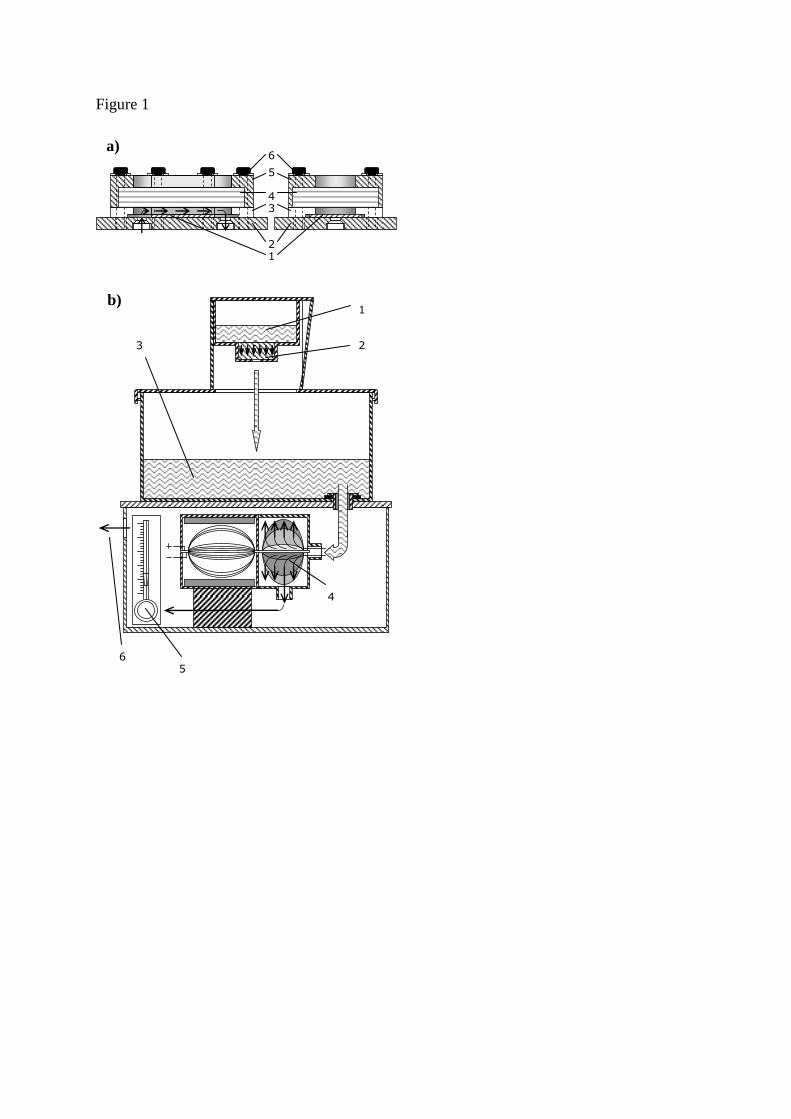
Figure 1
5
4 3
2 1
6 a)
1
2 3
4
5 6
b)
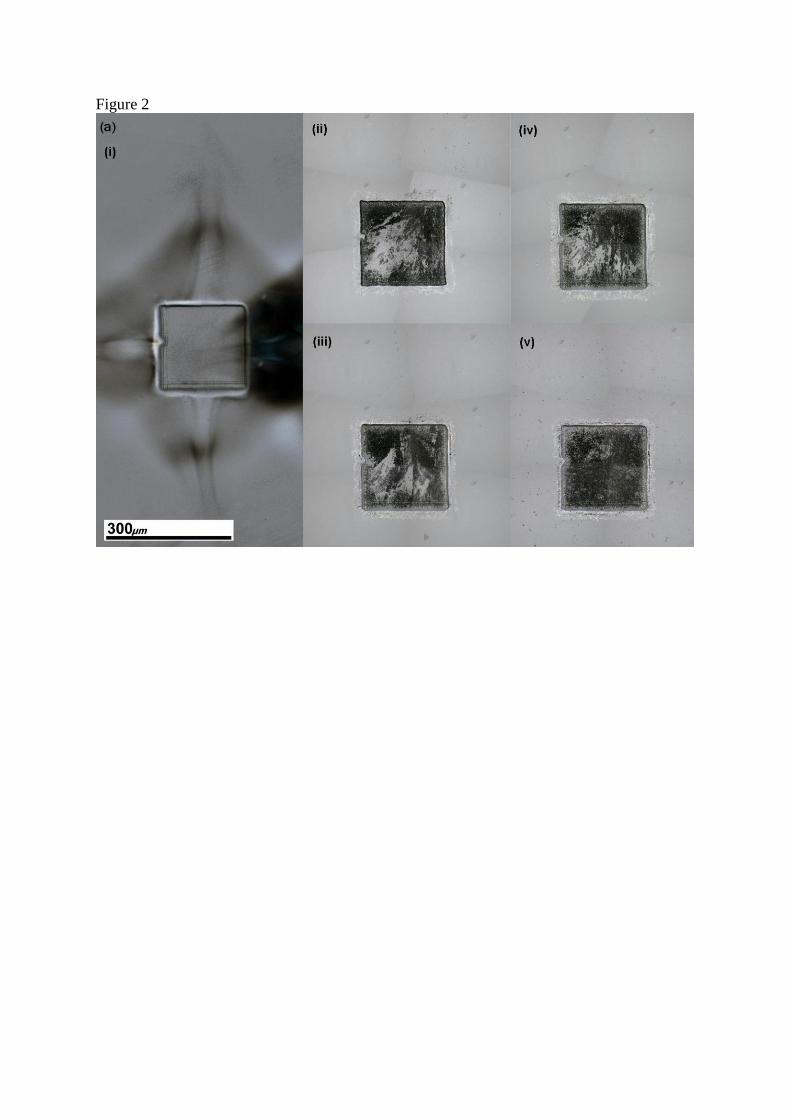
Figure 2

Figure 3

Figure 4
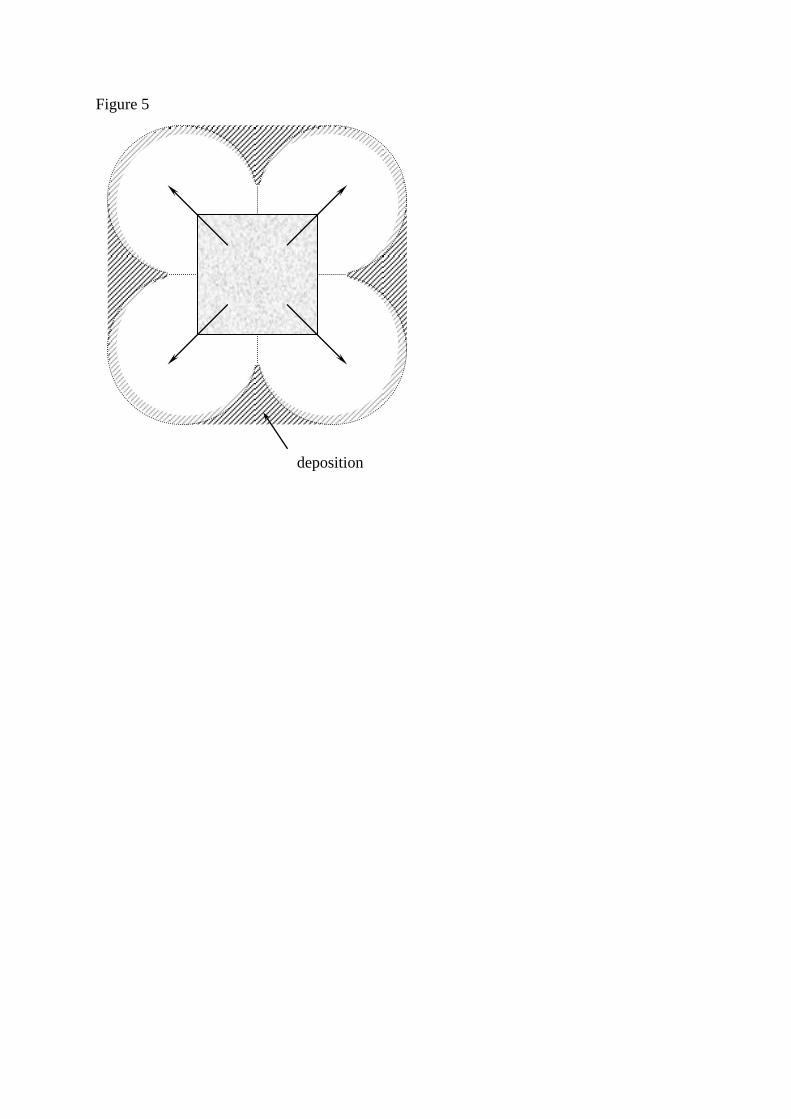
Figure 5
deposition
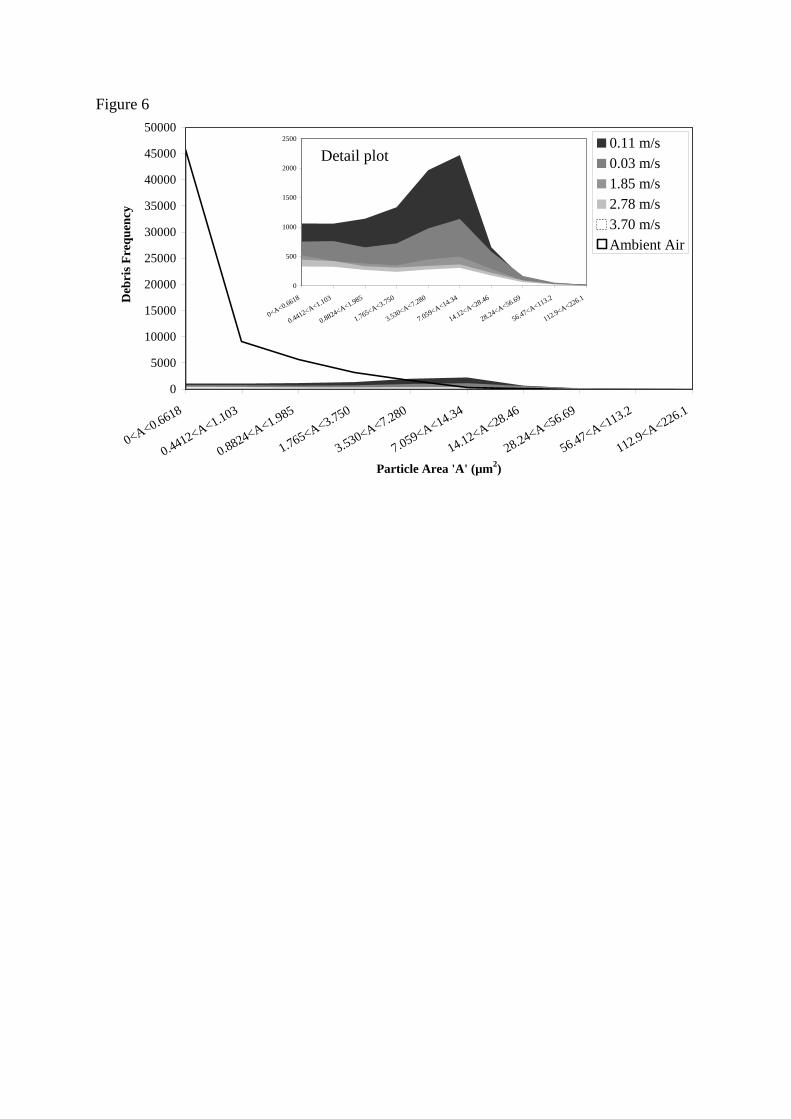
Figure 6
0
5000
10000
15000
20000
25000
30000
35000
40000
45000
50000
0<A<0.6618
0.4412<A<1.103
0.8824<A<1.985
1.765<A<3.750
3.530<A<7.280
7.059<A<14.34
14.12<A<28.46
28.24<A<56.69
56.47<A<113.2
112.9<A<226.1
Particle Area 'A' (µm2)
Deb
ris
Fre
qu
ency
0.11 m/s
0.03 m/s
1.85 m/s
2.78 m/s
3.70 m/s
Ambient Air
0
500
1000
1500
2000
2500
0<A<0.6618
0.4412<A<1.103
0.8824<A<1.985
1.765<A<3.750
3.530<A<7.280
7.059<A<14.34
14.12<A<28.46
28.24<A<56.69
56.47<A<113.2
112.9<A<226.1
Detail plot

Figure 7

Figure 8
0 ≤ Debris
Area (µm2) ≤
0.3375
1.913 ≤ Debris
Area (µm2) ≤
3.713
28.91 < Debris
Area (µm2)
<57.71
Ambient
Air
(a)
0.0333
(m/s)
=
3.70
(m/s)
(b)
0.0250
(m/s)
=
2.78
(m/s)
(c)
0.0167
(m/s)
=
1.85
(m/s)
(d)
0.0010
(m/s)
=
0.11
(m/s)
(e)
0.00025
(m/s)
=
0.03
(m/s)
(f)
Flo
w v
elo
cit
y (
0.0
3
to 3
.70
m/s)
Debris Size

Figure 9

Figure 10
0
500
1000
1500
2000
2500
0<A<0.6618
0.4412<A<1.103
0.8824<A<1.985
1.765<A<3.750
3.530<A<7.280
7.059<A<14.34
14.12<A<28.46
28.24<A<56.69
56.47<A<113.2
112.9<A<226.1
Particle Area, A (µm2)
Deb
ris
Freq
uen
cy
Filter 3.70 m/s
Filter 2.78 m/s
Filter 1.85 m/s
Filter 0.11 m/s
Filter 0.03 m/s

Figure 11
0
0.5
1
1.5
2
2.5
3
0.00 2.00 4.00 6.00 8.00 10.00 12.00 14.00 16.00
Debris Area (µm2)
Magn
itu
de
of
Sk
ew
3.70 m/s
2.78 m/s
1.85 m/s
0.11 m/s
0.03 m/s
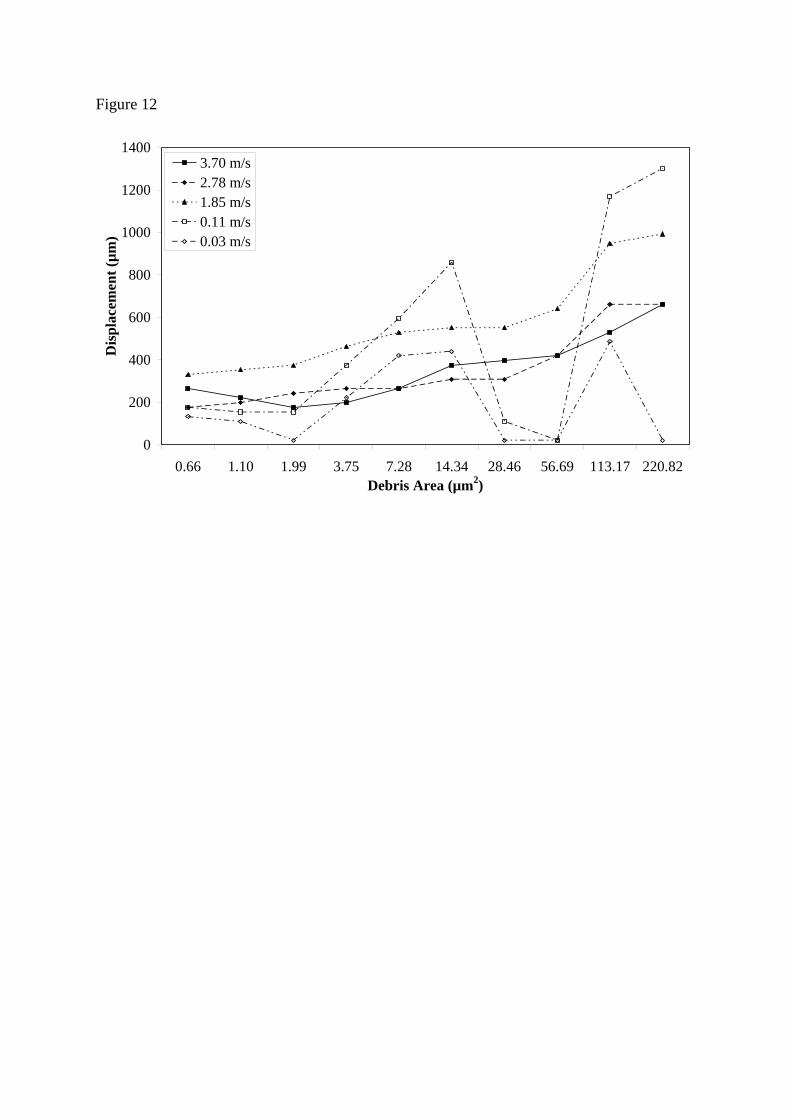
Figure 12
0
200
400
600
800
1000
1200
1400
0.66 1.10 1.99 3.75 7.28 14.34 28.46 56.69 113.17 220.82
Debris Area (µm2)
Dis
pla
cem
ent
(µm
)
3.70 m/s
2.78 m/s
1.85 m/s
0.11 m/s
0.03 m/s