preliminary stages of a validity study of the use of an ... · pdf filepreliminary stages of a...
TRANSCRIPT

Preliminary Stages of a Validity Study of the Use of an Aptitude Test in University Entrance
Chris Whetton, Catherine Kirkup, Ian Schagen, Rebecca Wheater
and Jo Morrison
Paper presented at the 33rd International Association for Educational Assessment Conference, 16 – 21 September 2007, Baku, Azerbaijan.
Presenter: Chris Whetton
Assistant Director,
National Foundation for Educational Research
The Mere, Upton Park Slough SL1 2DQ
United Kingdom


1
1 Summary 1.1 Introduction In September 2005 the National Foundation for Educational Research (NFER) in association with the (then) Department for Education and Skills (DfES), the Sutton Trust and the College Board, began a five-year research study to examine the validity of an aptitude test in higher education admissions. This paper describes and explores the relationships between scores on the SAT Reasoning TestTM (also known in brief as the SAT®), attainment measures (A levels and GCSEs) and background characteristics of the student sample. The SAT® has three measures: Critical Reading, Mathematics and Writing.
1.2 Key findings
All secondary schools in England were invited to take part in a research project to assess the validity of an aptitude test for university entrance. In those agreeing, A level students were asked to volunteer to take the SAT®. The number of students who took the SAT® in autumn 2005 and agreed that their data could be used within the research was 9022. Of these SAT® participants, 8041 students were matched to both GCSE and A level attainment data and form the basis of the analysis for this report (hereafter referred to as the main sample). The key findings were as follows:
• The mean SAT® scores of the English sample were very similar to US mean scores and individual items functioned in a similar way in comparable samples of students.
• The correlation between A level scores and the SAT® was 0.64 (i.e. high A level scores were generally associated with high scores on the SAT®). This correlation was higher than correlations of between 0.33 and 0.50 in a previous pilot study (McDonald et al., 2001a), most likely due to restructuring of both measures in the intervening years.
• SAT® scores and total A level (or equivalent) score points were generally related in a similar way to a number of educational and socio-economic factors, including the type of institution attended, ethnicity, eligibility for free school meals (FSM), etc.
• Female students had higher total GCSE and A level points scores and achieved significantly higher scores on the SAT® Writing component than male students. Male students performed significantly better on the SAT® Mathematics component and on the SAT® as a whole.
• The levels of correlation between SAT® scores and A level grades vary between A level subjects. Science subjects and Mathematics tend to have a closer association with SAT® Mathematics , but subjects such as History and English Literature are more closely related to SAT® Writing and Critical
2
Reading. A few A level subjects such as Psychology do not have particularly high correlations with any SAT® score. This may mean that the SAT® has differential utility as an additional predictor according to the degree subject involved and the A levels taken.
• There are sex differences in the relationships between SAT® scores and A level grades, particularly for SAT® Mathematics. This may add to the complexity of interpreting and using SAT® scores for degree course selection. However, such relationships can only become clearer when the degree outcomes have been collected and analysed.
A fuller account of the first stages of this project is given in Kirkup et al (2007). At this stage, the analysis is being focussed on attainment and broad background variables. Further analyses will be carried out during the next twelve months, looking at differences between students and examining the social, educational and economic background variables using more complex statistical modelling of the data. This analysis will incorporate data on the attainment of the institutions attended, census data relating to the home postcodes of students in the sample and, where available, information supplied by the students themselves (e.g. parental education). Without higher educational outcomes it will not be possible, as yet, to answer the main research questions. However, this further analysis may reveal more about the performance of students across the SAT®, A levels and GCSEs according to more sensitive measures of disadvantage.

3
2 Introduction In September 2005 the National Foundation for Educational Research (NFER) in association with the Department for Education and Skills (DfES), the Sutton Trust and the College Board, began a five-year research study to examine the validity of an aptitude test in higher education admissions. This paper describes and explores the relationships between scores on the SAT Reasoning TestTM (also known in brief as the SAT®), attainment measures (A levels and GCSEs) and background characteristics of the student sample. This paper will report on the early phases of the project, which consisted of the Administration of the SAT®, the collection of student data and the relationship of the SAT® scores to A levels, in light of the backgrounds of the students. Later phases of the project will obtain degree outcomes and relate these to the earlier attainment and aptitude measures. A fuller account of the first stages of this project is given in Kirkup et al (2007).
2.1 Background Higher education brings considerable benefits to graduates in terms of salary, job security, employment opportunity, and so on. Although the number of students entering higher education (HE) has grown enormously in recent years, some groups are still under-represented. In a report into the participation in higher education over the period 1994-2000 (HEFCE, 2005) it was noted that young people living in the most advantaged 20 per cent of areas were five or six times more likely to go into higher education than those from the least advantaged 20 per cent of areas. The benefits of higher education vary according to the course studied and the institution attended. The demand for university places generally exceeds the supply available, particularly for popular courses or popular institutions. Where there are competing applicants, universities and other higher education institutions have to assess the merit and potential of each student in order to decide who to admit.
In its report, the Admissions to Higher Education Steering Group, chaired by Professor Steven Schwartz (DfES, 2004), identified several issues to be addressed to bring about improvements to the admissions system in England and to ensure a fair and transparent system for all students. As the system stands at present, most of the offers of university places to prospective students are made on the basis of predicted grades rather than examination results. Although the process is moving towards a post-qualification application system, a difficulty that will remain for admissions staff is that they may have to choose from an increasingly large number of highly-qualified candidates who achieve a string of A grades in their A level examinations. A further issue identified by the Schwartz report was that the information used to assess university applicants may not be equally reliable. Although ‘prior educational attainment remains the best single indicator of success at undergraduate level’ it is recognised that for some students, their true potential may not be reflected in their examination results due to social or educational disadvantages.

4
A recommendation of the Schwartz group was that assessment methods used within the admissions system should be reliable and valid.
Admissions policies and procedures should be informed and guided by current research and good practice. Where possible, universities and colleges using quantifiable measures should use tests and approaches that have already been shown to predict undergraduate success. Where existing tests are unsuited to a course’s entry requirements, institutions may develop alternatives, but should be able to demonstrate that their methods are relevant, reliable and valid. (p. 8)
A levels are central to the higher education admissions process and the ability of A level grades to predict degree outcomes has been demonstrated using a large data set (Bekhradnia and Thompson, 2002), but similar published evidence regarding the predictive validity of admissions tests or aptitude tests to degree outcomes within the UK context appears to be lacking. Amongst its wider recommendations the Schwartz report encouraged the commissioning of research to evaluate the ability of aptitude tests to assess the potential for higher education.
The principal previous study underpinning this current research was the pilot comparison of A levels with SAT® scores conducted by NFER for The Sutton Trust in 2000 (McDonald et al., 2001a, Whetton, 2001). SAT® scores were collected together with A level grades, prior attainment and a range of background information for 1295 students from a sample of high-attaining, low-attaining and selective independent schools. The study revealed that the SAT® was only modestly associated with A level grades, which indicated that the SAT® was assessing a distinct construct from A levels. (There was a slightly stronger association between the SAT® and GCSE attainment.) However, there was no evidence that the association differed according to background factors such as ethnicity, parental socio-economic status or overall achievement of the school.
The 2000 study used a shortened version of the SAT®, and further analyses explored the functioning of this test with English students. These showed that the SAT® provided a coherent assessment of verbal and math reasoning ability, and that individual items appeared to function similarly for English and American students.
Although the SAT® has been relabelled as a ‘reasoning’ test rather than a test of ‘aptitude’, it is still generally perceived as a test of academic aptitude. Implicit within the term ‘aptitude’ is the concept of predictive validity. The purpose of an aptitude test is to measure an individual’s potential for obtaining a certain goal. In this case, the goal is successful completion of a university course and achievement (i.e. degree class). If a high proportion of applicants who score well on a certain test go on to successfully complete their degrees, and those who score lower are somewhat less likely to be successful, we would say that the test has good predictive validity.
For a detailed discussion of aptitude testing for university entrance see also the literature review conducted by McDonald et al. for the Sutton Trust (2001b).

5
3 Methodology 3.1 The SAT Reasoning TestTM The SAT Reasoning TestTM (previously known as the Scholastic Assessment Test and prior to that the Scholastic Aptitude Test) has been recently revised and now comprises three main components: Critical Reading, Mathematics and Writing. In the US the administration of the SAT® is split into ten separately timed sections, with a total test time, excluding breaks, of three hours and forty-five minutes.
The Critical Reading section of the SAT® contains two types of multiple-choice items: sentence completion questions and passage-based reading questions. Sentence completion items are designed to measure students’ knowledge of the meanings of words and their understanding of how sentences fit together. The reading questions are based on passages that vary in length, style and subject and address vocabulary in context, literal comprehension and extended reasoning. The Mathematics section contains predominantly multiple-choice items but also a small number of student-produced response questions that offer no answer choices. Four areas of mathematics content are covered: number and operations; algebra and functions; geometry and measurement; and data analysis, statistics and probability. The new Writing section (first administered in the US in 2005) includes multiple-choice items addressing the mechanical aspects of writing (e.g. recognising errors in sentence structure and grammar) and a 25 minute essay on an assigned topic.
In the English trial, no changes were made to any of the questions but one section was removed (a section of new items which do not contribute to the US students’ scores) giving a total of nine sections and an overall test time of three hours and twenty minutes.
3.2 The Sample
In total, SAT® test materials were sent to 43,429 students at 660 institutions that had agreed to assist at the beginning of November 2005. At the end of January 2006, 294 institutions had returned completed SAT® tests for a total of 9207 students. The remaining 366 schools/colleges returned unused materials or had failed to return their test materials.
The completed answer sheets were shipped to the US and, with the exception of the essay section, were machine-scored by ETS. Each essay was scanned and then independently scored by two “readers” on-screen. If the two readers’ scores differed by more than one point, the essay was sent to a third chief reader for resolution. Scaled scores for each student and other item-level data were returned to NFER in March 2006.
Following the receipt of A level results from the DfES in December 2006, students in the SAT® sample were matched to their attainment data. Students were excluded from the analysis if they had withdrawn from the study or they did not have, or could

6
not be matched to, the two main attainment variables of interest, GCSE and A level data. The number of students with the required data was 8041 and this sample formed the basis for the analyses reported in section 5.
Student survey – spring 2006
In March 2006 the 9022 students who had taken the SAT® and had agreed to participate in the study were sent a 16-page questionnaire, with pre-printed names, via their school or college. The questionnaire asked them to provide some background details about their home and family circumstances and asked about their experiences of school or college in Years 12 and 13, their immediate plans after A levels and their views of higher education. A total of 6883 completed questionnaires had been received. The vast majority of the questionnaires were returned by schools and colleges. Of these, some had to be excluded from the analysis: duplicated questionnaires (where students had filled in copies at home and at school/college), a small number of spoilt questionnaires and four that were removed from the dataset in response to students’ requests to withdraw from the study. The resultant sample was 6825 students.
Student survey – autumn 2006
At the beginning of September 2006 a second questionnaire was sent to 8814 students (excluding withdrawals) who had supplied a home address for future contact. To thank students for their continued participation in the research, students were offered the opportunity to enter a prize draw to win one of five £1000 cash prizes. At the end of the autumn survey a total of 3352 responses had been received - a response rate of 38 per cent. For the analysis, students with missing attainment data, who were not included in the main sample, were excluded, resulting in an autumn survey sample of 3177 respondents.
The Achieved Sample
The number of students at each phase of the project to date is shown in Figure 3.1. Of the 9207 students who had completed an SAT® test, 9022 had signed a form agreeing for their data to be used in the study; representing 8600 students in schools and 422 students in FE colleges. In January 2007 the data for these students, excluding a small number that withdrew from the study, was matched with the 2005/06 National Pupil Database supplied by the DfES. The dataset included A level data, GCSE prior attainment data and, for any student educated within the maintained sector, Pupil Level Annual School Census (PLASC) data. The main reasons that data was missing for some students were either that they had taken the SAT® in Y12 and had therefore not completed their A level courses or that despite several attempts to match to the DfES dataset their earlier examination data could not be found. The number of students with valid data on all three main variables (SAT® scores, A levels and GCSEs) was 8041, hereafter referred to as the main sample. The ‘national population’ was derived from the same National Pupil Dataset by extracting those students taking

7
two or more GCE A levels, i.e. the population that would be likely to be affected should a test such as the SAT® ever be introduced.
Figure 3.1 Components of the main sample
Independent schools and grammar schools were over-represented in the sample whilst FE colleges were substantially under-represented. In an earlier analysis of participation in the SAT® trial at the institution level (i.e. comparing numbers of participating colleges rather than individuals) the under-representation of FE colleges was less pronounced. This suggests that there was a greater loss of individuals at FE
8041
main analysis sample
9109 chose not to participate
18316 students
offered opportunity to participate by schools / colleges
9207 took SAT®
9022 SAT® sample
11 withdrew
185 did not sign
agreement form
970 missing KS4 or
KS5 data
43429 SAT® tests
sent to schools / colleges

8
colleges (i.e. relatively more students at FE colleges chose not to participate when offered the opportunity to do so).
Background characteristics of the main sample are shown in Table 3.1 These details were obtained by combining information from the PLASC data for students from maintained schools with information supplied by individual FE colleges and independent schools.
Table 3.1: Background characteristics of the main sample
Main sample National population*
N Valid
per cent N Valid
per cent
Sex Male 3692 45.9 98625 45.6
Female 4349 54.1 117718 54.4
Ethnicity Asian or Asian British 670 9.1 7799 6.9
Black or Black British 117 1.6 2243 2.0
Chinese 116 1.6 996 0.9
Mixed 145 2.0 1392 1.2
White 6212 84.4 93732 83.2
Other 104 1.4 6499 5.8
SEN No provision 7437 97.3 114818 97.9
School Action (A) 137 1.8 1632 1.4
School Action Plus (P) 35 0.5 474 0.4
Statement of SEN (S) 32 0.4 384 0.3
No 5953 96.1 114058 97.2 FSM eligibility
Yes 243 3.9 3250 2.8
Total 8041 100 216343 100
* candidates entered for 2+ GCE A levels in 2005/06 (source: DfES) Valid percentages exclude missing data. Due to rounding, percentages may not sum to 100.
As can be seen from Table 3.1, there were more female students in the main sample than male students (54 per cent and 46 per cent respectively), in line with the national population of A level entrants.
Although smaller in size, the survey samples appear to be reasonably similar to the main sample in terms of their background characteristics. The percentage of male respondents was lower in the autumn survey than in the spring survey. The autumn

9
questionnaires were sent to individual home addresses whereas the spring survey was administered via schools and colleges. Also an incentive was offered to students in the autumn survey which may have impacted differently on male and female students.
There were also fewer Asian or Asian British respondents in the autumn survey compared to the percentage of Asian students in the main sample and the spring survey. The percentage of respondents from comprehensive schools in both survey samples was slightly less than the percentage in the sample as a whole whereas the percentage of respondents from FE colleges was slightly higher in the surveys. Although similar to the full sample in terms of their background characteristics, a comparison of respondents and non-respondents to the spring and autumn survey showed that the mean total A level points of respondents (872 in the spring survey and 930 in the autumn) were significantly higher than the mean points score of non-respondents (770 and 795 respectively). This is perhaps to be expected given that the subject of the research is more likely to be salient for high achieving students who are either in, or intending to enter, higher education.
Table 3.2 shows the distribution of socio-economic classes of the students parents.
Table 3.2: Parental occupation by socio-economic classification
Number Valid per cent
National per cent*
1.1 Large employers and higher managerial occupations 767 12.8
1.2 Higher professional occupations 1332 22.3
26.2
2 Lower managerial and professional occupations 1718 28.7 32.6
3 Intermediate occupations 576 9.6 14.3 4 Small employers and own account
workers 616 10.3 7.0
5 Lower supervisory and technical occupations 342 5.7 5.0
6 Semi-routine occupations 376 6.3 10.3
7 Routine occupations 223 3.7 4.6 8 Unemployed (housewives, students,
retired, etc) 31 0.5 0.0
Missing / uncodeable occupations Total
5981 844
6825
100.0 100.0
Due to rounding, percentages may not sum to 100.
* entrants to UK HEIs 2004/05 (DfES analysis of HESA student record 2004/05)

10
Over half of the spring survey sample had at least one parent working in professional or managerial occupations. Coverage by parental occupation is reasonably well matched to the national profile of HE entrants, although the HE population does not reflect that of society as a whole.

11
4 Relationships between SAT® scores and attainment In this section the analyses of the attainment and aptitude data are described and the relationships between the various measures are explored. The main study variables for each participant were their total A level score, their total GCSE score and their SAT® scores for Critical Reading, Mathematics and Writing. A description of each of these variables is given at the beginning of the relevant section below.
4.1 Descriptive statistics
4.1.1 Attainment data
In the analyses that follow, the attainment data for students in the sample was taken from a dataset supplied to the NFER by the DfES. The A level score used in the analyses was the total QCA point score for all Level 3 qualifications approved as A level equivalences. The points awarded under this system differ from the UCAS point scores: for example a GCE A level grade A is equivalent to 270 points (compared to 120 points using the UCAS tariff). For prior attainment the GSCE variables used in the analyses were the total KS4 point score and the average KS4 point score. Again the GCSE point scores are based on a new system (developed by QCA) in which a GCSE grade G is equivalent to 16 points and an A* grade is equal to 58 points. Further details of the scoring systems for both KS4 and KS5 qualifications and information about the discounting process (used to avoid double counting of qualifications such as GCE A and AS levels) can be found on the DfES website (DfES, 2006).
Table 4.1 shows the sample and national means for the key attainment measures. The main sample spans a wide range of ability but with a score distribution slightly skewed towards the upper range compared to the national population of A level entrants taking 2 or more GCE A levels. The mean A level points score of the main sample was 849. The mean A level total score for the national sample was slightly lower at 808.
Similarly the prior attainment of the main sample was slightly higher (an average 47 GCSE points) than that of the national population (46 points). The differences in means of the sample and the population are statistically significant. However, although the distribution of the main sample is skewed towards the high end (probably because of the number of students from grammar and independent schools) it broadly covers the same range as the population. The sample therefore contains sufficient cases from all areas of the population to enable reasonable conclusions to be drawn.

12
Table 4.1: Mean attainment scores – main sample
Main sample National population*
Mean s.d. Mean s.d.
Total A level (or L3 equivalent) point score 848.6 260.4 808.4 235.8
Total GCSE point score 489.9 80.1 469.0 107.6
Average GCSE point score 47.4 6.0 46.4 5.5
n = 8041 max n = 216343
Values significantly different at the 5 per cent level are shown bold and in italics.
* 2005/06 GCE A level entrants taking 2+ A levels from the dataset supplied by DfES
4.1.2 SAT® data
The raw SAT® scores of students who participated in the English trial were converted to scaled scores using the scoring metric of the US SAT®. SAT® scores for the main three components (Critical Reading, Mathematics and Writing) are each reported on a scale from 200 to 800. The multiple choice writing section counts for approximately 70 per cent and the essay counts for approximately 30 per cent of the total writing raw score, which is used to calculate the 200 to 800 score. Additional sub-scores are reported for the essay (ranging from 2 to 12) and for multiple-choice writing questions (on a 20 to 80 scale). Each essay is independently scored 1 to 6 by two “readers”. These readers’ scores are combined to produce the 2 to 12 scale. (If the two readers’ scores differ by more than one point, the essay is sent to a chief reader for resolution. Essays that are not written on the essay assignment, or which are considered illegible after several attempts at reading, receive a score of 0.) The US mean or average scaled score for Critical Reading, Mathematics, and Writing is usually about 500.
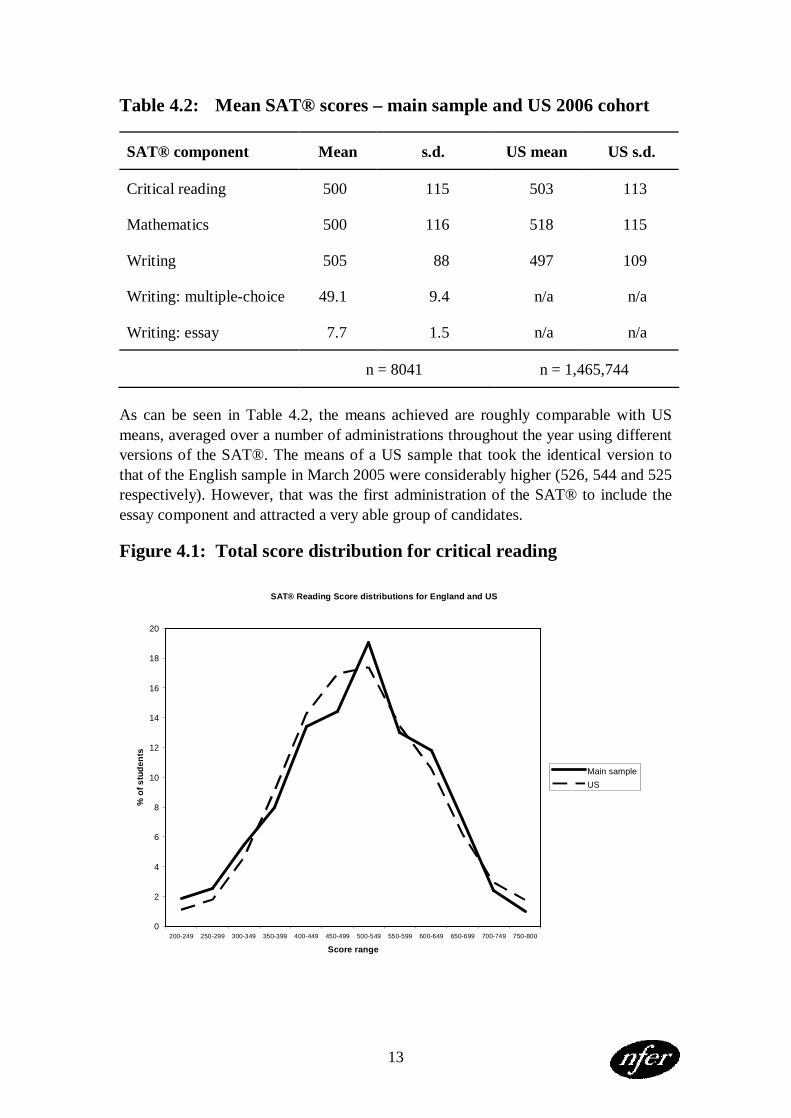
Table 4.2 shows the means obtained on each of the main components of the SAT® and Figures 4.1 to 4.3 show the total score distributions for the Critical Reading, Mathematics and Writing components. For comparison purposes, the means and score distributions for over 1.4 million students in the US 2006 College-bound Seniors cohort are given (College Board, 2006).
13
Table 4.2: Mean SAT® scores – main sample and US 2006 cohort
SAT® component Mean s.d. US mean US s.d.
Critical reading 500 115 503 113
Mathematics 500 116 518 115
Writing 505 88 497 109
Writing: multiple-choice 49.1 9.4 n/a n/a
Writing: essay 7.7 1.5 n/a n/a
n = 8041 n = 1,465,744
As can be seen in Table 4.2, the means achieved are roughly comparable with US means, averaged over a number of administrations throughout the year using different versions of the SAT®. The means of a US sample that took the identical version to that of the English sample in March 2005 were considerably higher (526, 544 and 525 respectively). However, that was the first administration of the SAT® to include the essay component and attracted a very able group of candidates.
Figure 4.1: Total score distribution for critical reading
SAT® Reading Score distributions for England and US
0
2
4
6
8
10
12
14
16
18
20
200-249 250-299 300-349 350-399 400-449 450-499 500-549 550-599 600-649 650-699 700-749 750-800
Score range
% o
f stu
dent
s
Main sampleUS

14
Figure 4.2: Total score distribution for mathematics
SAT® Mathematics Score distributions for England and US
0
2
4
6
8
10
12
14
16
18
20
200-249 250-299 300-349 350-399 400-449 450-499 500-549 550-599 600-649 650-699 700-749 750-800
Score range
% o
f stu
dent
s
Main sampleUS
Figure 4.3: Total score distribution for writing
SAT® Writing Score distributions for England and US
0
5
10
15
20
25
30
200-249 250-299 300-349 350-399 400-449 450-499 500-549 550-599 600-649 650-699 700-749 750-800
Score range
% o
f stu
dent
s
Main sampleUS
Where data was available these analyses included comparisons with a sample of approximately 290,000 US students who took exactly the same version of the SAT® to see if there were any differences in performance that might indicate that the SAT®

15
test was unsuitable for the English sample. Overall these results indicated that the individual SAT® items functioned in a similar way for the English and US samples.
Tables 4.3 to 4.5 give breakdowns of the main study variables – SAT® scores, A level scores and GCSE scores - by background variables. In most cases the differences between groups are statistically significant; which is to be expected given the size of the sample.
Table 4.3: Main study variables by gender
Male Female Total
Number of cases 3692 4349 8041
% of cases 46% 54% 100%
Mean A level total score 825.2 868.5 848.6
Mean GCSE total score 485.9 493.3 489.9
Mean SAT® score 505.3 498.4 501.55
SAT® reading 497.6 501.7 499.8
SAT® mathematics 523.3 480.3 500.0
SAT® writing 494.9 513.3 504.8
Writing: multiple-choice 48.5 49.6 49.1
Writing: essay 7.4 7.9 7.7
Values significantly different at the 5 per cent level are shown bold and in italics.
It is interesting to note that females out-perform males, on average, at GCSE and A level and in the SAT® writing test, but the reverse is true for SAT® mathematics and in the SAT® test as a whole. It may be that this is due to the different mode of assessment, or else to the different subject balance.
The differences between male and female students on the various SAT® components are similar to the most recent results for students in the USA, where male students generally outperform female students in mathematics but do less well in writing (College Board, 2006).

16
Table 4.4: Main study variables by free school meal eligibility
Not eligible Eligible Eligibility unknown
Number of cases 5953 243 1845
% of cases 74% 3% 23%
Mean A level total score 828.0 665.5 939.3
Mean GCSE total score 490.9 454.8 491.2
Mean SAT® score 495.0 439.4 530.8
SAT® reading 492.7 444.3 530.0
SAT® mathematics 494.4 424.0 528.4
SAT® writing 498.0 450.0 534.1
Writing: multiple-choice 48.4 43.6 52.0
Writing: essay 7.6 7.1 8.0
Values significantly different at the 5 per cent level are shown bold and in italics.
Clearly students known to be eligible for free school meals under-perform on all outcomes, on average compared with the other categories. Most of the students in the ‘eligibility unknown’ category were in independent schools. Therefore this classification will be confounded with the institution type classification. In other words, the salient characteristic of such students in respect of attainment is probably that they were in independent schools and not that their eligibility for free school meals was unknown.

17
Table 4.5: Main study variables by ethnicity
Asian Black Chinese Mixed White Other Not
Known
Number of cases 670 117 116 145 6212 104 677
% of cases 8.3% 1.5% 1.4% 1.8% 77.3% 1.3% 8.4%
Mean A level total score 766.7 690.1 956.0 836.9 851.5 793.9 922.9
Mean GCSE total score 477.3 456.9 477.6 487.2 491.8 505.1 491.1
Mean SAT® score 454.9 443.8 484.8 493.8 506.4 485.3 520.4
SAT® reading 436.6 436.8 445.1 493.2 507.5 478.1 516.6
SAT® mathematics 474.5 438.3 566.6 489.4 500.6 499.6 521.5
SAT® writing 453.6 456.2 442.8 498.9 511.0 478.3 523.1
Writing: multiple-choice 43.4 44.3 43.0 47.9 49.8 46.2 50.8
Writing: essay 7.4 7.2 6.9 7.9 7.7 7.5 7.9
Rows which are shown bold and in italics imply that for this outcome some categories are significantly different from others at the 5 per cent level.
Clearly there are different patterns of performance for different ethnic groups. The most striking example is the Chinese group, who, on average, are the highest group in terms of A level and SAT® mathematics scores, but perform more poorly in SAT® reading and are the lowest group in SAT® writing. Asian and Black students achieved very similar mean SAT® scores whereas there was a much larger difference in A level scores between the two groups.

18
4.2 Exploring the relationships between the main study variables
Table 4.6 below displays the correlations1 between the GCSE and A level scores and between GCSE and A level scores and each of the SAT® scores.
Table 4.6: Correlations between GCSE and A level scores and SAT®
A level total score
GCSE total score
Average GCSE score
Mean SAT® score 0.64 0.54 0.70
SAT® reading 0.55 0.46 0.59
SAT® mathematics 0.54 0.48 0.60
SAT® writing 0.57 0.48 0.64
Writing: multiple-choice 0.55 0.47 0.62
Writing: essay 0.32 0.25 0.34
A level total score 0.58 0.76
GCSE total score 0.70
Correlations significantly different from zero at the 5 per cent level are shown bold and in italics.
In the above table it is clear that the correlation between total SAT® score and A level total score is somewhat higher than with GCSE total score, but that the highest correlation with total SAT® is average GCSE score. Correlations with the different components of the SAT® are similar, except for the essay element which has much lower correlations with GCSE and A level outcomes (probably at least partly because of the relatively restricted range of the essay score).
1 Correlation: a measure of association between two measurements, e.g. between size of school and the mean number of GCSE passes obtained by each pupil. A positive correlation would occur if the number of passes increased with the size of the school. If the number of passes decreased with size of school there would be a negative correlation. Correlations range from -1 to +1 (perfect negative to perfect positive correlations); values close to zero indicate no linear association between the two measures.

19
The correlation of total A level points with average GSCE score is higher than with the total GCSE score. It is likely that this is because the number of GCSEs entered can vary widely and does not always reflect the ability of the student whereas at A level there is far less variation in the number of A levels attempted.
The higher correlation between SAT® and average GCSE score than between SAT® and A levels is in accordance with previous findings. In the pilot SAT® study carried out in 2000 in three groups of low-achieving, high-achieving and independent schools, (McDonald et al., 2001a), the correlation between the SAT® and mean GCSE grade was higher in all types of schools than between the SAT® and mean A level grade. At that time the correlations between mean GCSE grade and total SAT® score for high-achieving and low-achieving schools were 0.62 and 0.58 respectively and the correlations between SAT® score and mean A level grade were 0.45 and 0.50.
The SAT® as a whole has undergone some change since 2000, particularly the introduction of the writing components, and therefore one would expect a higher correlation between total SAT® scores and A levels than previously. Also there have been considerable changes to the A level system since the pilot; a greater number of subjects are now studied at A level and the structure of such courses is modular.
The high correlations between SAT® scores and attainment at GCSE and A levels are not unexpected given that each of these is measuring overall educational ability, albeit measuring different aspects and in different ways. Research generally shows similarly high correlations between different measures of educational ability. For example, Thomas & Mortimore (1996) found correlations of 0.72, 0.67 and 0.74 between Cognitive Abilities Test (CAT) scores in Year 7 and GCSE total points score, GCSE English grades and GCSE mathematics grades respectively. Correlations between measures of educational ability are also generally higher when such measures are administered in close proximity to one another, as is the case with the SAT® and the A level examinations.
The relationship between A levels and SAT® scores is complicated in that each of these measures is associated with prior attainment at GCSE. Controlling for average attainment at GCSE, the partial correlation between SAT® and A levels was 0.23. This suggests that, although SAT® and A levels are highly correlated, the underlying constructs that are being measured are somewhat different. This may indicate a potential for the SAT® to add to the prediction of HE outcomes from A levels, although the increment is likely to be relatively small. Whether this is indeed the case will not be known until such outcomes are available for students in the sample.

20
5 Relationships between SAT® scores and subject attainment
5.1 Correlational Analysis In previous published work, there had been insufficient time to carry out an analysis looking at the correlations between SAT® scores and the attainment of students grouped by the subjects studied at A level. This paper will examine in more depth the extent to which A levels, in particular subjects, and the various components of the SAT® are measuring similar constructs.
With the overall large sample size, the numbers of students taking specific subject A levels also remained substantial. This meant that it was possible to explore the relationships of the individual A level subject grades with the three SAT® measures. Any such analysis is actually collating data from several A level providers and rests on the assumption that the grades awarded are comparable and equated in terms of level. This assumption underpins the universities’ use of grades and so is accepted here.
An initial examination of the relationships was undertaken using a simple correlational approach. The result of this, for the most popular A levels (ie those taken by large numbers of students) is shown in Table 5.1. Some aggregation of subjects is incorporated; in particular the three foreign language A levels of French, Spanish and German have been combined. The table shows the sample size and then the correlation of the subject grade with the three SAT® scores of Mathematics, Critical reading and Writing. For each subject the data is shown for the total group and then for males and females separately. All the correlations shown are statistically significant, and vary from a reasonable to a strong association.
Table 5.1 shows that there is not one general pattern of relationships between A levels and the SAT® scores. For several subjects, the Mathematics score of the SAT® has the strongest relationship with the A level outcome. These include Physics and Mathematics A levels especially and Biology and Chemistry to a lesser extent. In contrast, for other subjects, the Writing element of SAT® has the strongest relationship. This includes the A levels of English Literature, English Language and History. For these subjects Critical Reading is also strongly related to the A level outcomes.
For Geography, there is no real differentiation and all three SAT® scores are similarly related to A level outcome. The same is true of Psychology, although this is the A level subject which has the weakest relationship between SAT® scores and A level grades.

21
Table 5.1: Correlations between SAT® Scores and A Level Grades for Specific Subjects
SAT® Scores
A Level subjects Cases Mathematics Critical
Reading Writing
All 1899 .45 .38 .38
Male 742 .45 .38 .35 Biology
Female 1157 .47 .37 .39
All 1594 .41 .33 .36
Male 786 .46 .34 .38 Chemistry
Female 808 .42 .30 .31
All 1191 .52 .39 .41
Male 864 .52 .38 .39 Physics
Female 327 .54 .42 .42
All 2202 .45 .28 .31
Male 1295 .48 .28 .29 Mathematics
Female 907 .45 .28 .33
All 1184 .36 .38 .44
Male 613 .38 .38 .43 Geography
Female 571 .41 .41 .43
All 1526 .40 .47 .53
Male 719 .44 .45 .49 History
Female 807 .37 .48 .55
All 1290 .29 .29 .35
Male 359 .33 .24 .31 Psychology
Female 931 .31 .33 .37
All 915 .33 .47 .47
Male 306 .32 .41 .38 English. Language Female 609 .36 .51 .52
All 1730 .46 .55 .59
Male 536 .45 .52 .55 English Literature Female 1194 .48 .57 .61
All 1109 .37 .40 .43
Male 281 .39 .29 .37 French, Spanish, German Female 828 .38 .44 .45

22
The pattern of correlations shows little difference between those for male and female students in each subject. There is one exception to this, which is the cluster of foreign language A levels: French, Spanish and German. For these, the correlations between the SAT® scores of Critical Reading and Writing and A level outcome are reasonably substantial for female students. However, for males, they are much lower, particularly Critical Reading. This difference will be explored further in the next section.
In general, this correlational investigation shows that the SAT® scores have different relationships to A level outcomes for different subjects. The implication of this for the SAT® as a selection instrument alongside A levels is that it may add greater or lesser amounts of differentiated information for university entrance, depending both on the subjects taken at A level and the degree subject applied for. A full investigation of this must of course wait until the degree outcomes are known.
5.2 Gender Differences in Subject Relationships
Following the correlational analysis, further examination was made of the relationships between the SAT® scores and individual A level outcomes for each subject, for males and females. This is illustrated using box and whisker plots, which show the median score, the semi-interquartile range, the full range of scores and the outliers for each grade obtained in a particular subject A level.
Figure 5.1 illustrates the relationship for a fairly typical level of correlation. This shows the scores achieved in SAT® Critical Reading for the grades of the Geography A level. This had a correlation of .38 for males and .41 for females. The figure shows that for both genders there is a reasonable relationship between the Critical Reading scores and A level grade. The Critical Reading scores for males and females for each grade are also broadly similar. The levels of scores are such that the median scores of those obtaining an A or B grade are above a SAT® score of 500, the average for this sample.
Figure 5.2 shows the same relationships for SAT® Mathematics and the Physics A level. This was the pairing with the highest correlations, .52 for males and .54 for females. This is shown by the steep gradient across the grades. It also illustrates the higher overall SAT® scores of those taking the Physics A level. The median scores of all grades from A to E are above 500, the overall average. The medians of those gaining A or B grades are above the SAT® Mathematics score of 600, considerably higher than for Geography. A further feature of this figure is the gender difference. Overall, there was a difference between males and females in the SAT® Mathematics score with males scoring higher. This is generally reflected across each of the grades of the physics A level. Effectively this means that although the relationship between the SAT® Mathematics and Physics A level has the same strength for males and females, males who achieve an A grade in the Physics A level have higher scores on the SAT®.

23
Figure 5.1: Relationship of SAT® Critical Reading and A level Geography
Figure 5.2: Relationship of SAT® Mathematics and A level Physics
A B C D E U A Level Grade
800
700
600
500
400
300
200
SAT®
Mat
hem
atic
s
Female Male Sex
A B C D E U A Level grade
800
700
600
500
400
300
200
SAT®
Crit
ical
Rea
ding
Female Male Sex

24
This same situation applied for all the A level subjects studied in relation to their SAT® Mathematics scores. It may be that the reasons for this lie in the nature of the SAT® assessment, since multiple choice tests tend to favour males, compared to essay type examinations, which make up most A levels. (See for example, De Mars, 2000)
Figure 5.3 illustrates the same data for the Mathematics A level. Again this shows the high SAT® Mathematics scores of those entering Mathematics A level, the strength of the relationship between the two measures (correlation is about .45) and gender difference at each grade, with males having higher SAT® scores when obtaining the same grade.
Figure 5.3: Relationship of SAT® Mathematics and A level Mathematics
A B C D E U A Level grade
800
700
600
500
400
300
200
SAT®
Mat
hem
atic
s
Female Male Sex

25
This effect is only the case for all A level subjects, for the SAT® Mathematics. Figure 5.4 shows the relationship of the SAT® Writing with Mathematics A level. It illustrates the reverse gender effect: within each A level grade the females have higher means than the males. This is within a context of a much less strong relationship between the SAT® score and the A level outcome. There is little differentiation across the grades, reflecting the lower correlations of around .30. This is among the weakest relationships of any subject and SAT® combination.
Figure 5.4: Relationship of SAT® Writing and A level Mathematics
A B C D E U A Level grade
800
700
600
500
400
300
200
SAT®
Writ
ing
Female Male Sex

26
In contrast, the relationship between SAT® Writing and A level English Literature is among the strongest found with correlations for males of .55 and females of .61. This is shown in Figure 5.5. This also shows that there is little gender effect in this relationship, with the mean SAT® writing score being the same for male and female students within each A level grade.
Figure 5.5: Relationship of SAT® Writing and A level English Literature
A B C D E U A Level grade
800
700
600
500
400
300
200
SAT®
Writ
ing
Female Male Sex

27
The final figure (Figure 5.6) illustrates the relationship between SAT® Critical Reading and the foreign language A levels, French, Spanish and German. As discussed above there is a different strength of relationship for the male and female students with a relatively strong correlation of .44 for females and a weaker .29 for males. This results in the interactions shown in the figure with a steeper gradient for females and less steep for the males. The effect of this is to gradually increase the gender differences so that although this is small for the A grade, males have higher SAT® Critical Reading scores than females at the lower A level grades.
Figure 5.6: Relationship of SAT® Critical Reading and A level French, Spanish and German
A B C D E U A Level grade
800
700
600
500
400
300
200
SAT®
Crit
ical
Rea
ding
Female Male Sex

28
These examples reveal some general findings concerning the relationships between SAT® scores.
First, the analysis has shown that the relationships of the SAT® components to A level subjects are not all the same. For some subjects, predominately science based, SAT® mathematics is more strongly related to A level grades; for others such as History and English language, Critical Reading and Writing are most closely related. There are a small number of subjects, such as Psychology where more of the SAT® scores are particularly strongly related to A level performance.
This implies that the utility of the SAT may differ as a predicter of degree outcomes depending on both the subjects taken at A level and the degree subjects involved. These relationships will need individual exploration when the degree outcome data is available.
A second finding is that the mean SAT® scores associated with particular grades of A levels can be at different levels. For example, the mean SAT® score of Mathematics of those obtaining an A or B grade in Physics is over 600, whereas for Geography or Psychology it is around 500. This implies that threshold set for the SAT® in relation to acceptance for degree courses (if the SAT® becomes used in this way) will have to vary according to the degree subject. This is not unexpected but will add complexity. Again though, this will need much more exploration when the degree information becomes available, since the level relationship of the A level data and the SAT® will determine if the extra data is useful.
Finally, the analysis has revealed that there are sex differences in the relationships between the SAT® scores and A level grades, particularly for SAT® Mathematics. The general gender difference in scores in this test continues with all of the A levels explored and means that at any grade, the mean score for males is greater than for females. This would mean that if a purely statistical approach to prediction were to be taken, different equations would for males and females have most utility. However, this is not legally or socially acceptable, and any eventual use of the SAT® scores would need to be an average equation, which would lose some predictive power.
A next stage of the analysis will be to examine the relationship of the combination of the three SAT® scores with particular subjects, to see if the combination means a higher overall correlation. The greater this overall correlation becomes, the more likely it is that the SAT® would not add to A level scores in terms of predicting degree outcomes, although they may have other advantages, such as greater differentiation and availability before decisions are made. Nevertheless, it remains necessary to collect the degree data before any certainty can be achieved for this and other questions on the utility of the SAT®.

29
6 Future phases of the research As mentioned at various points in this report there are still further analyses to be carried out with the current data, namely:
• further exploration of the relationships between SAT® scores and attainment in particular subjects, or groups of subjects, at GCSE and A level
• more complex modelling of the background data of students in the sample to create more sensitive measures of economic and educational disadvantage (in order to better answer the question as to whether the SAT® can identify students with the potential to benefit from HE whose ability is not adequately reflected in their A levels because of their disadvantaged circumstances).
The results of these further analyses will be presented in a second published report in 2008. This report will also examine the destinations of students in the sample, relating such information (where possible) to previously-collected data on both background and attainment. HESA information on the university destinations of students in the main sample will be provided by HEFCE and some analysis of this will be carried out, to see if there are factors other than A level attainment which seem to impinge on the chances of acceptance into particular kinds of institution. This report will be published in May 2008, provided the destination data is available by January 2008 as scheduled.
The final report in 2010 will follow the collection of degree outcomes from HEFCE. It will attempt to relate these to the SAT® scores and the A-level outcomes, adjusting as far as possible for the loss of those not selected for university places. A multilevel model will be set up to examine whether the initial aptitude test results gave significantly improved predictions of degree outcomes. The analyses will explore the effects of different types of school and university. Separate analyses for some popular subjects might be possible, as well as analyses within universities. (Such analyses will of course be reported in anonymised form.)
Once completed, this research will enable some important conclusions to be made about the use of the SAT® or similar aptitude test in university admissions. Each of the research questions listed in section 2.2 requires a study of the relationships between A levels (and GCSEs) and university degree results, on the one hand, and the SAT® and university degree results, on the other. The success of the SAT® in fulfilling the specified purpose will be demonstrated if it can be shown that the combination of the SAT® and A levels provides a better prediction of degree success than A levels alone. In addressing the question about students in disadvantaged circumstances, such a pattern of correlations will provide validation evidence for the SAT® in identifying those with potential – attested by their eventual degree results – not recognised by A levels. In addressing the question regarding the most able HE candidates, the SAT® will be valid for this purpose if it provides additional discrimination amongst the highest attaining students that overcomes the ceiling effect of A levels.

30
7 References College Board (2006). 2006 College-Bound Seniors: Total Group Profile Report [online]. Available: http://www.collegeboard.com/prod_downloads/about/news_info/cbsenior/yr2006/national-report.pdf [22 March, 2007].
DeMars C.E. (2000) ‘Test Stakes and Item Format Interactions’ , Applied Measurement in Education, 13(1), 55-77
Department for Education and Skills (2004). Fair Admissions to Higher Education: Recommendations for Good Practice [online]. Available: http://www.admissions-review.org.uk/downloads/finalreport.pdf [25 March, 2007].
Department for Education and Skills (2006b). School and College Achievement and Attainment Tables (formerly Performance Tables: Technical Annex) [online]. Available: http://www.dfes.gov.uk/performancetables/pilot16_05/annex.shtml [22 February, 2006].
Bekhradnia, B. and Thompson, J. (2002). Who Does Best at University? [online]. Available: http://www.hefce.ac.uk/learning/whodoes [25 July, 2006].
Higher Education Funding Council for England (2005). Young Participation in Higher Education [online] Available: http://www.hefce.ac.uk/pubs/hefce/2005/05_03/ [22 March, 2007].
Kirkup, C., Schagen, I., Wheater, R., Morrison, J. and Whetton, C. (2007). Use of an Aptitude Test in University Entrance - a Validity Study: Relationships between SAT© Scores, Attainment Measures and Background Variables (DfES Research Report 846). London: DfES
McDonald, A.S., Newton, P.E. and Whetton, C. (2001a). A Pilot of Aptitude Testing for University Entrance. Slough: NFER.
McDonald, A.S., Newton, P.E., Whetton, C. and Benefield, P. (2001b). Aptitude Testing for University Entrance: a Literature Review. Slough: NFER.
Thomas, S. and Mortimore, P. (1996). 'Comparison of value-added models for secondary school effectiveness', Research Papers in Education, 11, 1, 5-33.
WHETTON, C. (2001). ‘Aptitude testing for university entrance.’ Presentation at the International Association for Educational Assessment 27th Annual Conference ‘The Future and Challenges of Educational Assessment in the 21st Century’, Rio de Janeiro, 10

31
Acknowledgements
The NFER project team for this work consisted of:
Chris Whetton Project Director
Catherine Kirkup
Rebecca Wheater Researchers
Stuart Gordon Design
Margaret Parfitt Project Administration Assistant
Anne Milne
Dave Hereward Ed Wallis
Research Data Services
Ian Schagen Jo Morrison
Ben Styles Tilaye Yeshanew
Statistics Research and Analysis Group
The NFER also gratefully acknowledges the advice given by members of the project steering group and the assistance of the College Board and Educational Testing Services for providing and scoring the SAT Reasoning TestTM.
This project is co-funded by the Department for Education and Skills, the Sutton Trust, the National Foundation for Educational Research and the College Board.
Any opinions, findings and conclusions or recommendations expressed in this material are those of the author(s) and do not necessarily reflect the views of the Department for Education and Skills, the Sutton Trust or the College Board.
© NFER 2007