preliminary risk assessment on wellpoint
TRANSCRIPT

PRELIMINARY RISK
ASSESSMENT
LIA FLIGOR, DANIEL MOHR,
BRITTANY SHEPHARD, AND
MATTHEW UHLS
JUNE 16, 2014
TABLE OF CONTENTS
PART I. INDUSTRY ANALYSIS ............................................................................................... 1
BUSINESS STRATEGIES ......................................................................................................... 1
KEY COMPETITORS................................................................................................................ 1
INDUSTRY TRENDS ................................................................................................................ 1
KEY BUSINESS PROCESSES ................................................................................................. 3
FINANCIAL RESOURES AND AVAILABILITY .................................................................. 4
INTERNAL COMPANY CONTROLS ..................................................................................... 4
MAJOR RISKS ........................................................................................................................... 5
IMPLICATIONS OF THE MAJOR RISKS FOR THE CONDUCT OF THE AUDIT ............ 6
PART II. ANALYSIS OF WELLPOINT ................................................................................... 8
COMPANY VISION .................................................................................................................. 8
GENERAL BACKGROUND ..................................................................................................... 8
PRELIMINARY ANALYTICAL REVIEW .............................................................................. 9
HORIZONTAL ANALYSIS ............................................................................................ 9
VERTICAL ANALYSIS ................................................................................................ 12
RATIO ANALYSIS AND INDUSTRY AVERAGE COMPARISON ......................... 13
RISK ASSESSMENT ............................................................................................................... 18
RECOMMENDATION ............................................................................................................ 20
PART III. APPENDICES .......................................................................................................... 21
PART IV. WORKS CITED ....................................................................................................... 27
PART V. WELLPOINT, INC’S 2013 SEC FORM 10-K FILING FINANCIAL
STATEMENTS AND NOTES .................................................................................................. 29
1
INDUSTRY ANALYSIS
BUSINESS STRATEGIES
The most effective way to increase profits in the health insurance industry is to
acquire more of the market share of insured individuals. The more consumers a health
insurance company has, the more profits that may be gained as a result. With the rise of
health care costs, health insurance providers cannot raise their rates for their plans and
thus need to expand their reach around the country. This is precisely why health
insurance companies are focused on acquiring and merging with other health insurance
companies.
KEY COMPETITORS
WellPoint’s main competitor is UnitedHealth Group. According to a ranking from
US News of the top 25 health insurance companies, WellPoint is second to UnitedHealth
Group in market share in the United States. The 25 top health insurance companies on
this list comprise two-thirds of the United States’ market share of insured individuals.
The third, fourth, and fifth largest health insurance companies by market share in the
United States are Kaiser Permanente, Humana Group, and Aetna Group, respectively
(Helibrunn, 2013). The United States health insurance market is very concentrated
because the top health care insurers continue to acquire and merge other smaller health
care insurers to gain more of the market share.
INDUSTRY TRENDS
The health care insurance industry is rapidly entering a new era. While there are
several forces that are causing the industry to change, three major trends have emerged.
The first is the rising measure to control health care costs, the second is the trendy push
for employer sponsored wellness programs, and the third is the implementation of
legislation by the federal government surrounding ubiquitous health coverage.

2
According to The Economist, in the United States, $2.7 trillion, 17% of the
gross domestic product, is spent on health care (The Economist, 2014). Government and
private entities have developed several initiatives to help control the cost of health care.
For example, “Pay-for-Performance” and “Hospital Readmissions Reduction Program”
developed by the Center for Medicare and Medicaid Service are employed to reduce the
amount of claims paid to doctors and hospitals for patients that are treated with excessive
care (Health Information Technology and Quality Improvement, 2014). Additionally,
WellPoint will pilot a program aimed at this same goal of reducing the amount of claims
paid to doctors and hospitals for patients that are treated with excessive care. In its plan,
WellPoint will pay doctors up to $350 per month for “each patient who is on one of the
insurer’s recommended regimens” (Wilde-Matthews, 2014). This program targets doctors
who may use wasteful, ineffective treatments on patients in order to gain from filing
more claims.
Employers are also impacted by the rising cost of health care. Many employers
are attempting to prevent chronic illness in order to thwart rising health benefits costs,
and to ensure they can continue to offer health insurance. One popular method of illness
prevention by employers is an employer-sponsored wellness program. Aspects of an
employer-sponsored wellness program may be to offer reduced cost gym memberships,
offer smoking cessation programs, or sponsor company fitness events. Although such
programs are popular and installed in more employers than in the past, the trend may
soon move from employer-sponsored to employee-funded programs, especially for small
enterprises, because of the implementation of the new federal legislation.

3
The third major trend in the health insurance industry is the implementation of the
Affordable Care Act (ACA). This legislation gives the federal government more control
of the operations of the health insurance industry. The ACA mandates that certain
employers provide health coverage for qualified individuals, that every adult have health
insurance coverage or else be subject to a fee, that insurance companies insure
individuals regardless of prior medical conditions, and provide government subsidies to
certain low-income individuals. On the surface this may seem beneficial for an insurance
company because everyone must buy insurance, however the effects could be alarming
for continued profitability of a health insurance company. Profitability may be hindered
by rising claims, increased risk concentration, and slow premium payment.
KEY BUSINESS PROCESSES
The main business process for the health insurance industry is the securing of
contracts with individuals and/or employers. These contracts hold a policy to insure the
consumer from medical costs that may be too costly to pay without assistance. The
policies are sold and managed by the insurance company, and hospitals, clinics, and other
medical institutions provide the medical service.
Other key business processes for health insurance companies include
underwriting and collection of premiums, investment of premiums, actuarial work, and
the payments of benefits and claims. Identifying, classifying, and assessing risk to
determine the suitable premium is crucial in the process of underwriting and collection of
premiums. The collection of premiums is particularly important to the success of the
insurance company. Once the premiums have been received, they are invested to increase
cash flow. The returns on the investments stabilize and create higher profits. For the
payment of claims, liabilities are estimated using actuarial procedures that use factors

4
such as mortality, interest rate, and expense assumptions. Benefit and claim liabilities
generally are the largest liabilities of an insurance company (Accounting Research
Manger, Operation and Distriubtion Systems).
FINANCIAL RESOURCES AND AVAILABILITY In the health insurance industry, the main source of income is the premium paid
by the consumer. Income from the investment of the premium provides extra cash flow.
However, the contracts the health insurance companies have for the policies they provide
are critical for their financial wellbeing. Health insurance companies make up for the
rising costs of health care by shifting more cost to the consumer. The larger health
insurance companies are able keep up with the rising costs of health care by increasing
health care deductibles and health insurance premiums; and, also by acquiring or merging
with other insurance companies. Additionally, the larger insurers are publicly traded, thus
more income is produced through stocks and other securities (Accounting Research
Manager, Insurance Revenues).
INTERNAL COMPANY CONTROLS
According to the Independent Auditor’s opinion in the 2013 WellPoint SEC 10K
filing, WellPoint has effectively managed internal controls. Additionally, the Audit of
Information Systems General and Application Control at WellPoint as inspected and
reported by the United States Office of Personnel Management reports that, “WellPoint
has establish a series of IT policies and procedures to create an awareness of IT security”
(Office of Personnel Management, 2013). Moreover, the report highlighted that
WellPoint has an effective Control Environment in place by having adequate “human
resources policies related to the security aspects of hiring, training, transferring, and
terminating employees” (Ibid). With respect to control over financial reporting, the Audit

5
Committee of the Board of Directors has established clear policies and authority lines.
According to WellPoint’s Audit Committee Charter, as amended on September 25, 2013,
the committee has explicit responsibility for:
Management and auditors to provide a timely analysis of significant financial reporting
issues and practices, or changes in such practices
Considering any reports or communication submitted to the Committee
Reviewing the adequacy and effectiveness of the Company’s systems of internal
controls, and the effect of regulatory and accounting initiatives, as well as off-balance
sheet structures, on the consolidated financial statements of the Company
Overseeing management’s compliance with the National Associated of Insurance
Commissioner’s Annual Financial Reporting Model Regulation (WellPoint Board of
Directors: Audit Committee).
MAJOR RISKS
There are numerous major risks facing the health insurance industry. Many of the
more identifiable risks surround increased regulation from the state and federal
government. For example, the fee imposed on insurance companies by the ACA is
currently $8 billion, and is expected to grow to $14.3 billion by 2018 (WellPoint, Inc.
2013 Form 10K, p. 20). This may cut into profit margins, and companies will need to
determine how to include that cost into their premiums. The increase in health care
regulation may force the industry to respond quickly to changes in risk, premium rates,
and capital requirements. As mentioned in the INDUSTRY TRENDS section of this
assessment, the rising cost of health care is a major risk for the health insurance industry.
The United States’ current general economic environment is also a major risk for
health insurance companies. Insurance companies collect premiums from individuals and
invest that money, in hopes that the returns on investments will outweigh the costs of
their operations and costs of claims submitted by their consumers. This is why many
insurance companies show large investments on their balance sheet. A collapse in the

6
financial market would drive down the value of an insurance company’s portfolios and
have serious implications for the company’s solvency. Also, an increase in business
failures would be burdensome on the industry, as a significant portion of revenue comes
from employer-sponsored plans.
Information technology is another major risk for the health insurance industry.
The health insurance industry is mature and therefore much of a company’s expansion is
via merging and/or acquiring competitors. In such instances, this often involves the
integration of different computer systems. The process and cost of system integration
would likely be burdensome on operations. On the other hand, the use of multiple
systems in one company would lead to higher audit service costs as a result of an
auditor’s need to perform testing of controls on each system. Ultimately, information
technology results in greater expense to a health insurance company in one way or
another.
IMPLICATIONS OF THE MAJOR RISKS FOR THE CONDUCT OF THE
AUDIT The implications of the major risks for the conduct of the audit are an increased
need for specialists, proper estimations, and staff with specialized training. For instance,
the determination of the industry wide ACA fee and the portion applicable to a company
would likely require the employ of a specialist. In another instance, an increase in
business failures or a market collapse could cause the loss of revenue and require the
cutting of costs. Such occurrences would jeopardize a client’s ability to pay, and
potentially force an audit firm to cut its fees for services performed.
Auditors face risks with the valuation of investments. The necessary attention
spent on the valuation of investments will result in higher costs for the auditing firm. The

7
firm should employ a specialist or their staff specially trained in this area for this. The
necessity of applying state regulations properly for investment and capital requirements
increase risk to an auditor as well. Each state’s regulations are different, if only slightly,
thus the staff would need to take careful notice of the regulations affecting out of state
subsidiaries as well as of the types of investments being valued.
The securities market is extremely sensitive. An auditing firm would need to stay
abreast of new developments, such as upgrades or downgrades to an investment’s credit
worthiness. And also, any major events that may cause a collapse in the market. If a
market collapse was to occur, this could lead to a client’s insolvency or stricter
governmental regulations.
The health insurance industry’s operations have grown in a large part via mergers.
With mergers, there is the risk of the proper appropriation of goodwill and other
intangibles. Goodwill and other intangibles tend to require more attention and estimation
than other accounts. An increase in costs for the audit firm with respect to staff hours and
risk associated with errors in valuation are noted.
When an audit client acquires a new business, there is a new business to audit.
This may mean that the audit firm would have to hire, train, and/or reallocate staff
members and ensure they are competent in their assigned areas and properly supervised
too. Oftentimes with acquisitions, come the comingling of information and accounting
systems. An audit firm would need to evaluate each system to ensure that an appropriate
level of control was being maintained. The evaluation of an additional system would
increase an audit firm’s costs. To only form an understanding of how the new subsidiary
operates would be subpar for the firm, and a burden on the client in the long run.
8
ANALYSIS OF WELLPOINT
COMPANY VISION
To be America’s valued health partner (Wellpoint.com, 2014).
GENERAL BACKGROUND
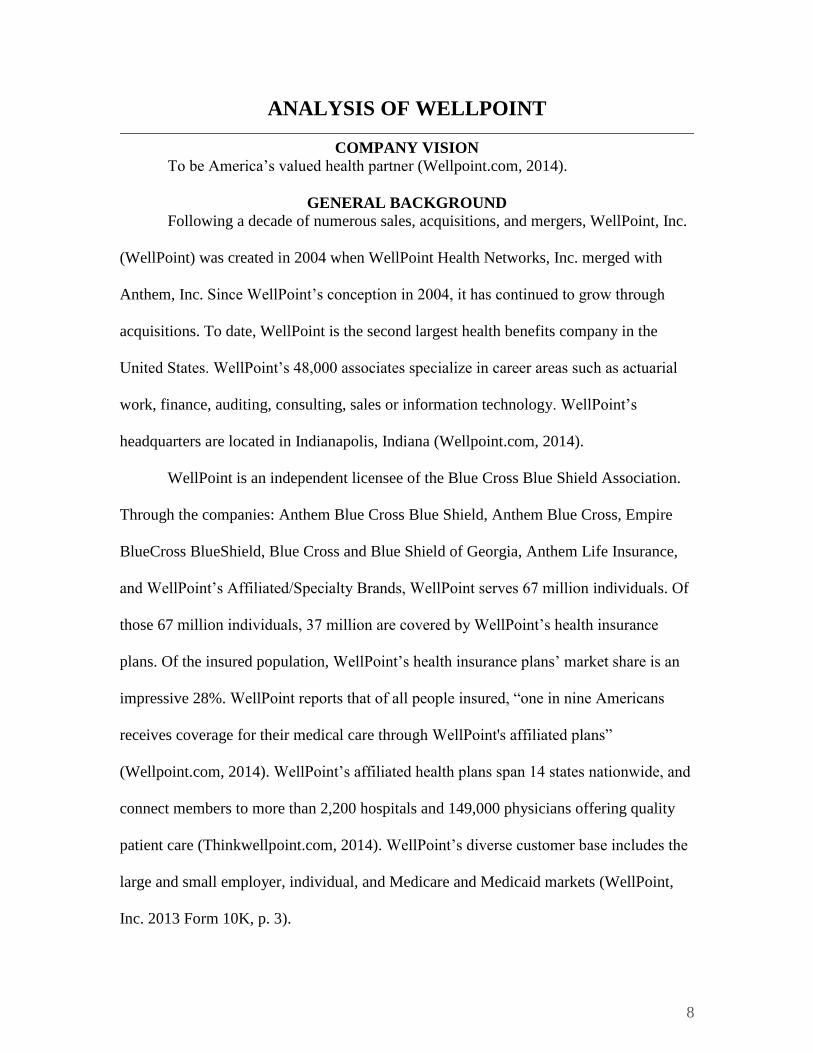
Following a decade of numerous sales, acquisitions, and mergers, WellPoint, Inc.
(WellPoint) was created in 2004 when WellPoint Health Networks, Inc. merged with
Anthem, Inc. Since WellPoint’s conception in 2004, it has continued to grow through
acquisitions. To date, WellPoint is the second largest health benefits company in the
United States. WellPoint’s 48,000 associates specialize in career areas such as actuarial
work, finance, auditing, consulting, sales or information technology. WellPoint’s
headquarters are located in Indianapolis, Indiana (Wellpoint.com, 2014).
WellPoint is an independent licensee of the Blue Cross Blue Shield Association.
Through the companies: Anthem Blue Cross Blue Shield, Anthem Blue Cross, Empire
BlueCross BlueShield, Blue Cross and Blue Shield of Georgia, Anthem Life Insurance,
and WellPoint’s Affiliated/Specialty Brands, WellPoint serves 67 million individuals. Of
those 67 million individuals, 37 million are covered by WellPoint’s health insurance
plans. Of the insured population, WellPoint’s health insurance plans’ market share is an
impressive 28%. WellPoint reports that of all people insured, “one in nine Americans
receives coverage for their medical care through WellPoint's affiliated plans”
(Wellpoint.com, 2014). WellPoint’s affiliated health plans span 14 states nationwide, and
connect members to more than 2,200 hospitals and 149,000 physicians offering quality
patient care (Thinkwellpoint.com, 2014). WellPoint’s diverse customer base includes the
large and small employer, individual, and Medicare and Medicaid markets (WellPoint,
Inc. 2013 Form 10K, p. 3).
9
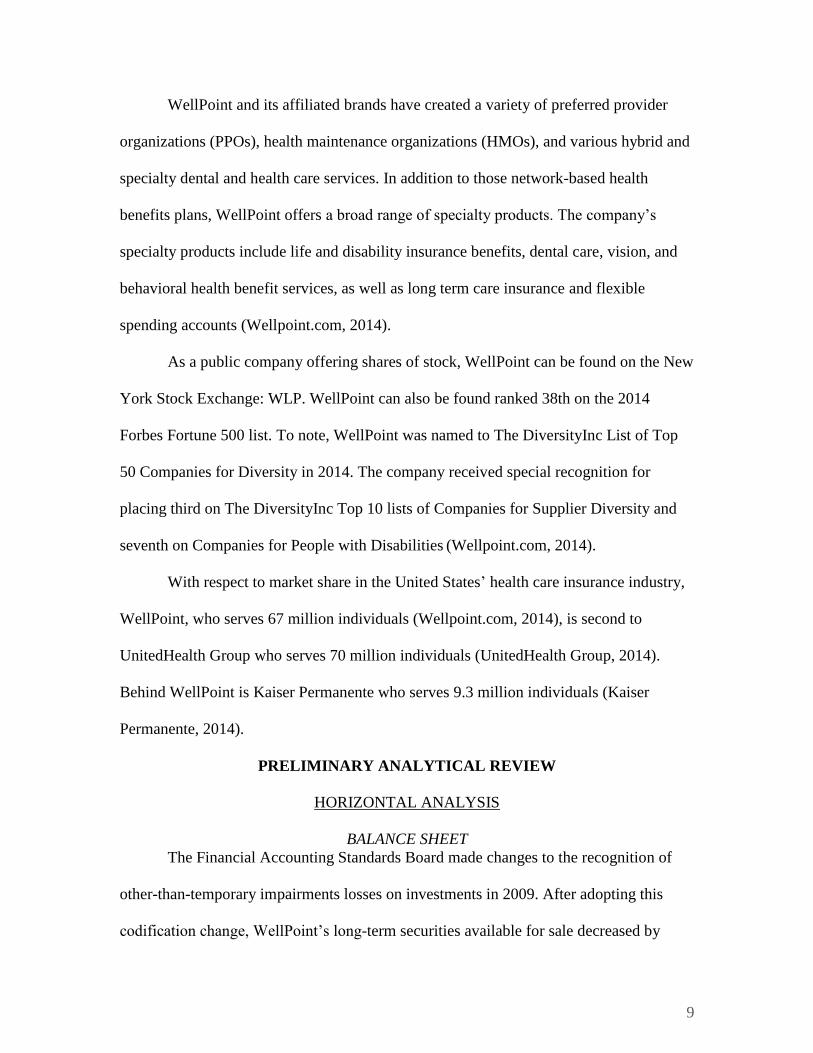
WellPoint and its affiliated brands have created a variety of preferred provider
organizations (PPOs), health maintenance organizations (HMOs), and various hybrid and
specialty dental and health care services. In addition to those network-based health
benefits plans, WellPoint offers a broad range of specialty products. The company’s
specialty products include life and disability insurance benefits, dental care, vision, and
behavioral health benefit services, as well as long term care insurance and flexible
spending accounts (Wellpoint.com, 2014).
As a public company offering shares of stock, WellPoint can be found on the New
York Stock Exchange: WLP. WellPoint can also be found ranked 38th on the 2014
Forbes Fortune 500 list. To note, WellPoint was named to The DiversityInc List of Top
50 Companies for Diversity in 2014. The company received special recognition for
placing third on The DiversityInc Top 10 lists of Companies for Supplier Diversity and
seventh on Companies for People with Disabilities (Wellpoint.com, 2014).
With respect to market share in the United States’ health care insurance industry,
WellPoint, who serves 67 million individuals (Wellpoint.com, 2014), is second to
UnitedHealth Group who serves 70 million individuals (UnitedHealth Group, 2014).
Behind WellPoint is Kaiser Permanente who serves 9.3 million individuals (Kaiser
Permanente, 2014).
PRELIMINARY ANALYTICAL REVIEW
HORIZONTAL ANALYSIS
BALANCE SHEET
The Financial Accounting Standards Board made changes to the recognition of
other-than-temporary impairments losses on investments in 2009. After adopting this
codification change, WellPoint’s long-term securities available for sale decreased by

10
98.0% and current securities increased significantly as well. Securities are only classified
as long-term to “satisfy contractual, regulatory, or other requirements” (WellPoint, Inc.
2009 Form 10K, p. 65). This change increased current assets by 131.4%.
Recent acquisitions and mergers increased goodwill by 21.9% in 2012. The
property and equipment increase of 21.1% is likely due to recent acquisitions and
mergers as well(WellPoint, Inc. 2012 Form 10K, p. 70). This will require further
investigation by WellPoint’s auditors. Experts in the valuation of intangibles and property
will be able to provide insight about the accuracy of the valuation of goodwill and used
equipment.
Medical claims payable were on the decline in 2009 and 2010, increased in 2011
and 2012 and decreased again in 2013. Volatility of claims payable is high because it is
an actuarial estimation until the actual claim’s cost is paid out. The timing of a claim’s
payout has an effect on the volatility of the associated accounts. WellPoint follows the
Actuarial Standards of Practice to determine the estimated liability. The internal controls
of the accounts associated with these liabilities will require further investigation. Most of
the current liabilities are related to investment securities and are estimated at fair value
(WellPoint, Inc. 2012 Form 10K, p. 28). Without further investigation into the
composition of the company’s investment securities we are unable to determine the
accuracy of the estimated fair value of these liabilities.
Additional paid-in capital has continually decreased from 2008 through 2013.
WellPoint has a stock repurchase program. They have repurchased stock every year and
the excess over par is debited from additional paid-in capital (WellPoint, Inc. 2013 Form
10K, p. 129). The auditor will need to understand the internal controls over the

11
stockholders’ equity and develop substantive procedures to determine existence,
completeness, cutoff, valuation and presentation/disclosure.
INCOME STATEMENT
In 2010, revenues for the managed care industry decreased 3.6%, whereas
WellPoint’s revenues decreased 9.6%. The company sold their prescription benefit
management (PBM) business to Express Scripts (WellPoint, Inc. 2010 Form 10K, p. 53).
The gain on the sale, $3.79 million, boosted revenue 6.0% in the prior year. The gain on
the sale exaggerated the decreased in revenue for 2010. The subsequent two years were
more in line with industry averages. The company’s revenue increased 15.5% in 2013
while the industry’s revenues only increased 0.8%. The company’s revenue increase is
mostly premiums revenue from the Medicare and Medicaid accounts acquired when the
company purchased Amerigroup in 2012 (WellPoint, Inc. 2013 Form 10K, p. 46). The
growth rate of the diluted income from continuing operations has decreased 12.7% to
6.1% from 2012 to 2013, whereas revenue growth rate increased from 1.3% to 15.5%
from 2012 to 2013. These two growth rates changing divergently can be indicative of
“sacrificing profits to expand membership” (Seligman, 2013). This could be a long-term
strategy to increase profits through increased market share since profits may have been
maximized in the current customer base. Tracking these two growth rates and monitoring
acquisition activities will help determine if the company begins to overextend itself for
potential profits.
From 2011 through 2013, benefits expenses have increased more or decreased
less than premium revenues. Health care expenditures have been on the rise during the
last three decades and are predicted to increase through 2020 (Hoopes, 2014). Changes in
legislation require health insurance providers to spend at least 80% of the health care

12
premiums received on the actual health benefits (Seligman, 2013). The remaining 20% is
for selling costs and profit. For the health insurance industry as a whole, this has meant
finding ways to reduce selling costs to increase the portion for profit. The benefits for
Medicare and Medicaid are more expensive than the employer provided benefits and
result in smaller margins (Seligman, 2013). Revenues may not increase as fast as
anticipated through the acquisition of Amerigroup. Any auditor for WellPoint should
investigate the completeness and accuracy of benefit and selling expenses.
VERTICAL ANALYSIS
BALANCE SHEET
Additional paid-in capital has decreased in proportion to total assets from 2008
through 2013. This is likely due to the stock repurchase program highlighted in the
horizontal analysis. From 2008 to 2009, fixed maturity securities increased from 3.2% to
30.1%, respectively. This has been determined to be due to the adoption of the Financial
Accounting Standards Board codification updates. This also has been highlighted in the
horizontal analysis. Most vertical changes are related to changes found in the horizontal
(trend) analysis. No further vertical analysis is required.
INCOME STATEMENT
The impairment losses recognized in income in proportion to revenue were
significantly higher in the years 2008 and 2009 compared to years 2010 through 2013.
This is likely due to the 2008-2009 financial crises. The securities market fluctuated
much more violently during the 2008 recession than it has lately. In fact, the major
indices are surpassing their pre-crisis levels. Net profit margin was 7.3% in 2009
compared to WellPoint’s average of 4.7%. Much of this deviation is due to the sale of the
PBM division highlighted in the horizontal analysis.

13
RATIO ANALYSIS AND INDUSTRY AVERAGE COMPARISON
The ratio analysis will allow the user to compare the financial position of
WellPoint to itself and to the health insurance industry. It will show any trends found
within the company and the health insurance industry.
EFFICIENCY RATIOS
WellPoint lags behind the industry significantly in its ability to collect payments
and could be too lax in its collection policies. The company may want to consider
revisiting its controls over payment collections. The low turnover could affect future
liquidity. Also to note, the industry averages a higher payables turnover than does
WellPoint, but WellPoint is paying its creditors at a steady speed. Management may be
holding on to cash longer in order increase working capital, or may have more favorable
credit terms in comparison to the industry average. This would require further
investigation to determine if WellPoint is paying and recognizing its obligations in a
timely manner. While the asset turnover for WellPoint has been fairly steady, WellPoint
17.35
5.39
1.11
18.55
5.97
1.20
16.72
5.64
1.18
26.91
12.63
1.86
-
5.00
10.00
15.00
20.00
25.00
30.00
Receivables Turnover Payables Turnover Asset Turnover
2012 WLP 2013 WLP MRQ WLP MRQ US Industry

14
is underperforming compared to the industry average. This likely does not require further
investigation since WellPoint is not underperforming significantly.
LIQUIDITY RATIOS
With the recent acquisitions and interest in future acquisitions it might be prudent
for WellPoint’s auditors to pay special attention to its level of liquidity. The quick ratio
removes the less liquid assets in this formula to show a more accurate liquidity stance,
but accounts receivable is still included. As mentioned earlier, since the receivables
turnover is lower than the industry average, the internal controls for receivables should be
revisited. The cash ratio is an even more cautious measure of liquidity because it only
includes cash and short-term securities. WellPoint’s high level of liquidity compared to
the industry’s average, likely makes WellPoint attractive to creditors. WellPoint has
ratios high enough to cover 100% of its current liability and has a better ratio than the
industry. However, over 50% of the current assets are investment securities. The
1.83
1.52
1.29
1.82
1.49
1.25
1.72
1.43
1.19
1.37
1.08
0.86
-
0.20
0.40
0.60
0.80
1.00
1.20
1.40
1.60
1.80
2.00
Current Ratio Quick Ratio Cash Ratio
2012 WLP 2013 WLP MRQ WLP MRQ US Industry
15
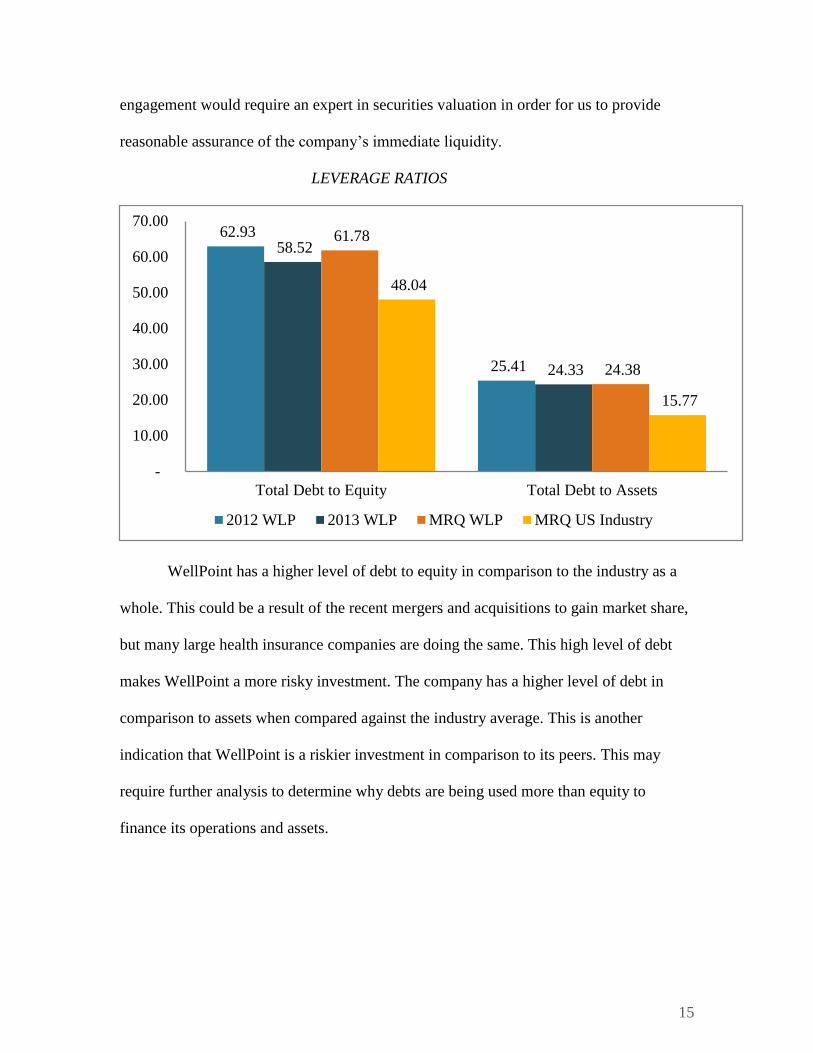
engagement would require an expert in securities valuation in order for us to provide
reasonable assurance of the company’s immediate liquidity.
LEVERAGE RATIOS
WellPoint has a higher level of debt to equity in comparison to the industry as a
whole. This could be a result of the recent mergers and acquisitions to gain market share,
but many large health insurance companies are doing the same. This high level of debt
makes WellPoint a more risky investment. The company has a higher level of debt in
comparison to assets when compared against the industry average. This is another
indication that WellPoint is a riskier investment in comparison to its peers. This may
require further analysis to determine why debts are being used more than equity to
finance its operations and assets.
62.93
25.41
58.52
24.33
61.78
24.38
48.04
15.77
-
10.00
20.00
30.00
40.00
50.00
60.00
70.00
Total Debt to Equity Total Debt to Assets
2012 WLP 2013 WLP MRQ WLP MRQ US Industry
16
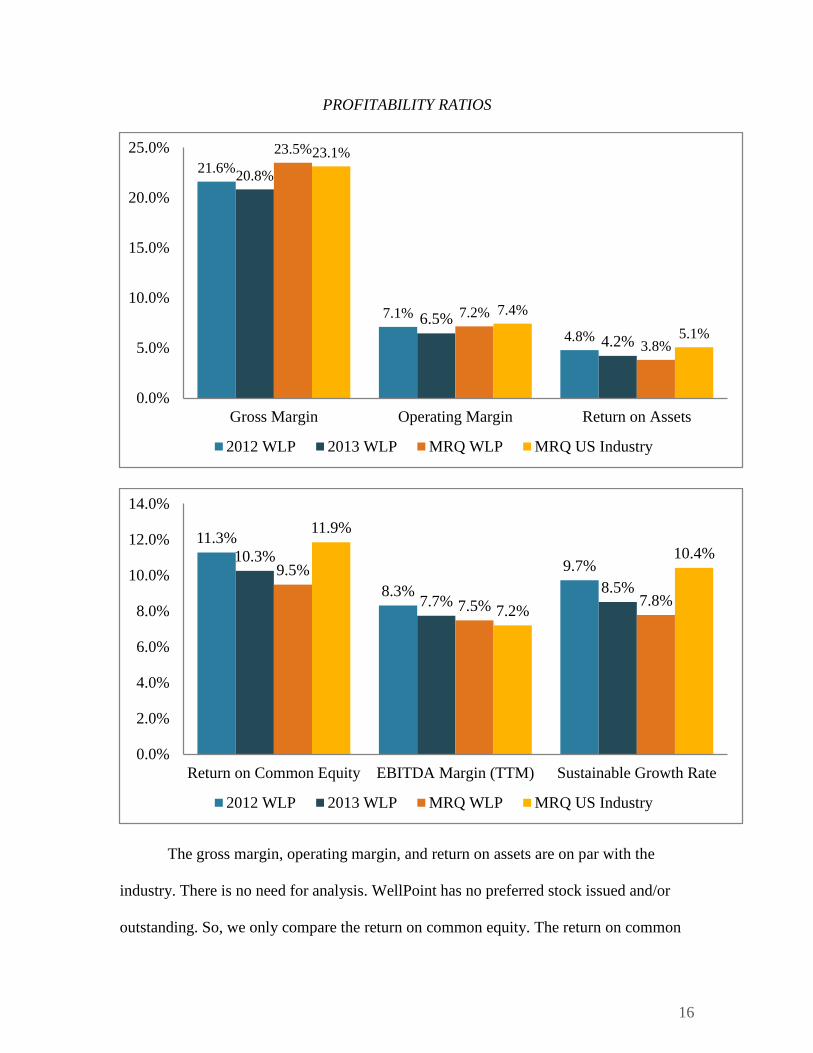
PROFITABILITY RATIOS
The gross margin, operating margin, and return on assets are on par with the
industry. There is no need for analysis. WellPoint has no preferred stock issued and/or
outstanding. So, we only compare the return on common equity. The return on common
21.6%
7.1%
4.8%
20.8%
6.5%
4.2%
23.5%
7.2%
3.8%
23.1%
7.4%
5.1%
0.0%
5.0%
10.0%
15.0%
20.0%
25.0%
Gross Margin Operating Margin Return on Assets
2012 WLP 2013 WLP MRQ WLP MRQ US Industry
11.3%
8.3%
9.7%10.3%
7.7%8.5%
9.5%
7.5% 7.8%
11.9%
7.2%
10.4%
0.0%
2.0%
4.0%
6.0%
8.0%
10.0%
12.0%
14.0%
Return on Common Equity EBITDA Margin (TTM) Sustainable Growth Rate
2012 WLP 2013 WLP MRQ WLP MRQ US Industry
17
equity has decreased over the past two years and in the recent quarter, showing WellPoint
to be less profitable on equity than the industry average. Benefits expense increasing
faster than premium revenue has a negative affect on the growth of net income and in
turn a negative effect on the return on equity.
The EBITDA margin is a more stringent measure of profitability since interest,
taxes, depreciation, and amortization are not included. The company is performing on par
with the industry, but has decreased within the company trend. WellPoint’s sustainable
growth rate is decreasing. The operating expenses are increasing and reducing the profit
margins. If this continues, then this is an indication that WellPoint will soon need to
borrow more funds, or growth will become stagnant. As the return on common equity
decreases, so will the sustainable growth rate. The engagement should monitor accounts
such as benefits expenses and premium revenues since they have an effect on the
profitability ratios and are at more risk for material misstatement.
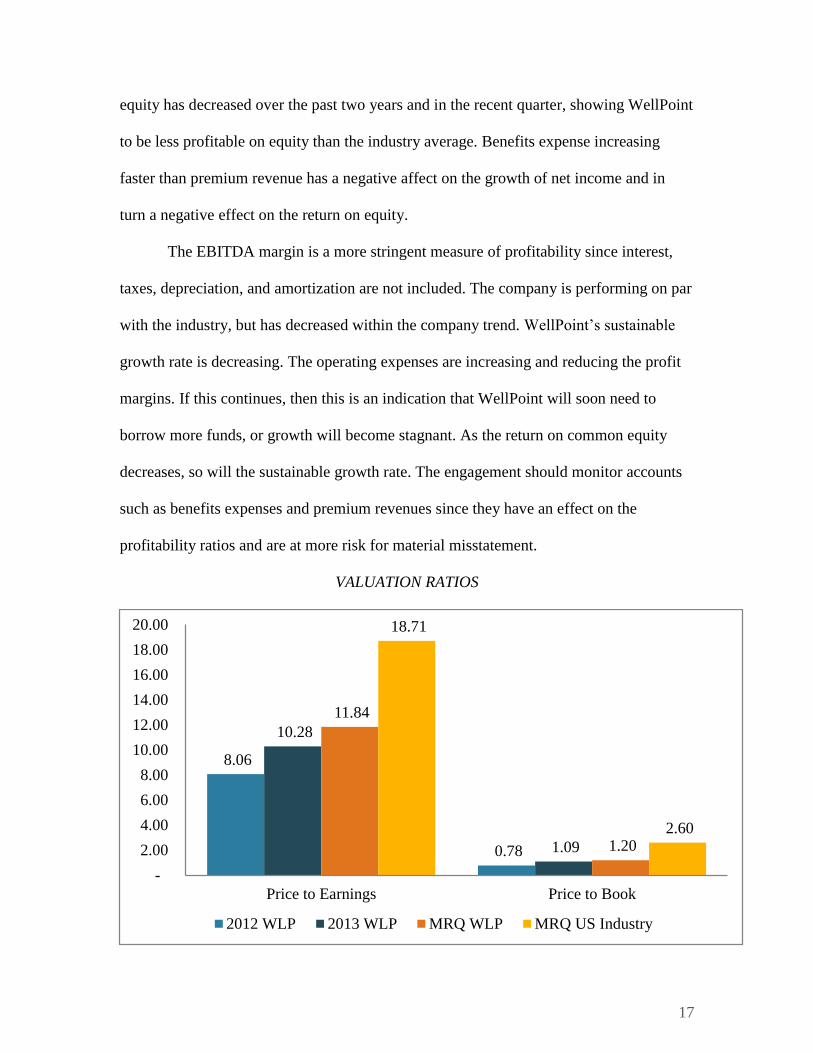
VALUATION RATIOS
8.06
0.78
10.28
1.09
11.84
1.20
18.71
2.60
-
2.00
4.00
6.00
8.00
10.00
12.00
14.00
16.00
18.00
20.00
Price to Earnings Price to Book
2012 WLP 2013 WLP MRQ WLP MRQ US Industry
18
It is a good sign that the company’s Price to Earnings ratio and Price to Book ratio
have improved recently, but the ratios are still significantly lower than the industry
average. The Return on Equity is decreasing and the Price to Book ratio is increasing.
This could be a sign that the company is overvalued. The engagement team will need to
make sure the market value common shares and book value for equity are being
estimated in the appropriate manner.
RISK ASSESSMENT The health care sector in which WellPoint operates is in a state of flux. Increased
regulation from the federal government is causing companies, hospitals, and individuals
to learn a new and complex set of rules. Thus, although WellPoint operates in a mature
industry, a number of business risks exist to the company’s longevity and profitability.
The first is the government’s intervention. The ACA prohibits insurance companies from
denying coverage to individuals based on pre-existing or prior condition. This may force
the company to significantly increase its risk concentration, leading to a point when
claims or payments to health care providers could outweigh the premiums written and
earned. Furthermore, the increased oversight by the federal government may complicate
the WellPoint’s ability to adjust premiums to changes in its risk and operating cost,
thereby affecting their bottom line and gross margin. Costs of operation may see
significant increases from the burden of complying with the new legislation.
Revenues may also be affected by the rise in employers opting for self-insurance
rather than purchasing commercial insurance from an insurance company, such as
WellPoint. According to an article published in The New York Times, the Employee
Benefit Research Institute found that “59 percent of private sector workers with health
coverage were in self-insured plans in 2011, up from 41 percent in 1998” (Pear, 2013). A

19
rise in self-insurance would lead to a decrease in premium revenue to WellPoint, and its
competitors. Thus, health insurance companies would rely more on processing claims,
rather than issuing insurance.
Both situations, increase in regulation and potential loss of revenues to self-
insurance, would significantly hinder WellPoint from expanding its product offerings and
market share. Although the possible outcomes of this stymie are endless, some likely
possibilities are loss of value to shareholders, loss of jobs to employees, and insolvency
of the company.
In the health insurance industry, one inherent risk faced is that consumers under
contract will have legitimate claims that need to be paid out. The health insurance
provider is to cover the extent of costs they are under contract with the consumer to pay,
based on the consumer’s health plan. The risk is that claims to be paid are greater than the
customer’s premium and deductible. If an estimation of the company’s liability is off, it
could lead to a material misstatement on the financial statements.
Another risk inherent to the health insurance industry is its competition. Health
insurance companies are fighting for greater market share more than ever. With the new
health care regulations and with massive health insurance companies getting larger and
becoming more attractive, there is more reason than ever for consumers to obtain or
consider changing their health insurance provider. As discussed earlier, the health
insurance competition is highly concentrated and extremely competitive. This pressure
could lead to material misstatements that result from an exaggeration of the company’s
position in the industry as being more favorable than its competition. The acquisition of a

20
smaller insurance company could bring a variety of hurdles. Two such hurdles include
the integration of computer systems and issues with asset and liability valuations.
A third risk inherent to the health insurance industry is health care costs. New
innovations in health care machinery and technology are not coming cheap. A recent USA
Today article relayed that, “health care spending rose at the fastest pace in 10 years last
quarter,” and health care expenses rose at 5.6% even though the number of inpatient days
dropped (Davidson, 2014). Material misstatements could be made in order to keep
consistent profit margins without charging higher premiums to customers.
RECOMMENDATION It is the audit team’s recommendation that the audit firm accept WellPoint as a
new client. Where there are major risks to face in the health insurance industry, the
team’s analysis depicts a company that is growing exponentially and as a result will
continually require the services of an independent registered public audit firm.

21
APPENDICES
APPENDIX A: HORIZONTAL ANALYSIS OF THE BALANCE SHEET
APPENDIX B: HORIZONTAL ANALYSIS OF THE INCOME STATEMENT
APPENDIX C: VERTICAL ANALYSIS OF THE BALANCE SHEET
APPENDIX D: VERTICAL ANALYSIS OF THE INCOME STATEMENT
APPENDIX E: COMPARATIVE RATIO ANALYSIS

22
APPENDIX A
2013 2012 2011 2010 2009 2008 2013 2012 2011 2010 2009
Assets
Current assets:
Cash and cash equivalents 1,582.1$ 2,475.3$ 2,201.6$ 1,788.8$ 4,816.1$ 2,183.9$ (36.1%) 12.4% 23.1% (62.9%) 120.5%
Investments available-for-sale, at fair value:
Fixed maturity securities (amortized cost of $16,826.7 and $16,033.1) 17,038.2 16,912.9 15,913.1 16,069.5 15,696.9 1,564.8 0.7% 6.3% (1.0%) 2.4% 903.1%
Equity securities (cost of $1,168.5 and 869.9) 1,735.5 1,212.4 1,188.1 1,236.2 1,010.7 1,088.0 43.1% 2.0% (3.9%) 22.3% (7.1%)
Other invested assets, current 16.3 14.8 14.8 21.1 26.5 23.6 10.1% 0.0% (29.9%) (20.4%) 12.3%
Accrued investment income 168.8 162.2 172.0 177.4 172.8 172.8 4.1% (5.7%) (3.0%) 2.7% 0.0%
Premium and self-funded receivables 3,968.7 3,687.4 3,402.9 3,041.6 3,281.0 3,042.9 7.6% 8.4% 11.9% (7.3%) 7.8%
Other receivables 1,063.3 927.6 943.9 878.6 879.5 1,373.9 14.6% (1.7%) 7.4% (0.1%) (36.0%)
Income taxes receivable 235.7 228.5 105.8 32.3 - 159.9 3.2% 116.0% 227.6% - (100.0%)
Securities lending collateral 969.8 564.6 871.4 900.3 394.8 529.0 71.8% (35.2%) (3.2%) 128.0% (25.4%)
Deferred tax assets, net 383.0 236.4 424.8 460.9 523.8 779.0 62.0% (44.4%) (7.8%) (12.0%) (32.8%)
Other current assets 1,677.5 1,827.4 1,859.0 1,534.1 1,268.6 1,212.2 (8.2%) (1.7%) 21.2% 20.9% 4.7%
Assets held for sale 906.9 1,098.0 - - - - (17.4%) - - - -
Total current assets 29,745.8 29,347.5 27,097.4 26,140.8 28,070.7 12,130.0 1.4% 8.3% 3.7% (6.9%) 131.4%
Long-term investments available-for-sale, at fair value:
Fixed maturity securities (amortized cost of $455.9 and $426.0) 449.9 431.5 246.8 221.8 230.4 11,808.4 4.3% 74.8% 11.3% (3.7%) (98.0%)
Equity securities (cost of $27.4 and $27.1) 31.3 30.1 28.8 33.4 32.5 30.7 4.0% 4.5% (13.8%) 2.8% 5.9%
Other invested assets, long-term 1,542.6 1,387.6 1,103.3 865.4 775.3 703.2 11.2% 25.8% 27.5% 11.6% 10.3%
Property and equipment, net 1,801.5 1,717.3 1,418.1 1,155.5 1,099.6 1,054.5 4.9% 21.1% 22.7% 5.1% 4.3%
Goodwill 16,917.2 16,889.8 13,858.7 13,264.9 13,264.6 13,461.3 0.2% 21.9% 4.5% 0.0% (1.5%)
Other intangible assets 8,441.0 8,665.5 7,931.7 7,996.8 8,259.3 8,827.2 (2.6%) 9.3% (0.8%) (3.2%) (6.4%)
Other noncurrent assets 645.2 486.1 478.4 488.3 393.0 387.9 32.7% 1.6% (2.0%) 24.2% 1.3%
Total assets 59,574.5$ 58,955.4$ 52,163.2$ 50,166.9$ 52,125.4$ 48,403.2$ 1.1% 13.0% 4.0% (3.8%) 7.7%
Liabilities and shareholders' equity
Liabilities
Current liabilities:
Policy liabilities:
Medical claims payable 6,127.2$ 6,174.5$ 5,489.0$ 4,852.4$ 5,450.5$ 6,184.7$ (0.8%) 12.5% 13.1% (11.0%) (11.9%)
Reserves for future policy benefits 63.1 61.3 55.1 56.4 62.6 64.5 2.9% 11.3% (2.3%) (9.9%) (2.9%)
Other policyholder liabilities 2,073.2 2,345.7 2,278.2 1,909.1 1,617.6 1,626.8 (11.6%) 3.0% 19.3% 18.0% (0.6%)
Total policy liabilities 8,263.5 8,581.5 7,822.3 6,817.9 7,130.7 7,876.0 (3.7%) 9.7% 14.7% (4.4%) (9.5%)
Unearned income 822.7 896.8 926.5 891.4 1,050.0 1,087.7 (8.3%) (3.2%) 3.9% (15.1%) (3.5%)
Accounts payable and accrued expenses 3,426.3 3,098.7 3,124.1 2,942.2 2,994.1 2,856.5 10.6% (0.8%) 6.2% (1.7%) 4.8%
Security trades pending payable 95.2 69.3 51.7 33.3 1,228.7 - 37.4% 34.0% 55.3% (97.3%) -
Securities lending payable 969.7 564.7 872.5 901.5 37.6 5.8 71.7% (35.3%) (3.2%) 2,297.6% 548.3%
Short-term borrowings 400.0 250.0 100.0 100.0 396.6 529.0 60.0% 150.0% 0.0% (74.8%) (25.0%)
Current portion of long-term debt 518.0 557.1 1,274.5 705.9 - 98.0 (7.0%) (56.3%) 80.5% - (100.0%)
Other current liabilities 1,674.7 1,769.8 1,727.1 1,617.3 60.8 909.7 (5.4%) 2.5% 6.8% 2,560.0% (93.3%)
Liabilities held for sale 181.4 207.1 - - 1,775.2 1,657.6 (12.4%) 0.0% 0.0% 100.0% 200.0%
Total current liabilities 16,351.5 15,995.0 15,898.7 14,009.5 14,673.7 15,020.3 2.2% 0.6% 13.5% (4.5%) (2.3%)
Long-term debt, less current portion 13,573.6 14,170.8 8,465.7 8,147.8 8,338.3 7,833.9 (4.2%) 67.4% 3.9% (2.3%) 6.4%
Reserves for future policy benefits, noncurrent 723.0 750.8 730.7 646.7 664.6 664.7 (3.7%) 2.8% 13.0% (2.7%) (0.0%)
Deferred tax liabilities, net 3,325.2 3,222.9 2,724.0 2,586.9 2,470.4 2,098.9 3.2% 18.3% 5.3% 4.7% 17.7%
Other noncurrent liabilities 836.0 1,013.2 1,055.9 963.4 1,115.1 1,353.7 (17.5%) (4.0%) 9.6% (13.6%) (17.6%)
Total liabilities 34,809.3 35,152.7 28,875.0 26,354.3 27,262.1 26,971.5 (1.0%) 21.7% 9.6% (3.3%) 1.1%
Shareholders' equity
Preferred stock, without par value, shares authorized 100,000,000;
shares issued and outstanding -- none
Common stock, par value $0.01, shares authorized 900,000,000;
shares issued and outstanding: 293,273,830 and 304,715,144 2.9 3.0 3.4 3.8 4.5 5.0 (3.3%) (11.8%) (10.5%) (15.6%) (10.0%)
Additional paid-in capital 10,765.2 10,853.5 11,679.2 12,862.6 15,192.2 16,843.0 (0.8%) (7.1%) (9.2%) (15.3%) (9.8%)
Retained earnings 13,813.9 12,647.1 11,490.7 10,721.6 9,598.5 5,479.4 9.2% 10.1% 7.2% 11.7% 75.2%
Accumulated other comprehensive income (loss) 183.2 299.1 114.9 224.6 68.1 (895.7) (38.7%) 160.3% (48.8%) 229.8% (107.6%)
Total shareholders' equity 24,765.2 23,802.7 23,288.2 23,812.6 24,863.3 21,431.7 4.0% 2.2% (2.2%) (4.2%) 16.0%
Total liabilities and shareholders' equity 59,574.5$ 58,955.4$ 52,163.2$ 50,166.9$ 52,125.4$ 48,403.2$ 1.1% 13.0% 4.0% (3.8%) 7.7%
December 31 Percent Change
WellPoint, Inc.
Consolidated Balance Sheet - Horizontal Analysis
(In millions, except share data)

23
APPENDIX B
2013 2012 2011 2010 2009 2008 2013 2012 2011 2010 2009
Revenues
Premiums 66,119.1$ 56,496.7$ 55,969.6$ 53,973.6$ 56,382.0$ 57,101.0$ 17.0% 0.9% 3.7% (4.3%) (1.3%)
Administrative fees 4,031.9 3,934.1 3,854.6 3,730.4 3,751.7 3,836.6 2.5% 2.1% 3.3% (0.6%) (2.2%)
Other revenue 40.4 83.2 41.0 36.5 606.3 641.6 (51.4%) 102.9% 12.3% (94.0%) (5.5%)
Total operating revenue 70,191.4 60,514.0 59,865.2 57,740.5 60,740.0 61,579.2 16.0% 1.1% 3.7% (4.9%) (1.4%)
Net investment income 659.1 686.1 703.7 803.3 801.0 851.1 (3.9%) (2.5%) (12.4%) 0.3% (5.9%)
Gain on sale of business 3,792.3 - - - (100.0%) -
Net realized gains on investments 271.9 334.9 235.1 194.1 56.4 28.7 (18.8%) 42.5% 21.1% 244.1% 96.5%
Other-than-temporary impairment losses on investments:
Total other-than-temporary impairment losses on investments (100.6) (41.2) (114.7) (70.8) (538.4) (1,207.9) 144.2% (64.1%) 62.0% (86.8%) (55.4%)
Portion of other-than-temporary impairment losses recognized in
other comprehensive income 1.7 3.4 21.4 31.4 88.2 - (50.0%) (84.1%) (31.8%) (64.4%) -
Other-than-temporary impairment losses recognized in income (98.9) (37.8) (93.3) (39.4) (450.2) (1,207.9) 161.6% (59.5%) 136.8% (91.2%) (62.7%)
Total revenues 71,023.5 61,497.2 60,710.7 58,698.5 64,939.5 61,251.1 15.5% 1.3% 3.4% (9.6%) 6.0%
Expenses
Benefit expense 56,237.1 48,213.6 47,647.5 44,930.4 47,122.3 48,265.7 16.6% 1.2% 6.0% (4.7%) (2.4%)
Selling, general and administrative expense:
Selling expense 1,526.9 1,586.9 1,616.8 1,610.3 1,685.5 1,778.4 (3.8%) (1.8%) 0.4% (4.5%) (5.2%)
General and administrative expense 8,426.0 7,093.6 6,818.8 7,122.3 7,333.8 6,718.8 18.8% 4.0% (4.3%) (2.9%) 9.2%
Total selling, general and administrative expense 9,952.9 8,680.5 8,435.6 8,732.6 9,019.3 8,497.2 14.7% 2.9% (3.4%) (3.2%) 6.1%
Cost of drugs 419.0 468.5 - - (100.0%) (10.6%)
Interest expense 602.7 511.8 430.3 418.9 447.4 469.8 17.8% 18.9% 2.7% (6.4%) (4.8%)
Amortization of other intangible assets 245.3 233.0 239.4 241.7 266.0 286.1 5.3% (2.7%) (1.0%) (9.1%) (7.0%)
Impairment of other intangible assets - - - 21.1 262.5 141.4 - - (100.0%) (92.0%) 85.6%
Loss on extinguishment of debt 145.3 - - - - - - - - - -
Total expenses 67,183.3 57,638.9 56,752.8 54,344.7 57,536.5 58,128.7 16.6% 1.6% 4.4% (5.5%) (1.0%)
Income from continuing operations before income tax expense 3,840.2 3,858.3 3,957.9 4,353.8 7,403.0 3,122.4 (0.5%) (2.5%) (9.1%) (41.2%) 137.1%
Income tax expense 1,205.9 1,207.3 1,311.2 1,466.7 2,657.1 631.7 (0.1%) (7.9%) (10.6%) (44.8%) 320.6%
Income from continuing operations 2,634.3 2,651.0 2,646.7 2,887.1 4,745.9 2,490.7 (0.6%) 0.2% (8.3%) (39.2%) 90.5%
(Loss) income from discontinued operations, net of tax (144.6) 4.5 - - - - (3,313.3%) - - - -
Net income 2,489.7$ 2,655.5$ 2,646.7$ 2,887.1$ 4,745.9$ 2,490.7$ (6.2%) 0.3% (8.3%) (39.2%) 90.5%
Basic net income (loss) per share:
Basic - continuing operations 8.83 8.25 7.35 7.03 9.96 4.79 7.0% 12.2% 4.6% (29.4%) 107.9%
Basic - discontinued operations (0.49) 0.01 - - - - (5,000.0%) - - - -
Basic net income per share 8.34$ 8.26$ 7.35$ 7.03$ 9.96$ 4.79$ 1.0% 12.4% 4.6% (29.4%) 107.9%
Diluted net income (loss) per share:
Diluted - continuing operations 8.67 8.17 7.25 6.94 9.88 4.76 6.1% 12.7% 4.5% (29.8%) 107.6%
Diluted - discontinued operations (0.47) 0.01 - - - (4,800.0%) - - - -
Diluted net income per share 8.20$ 8.18$ 7.25$ 6.94$ 9.88$ 4.76$ 0.2% 12.8% 4.5% (29.8%) 107.6%
Dividends per share 1.50$ 1.15$ 1.00$ -$ -$ -$ 30.4% 15.0% - - -
December 31 Percent Change
WellPoint, Inc.
Consolidated Income Statement - Horizontal Analysis
(In millions, except share data)

24
APPENDIX C
2013 2012 2011 2010 2009 2008 2013 2012 2011 2010 2009 2008
Assets
Current assets:
Cash and cash equivalents 1,582.1$ 2,475.3$ 2,201.6$ 1,788.8$ 4,816.1$ 2,183.9$ 2.7% 4.2% 4.2% 3.6% 9.2% 4.5%
Investments available-for-sale, at fair value:
Fixed maturity securities (amortized cost of $16,826.7 and $16,033.1) 17,038.2 16,912.9 15,913.1 16,069.5 15,696.9 1,564.8 28.6% 28.7% 30.5% 32.0% 30.1% 3.2%
Equity securities (cost of $1,168.5 and 869.9) 1,735.5 1,212.4 1,188.1 1,236.2 1,010.7 1,088.0 2.9% 2.1% 2.3% 2.5% 1.9% 2.2%
Other invested assets, current 16.3 14.8 14.8 21.1 26.5 23.6 0.0% 0.0% 0.0% 0.0% 0.1% 0.0%
Accrued investment income 168.8 162.2 172.0 177.4 172.8 172.8 0.3% 0.3% 0.3% 0.4% 0.3% 0.4%
Premium and self-funded receivables 3,968.7 3,687.4 3,402.9 3,041.6 3,281.0 3,042.9 6.7% 6.3% 6.5% 6.1% 6.3% 6.3%
Other receivables 1,063.3 927.6 943.9 878.6 879.5 1,373.9 1.8% 1.6% 1.8% 1.8% 1.7% 2.8%
Income taxes receivable 235.7 228.5 105.8 32.3 - 159.9 0.4% 0.4% 0.2% 0.1% 0.0% 0.3%
Securities lending collateral 969.8 564.6 871.4 900.3 394.8 529.0 1.6% 1.0% 1.7% 1.8% 0.8% 1.1%
Deferred tax assets, net 383.0 236.4 424.8 460.9 523.8 779.0 0.6% 0.4% 0.8% 0.9% 1.0% 1.6%
Other current assets 1,677.5 1,827.4 1,859.0 1,534.1 1,268.6 1,212.2 2.8% 3.1% 3.6% 3.1% 2.4% 2.5%
Assets held for sale 906.9 1,098.0 - - - - 1.5% 1.9% 0.0% 0.0% 0.0% 0.0%
Total current assets 29,745.8 29,347.5 27,097.4 26,140.8 28,070.7 12,130.0 49.9% 49.8% 51.9% 52.1% 53.9% 25.1%
Long-term investments available-for-sale, at fair value:
Fixed maturity securities (amortized cost of $455.9 and $426.0) 449.9 431.5 246.8 221.8 230.4 11,808.4 0.8% 0.7% 0.5% 0.4% 0.4% 24.4%
Equity securities (cost of $27.4 and $27.1) 31.3 30.1 28.8 33.4 32.5 30.7 0.1% 0.1% 0.1% 0.1% 0.1% 0.1%
Other invested assets, long-term 1,542.6 1,387.6 1,103.3 865.4 775.3 703.2 2.6% 2.4% 2.1% 1.7% 1.5% 1.5%
Property and equipment, net 1,801.5 1,717.3 1,418.1 1,155.5 1,099.6 1,054.5 3.0% 2.9% 2.7% 2.3% 2.1% 2.2%
Goodwill 16,917.2 16,889.8 13,858.7 13,264.9 13,264.6 13,461.3 28.4% 28.6% 26.6% 26.4% 25.4% 27.8%
Other intangible assets 8,441.0 8,665.5 7,931.7 7,996.8 8,259.3 8,827.2 14.2% 14.7% 15.2% 15.9% 15.8% 18.2%
Other noncurrent assets 645.2 486.1 478.4 488.3 393.0 387.9 1.1% 0.8% 0.9% 1.0% 0.8% 0.8%
Total assets 59,574.5$ 58,955.4$ 52,163.2$ 50,166.9$ 52,125.4$ 48,403.2$ 100.0% 100.0% 100.0% 100.0% 100.0% 100.0%
Liabilities and shareholders' equity
Liabilities
Current liabilities:
Policy liabilities:
Medical claims payable 6,127.2$ 6,174.5$ 5,489.0$ 4,852.4$ 5,450.5$ 6,184.7$ 10.3% 10.5% 10.5% 9.7% 10.5% 12.8%
Reserves for future policy benefits 63.1 61.3 55.1 56.4 62.6 64.5 0.1% 0.1% 0.1% 0.1% 0.1% 0.1%
Other policyholder liabilities 2,073.2 2,345.7 2,278.2 1,909.1 1,617.6 1,626.8 3.5% 4.0% 4.4% 3.8% 3.1% 3.4%
Total policy liabilities 8,263.5 8,581.5 7,822.3 6,817.9 7,130.7 7,876.0 13.9% 14.6% 15.0% 13.6% 13.7% 16.3%
Unearned income 822.7 896.8 926.5 891.4 1,050.0 1,087.7 1.4% 1.5% 1.8% 1.8% 2.0% 2.2%
Accounts payable and accrued expenses 3,426.3 3,098.7 3,124.1 2,942.2 2,994.1 2,856.5 5.8% 5.3% 6.0% 5.9% 5.7% 5.9%
Security trades pending payable 95.2 69.3 51.7 33.3 1,228.7 - 0.2% 0.1% 0.1% 0.1% 2.4% 0.0%
Securities lending payable 969.7 564.7 872.5 901.5 37.6 5.8 1.6% 1.0% 1.7% 1.8% 0.1% 0.0%
Short-term borrowings 400.0 250.0 100.0 100.0 396.6 529.0 0.7% 0.4% 0.2% 0.2% 0.8% 1.1%
Current portion of long-term debt 518.0 557.1 1,274.5 705.9 - 98.0 0.9% 0.9% 2.4% 1.4% 0.0% 0.2%
Other current liabilities 1,674.7 1,769.8 1,727.1 1,617.3 60.8 909.7 2.8% 3.0% 3.3% 3.2% 0.1% 1.9%
Liabilities held for sale 181.4 207.1 - - 1,775.2 1,657.6 0.3% 0.4% 0.0% 0.0% 3.4% 3.4%
Total current liabilities 16,351.5 15,995.0 15,898.7 14,009.5 14,673.7 15,020.3 27.4% 27.1% 30.5% 27.9% 28.2% 31.0%
Long-term debt, less current portion 13,573.6 14,170.8 8,465.7 8,147.8 8,338.3 7,833.9 22.8% 24.0% 16.2% 16.2% 16.0% 16.2%
Reserves for future policy benefits, noncurrent 723.0 750.8 730.7 646.7 664.6 664.7 1.2% 1.3% 1.4% 1.3% 1.3% 1.4%
Deferred tax liabilities, net 3,325.2 3,222.9 2,724.0 2,586.9 2,470.4 2,098.9 5.6% 5.5% 5.2% 5.2% 4.7% 4.3%
Other noncurrent liabilities 836.0 1,013.2 1,055.9 963.4 1,115.1 1,353.7 1.4% 1.7% 2.0% 1.9% 2.1% 2.8%
Total liabilities 34,809.3 35,152.7 28,875.0 26,354.3 27,262.1 26,971.5 58.4% 59.6% 55.4% 52.5% 52.3% 55.7%
Shareholders' equity
Preferred stock, without par value, shares authorized 100,000,000;
shares issued and outstanding -- none
Common stock, par value $0.01, shares authorized 900,000,000;
shares issued and outstanding: 293,273,830 and 304,715,144 2.9 3.0 3.4 3.8 4.5 5.0 0.0% 0.0% 0.0% 0.0% 0.0% 0.0%
Additional paid-in capital 10,765.2 10,853.5 11,679.2 12,862.6 15,192.2 16,843.0 18.1% 18.4% 22.4% 25.6% 29.1% 34.8%
Retained earnings 13,813.9 12,647.1 11,490.7 10,721.6 9,598.5 5,479.4 23.2% 21.5% 22.0% 21.4% 18.4% 11.3%
Accumulated other comprehensive income (loss) 183.2 299.1 114.9 224.6 68.1 (895.7) 0.3% 0.5% 0.2% 0.4% 0.1% (1.9%)
Total shareholders' equity 24,765.2 23,802.7 23,288.2 23,812.6 24,863.3 21,431.7 41.6% 40.4% 44.6% 47.5% 47.7% 44.3%
Total liabilities and shareholders' equity 59,574.5$ 58,955.4$ 52,163.2$ 50,166.9$ 52,125.4$ 48,403.2$ 100.0% 100.0% 100.0% 100.0% 100.0% 100.0%
December 31 Percent Change
WellPoint, Inc.
Consolidated Balance Sheet - Vertical Analysis
(In millions, except share data)

25
APPENDIX D
2013 2012 2011 2010 2009 2008 2013 2012 2011 2010 2009 2008
Revenues
Premiums 66,119.1$ 56,496.7$ 55,969.6$ 53,973.6$ 56,382.0$ 57,101.0$ 93.1% 91.9% 92.2% 92.0% 86.8% 93.2%
Administrative fees 4,031.9 3,934.1 3,854.6 3,730.4 3,751.7 3,836.6 5.7% 6.4% 6.3% 6.4% 5.8% 6.3%
Other revenue 40.4 83.2 41.0 36.5 606.3 641.6 0.1% 0.1% 0.1% 0.1% 0.9% 1.0%
Total operating revenue 70,191.4 60,514.0 59,865.2 57,740.5 60,740.0 61,579.2 98.8% 98.4% 98.6% 98.4% 93.5% 100.5%
Net investment income 659.1 686.1 703.7 803.3 801.0 851.1 0.9% 1.1% 1.2% 1.4% 1.2% 1.4%
Gain on sale of business 3,792.3 5.8%
Net realized gains on investments 271.9 334.9 235.1 194.1 56.4 28.7 0.4% 0.5% 0.4% 0.3% 0.1% 0.0%
Other-than-temporary impairment losses on investments:
Total other-than-temporary impairment losses on investments (100.6) (41.2) (114.7) (70.8) (538.4) (1,207.9) (0.1%) (0.1%) (0.2%) (0.1%) (0.8%) (2.0%)
Portion of other-than-temporary impairment losses recognized in
other comprehensive income 1.7 3.4 21.4 31.4 88.2 - 0.0% 0.0% 0.0% 0.1% 0.1% 0.0%
Other-than-temporary impairment losses recognized in income (98.9) (37.8) (93.3) (39.4) (450.2) (1,207.9) (0.1%) (0.1%) (0.2%) (0.1%) (0.7%) (2.0%)
Total revenues 71,023.5 61,497.2 60,710.7 58,698.5 64,939.5 61,251.1 100.0% 100.0% 100.0% 100.0% 100.0% 100.0%
Expenses
Benefit expense 56,237.1 48,213.6 47,647.5 44,930.4 47,122.3 48,265.7 79.2% 78.4% 78.5% 76.5% 72.6% 78.8%
Selling, general and administrative expense:
Selling expense 1,526.9 1,586.9 1,616.8 1,610.3 1,685.5 1,778.4 2.1% 2.6% 2.7% 2.7% 2.6% 2.9%
General and administrative expense 8,426.0 7,093.6 6,818.8 7,122.3 7,333.8 6,718.8 11.9% 11.5% 11.2% 12.1% 11.3% 11.0%
Total selling, general and administrative expense 9,952.9 8,680.5 8,435.6 8,732.6 9,019.3 8,497.2 14.0% 14.1% 13.9% 14.9% 13.9% 13.9%
Cost of drugs 419.0 468.5
Interest expense 602.7 511.8 430.3 418.9 447.4 469.8 0.8% 0.8% 0.7% 0.7% 0.7% 0.8%
Amortization of other intangible assets 245.3 233.0 239.4 241.7 266.0 286.1 0.3% 0.4% 0.4% 0.4% 0.4% 0.5%
Impairment of other intangible assets - - - 21.1 262.5 141.4 0.0% 0.0% 0.0% 0.0% 0.4% 0.2%
Loss on extinguishment of debt 145.3 - - - - - 0.2% 0.0% 0.0% 0.0% 0.0% 0.0%
Total expenses 67,183.3 57,638.9 56,752.8 54,344.7 57,536.5 58,128.7 94.6% 93.7% 93.5% 92.6% 88.6% 94.9%
Income from continuing operations before income tax expense 3,840.2 3,858.3 3,957.9 4,353.8 7,403.0 3,122.4 5.4% 6.3% 6.5% 7.4% 11.4% 5.1%
Income tax expense 1,205.9 1,207.3 1,311.2 1,466.7 2,657.1 631.7 1.7% 2.0% 2.2% 2.5% 4.1% 1.0%
Income from continuing operations 2,634.3 2,651.0 2,646.7 2,887.1 4,745.9 2,490.7 3.7% 4.3% 4.4% 4.9% 7.3% 4.1%
(Loss) income from discontinued operations, net of tax (144.6) 4.5 - - - - (0.2%) 0.0% 0.0% 0.0% 0.0% 0.0%
Net income 2,489.7$ 2,655.5$ 2,646.7$ 2,887.1$ 4,745.9$ 2,490.7$ 3.5% 4.3% 4.4% 4.9% 7.3% 4.1%
Basic net income (loss) per share:
Basic - continuing operations 8.83 8.25 7.35 7.03 9.96 4.79 0.0% 0.0% 0.0% 0.0% 0.0% 0.0%
Basic - discontinued operations (0.49) 0.01 - - - - (0.0%) 0.0% 0.0% 0.0% 0.0% 0.0%
Basic net income per share 8.34$ 8.26$ 7.35$ 7.03$ 9.96$ 4.79$ 0.0% 0.0% 0.0% 0.0% 0.0% 0.0%
Diluted net income (loss) per share:
Diluted - continuing operations 8.67 8.17 7.25 6.94 9.88 4.76 0.0% 0.0% 0.0% 0.0% 0.0% 0.0%
Diluted - discontinued operations (0.47) 0.01 - - - (0.0%) 0.0% 0.0% 0.0% 0.0% 0.0%
Diluted net income per share 8.20$ 8.18$ 7.25$ 6.94$ 9.88$ 4.76$ 0.0% 0.0% 0.0% 0.0% 0.0% 0.0%
Dividends per share 1.50$ 1.15$ 1.00$ -$ -$ -$ 0.0% 0.0% 0.0% 0.0% 0.0% 0.0%
December 31 Percent Change
WellPoint, Inc.
Consolidated Income Statement - Vertical Analysis
(In millions, except share data)
26
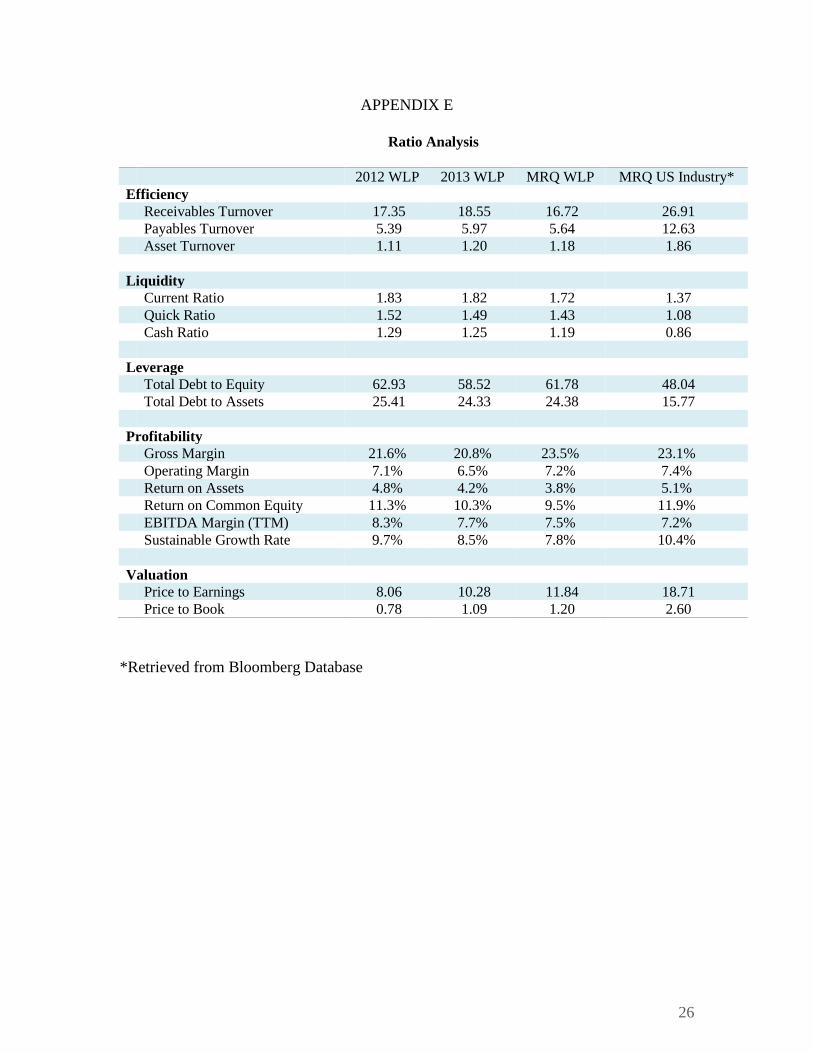
APPENDIX E
Ratio Analysis
2012 WLP 2013 WLP MRQ WLP MRQ US Industry*
Efficiency
Receivables Turnover 17.35 18.55 16.72 26.91
Payables Turnover 5.39 5.97 5.64 12.63
Asset Turnover 1.11 1.20 1.18 1.86
Liquidity
Current Ratio 1.83 1.82 1.72 1.37
Quick Ratio 1.52 1.49 1.43 1.08
Cash Ratio 1.29 1.25 1.19 0.86
Leverage
Total Debt to Equity 62.93 58.52 61.78 48.04
Total Debt to Assets 25.41 24.33 24.38 15.77
Profitability
Gross Margin 21.6% 20.8% 23.5% 23.1%
Operating Margin 7.1% 6.5% 7.2% 7.4%
Return on Assets 4.8% 4.2% 3.8% 5.1%
Return on Common Equity 11.3% 10.3% 9.5% 11.9%
EBITDA Margin (TTM) 8.3% 7.7% 7.5% 7.2%
Sustainable Growth Rate 9.7% 8.5% 7.8% 10.4%
Valuation
Price to Earnings 8.06 10.28 11.84 18.71
Price to Book 0.78 1.09 1.20 2.60
*Retrieved from Bloomberg Database

27
WORKS CITED
Accounting Research Manager. (n.d.). Insurance Revenues. Life and Health Insurance
Entities. Retrieved from
http://www.accoutningreserachmanager.com.proxy2.ulib.iupui.edu/WK/RM.NSF/
arm.html?Open
Accounting Research Manger. (n.d.). Operations and Distribution Systems. Life and
Health Insuranance Entities. Retrieved from
http://www.acountingresearchmanager.com.proxy2.ulib.iupui.edu/WK/RM.NSF/a
rm.html?Open
Bloomberg L.P. (2014). Industry Ratios. Retrieved from Bloomberg database.
Davidson, P. (2014, April 1). Health Care Spending Growth Hits 10-year High. USA
Today. Retrieved from
http://www.usatoday.com/story/money/business/2014/03/30/health-care-
spending/7007987/
Fortune. (2014). Retrieved from
http://fortune.com/fortune500/wellpoint-inc-38/
Health Information Technology and Quality Improvement. (2014, June 8). Retrieved
from U.S. Department of Health and Human Services:
http://www.hrsa.gov/healthit/toolbox/HealthITAdoptiontoolbox/QualityImprovem
ent/whatispay4perf.html
Helibrunn, E. (2013, December 16). Top Health Insurance Companies. US News.
Retrieved from http://health.usnews.com/health-news/health-
insurance/articles/2013/12/16/top-health-insurance-companies
Hoopes, S. (2014, June 14). IBISWorld Industry Report t52411b. Health & Medical
Insurance in the US. Retrieved from IBISWorld.
Kaiser Permanente. (2014). Retrieved from
http://share.kaiserpermanente.org/article/fast-facts-about-kaiser-permanente/
Office of Personnel Management. (2013, September 10). Audit of Information Systems
General and Application Control at WellPoint. Roanoke, Virginia, USA.

28
Pear, R. (2013, February 17). Some Employers Could Opt Out of Insurance Market,
Raising Others' Costs. The New York Times. Retrieved from
http://www.nytimes.com/2013/02/18/us/allure-of-self-insurance-draws-concern-
over-costs.html
Seligman, P. (2013, November). Healthcare: Managed Care. Standard & Poor's Captial
IQ Industry Surveys. Retrieved from NetAdvantage .
The Economist. (2014, May 31). The $272 billion swindle. The Economist, pp. 26-27.
Thinkwellpoint.com. (2014). Retrieved from
http://www.thinkwellpoint.com
UnitedHealth Group. (2014, June 14). Retrieved from
http://www.unitedhealthgroup.com/newsroom/articles/news/unitedhealth%20grou
p/2014/0415medicaid.aspx?
WellPoint Board of Directors: Audit Committee. (2014, September 25). Audit Committee
Charter.
WellPoint, Inc. (n.d.). Wellpoint, Inc. 2009 Form 10-K.
WellPoint, Inc. (n.d.). Wellpoint, Inc. 2010 Form 10-K.
WellPoint, Inc. (n.d.). Wellpoint, Inc. 2012 Form 10-K.
WellPoint, Inc. (n.d.). Wellpoint, Inc. 2013 Form 10-K.
Wellpoint.com. (2014). Retrieved from
http://www.wellpoint.com
Wilde-Matthews, A. (2014, May 27). Insurers Push to Rein In Spending on Cancer Care.
The Wall Street Journal, pp. A1, A12.

29
WELLPOINT, INC.’S FORM 10-K FILING
FINANCIAL STATEMENTS AND NOTES