preliminary results on high accuracy estimation of shoreline change rate based on coastal elevation...
Post on 21-Dec-2015
216 views
TRANSCRIPT
PPreliminary Results on High Accuracy reliminary Results on High Accuracy Estimation of Shoreline Change Rate Based on Estimation of Shoreline Change Rate Based on
Coastal Elevation ModelsCoastal Elevation Models
Research Project RNM 3575: Multisource Geospatial Data
Integration and Mining for the Monitoring and Modelling of Coastal Areas Evolution and
Vulnerability
http://www.ual.es/GruposInv/ProyectoCostas/index.htm
F.J. AguilarF.J. Aguilaraa, I. Fernández, I. Fernándezaa, J.L. Pérez, J.L. Pérezbb, A. López, A. Lópezaa, M.A. , M.A. AguilarAguilaraa
A. MozasA. Mozasbb, J. Cardenal, J. Cardenalbb aa Dept. of Agricultural Engineering, Almería University, Spain Dept. of Agricultural Engineering, Almería University, Spain
bb Dept. of Cartographic Engineering, Geodesy and Photogrammetry, Jaén Dept. of Cartographic Engineering, Geodesy and Photogrammetry, Jaén University, SpainUniversity, Spain
Kyoto, Japan. 10 August Kyoto, Japan. 10 August 20102010
Corresponding Author: F.J. Aguilar Corresponding Author: F.J. Aguilar ([email protected])([email protected])

Research Project RNM 3575: Multisource Geospatial Data
Integration and Mining for the Monitoring and Modelling of Coastal Areas Evolution and
Vulnerability
Kyoto, Japan. 10 August Kyoto, Japan. 10 August 20102010
INTRODUCTION
SHORELINE EXTRACTION METHODS
STUDY SITE, DATASETS & METHODOLOGY
RESULTS & DISCUSSION
CONCLUSIONS
1
Detailed coastal topographic information will be the key variable in understanding the likely impacts of global anthropogenic and natural hazards (including SLR due to Climate Change).
The shoreline is one of the most important and critical indicators of coastal evolution and vulnerability

Research Project RNM 3575: Multisource Geospatial Data
Integration and Mining for the Monitoring and Modelling of Coastal Areas Evolution and
Vulnerability
Kyoto, Japan. 10 August Kyoto, Japan. 10 August 20102010
INTRODUCTION
SHORELINE EXTRACTION METHODS
STUDY SITE, DATASETS & METHODOLOGY
RESULTS & DISCUSSION
CONCLUSIONS
Urban development on the coastal area and resource use conflicts spawn environmental degradation and increasing hazard vulnerability. In Spain, more than 44% population are now living in coastal areas (7% of territory)
Anthropic Pressure
Increase of urban areas (soil sealing and change of ISA)
Shortage of planning
Sand extraction to attend the demand from greenhouse crops
2
Research Project RNM 3575: Multisource Geospatial Data
Integration and Mining for the Monitoring and Modelling of Coastal Areas Evolution and
Vulnerability
Kyoto, Japan. 10 August Kyoto, Japan. 10 August 20102010
INTRODUCTION
SHORELINE EXTRACTION METHODS
STUDY SITE, DATASETS & METHODOLOGY
RESULTS & DISCUSSION
CONCLUSIONS
3
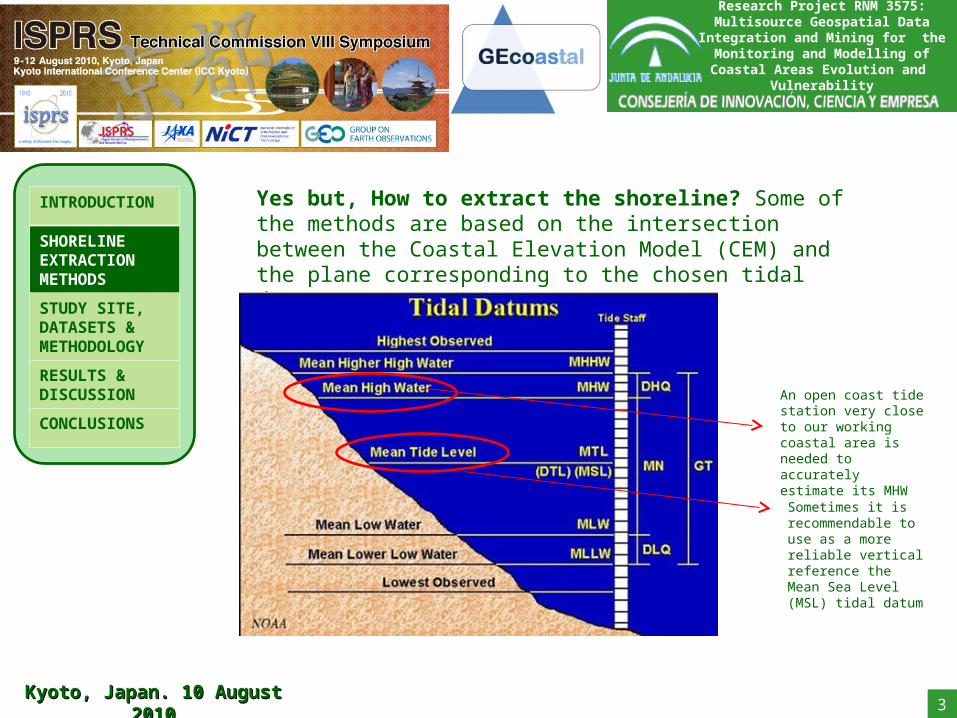
Yes but, How to extract the shoreline? Some of the methods are based on the intersection between the Coastal Elevation Model (CEM) and the plane corresponding to the chosen tidal datum
An open coast tide station very close to our working coastal area is needed to accurately estimate its MHW
Sometimes it is recommendable to use as a more reliable vertical reference the Mean Sea Level (MSL) tidal datum
Research Project RNM 3575: Multisource Geospatial Data
Integration and Mining for the Monitoring and Modelling of Coastal Areas Evolution and
Vulnerability
Kyoto, Japan. 10 August Kyoto, Japan. 10 August 20102010
INTRODUCTION
SHORELINE EXTRACTION METHODS
STUDY SITE, DATASETS & METHODOLOGY
RESULTS & DISCUSSION
CONCLUSIONS
4
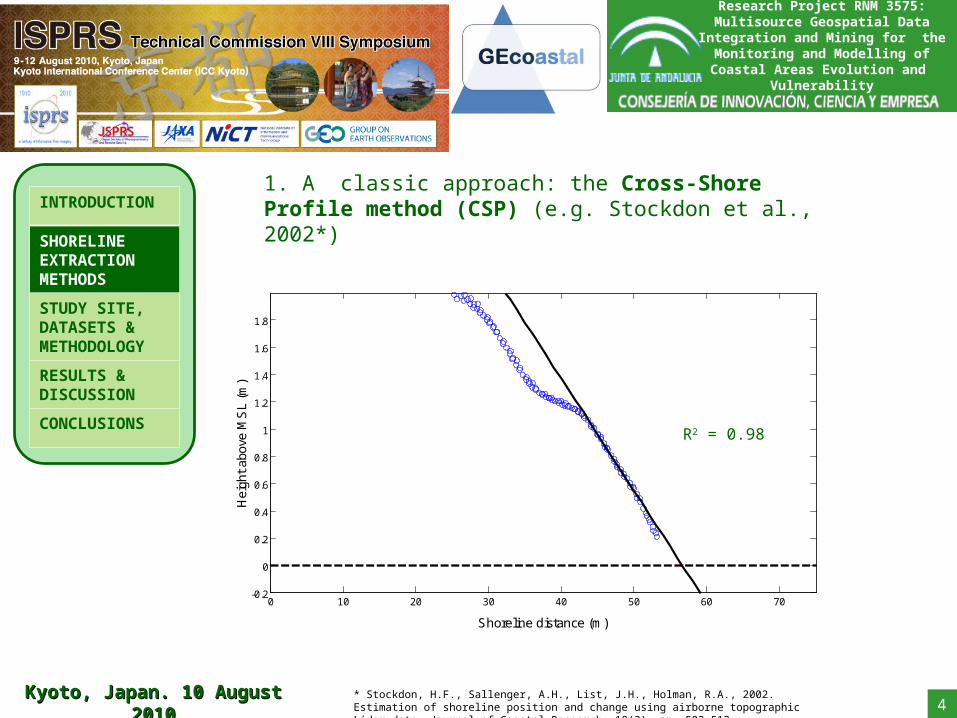
1. A classic approach: the Cross-Shore Profile method (CSP) (e.g. Stockdon et al., 2002*)
0 10 20 30 40 50 60 70-0.2
0
0.2
0.4
0.6
0.8
1
1.2
1.4
1.6
1.8
Shoreline distance (m)
Hei
ght
abov
e M
SL
(m)
R2 = 0.98
* Stockdon, H.F., Sallenger, A.H., List, J.H., Holman, R.A., 2002. Estimation of shoreline position and change using airborne topographic Lidar data. Journal of Coastal Research, 18(3), pp. 502-513.
0 10 20 30 40 50 60 70-0.2
0
0.2
0.4
0.6
0.8
1
1.2
1.4
1.6
1.8
Shoreline distance (m)
Hei
ght
abov
e M
SL
(m)
Research Project RNM 3575: Multisource Geospatial Data
Integration and Mining for the Monitoring and Modelling of Coastal Areas Evolution and
Vulnerability
Kyoto, Japan. 10 August Kyoto, Japan. 10 August 20102010
INTRODUCTION
SHORELINE EXTRACTION METHODS
STUDY SITE, DATASETS & METHODOLOGY
RESULTS & DISCUSSION
CONCLUSIONS
5
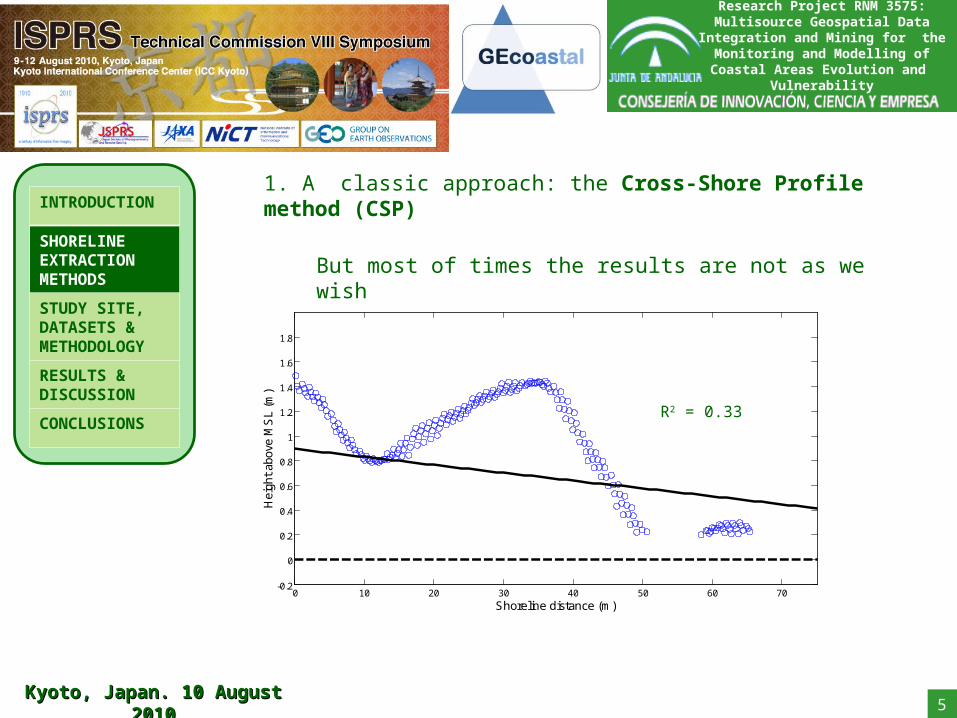
But most of times the results are not as we wish
R2 = 0.33
1. A classic approach: the Cross-Shore Profile method (CSP)
0.68 0.58 0.48
0.44 0 0
0 0 0
-0.24 -0.23 -0.23 -0.10 -0.11 -0.11
-0.24 -0.24 -0.23 -0.10 -0.11 0
-0.24 -0.24 0 -0.10 -0.10 0
1 1 1 1 0 -1
0 0 0 1 0 -1
-1 -1 -1 1 0 -1
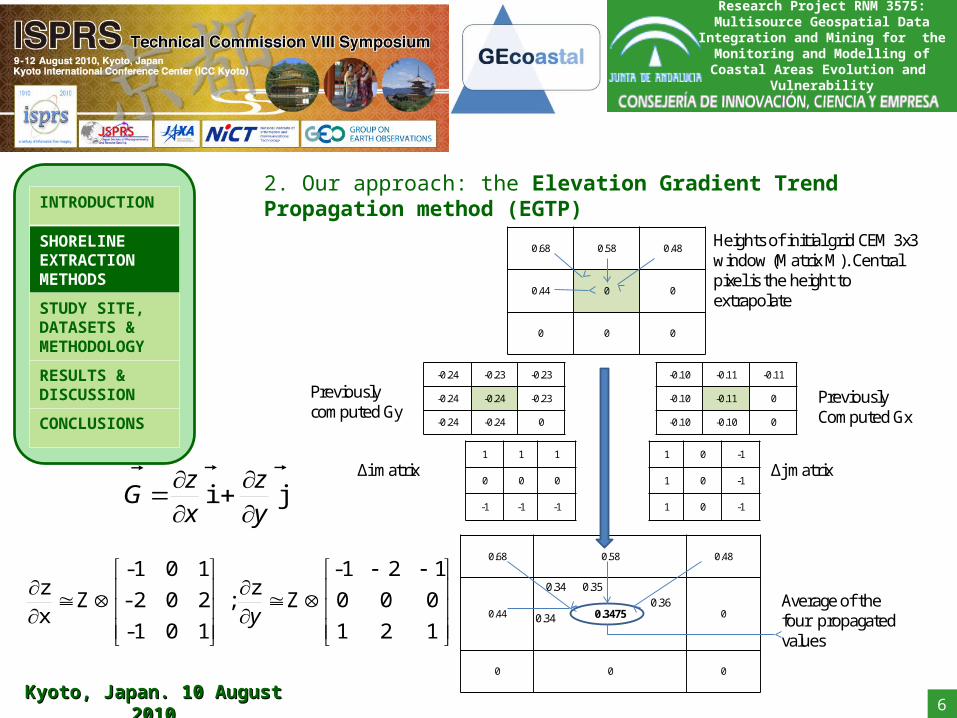
Previouslycomputed Gy
PreviouslyComputed Gx
Heights of initial grid CEM 3x3 window (Matrix M). Central pixel is the height toextrapolate
Δi matrix Δj matrix
0.68 0.58 0.48
0.44 0.3475 0
0 0 0
0.34 0.350.36
0.34Average of thefour propagatedvalues
Research Project RNM 3575: Multisource Geospatial Data
Integration and Mining for the Monitoring and Modelling of Coastal Areas Evolution and
Vulnerability
Kyoto, Japan. 10 August Kyoto, Japan. 10 August 20102010
INTRODUCTION
SHORELINE EXTRACTION METHODS
STUDY SITE, DATASETS & METHODOLOGY
RESULTS & DISCUSSION
CONCLUSIONS
6
2. Our approach: the Elevation Gradient Trend Propagation method (EGTP)
121
000
121-
Zz
;
101-
202-
101-
Zxz
y
ji
yz
xz
G
Research Project RNM 3575: Multisource Geospatial Data
Integration and Mining for the Monitoring and Modelling of Coastal Areas Evolution and
Vulnerability
Kyoto, Japan. 10 August Kyoto, Japan. 10 August 20102010
INTRODUCTION
SHORELINE EXTRACTION METHODS
STUDY SITE, DATASETS & METHODOLOGY
RESULTS & DISCUSSION
CONCLUSIONS
7
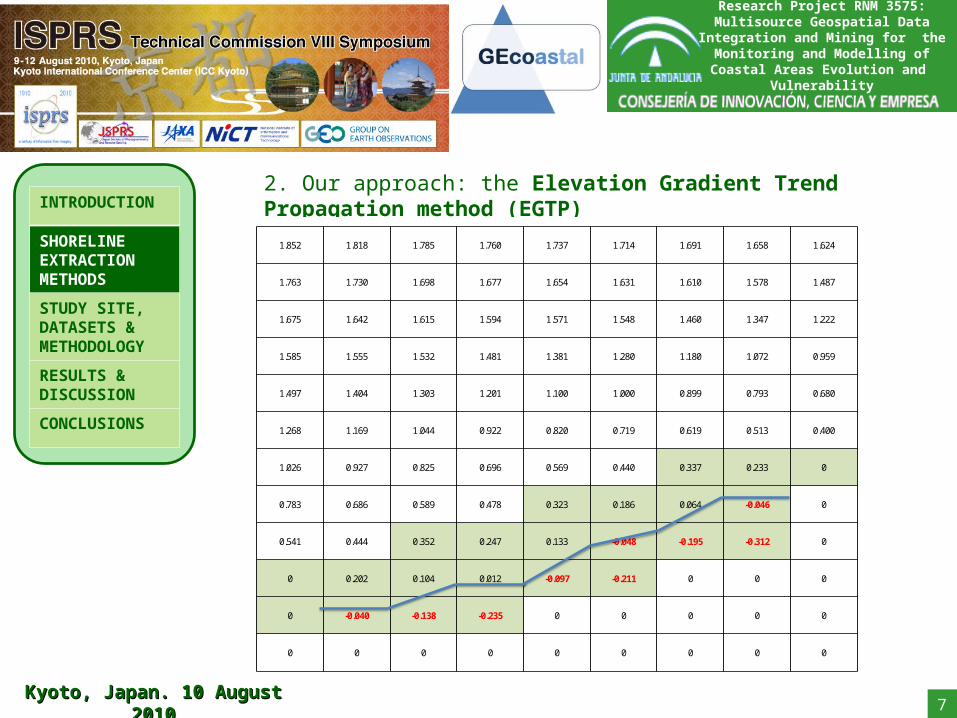
2. Our approach: the Elevation Gradient Trend Propagation method (EGTP)
1.852 1.818 1.785 1.760 1.737 1.714 1.691 1.658 1.624
1.763 1.730 1.698 1.677 1.654 1.631 1.610 1.578 1.487
1.675 1.642 1.615 1.594 1.571 1.548 1.460 1.347 1.222
1.585 1.555 1.532 1.481 1.381 1.280 1.180 1.072 0.959
1.497 1.404 1.303 1.201 1.100 1.000 0.899 0.793 0.680
1.268 1.169 1.044 0.922 0.820 0.719 0.619 0.513 0.400
1.026 0.927 0.825 0.696 0.569 0.440 0.337 0.233 0
0.783 0.686 0.589 0.478 0.323 0.186 0.064 -0.046 0
0.541 0.444 0.352 0.247 0.133 -0.048 -0.195 -0.312 0
0 0.202 0.104 0.012 -0.097 -0.211 0 0 0
0 -0.040 -0.138 -0.235 0 0 0 0 0
0 0 0 0 0 0 0 0 0
Research Project RNM 3575: Multisource Geospatial Data
Integration and Mining for the Monitoring and Modelling of Coastal Areas Evolution and
Vulnerability
Kyoto, Japan. 10 August Kyoto, Japan. 10 August 20102010
INTRODUCTION
SHORELINE EXTRACTION METHODS
STUDY SITE, DATASETS & METHODOLOGY
RESULTS & DISCUSSION
CONCLUSIONS
8

Research Project RNM 3575: Multisource Geospatial Data
Integration and Mining for the Monitoring and Modelling of Coastal Areas Evolution and
Vulnerability
Kyoto, Japan. 10 August Kyoto, Japan. 10 August 20102010
INTRODUCTION
SHORELINE EXTRACTION METHODS
STUDY SITE, DATASETS & METHODOLOGY
RESULTS & DISCUSSION
CONCLUSIONS
9
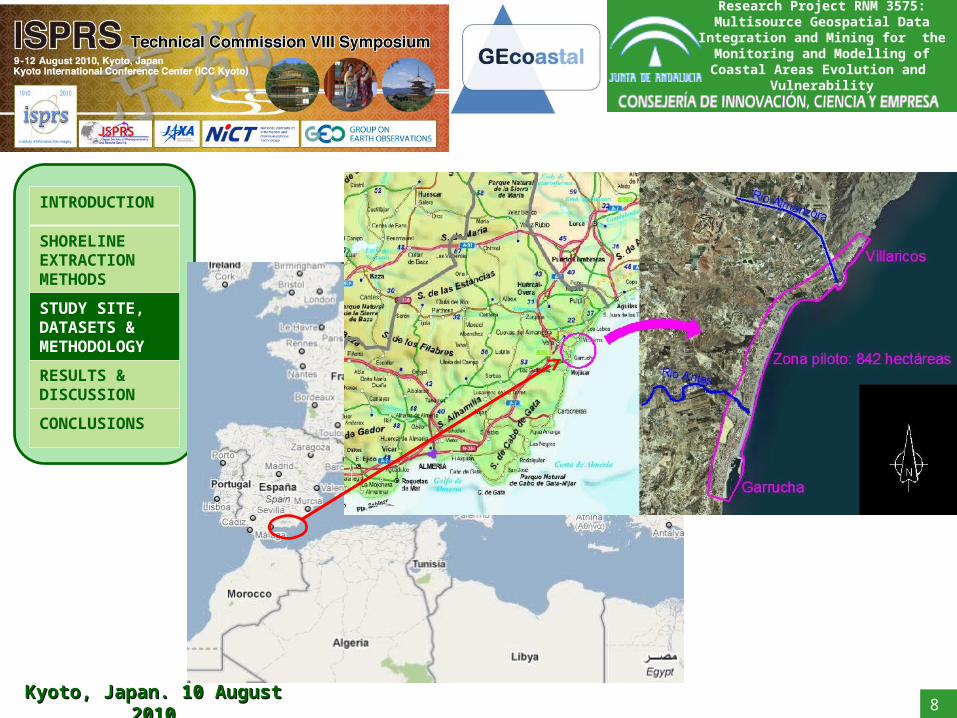
Main wave direction East-West
Average wave height 1 m
Maximum wave height 5 m
Maximum tide range (microtidal coast)
0.5 m
ALMANZORA RIVER MOUTH
Research Project RNM 3575: Multisource Geospatial Data
Integration and Mining for the Monitoring and Modelling of Coastal Areas Evolution and
Vulnerability
Kyoto, Japan. 10 August Kyoto, Japan. 10 August 20102010
INTRODUCTION
SHORELINE EXTRACTION METHODS
STUDY SITE, DATASETS & METHODOLOGY
RESULTS & DISCUSSION
CONCLUSIONS
10
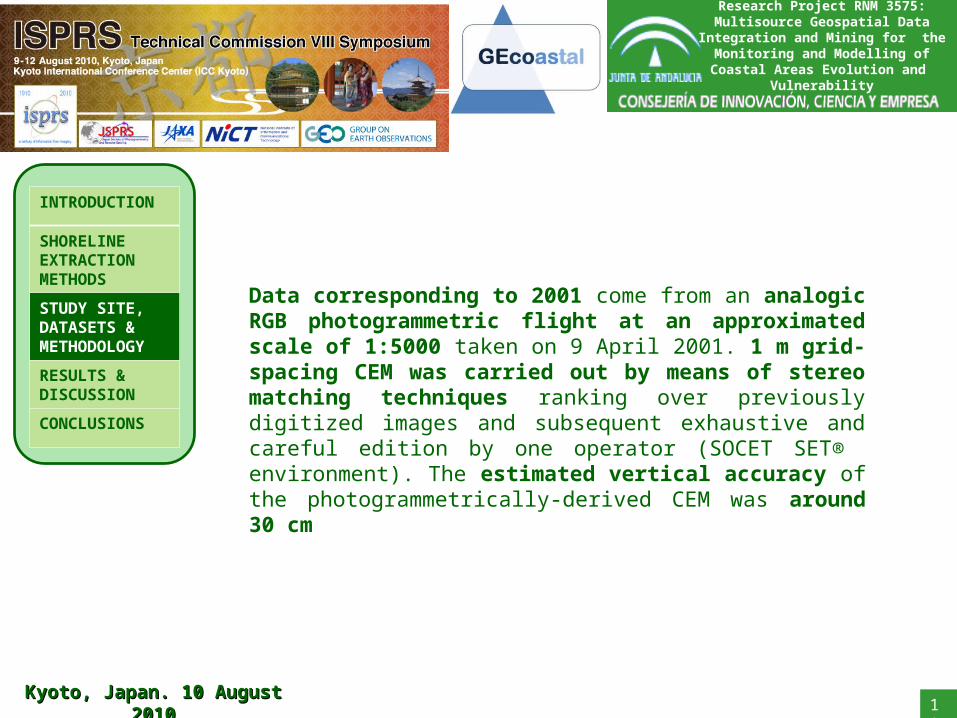
Data corresponding to 2001 come from an analogic RGB photogrammetric flight at an approximated scale of 1:5000 taken on 9 April 2001. 1 m grid-spacing CEM was carried out by means of stereo matching techniques ranking over previously digitized images and subsequent exhaustive and careful edition by one operator (SOCET SET® environment). The estimated vertical accuracy of the photogrammetrically-derived CEM was around 30 cm

Research Project RNM 3575: Multisource Geospatial Data
Integration and Mining for the Monitoring and Modelling of Coastal Areas Evolution and
Vulnerability
Kyoto, Japan. 10 August Kyoto, Japan. 10 August 20102010
INTRODUCTION
SHORELINE EXTRACTION METHODS
STUDY SITE, DATASETS & METHODOLOGY
RESULTS & DISCUSSION
CONCLUSIONS
11
Data corresponding to 2009 come from a combined flight
General information Height above ground: 1000 mNumber of strips: 4Number of photographs: 86
Digital camera DMC (Digital Mapping Camera) IntergraphGSD (cm) 10RGB+Nir (12 bits)Forward overlap (%) 65Side overlap (%) 60
LiDAR sensorALS60 LEICAFOV (º) 35Max. laser pulse Rate (Hz) 96100Max. point spacing across track(m) 1,33Max. point spacing along track (m) 1,46Average point density (points/m2) 1,61Average point space (m) 0,79Average point area (m2) 0,62Estimated height accuracy (m) 0,08

Research Project RNM 3575: Multisource Geospatial Data
Integration and Mining for the Monitoring and Modelling of Coastal Areas Evolution and
Vulnerability
Kyoto, Japan. 10 August Kyoto, Japan. 10 August 20102010
INTRODUCTION
SHORELINE EXTRACTION METHODS
STUDY SITE, DATASETS & METHODOLOGY
RESULTS & DISCUSSION
CONCLUSIONS
12
Methodology to compute the corresponding shoreline change rate between 2001 and 2009
End Point Rate (EPR) Computation (m/year) erosion (-) or accretion (+)
BAd
dBA
XsXsdABd
d
td
-XsXsd-μd
tBA
05.00
22
ˆ0:H
;ˆ ;ˆ
95% confidence level
T2
22
BA XsXsEPR

Research Project RNM 3575: Multisource Geospatial Data
Integration and Mining for the Monitoring and Modelling of Coastal Areas Evolution and
Vulnerability
Kyoto, Japan. 10 August Kyoto, Japan. 10 August 20102010
INTRODUCTION
SHORELINE EXTRACTION METHODS
STUDY SITE, DATASETS & METHODOLOGY
RESULTS & DISCUSSION
CONCLUSIONS
13
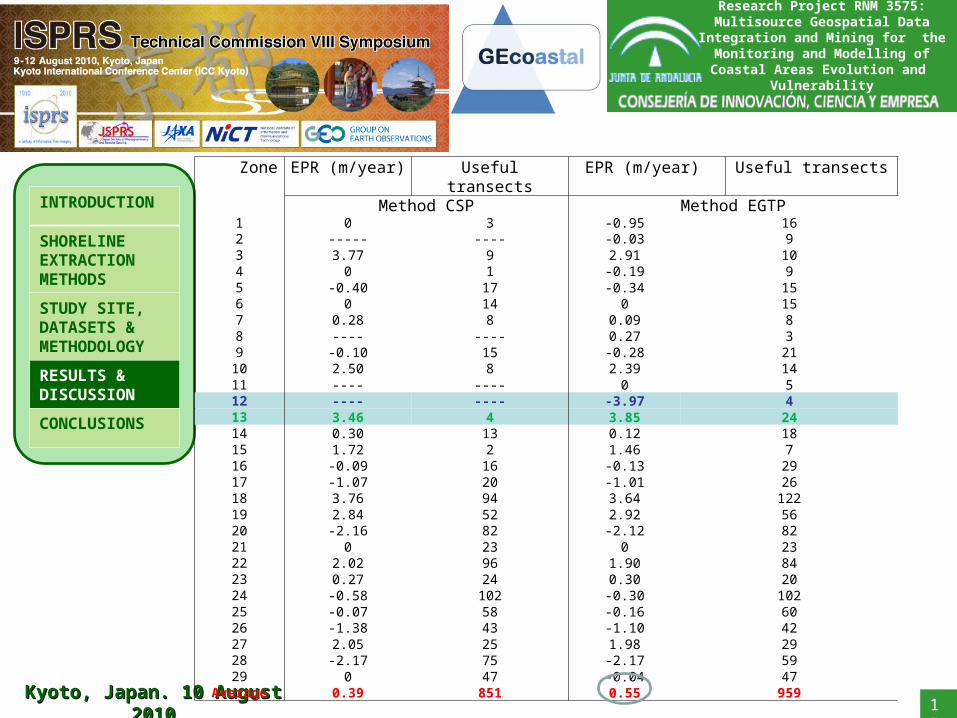
Performance of the Two Tested Shoreline Mapping Methods
Year Transects lost Uncertainty (σxs)
CSP EGTP CSP EGTP
2001 12.84% 3.19% 2.95 4.10 m
2009 12.18% 1.54% 1.05 m 1.48 m
CSP method seems to be quite sensitive to noise due to an incorrect separation between water and land, unexpected artifacts along foreshore profile or actually non-straight profiles.
EGTP can be deemed as much more robust than CSP, maintaining a greater number of useful transects
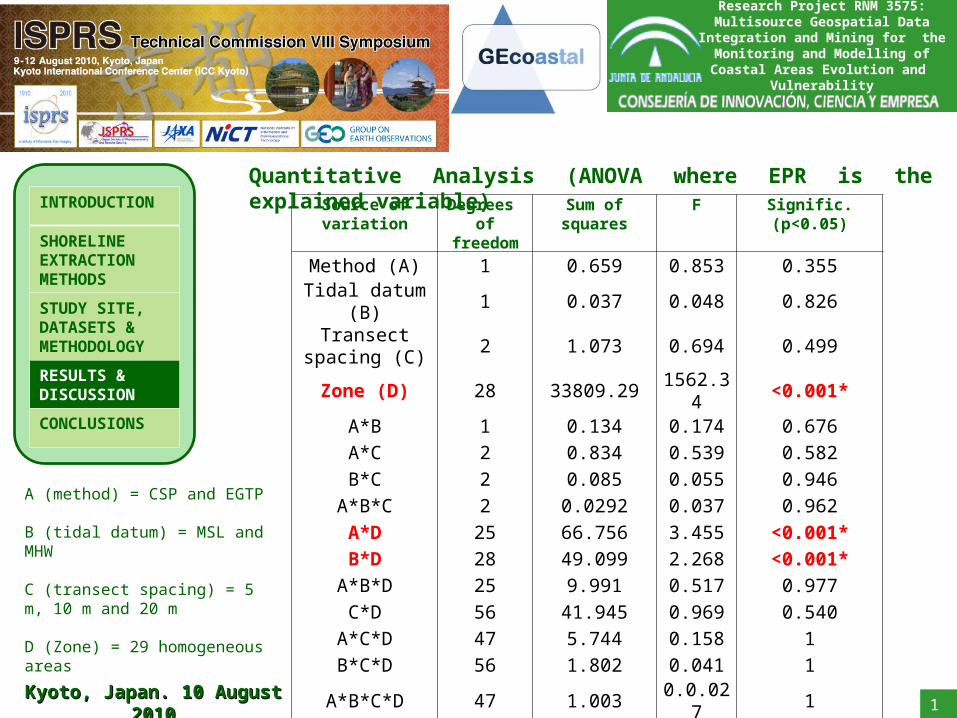
Source of variation Degrees of freedom
Sum of squares F Signific. (p<0.05)
Method (A) 1 0.659 0.853 0.355
Tidal datum (B) 1 0.037 0.048 0.826
Transect spacing (C)
2 1.073 0.694 0.499
Zone (D) 28 33809.29 1562.34 <0.001*
A*B 1 0.134 0.174 0.676
A*C 2 0.834 0.539 0.582
B*C 2 0.085 0.055 0.946
A*B*C 2 0.0292 0.037 0.962
A*D 25 66.756 3.455 <0.001*
B*D 28 49.099 2.268 <0.001*
A*B*D 25 9.991 0.517 0.977
C*D 56 41.945 0.969 0.540
A*C*D 47 5.744 0.158 1
B*C*D 56 1.802 0.041 1
A*B*C*D 47 1.003 0.0.027 1
Error 12412 9592.72
Research Project RNM 3575: Multisource Geospatial Data
Integration and Mining for the Monitoring and Modelling of Coastal Areas Evolution and
Vulnerability
INTRODUCTION
SHORELINE EXTRACTION METHODS
STUDY SITE, DATASETS & METHODOLOGY
RESULTS & DISCUSSION
CONCLUSIONS
14
Quantitative Analysis (ANOVA where EPR is the explained variable)
A (method) = CSP and EGTP
B (tidal datum) = MSL and MHW
C (transect spacing) = 5 m, 10 m and 20 m
D (Zone) = 29 homogeneous areas
Kyoto, Japan. 10 August Kyoto, Japan. 10 August 20102010
Research Project RNM 3575: Multisource Geospatial Data
Integration and Mining for the Monitoring and Modelling of Coastal Areas Evolution and
Vulnerability
INTRODUCTION
SHORELINE EXTRACTION METHODS
STUDY SITE, DATASETS & METHODOLOGY
RESULTS & DISCUSSION
CONCLUSIONS
15Kyoto, Japan. 10 August Kyoto, Japan. 10 August
20102010
Zone EPR (m/year) Useful transects EPR (m/year) Useful transects
Method CSP Method EGTP1 0 3 -0.95 162 ----- ---- -0.03 93 3.77 9 2.91 104 0 1 -0.19 95 -0.40 17 -0.34 156 0 14 0 157 0.28 8 0.09 88 ---- ---- 0.27 39 -0.10 15 -0.28 2110 2.50 8 2.39 1411 ---- ---- 0 512 ---- ---- -3.97 413 3.46 4 3.85 2414 0.30 13 0.12 1815 1.72 2 1.46 716 -0.09 16 -0.13 2917 -1.07 20 -1.01 2618 3.76 94 3.64 12219 2.84 52 2.92 5620 -2.16 82 -2.12 8221 0 23 0 2322 2.02 96 1.90 8423 0.27 24 0.30 2024 -0.58 102 -0.30 10225 -0.07 58 -0.16 6026 -1.38 43 -1.10 4227 2.05 25 1.98 2928 -2.17 75 -2.17 5929 0 47 -0.04 47
Average 0.39 851 0.55 959

Research Project RNM 3575: Multisource Geospatial Data
Integration and Mining for the Monitoring and Modelling of Coastal Areas Evolution and
Vulnerability
INTRODUCTION
SHORELINE EXTRACTION METHODS
STUDY SITE, DATASETS & METHODOLOGY
RESULTS & DISCUSSION
CONCLUSIONS
16Kyoto, Japan. 10 August Kyoto, Japan. 10 August
20102010
ORTHOPHOTO 2009
PUNTA DE LOS HORNICOS
1989
2001
2009

Research Project RNM 3575: Multisource Geospatial Data
Integration and Mining for the Monitoring and Modelling of Coastal Areas Evolution and
Vulnerability
INTRODUCTION
SHORELINE EXTRACTION METHODS
STUDY SITE, DATASETS & METHODOLOGY
RESULTS & DISCUSSION
CONCLUSIONS
17Kyoto, Japan. 10 August Kyoto, Japan. 10 August
20102010
PALOMARES BEACH
VERA BEACH
1989
2009
2001

Research Project RNM 3575: Multisource Geospatial Data
Integration and Mining for the Monitoring and Modelling of Coastal Areas Evolution and
Vulnerability
INTRODUCTION
SHORELINE EXTRACTION METHODS
STUDY SITE, DATASETS & METHODOLOGY
RESULTS & DISCUSSION
CONCLUSIONS
18Kyoto, Japan. 10 August Kyoto, Japan. 10 August
20102010
VERA BEACH
1989
2009
2001
ACCRETION
EROSION

Research Project RNM 3575: Multisource Geospatial Data
Integration and Mining for the Monitoring and Modelling of Coastal Areas Evolution and
Vulnerability
INTRODUCTION
SHORELINE EXTRACTION METHODS
STUDY SITE, DATASETS & METHODOLOGY
RESULTS & DISCUSSION
CONCLUSIONS
19Kyoto, Japan. 10 August Kyoto, Japan. 10 August
20102010
QUITAPELLEJOS BEACH

Research Project RNM 3575: Multisource Geospatial Data
Integration and Mining for the Monitoring and Modelling of Coastal Areas Evolution and
Vulnerability
INTRODUCTION
SHORELINE EXTRACTION METHODS
STUDY SITE, DATASETS & METHODOLOGY
RESULTS & DISCUSSION
CONCLUSIONS
20Kyoto, Japan. 10 August Kyoto, Japan. 10 August
20102010
• The new grid-based approach can be strongly recommended because its precision, local slope acquisition, robustness regarding the presence of noise and outliers, and capability to deal with very curved and even closed coastal features.
• The preliminary results also indicate that, though the global rate-of-change for the whole coastline between 2001 and 2009 may be catalogued as relatively low (0.55 ± 0.50 m/year of net accretion), the local results for every one of the 29 homogeneous units considered have been extremely variable and statistically significant.
• Many local phenomena, registered in a short-term period and mainly due to human activities such as the presence of new engineered structures and artificial beach regeneration, may strongly affect the shoreline evolution in certain and localized areas
Research Project RNM 3575: Multisource Geospatial Data
Integration and Mining for the Monitoring and Modelling of Coastal Areas Evolution and
Vulnerability
INTRODUCTION
SHORELINE EXTRACTION METHODS
STUDY SITE, DATASETS & METHODOLOGY
RESULTS & DISCUSSION
CONCLUSIONS
21Kyoto, Japan. 10 August Kyoto, Japan. 10 August
20102010
Thank you very much for your kind attention

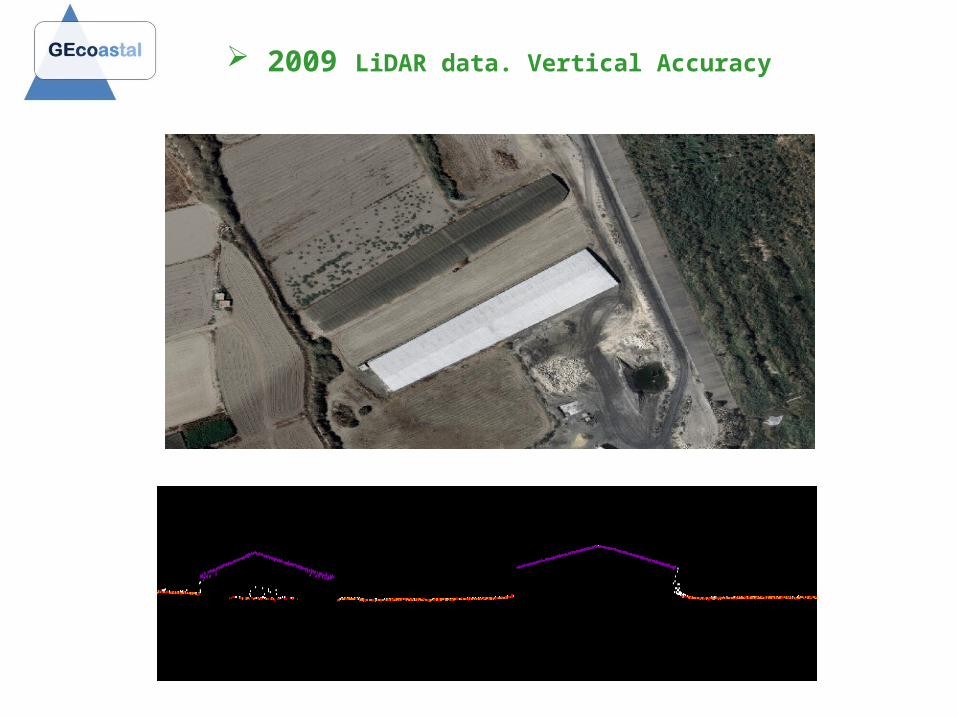
2009 LiDAR data. Vertical Accuracy
Average dz +0.029 Minimum dz -0.284 Maximum dz +0.180 Std deviation 0.089N = 62
2009 LiDAR data. Vertical Accuracy

tgα
ez
Ground truth
MDE
elc MSL
tg
ee z
lc
HIGH WATER LINE
Kyoto, Japan. 10 August Kyoto, Japan. 10 August 20102010
INTRODUCTION
SHORELINE EXTRACTION METHODS
STUDY SITE, DATASETS & METHODOLOGY
RESULTS & DISCUSSION
CONCLUSIONS
2
,
,2
,
bba
baaba Cov
CovD
baxz
ˆ
)ˆ(),( 2
ˆˆ
)ˆ(32
2b
4
22a2
regression xs abm
baCovaa
bm
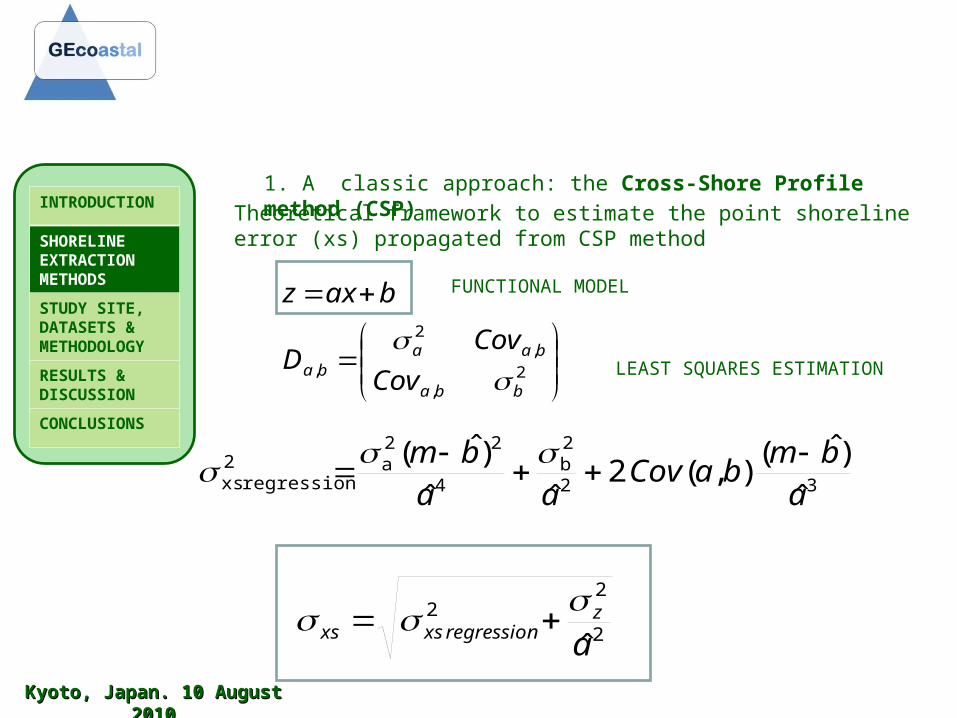
LEAST SQUARES ESTIMATION
ˆ 2
22
az
regressionxsxs
Theoretical framework to estimate the point shoreline error (xs) propagated from CSP method
FUNCTIONAL MODEL
1. A classic approach: the Cross-Shore Profile method (CSP)

Kyoto, Japan. 10 August Kyoto, Japan. 10 August 20102010
INTRODUCTION
SHORELINE EXTRACTION METHODS
STUDY SITE, DATASETS & METHODOLOGY
RESULTS & DISCUSSION
CONCLUSIONS
9
2. Our approach: the Elevation Gradient Trend Propagation method (EGTP)
Computed uncertainty for the shoreline determination
2 z
2propagated
2 total CEMzz
C
..
2
,
22
22
2
2propagated
ji
totalGytotalGxz
z
yxijijij
4
22
2
2
A022
z2AB
2slope
0
;d
1
;
A slope
z
slope
slope
-zxd
d
zzslope
Aslopezxsz
AsA
AB
AB
A
B