preliminary results for the year ended 31 march 2021
TRANSCRIPT

Preliminary results for the year ended 31 March 2021
Vodacom Group Limited
We connect for a better future

In a year unavoidably shaped by the devastating impacts of the global health crisis, Vodacom Group accelerated the delivery of our Social Contract with stakeholders to ensure we made meaningful contributions in markets where we operate.
Vodacom Group has been at the forefront of helping governments curb the spread of COVID-19 where we operate, having swiftly responded earlier this year through strategic partnerships with the likes of Discovery Health and Microsoft®, and a wide range of initiatives including free devices and airtime for healthcare workers, accelerating support to governments via donations of handsets, connectivity and medical equipment, and making contactless payments more accessible through zero-rated services and an expanded M-Pesa ecosystem to address social distancing challenges.
Shameel Joosub
Vodacom Group CEO commented:
Alongside the Vodafone Foundation, we recently announced a R74 million financial pledge to support the roll-out of cold-chain technology and provide logistics support to ensure the safe delivery of COVID-19 vaccines to vulnerable and hard-to-reach communities in South Africa, DRC, Mozambique, Ghana and Tanzania. We also made a R13 million donation to Lesotho to assist with securing vaccines for the Basotho people. We have partnered with AUDA – NEPAD to build digital infrastructure to manage the distribution of COVID-19 vaccinations in up to 55 countries, following successful deployments in South Africa, leveraging our mVacciNation platform.
These latest initiatives are over and above the R2 billion service revenue impact of zero-rating peer-to-peer (P2P) M-Pesa transactions in our International markets, a R3 billion service revenue impact of lowering data pricing in South Africa and the R176 million cash and in-kind donations made by the Vodacom and Vodafone Group Foundations in response to the pandemic.
We are proud to be standing shoulder to shoulder with the African Union and national governments to provide practical support for what is an enormous logistical challenge for resource-limited African countries with significant rural populations.
We invested
R13.3 billion
in network infrastructure during the year,
We serve
57.7 million
financial services customers,

Given the sudden shifts in customer behaviour patterns, we invested heavily in the resilience of our networks to cope with significant increases in mobile data traffic volumes to keep families connected, enable businesses to operate, facilitate online learning and assist governments in providing critical services. We invested R13.3 billion in network infrastructure during the year, including R10.1 billion in South Africa, and as a Group we have invested R62.4 billion into our networks over the past five years.
Customers in South Africa have also taken advantage of ConnectU, which provides zero-rated access to a wide range of websites, including job portals and online learning platforms and discounted offers for poor communities, as well as the significant data price cuts implemented on 1 April 2020 and the recently announced 14% decline in our headline monthly data price to R85 per Gigabyte as part of our ongoing commitment to reduce the cost to communicate.
Underpinned by the recovery in our International portfolio in the second half of the year and strong growth from our prepaid and Enterprise segments, Financial Services and other new services in South Africa, the Vodacom Group reported a 5.8% increase in service revenue and an 825 cents per share total ordinary dividend per share. This is particularly pleasing in a difficult trading environment and is testament to the rapid manner in which the company and its employees adapted to the crisis.
In South Africa, service revenue grew by 7.0% on the back of increased data usage, our highly successful summer campaign and demand for financial services – collectively helping to offset numerous initiatives aimed at delivering greater value to customers, including tariff reductions of up to 40% at the beginning of the financial year and the successful launch of Vodabucks, our behavioural loyalty programme.
Our International operations reported muted service revenue growth of 1.6% in the year, with a stronger second half helping offset the significant impacts of COVID-19 earlier in the year. This performance was characterised by disruption to our commercial activities as a result of the informal structure of the economies in which we operate, currency volatility, increased pressure on consumer spend, free M-Pesa P2P transactions and the impact of service barring in Tanzania due to biometric registration compliance.
Zero-rating P2P M-Pesa transactions for the majority of the financial year was the right thing to do for our customers and facilitated economic activity. This initiative introduced the M-Pesa ecosystem to a significantly broader base and continues to support accelerated platform growth and customer adoption of digital channels. Through M-Pesa, we now process US$24.5 billion (R366.4 billion) a month in transaction value across our International markets, including Safaricom, up 63.5%. We serve 57.7 million financial services customers, including Safaricom, generating revenue of R19.3 billion in the year. From January 2021, all our markets, including Safaricom, re-implemented P2P charging.
Our strategic investment in Safaricom comprised almost 13% of our operating profit in the year. Safaricom’s local currency results reflected the impact of depressed economic activity and free M-Pesa P2P transfers, related to the COVID-19 pandemic. Positively, Safaricom’s commitment to its strategic goals, supported strong platform growth for M-Pesa and higher connectivity usage. This supported a notable recovery in service revenue growth through the financial year, with fourth quarter growth at 6.4%.
Looking forward, while being cognisant that disposable income will remain under pressure, we are increasingly optimistic about improved growth prospects for our International operations. In South Africa, the allocation of temporary spectrum has supported network capacity and highlights the urgent need for high demand spectrum to be allocated through ICASA’s ITA process. We continue to see the assignment of high demand spectrum as instrumental to data pricing.
We remain focused on entrenching Vodacom Group as a leading pan-African technology company through our investments into financial, digital and lifestyle services as these increasingly provide opportunities to enhance our relationship with the 123.7 million customers we serve across our footprint. In particular, we are excited about our partnership with Alipay and the imminent launch of our single lifestyle app, VodaPay, in South Africa. Our super-app will offer services ranging from loans and savings, seamless QR and person-to-person payments, to entertainment and personalised shopping experiences, promoting greater financial inclusion. We see this super-app as a precursor to M-Pesa’s evolution, supporting accelerated growth across our financial services’ businesses and assisting us in connecting the next 100 million African customers so that no one is left behind.
1Vodacom Group Limited
Preliminary results for the year ended 31 March 2021

Highlights
2
Group revenue
up 8.3%
(7.4%*) to R98.3 billion, supported by service revenue growth of 5.8% (4.7%*).
Added 8.2 million customers, to serve a combined 123.7 million customers across the Group, including Safaricom.
South Africa service revenue grew
7.0%,
with consistent growth through the financial year. Medium-term operating
profit growth target upgraded from mid-single digit to mid-to-high-single digit, on improved growth prospects for International and Safaricom.
Total financial services customers, including Safaricom,
up 12.9%
or 6.6 million to 57.7 million.
Earnings per share
up 4.2%
and headline earnings per share
up 3.7%.
Declared a final dividend of
410cps.
Certain financial information presented in this results announcement constitutes pro-forma financial information in terms of the JSE Listings Requirements. The applicable criteria on the basis of which this pro-forma financial information has been prepared is set out in the supplementary information on pages 46 to 51. The pro-forma financial information includes:
* Normalised growth presents performance on a comparable basis. This adjusts for trading foreign exchange, foreign currency fluctuation on a constant currency basis (using the current year as base) and excludes the impact of merger, acquisition and disposal activities, at a constant currency basis where applicable, to show a like-for-like comparison of results.
Amounts marked with an * in this document represent normalised growth as defined above.
All growth rates quoted are year-on-year and refer to the year ended 31 March 2021 compared to the year ended 31 March 2020, unless stated otherwise.

Notes:1. EBITDA margin is EBITDA as a percentage of revenue.2. Detail relating to capital expenditure is on page 13. Capital intensity is capital expenditure as a percentage of revenue.3. A reconciliation of operating free cash flow and free cash flow is set out on page 51.
3Vodacom Group Limited
Preliminary results for the year ended 31 March 2021
Year ended 31 March % change
Rm 2021 2020 Reported Normalised*
Revenue 98 302 90 746 8.3 7.4Service revenue 77 574 73 354 5.8 4.7EBITDA 39 299 37 610 4.5 3.6Net profit from associate and joint ventures 3 501 4 149 (15.6) 3.9Operating profit 27 652 27 711 (0.2) 2.2Net profit 17 071 16 644 2.6Earnings per share (cents) 978 939 4.2Headline earnings per share (cents) 980 945 3.7Total dividend per share (cents) 825 845 (2.4)
– special dividend per share (cents) – 60 n/a– ordinary dividend per share (cents) 825 785 5.1
Statutory performance measures
Year ended 31 March % change
Rm 2021 2020 Reported
EBITDA margin1 (%) 40.0 41.4 (1.4ppt)Capital expenditure2 13 307 13 218 0.7Capital intensity2 (%) 13.5 14.6 (1.1ppt)Operating free cash flow3 22 030 21 782 1.1Free cash flow3 14 974 16 284 (8.0)
Alternative performance measures

1. Adjusted for a reclassification of IoT revenue from other service revenue to customer revenue. There was no impact on overall service revenue as a result of this reclassification.
2. Including Bitstream, which refers to where we act as an internet service provider (ISP) to fibre wholesalers.
South Africa
Summary financial informationYear ended 31 March % change
Rm 2021 2020 Reported
Service revenue 56 405 52 712 7.0EBITDA 30 745 29 094 5.7Operating profit 20 515 19 684 4.2Capital expenditure 10 076 9 860 2.2
We prioritised investing in network infrastructure, providing free devices and airtime to healthcare workers, implementing track-and-trace technology, accelerating support to the government and driving digital and financial inclusion to help South Africa navigate the COVID-19 pandemic. Our R10.1 billion capital investment facilitated network capacity and resilience to accommodate the increased data volumes stimulated by our 1 April 2020 data price cuts and changes in customer usage patterns, as work, entertainment and education shifted to the home. During the year, 15.5 million unique users visited our zero-rated ConnectU platform to access a wide range of websites – including job and e-learning portals and discounted offers for vulnerable communities. Looking ahead, our Mezzanine platform will provide critical support for the roll-out of COVID-19 vaccines.
From a financial perspective, South Africa reported strong service revenue growth of 7.0% to R56.4 billion. The growth was fuelled by increased demand for connectivity, particularly in prepaid and Vodacom Business and new services such as IoT and financial services. Furthermore, the performance was enabled by our industry leading investment into new services, networks and digital IT capabilities such as business and artificial intelligence (AI). Revenue increased by 10.3%, underpinned by service revenue growth, a recovery in equipment sales and growth in tower sharing revenue.
Mobile contract customer revenue increased by 5.0% to R20.8 billion, a resilient performance given the economic backdrop. Within the mobile contract segment, Vodacom Business continued to deliver growth in the fourth quarter while consumer contract revenue remained broadly unchanged year-on-year. We recorded positive contract customer net additions of 133 000 in the year while ARPU increased by 2.1% (adjusted growth 1.4%1) and 7.0% (adjusted growth 3.1%1) in the year and the fourth quarter, respectively.
In the prepaid segment, mobile customer revenue increased by 8.5%. Prepaid net additions for the year were a substantial 2.6 million, reflecting our summer campaign’s success and new behavioural loyalty programme – which provided more reasons to consume and facilitate our active days’ management initiative. ARPU increased 13.0% to R61 supported by increased usage of our connectivity and digital services and the accessibility of airtime via our Airtime Advance product. In the fourth quarter, Airtime Advanced amounted to 43.0% of total prepaid recharges in the quarter (4Q20: 35.9%).
Data traffic increased by 55.6%, as the growth trend normalised in the last two quarters of the financial year as lockdown restrictions eased. Data customer net losses were 0.2 million in the year, ending on 21.7 million customers, as we focused on optimising gross additions. Smart devices on our network were up by 9.5% to 23.2 million, while 4G devices on our network increased by 22.0% to 15.7 million. The average usage per smart device increased by 38.9% to 2.1GB per month. We accelerated our fibre roll-out during the year, more than doubling the total number of homes and businesses connected2 to 126 765. Our own fibre passed 146 401 homes and businesses as at 31 March 2021.
Service revenue generated from Financial Services was up by 18.9% to R2.4 billion, while customers increased by 15.4% to 13.3 million. Our Financial Services’ result reflects our execution capability in this space. Revenue growth was underpinned by our Airtime Advance product, where we advanced R12.0 billion in airtime during the year, an increase of 21.1%. The number of Airtime Advance customers increased 17.3% to 10.8 million. Insurance policies increased by 8.3% to 2.1 million.
Operating review
4
1. Adjusted for a reclassification of IoT revenue from other service revenue to customer revenue. There was no impact on overall service revenue as a result of this reclassification.
Vodacom Business service revenue increased by 11.3% to R15.9 billion, supported by our innovative work-from-home solutions. Our Vodacom Business fixed service revenue grew by 6.5%, excluding wholesale transit, supported by strong growth in cloud as well as hosting and connectivity revenue. IoT connections increased by 6.4% to 5.6 million with revenue growth at 32.8% to R1.1 billion1.
EBITDA grew 5.7%, while margins contracted 1.7ppts in the year. The EBITDA performance was supported by strong service revenue growth but was moderated by COVID-19 related bad debt provisions and investment into future growth areas such as a 5G roaming deal with Liquid Intelligent Technologies (Liquid). Excluding the impact of our roaming deals with Rain and Liquid, the EBITDA margin was broadly flat year-on-year. Operating profit growth at 4.2% was driven by EBITDA growth, although partially offset by higher depreciation. Depreciation and amortisation increased 10.2% as a result of capital expenditure phasing and asset mix.
In the forthcoming financial year, we expect South Africa to deliver service revenue growth in line with our medium-term Group target. We are particularly excited about the launch of our lifestyle companion app, VodaPay. We expect that the app and the ongoing expansion of our financial service offerings will promote digital and financial inclusion and provide a growth platform for consumers and merchants in South Africa.
International
Summary financial informationYear ended 31 March % change
Rm 2021 2020 Reported Normalised*
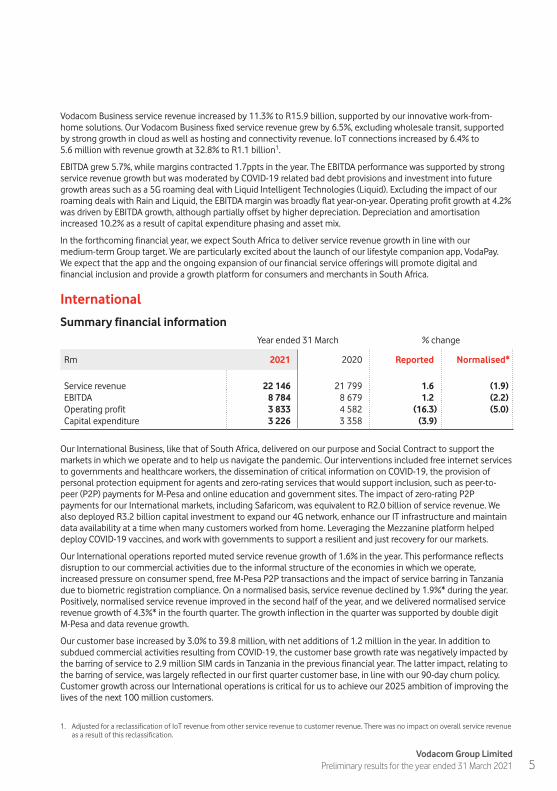
Service revenue 22 146 21 799 1.6 (1.9)EBITDA 8 784 8 679 1.2 (2.2)Operating profit 3 833 4 582 (16.3) (5.0)Capital expenditure 3 226 3 358 (3.9)
Our International Business, like that of South Africa, delivered on our purpose and Social Contract to support the markets in which we operate and to help us navigate the pandemic. Our interventions included free internet services to governments and healthcare workers, the dissemination of critical information on COVID-19, the provision of personal protection equipment for agents and zero-rating services that would support inclusion, such as peer-to-peer (P2P) payments for M-Pesa and online education and government sites. The impact of zero-rating P2P payments for our International markets, including Safaricom, was equivalent to R2.0 billion of service revenue. We also deployed R3.2 billion capital investment to expand our 4G network, enhance our IT infrastructure and maintain data availability at a time when many customers worked from home. Leveraging the Mezzanine platform helped deploy COVID-19 vaccines, and work with governments to support a resilient and just recovery for our markets.
Our International operations reported muted service revenue growth of 1.6% in the year. This performance reflects disruption to our commercial activities due to the informal structure of the economies in which we operate, increased pressure on consumer spend, free M-Pesa P2P transactions and the impact of service barring in Tanzania due to biometric registration compliance. On a normalised basis, service revenue declined by 1.9%* during the year. Positively, normalised service revenue improved in the second half of the year, and we delivered normalised service revenue growth of 4.3%* in the fourth quarter. The growth inflection in the quarter was supported by double digit M-Pesa and data revenue growth.
Our customer base increased by 3.0% to 39.8 million, with net additions of 1.2 million in the year. In addition to subdued commercial activities resulting from COVID-19, the customer base growth rate was negatively impacted by the barring of service to 2.9 million SIM cards in Tanzania in the previous financial year. The latter impact, relating to the barring of service, was largely reflected in our first quarter customer base, in line with our 90-day churn policy. Customer growth across our International operations is critical for us to achieve our 2025 ambition of improving the lives of the next 100 million customers.
5Vodacom Group Limited
Preliminary results for the year ended 31 March 2021
Data services remain a key lever of growth and central to our commitment to connecting for a better future. We added 661 000 new customers during the year to end the period at 20.6 million data customers. Of these customers, only 11 million were on smartphones – highlighting the potential for further smartphone penetration. We continue to drive the adoption of affordable smartphone devices, and support digital inclusion, by leveraging partnerships with global technology firms and innovative financing options. Data revenue grew 6.5% in constant currency during the year, with data revenue growth in constant currency improving to 11.0% in the fourth quarter. Overall data traffic growth for the year was buoyant at 51.6%, due to network investments and affordable commercial propositions.
M-Pesa revenue was up 13.0% (5.8%*) to R4.5 billion in the year, contributing 20.4% of International service revenue. Pleasingly, platform growth and the reintroduction of P2P charging across all our markets from 1 January 2021 supported a meaningful acceleration of normalised M-Pesa revenue growth to 21.0%, in the fourth quarter. Accelerating platform adoption, measured by customer and transaction growth, and product expansion provide a robust growth outlook for M-Pesa. International M-Pesa customers were up 9.6% to 16.1 million, representing 47.4% of our total International customer base. The M-Pesa ecosystem in all our International markets, including Safaricom, processed US$24.5 billion a month in transactions in the fourth quarter, up 63.5%.
International EBITDA was up 1.2%, in line with revenue growth of 1.1%. Consistent with the service revenue and revenue profile, EBITDA margins recovered during the second half and offset the margin decline of 2.7ppts reported in the first half. The full year margin performance reflected disciplined cost containment, despite inflationary cost pressures.
Operating profit declined 16.3%, with the prior year period boosted by a purchase gain of R532 million. This gain was as a result of the acquisition of the M-Pesa brand, product development and support services from Vodafone Group Plc through a newly-created joint venture, M-Pesa Africa. M-Pesa Africa, co-ordinates and implements our M-Pesa strategy, driving product expansion and leveraging best practices across the portfolio. On a normalised basis, operating profit declined 5.0%. This reflects the pressure on normalised EBITDA, which declined 2.2%.
Our capital investment of R3.2 billion was focused mainly on expanding our 4G network. Our network reach improved by 322 3G and 1 072 4G base stations, and we continued to invest in our transmission networks to enhance our network leadership in all our markets.
Looking ahead, we are optimistic about improved growth prospects for our International operations. We expect operating profit growth in the forthcoming financial year to track ahead of the medium-term Group target.
SafaricomSafaricom’s results reflect a challenging year and were impacted by depressed economic activity and free M-Pesa P2P related to the COVID-19 pandemic. Service revenue and EBITDA declined 0.3% and 2.8% respectively in the financial year. Despite growth pressures, Safaricom ensured that its network, operations and maintenance and financial services were prioritised to limit disruptions. Capital expenditure was KShs35.0 billion (R5.2 billion) for the year, representing an intensity ratio of 13.2%, supporting its digital technology journey and the evolving consumption patterns of its customer base.
Safaricom’s commitment to its strategic goals, supported platform growth for M-Pesa and higher connectivity usage. Safaricom added 3.4 million M-Pesa customers and 4.3 million total customers for the year ended 31 March 2021. Mobile data grew 11.5% sustaining the recovery from the prior year, with 4G devices using more than 1GB per month up to 4.7 million. Fibre-to-the-home customers grew 31.5% as Safaricom supported work and learn-from-home with higher bandwidth.
M-Pesa revenues declined 2.1% in the year, impacted by free fees for P2P transaction values of less than KShs1 000 until 31 December 2020. M-Pesa service revenue growth recovered to 21.2% in the fourth quarter, supported by platform growth, product adoption and updated P2P pricing from 1 January 2021. M-Pesa customers grew 13.6% and the total annual value of M-Pesa transactions were up 58.2% to KShs22.0 trillion (R3.3 trillion). Safaricom’s updated P2P pricing promoted affordability, with low value transaction charges reduced by up to 45.0% from pre COVID-19 levels. Safaricom’s overall service revenue profile improved through the year, and in the fourth quarter was up 6.4%.
On a rand reported basis, Safaricom contributed R3.5 billion to the Group’s operating profit, declined 2.1% year-on-year but increased 2.5% on a normalised basis. Safaricom accounted for 12.8% of the Group’s operating profit, in the year.
Growth rates are in local currency and year-on-year, unless otherwise stated. Safaricom results announcements are available here: www.safaricom.co.ke/investor-relation/financials/reports/financial-results
Operating review continued
6

Regulatory matters
ICASA – Invitation to ApplyICASA issued two separate Invitations to Apply (ITA) on 2 October 2020 regarding the assignment of High Demand Spectrum (HDS) in South Africa, in respect of the provision of mobile broadband wireless access services for urban and rural areas using the complimentary International Mobile Telecommunications (IMT) spectrum bands i.e. IMT700, IMT800, IMT2600 and IMT3500 ranges. The first ITA set out ICASA’s licensing process for a new individual electronic communications network services (I-ECNS) and Radio Frequency Spectrum Licences for the purpose of operating a wireless open access network (WOAN). The second ITA set out the licensing process for assignment of HDS spectrum to the existing I-ECNS licensees for the purposes of providing national broadband wireless access services. Subsequent to the invitations, on 22 December 2020, Telkom filed a court application in respect of the ITAs. The filing inter alia sought to suspend the closing date for submission of applications for the licence to operate a WOAN, and interdict ICASA from assessing or adjudicating any applications received in respect of the ITAs, pending a full review of the ITAs processes. Separately, in January 2021, MTN petitioned the court to review the opt-in part of the second ITA. In March 2021, the High Court in Pretoria issued an order, interdicting ICASA from proceeding with the ITA processes pending the final determination of Telkom’s application to review ICASA’s ITAs. We expect the High Court to jointly hear the Telkom and MTN reviews in July 2021.
We remain supportive of the HDS spectrum auction proceeding as soon as possible. We believe that the award of HDS spectrum is critical to reducing input costs and, by extension, the cost of data. Also, the assignment of additional spectrum is vital to expanding broadband services and promoting digital inclusion in South Africa. As such, further delays to the auction process will likely have a negative impact on South Africa consumers.
ICASA – Inquiry into mobile broadband servicesOn 16 November 2018, ICASA gave notice of its intention to conduct an inquiry into mobile broadband services. The purpose of the inquiry was to assess the state of competition, and to determine whether there were markets or market segments within the mobile broadband services value chain that may require regulatory intervention in terms of Chapter 10 of the Electronic Communications Act, 2005.
Following a November 2019 discussion document and October 2020 public hearings, ICASA issued a findings document and Draft Mobile Broadband Services Regulations on 26 March 2021. ICASA concluded that Vodacom and MTN have significant market power in certain retail and wholesale mobile service markets. Further, ICASA proposed several pro-competitive terms and intends to monitor retail prices and wholesale prices, particularly in relation to margin squeeze. As noted above, we believe that the assignment of HDS spectrum is vital to reducing input costs, expanding broadband services and promoting digital inclusion in South Africa.
Lesotho licence updateIn December 2019, the Lesotho Communications Authority (LCA) issued a notice of enforcement proceedings against Vodacom Lesotho on the basis of its opinion of non-independence of the company’s previous external auditors. In February 2020, the LCA directed Vodacom Lesotho to show cause on why Vodacom Lesotho’s communications licence should not be withdrawn. In May 2020, following several engagements with the LCA, Vodacom Lesotho made written representations against the revocation of its licence. In September 2020, the LCA notified Vodacom Lesotho that it was to be fined M134 million (R134 million), of which 70% was suspended for five years. On 8 October 2020, the LCA issued a notice of revocation of the operating licence of Vodacom Lesotho. On 9 October 2020, Vodacom Lesotho launched an application in the Lesotho High Court to have both determinations of the LCA imposing the fine of M134 million and revoking its operating licence, respectively, reviewed and set aside. The Lesotho High Court has, in the meantime, issued an interim order interdicting the LCA from, inter alia, enforcing the payment of the said fine and revoking Vodacom Lesotho’s operating licence. The matter was heard in the High Court in December 2020, and judgement is pending.
Subsequent eventThe Government of Federal Democratic Republic of Ethiopia, through the Ethiopian Communications Authority (ECA), issued a final request for proposals on 5 March 2021 for the award of two full service mobile telecommunication licences in Ethiopia. On 26 April 2021, the Group participated as a minority in a consortium, controlled by Safaricom Plc, bidding for a mobile telecommunication licence in the Federal Democratic Republic of Ethiopia. The ECA has indicated that successful bidders will be announced within thirty days of the bid submission (subject to timings subsequently advised by the ECA).
7Vodacom Group Limited
Preliminary results for the year ended 31 March 2021

Environmental, social and governance (ESG) recognitionOur purpose-led model is premised on the three pillars of digital society, inclusion for all and planet. During the year, we accelerated the delivery of our Social Contract with stakeholders to ensure we made meaningful contributions to inclusion and the recovery in markets where we operate.
The outcomes of our purpose-led model and strong governance were recognised by leading environmental, social and governance (ESG) rating agencies, including Sustainalytics and Morgan Stanley Capital International (MSCI), during the financial year. In September 2020, Sustainalytics ranked Vodacom 2nd out of almost 200 companies in its Telecommunications Service industry grouping and in the top 5% of its Global Universe of 13 000 companies. Separately, in March 2021, MSCI rated Vodacom as AAA – its highest ESG rating. MSCI highlighted Vodacom’s scores in governance, labour management and cybersecurity policies as key drivers of the ESG rating.
Outlook and medium-term targetsVodacom is a purpose-led company and we connect for a better future. The COVID-19 pandemic reinforced the importance of our purpose-led approach, as we were able to accelerate the adoption of data, smartphones, digital and financial services despite pandemic related challenges. Looking ahead, we will remain focused on strong governance and our three purpose pillars of digital society, inclusion for all and planet, as we deliver on our business strategy, Vision 2025. We believe that this integrated approach and our Social Contract with stakeholders, will support just economic progress across the countries in which we operate and provide us with compelling growth opportunities.
Our evolution from a telecommunication to a technology company is well on track as we expand our ecosystem of products. Our multi-product strategy, called the System of Advantage, will deliver diversified, differentiated offerings to our customers, further strengthening and growing our relationships with them. In the connectivity space, our dedicated Consumer and Vodacom Business segments remain focused on delivering great value and an exceptional experience to our customers. Our System of Advantage extends our personalised connectivity offering into digital and financial services, to deliver a 360-degree customer experience. We already provide financial services to 57.7 million customers, including Safaricom, with our ‘nano’ payments, lending and savings solutions supporting financial inclusion. We see significant opportunities ahead, in both our Consumer and Vodacom Business segments, across digital and financial services, as we enhance our existing AI capabilities and real-time management information systems with our landmark Alipay agreement.
Our low gearing, relative to telecommunication peers, of 0.9 times net debt to EBITDA (including leases) positions us to manage the risk of a still uncertain economic outlook, whilst also supporting investment into our System of Advantage. We have limited debt repayments in the short-term, with enough facilities to maintain liquidity. 83% of our debt is rand denominated, limiting foreign currency exposure. Our debt structure, excluding leases, is split 47% fixed and 53% floating debt, with our fixed component of debt protecting against significant adverse interest rate movements.
Our ‘Fit for growth’ cost initiatives are well embedded in our operations, and to a large extent are structural and focused on the digital transformation of our business which leaves us with the opportunity to still employ short-term cost control measures to improve the resilience of our business, where required.
As the effects of the COVID-19 pandemic persist, the economic outlook for our markets remain uncertain. We do however expect this outlook to improve into the forthcoming financial year. This view is informed by global research providers and financial institutions such as the International Monetary Fund (IMF). This assumption of economic improvement, combined with the growth potential of our System of Advantage strategy, supports our mid-single digit medium-term growth target for service revenue. For operating profit growth, which includes the profit contribution from our associates, we upgrade our medium-term target growth from mid-single digit to mid-to-high single digit. The upgrade reflects operational leverage, and improved prospects for International and Safaricom, in particular. In summary, our medium-term targets are as follows:
1. Mid-single digit Group service revenue growth;
2. Mid-to-high-single digit Group operating profit growth (including profit from associate – Safaricom); and
3. 13.0% – 14.5% of Group capital expenditure as a % of Group revenue.
These targets are, on average, over the next three years, and are on a normalised basis in constant currency, excluding spectrum purchases, exceptional items and any merger and acquisition activity.
Operating review continued
8

Summary financial information Year ended 31 March % change
Rm 2021 2020 Reported Normalised*
Revenue 98 302 90 746 8.3 7.4Service revenue 77 574 73 354 5.8 4.7EBITDA 39 299 37 610 4.5 3.6Net profit from associate and joint ventures 3 501 4 149 (15.6) 3.9Operating profit 27 652 27 711 (0.2) 2.2Net profit 17 071 16 644 2.6Capital expenditure 13 307 13 218 0.7Operating free cash flow1 22 030 21 782 1.1Free cash flow1 14 974 16 284 (8.0)Net debt 34 249 35 180 (2.6)Earnings per share (cents) 978 939 4.2Headline earnings per share (cents) 980 945 3.7
Contribution margin2 (%) 62.0 63.8 (1.8ppt)EBITDA margin (%) 40.0 41.4 (1.4ppt)Operating profit margin (%) 28.1 30.5 (2.4ppt)Effective tax rate (%) 28.2 27.8 0.4pptNet profit margin (%) 17.4 18.3 (0.9ppt)Capital intensity (%) 13.5 14.6 (1.1ppt)
Net debt/EBITDA (times) 0.9 0.9 –
Service revenue
Year ended 31 March % change
Rm 2021 2020 Reported Normalised*
South Africa 56 405 52 712 7.0 7.0International 22 146 21 799 1.6 (1.9)Corporate and eliminations (977) (1 157) 15.6 15.6
Group service revenue 77 574 73 354 5.8 4.7
Safaricom3 37 600 36 319 3.5
Group service revenue grew 5.8% (4.7%*) to R77.6 billion, supported by a strong performance in South Africa and an improvement in normalised service revenue growth for International during the second half of the financial year. At a product level, growth was supported by new services such as digital and financial, fixed and IoT. South Africa’s Financial Services’ business and M-Pesa delivered service revenue of R6.9 billion, up 15.0%, and contributed 8.9% of consolidated service revenue. Our digital, fixed (ex transit4) and IoT businesses delivered service revenue of R1.7 billion, R3.7 billion and R1.1 billion respectively. In aggregate, these ‘beyond mobile’ services amounted to R13.4 billion and contributed 17.2% of Group service revenue.
Financial review
Notes: 1. A reconciliation of operating free cash flow and free cash flow is on page 51.2. Contribution margin is contribution profit as a percentage of revenue. Contribution profit is revenue less direct expenses.3. The Group’s effective interest of 34.94% in Safaricom Plc (Safaricom) is accounted for as an investment in associate. Results represent 100%
of Safaricom and is for information purposes only.4. Wholesale transit revenue of R844 million (FY20: R884 million).
9Vodacom Group Limited
Preliminary results for the year ended 31 March 2021

In South Africa, service revenue increased 7.0% to R56.4 billion, supported by growth in customer revenue and new services. Pleasingly, the growth profile was consistently strong through the financial year. Financial services revenue amounted to R2.4 billion, or 4.2% of South Africa’s service revenue.
Our International operations reported muted service revenue growth at 1.6%. Normalised service revenue declined 1.9%* to R22.1 billion with a notable recovery in the second half of the year, and especially the fourth quarter. The recovery was supported by M-Pesa and data growth, with all our markets charging for P2P M-Pesa transactions from 1 January 2021. M-Pesa and data revenue comprised 20.4% and 18.8% of International service revenue for the year ended 31 March 2021. Safaricom service revenue, which we do not consolidate, increased 3.5% in rands but declined 0.3% in local currency.
Total expenses1
Year ended 31 March % change
Rm 2021 2020 Reported Normalised*
South Africa 45 949 40 589 13.2 13.3International 14 030 13 818 1.5 (2.3)Corporate and eliminations (951) (1 178) 19.3 19.3
Group total expenses 59 028 53 229 10.9 9.9
Group total expenses increased 10.9% (9.9%*) to R59.0 billion.
In South Africa, expenses increased 13.2% (13.3%*) to R46.0 billion as a result of higher costs related to our roaming agreements with Rain and Liquid, and higher COVID-19 related bad debt provisions. The increase in bad debt encompassed both specific provisions and higher expected credit losses as a result of COVID-19 relief measures implemented, in accordance with IFRS 9. Excluding the impact of Rain and Liquid roaming costs and the higher COVID-19 related bad debts, total expenses grew 7.3%. International expenses increased 1.5% (-2.3%*) to R14.0 billion reflecting disciplined cost containment, despite inflationary cost pressures.
EBITDA
Year ended 31 March % change
Rm 2021 2020 Reported Normalised*
South Africa 30 745 29 094 5.7 5.6International 8 784 8 679 1.2 (2.2)Corporate and eliminations (230) (163) 41.1 41.1
Group EBITDA 39 299 37 610 4.5 3.6
Safaricom2 20 125 19 950 0.9
Group EBITDA increased 4.5% (3.6%*) to R39.3 billion at a margin of 40.0%. South Africa EBITDA grew 5.7% (5.6%*) to R30.7 billion. Growth was underpinned by strong service revenue growth in South Africa. EBITDA in our International operations increased 1.2% (-2.2%*) to R8.8 billion, with flat margins reflecting a strong recovery in the second half of the financial year.
Financial review continued
Notes: 1. Excluding depreciation, amortisation and impairments. 2. The Group’s effective interest of 34.94% in Safaricom Plc (Safaricom) is accounted for as an investment in associate. Results represent 100% of
Safaricom and is for information purposes only.
10
Operating profit
Year ended 31 March % change
Rm 2021 2020 Reported Normalised*
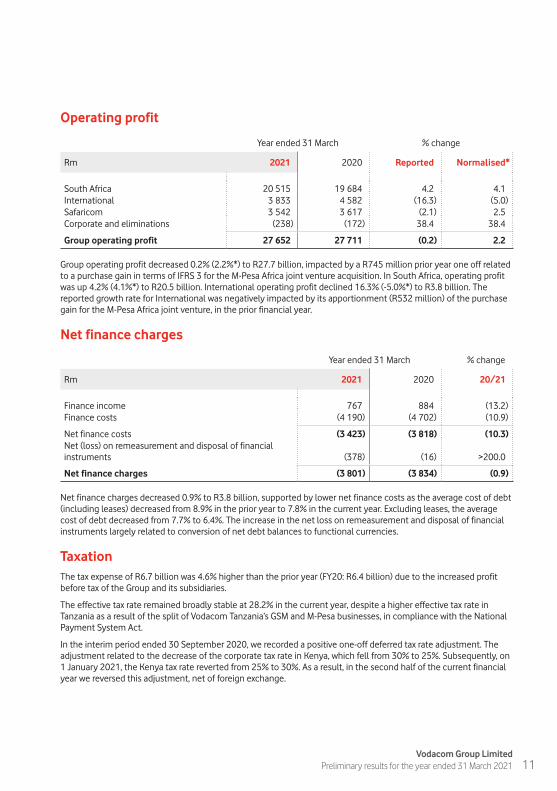
South Africa 20 515 19 684 4.2 4.1International 3 833 4 582 (16.3) (5.0)Safaricom 3 542 3 617 (2.1) 2.5Corporate and eliminations (238) (172) 38.4 38.4
Group operating profit 27 652 27 711 (0.2) 2.2
Group operating profit decreased 0.2% (2.2%*) to R27.7 billion, impacted by a R745 million prior year one off related to a purchase gain in terms of IFRS 3 for the M-Pesa Africa joint venture acquisition. In South Africa, operating profit was up 4.2% (4.1%*) to R20.5 billion. International operating profit declined 16.3% (-5.0%*) to R3.8 billion. The reported growth rate for International was negatively impacted by its apportionment (R532 million) of the purchase gain for the M-Pesa Africa joint venture, in the prior financial year.
Net finance charges
Year ended 31 March % change
Rm 2021 2020 20/21
Finance income 767 884 (13.2)Finance costs (4 190) (4 702) (10.9)
Net finance costs (3 423) (3 818) (10.3)Net (loss) on remeasurement and disposal of financial instruments (378) (16) >200.0
Net finance charges (3 801) (3 834) (0.9)
Net finance charges decreased 0.9% to R3.8 billion, supported by lower net finance costs as the average cost of debt (including leases) decreased from 8.9% in the prior year to 7.8% in the current year. Excluding leases, the average cost of debt decreased from 7.7% to 6.4%. The increase in the net loss on remeasurement and disposal of financial instruments largely related to conversion of net debt balances to functional currencies.
TaxationThe tax expense of R6.7 billion was 4.6% higher than the prior year (FY20: R6.4 billion) due to the increased profit before tax of the Group and its subsidiaries.
The effective tax rate remained broadly stable at 28.2% in the current year, despite a higher effective tax rate in Tanzania as a result of the split of Vodacom Tanzania’s GSM and M-Pesa businesses, in compliance with the National Payment System Act.
In the interim period ended 30 September 2020, we recorded a positive one-off deferred tax rate adjustment. The adjustment related to the decrease of the corporate tax rate in Kenya, which fell from 30% to 25%. Subsequently, on 1 January 2021, the Kenya tax rate reverted from 25% to 30%. As a result, in the second half of the current financial year we reversed this adjustment, net of foreign exchange.
11Vodacom Group Limited
Preliminary results for the year ended 31 March 2021

EarningsYear ended 31 March % change
2021 2020 20/21
Earnings per share (EPS) (cents) 978 939 4.2Headline earnings per share (HEPS) (cents) 980 945 3.7Weighted average number of ordinary shares outstanding for the purpose of calculating EPS and HEPS (million) 1 695 1 697 (0.1)
EPS and HEPS grew at 4.2% and 3.7% respectively. EPS and HEPS growth was supported by operating profit growth in South Africa, while International and Safaricom operating profit and the remeasurement and disposal of financial instruments, detracted from reported growth.
DividendYear ended 31 March % change
Rm 2021 2020 20/21
Headline earnings 16 609 16 034 3.6Adjusted for:Net profit from Safaricom (3 540) (3 428) 3.3
Attributable profits from Safaricom (4 123) (4 275) (3.6)Amortisation on assets, net of tax 580 659 (12.0)Adjustment relating to Safaricom 3 188 (98.4)
Withholding tax 273 427 (36.1)Non-controlling interest and other 444 452 (2.0)
Headline earnings available for dividend distribution 13 784 13 485 2.2
Total dividend declared per share (cents) 825 845 (2.4)
Interim dividend declared per share (cents) 415 380 9.2Special dividend declared per share (cents) – 60 n/aFinal dividend declared per share (cents) 410 405 1.2
Financial review continued
12

Owned capital expenditure1
Year ended 31 March % change
Rm 2021 2020 20/21
South Africa 10 076 9 860 2.2International 3 226 3 358 (3.9)Corporate and eliminations 5 – –
Group capital expenditure 13 307 13 218 0.7
Group capital intensity2 (%) 13.5 14.6 (1.1ppt)
Safaricom 5 367 5 213 3.0
Safaricom capital intensity2 (%) 13.5 13.7 (0.2ppt)
The Group’s capital expenditure was R13.3 billion, representing 13.5% of revenue. In South Africa, capital expenditure was directed at improving capacity and resilience of the network. We now have 97.3% (FY20: 95.4%) 4G population coverage. In our International operations, the focus remained on increasing both coverage and capacity as well as continuing the 4G roll-out. We added 262 2G sites, 322 3G sites and 1 072 4G sites across our International operations since 1 April 2020.
Statement of financial positionProperty, plant and equipment decreased 4.7% to R56.5 billion and intangible assets decreased 1.3% to R13.2 billion when compared to 31 March 2020. The combined decrease is as a result of net additions of R16.3 billion, offset by net foreign currency translation movements of R4.1 billion, and depreciation and amortisation of R15.1 billion.
As at 31 March
Rm 2021 2020 Movement
Bank and cash balances 15 751 17 057 (1 306)Bank overdrafts (542) (866) 324Current borrowings (9 634) (3 707) (5 927)Non-current borrowings (39 741) (47 988) 8 247Other financial instruments (83) 324 (407)
Net debt3 (34 249) (35 180) (931)
Net debt/EBITDA (times) 0.9 0.9 –
Net debt decreased by R0.9 billion to R34.2 billion from March 2020. The year-on-year movement was supported by free cash flow exceeding cash dividend payments in the year. Total borrowings decreased by R1.1 billion to R50.6 billion from March 2020.
Notes: 1. Owned capital expenditure, excluding spectrum, licences and capitalised right of use assets. Right of use asset additions include R3 282 million
(2020: R2 770 million) for the Group of which R2 584 million (2020: R2 055 million) in South Africa and R698 million (2020: R715 million) in International.
2. Capital expenditure as a percentage of revenue.3. Debt includes interest bearing debt, non-interest bearing debt and bank overdrafts.
13Vodacom Group Limited
Preliminary results for the year ended 31 March 2021

Cash flows1
Free cash flowYear ended 31 March % change
Rm 2021 2020 20/21
EBITDA 39 299 37 610 4.5Working capital (411) 845 (149.0)Capital expenditure2 (13 307) (13 218) 0.7Disposal of property, plant and equipment 51 68 (25.0)Lease liability payments (4 266) (4 046) 5.4Other 664 523 27.0
Operating free cash flow 22 030 21 782 1.1Tax paid (7 428) (6 417) 15.8Dividends received from associate 3 576 4 394 (18.6)Finance income received 723 763 (5.2)Finance costs paid (2 609) (3 506) (25.6)Dividends paid to non-controlling shareholders (1 318) (732) 80.1
Free cash flow 14 974 16 284 (8.0)
Operating free cash flow increased 1.1%, with EBITDA growth of 4.5% offset by a working capital outflow. The working capital movement largely relates to South Africa, which posted a broadly neutral working capital movement in the current year compared with a R0.8 billion inflow in the prior year. Free cash flow declined 8.0%, with the year-on-year growth impacted by a R1.1 billion special dividend receipt from our associate investment in Safaricom during the prior year. Excluding the impact of the special dividend from Safaricom, free cash flow declined 1.2%.
Dividends
Declaration of final dividend number 24 – payable from income reservesNotice is hereby given that a gross final dividend number 24 of 410 cents per ordinary share in respect of the financial year ended 31 March 2021 has been declared payable on Monday, 28 June 2021 to shareholders recorded in the register at the close of business on Friday, 25 June 2021. The number of ordinary shares in issue at the date of this declaration is 1 835 864 961. The dividend will be subject to a local dividend withholding tax rate of 20% which will result in a net final dividend to those shareholders not exempt from paying dividend withholding tax of 328.00000 cents per ordinary share.
Last day to trade shares cum dividend Tuesday 22 June 2021
Shares commence trading ex-dividend Wednesday 23 June 2021
Record date Friday 25 June 2021
Payment date Monday 28 June 2021
Share certificates may not be dematerialised or rematerialised between Wednesday, 23 June 2021 and Friday, 25 June 2021, both days inclusive.
Financial review continued
Notes: 1. A reconciliation of cash generated from operations to free cash flow, is on page 51.2. Capital expenditure comprises the purchase of property, plant and equipment and intangible assets, other than licence and spectrum
payments. Purchases of customer bases are excluded from capital expenditure.
14

On Monday, 28 June 2021, the final dividend will be electronically transferred into the bank accounts of all certificated shareholders where this facility is available. Shareholders who hold dematerialised shares will have their accounts at their CSDP or broker credited on Monday, 28 June 2021.
Vodacom Group Limited tax reference number is 9316/041/71/5.
Dividend policyThe Board maintains its dividend policy of paying at least 90% of adjusted headline earnings which excludes the contribution of the attributable net profit or loss from Safaricom and any associated intangible amortisation. In addition, the Group intends to distribute any dividend it receives from Safaricom, up to a maximum amount of the dividend received, net of withholding tax.
The Group intends to pay as much of its after tax profits as will be available after retaining such sums and repaying such borrowings owing to third parties as shall be necessary to meet the requirements reflected in the budget and business plan, taking into account monies required for investment opportunities. There is no fixed date on which entitlement to dividends arises and the date of payment will be determined by the Board or shareholders at the time of declaration, subject to the JSE Listings Requirements.
For and on behalf of the Board
Sakumzi Justice Macozoma Shameel Aziz Joosub Raisibe Morathi
Chairman Chief Executive Officer Chief Financial Officer
Midrand17 May 2021
15Vodacom Group Limited
Preliminary results for the year ended 31 March 2021

Independent auditor’s review report
To the shareholders of Vodacom Group LimitedWe have reviewed the preliminary condensed consolidated financial statements of Vodacom Group Limited set out on pages 17 to 35, contained in the accompanying preliminary report, which comprises the condensed consolidated statement of financial position as at 31 March 2021, and the condensed consolidated income statement, condensed consolidated statement of comprehensive income, condensed consolidated statement of changes in equity and condensed consolidated statement of cash flows for the year then ended, and selected explanatory notes.
Directors’ responsibility for the preliminary condensed consolidated financial statementsThe directors are responsible for the preparation and presentation of these preliminary condensed consolidated financial statements in accordance with the International Financial Reporting Standard, (IAS) 34 Interim Financial Reporting, the SAICA Financial Reporting Guides, as issued by the Accounting Practices Committee and Financial Pronouncements as issued by Financial Reporting Standards Council and the requirements of the Companies Act of South Africa, and for such internal control as the directors determine is necessary to enable the preparation of preliminary condensed consolidated financial statements that are free from material misstatement, whether due to fraud or error.
Auditor’s responsibilityOur responsibility is to express a conclusion on these preliminary condensed consolidated financial statements. We conducted our review in accordance with International Standard on Review Engagements ISRE 2410, Review of Interim Financial Information performed by the Independent Auditor of the Entity. ISRE 2410 requires us to conclude whether anything has come to our attention that causes us to believe that the preliminary condensed consolidated financial statements are not prepared in all material respects in accordance with the applicable financial reporting framework. This standard also requires us to comply with relevant ethical requirements.
A review of preliminary condensed consolidated financial statements in accordance with ISRE 2410 is a limited assurance engagement. We perform procedures, primarily consisting of making inquiries of management and others within the entity, as appropriate, and applying analytical procedures, and evaluate the evidence obtained.
The procedures performed in a review are substantially less than and differ in nature from those performed in an audit conducted in accordance with International Standards on Auditing. Accordingly, we do not express an audit opinion on these preliminary condensed consolidated financial statements.
ConclusionBased on our review, nothing has come to our attention that causes us to believe that the accompanying preliminary condensed consolidated financial statements of Vodacom Group Limited for the year ended 31 March 2021 are not prepared, in all material respects, in accordance with the International Financial Reporting Standard, (IAS) 34 Interim Financial Reporting, the SAICA Financial Reporting Guides as issued by the Accounting Practices Committee and Financial Pronouncements as issued by Financial Reporting Standards Council and the requirements of the Companies Act of South Africa.
Ernst & Young Inc. Director – Vinodhan Pillay Registered Auditor Chartered Accountant (SA)17 May 2021
16

Rm Notes2021
Reviewed2020
Audited
Revenue 3 98 302 90 746Direct expenses1 (36 269) (32 075)Staff expenses (6 990) (6 421)Publicity expenses (1 718) (1 907)Net credit losses on financial assets1 (1 078) (802)Other operating expenses (12 973) (12 024)Depreciation and amortisation (15 117) (13 955)Impairment losses (6) –Net profit from associate and joint ventures 3 501 4 149
Operating profit 27 652 27 711Net loss on disposal of subsidiaries 4.4 (70) (819)Finance income 767 884Finance costs (4 190) (4 702)Net loss on remeasurement and disposal of financial instruments (378) (16)
Profit before tax 23 781 23 058Taxation (6 710) (6 414)
Net profit 17 071 16 644
Attributable to:Equity shareholders 16 581 15 944Non-controlling interests 490 700
17 071 16 644
1. Net credit losses on financial assets were included in direct expenditure in prior periods. The reclassification had no impact on any reported totals, headline earnings per share or on any amounts presented in the statement of financial position.
Cents Notes2021
Reviewed2020
Audited
Basic earnings per share 4 978 939Diluted earnings per share 4 956 923
Condensed consolidated income statementfor the year ended 31 March
17Vodacom Group Limited
Preliminary results for the year ended 31 March 2021

Rm2021
Reviewed2020
Audited
Net profit 17 071 16 644Other comprehensive income Foreign currency translation differences, net of tax1 (16 361) 13 770Foreign currency translation differences recognised through profit or loss on disposal of foreign operations1 15 327Mark-to-market of financial assets held at fair value through other comprehensive income, net of tax1 52 13
Total comprehensive income 777 30 754
Attributable to:Equity shareholders 1 642 28 953Non-controlling interests (865) 1 801
777 30 754
1. Other comprehensive income can subsequently be recognised in profit or loss on the disposal of foreign operations or financial assets held at fair value through other comprehensive income. During the year, a net amount of R15 million (31 March 2020: R327 million) of previously recorded foreign currency translation differences were recognised in profit or loss on the sale of certain subsidiaries within the Vodacom Business Africa group.
Condensed consolidated statement of other comprehensive incomefor the year ended 31 March
1818

Rm Note2021
Reviewed2020
Audited
AssetsNon-current assets 125 670 142 395
Property, plant and equipment 56 480 59 277Intangible assets 13 186 13 363Financial assets 605 741Investment in associate and joint ventures 50 173 64 429Trade and other receivables 2 536 2 447Finance receivables 2 275 1 867Tax receivable 356 260Deferred tax 59 11
Current assets 46 309 47 828
Financial assets 6 449 7 763Inventory 1 198 1 382Trade and other receivables 20 129 19 197Non-current assets held for sale – 86Finance receivables 2 431 2 288Tax receivable 351 55Bank and cash balances 15 751 17 057
Total assets 171 979 190 223
Equity and liabilitiesFully paid share capital 57 073 57 073Treasury shares (16 861) (16 620)Retained earnings 36 884 34 294Other reserves 2 274 16 909
Equity attributable to owners of the parent 79 370 91 656Non-controlling interests 6 320 8 414
Total equity 85 690 100 070
Non-current liabilities 44 219 53 403
Borrowings 8 39 741 47 988Trade and other payables 210 359Provisions 833 1 055Deferred tax 3 435 4 001
Current liabilities 42 070 36 750
Borrowings 8 9 634 3 707Trade and other payables 31 132 31 437Liabilities directly associated with non-current assets held for sale – 30Provisions 390 228Tax payable 355 468Dividends payable 17 14Bank overdraft 542 866
Total equity and liabilities 171 979 190 223
Condensed consolidated statement of financial positionas at 31 March
19Vodacom Group Limited
Preliminary results for the year ended 31 March 2021
Rm
Equity attributable
to the ownersof the parent
Non- controlling
interests Total equity
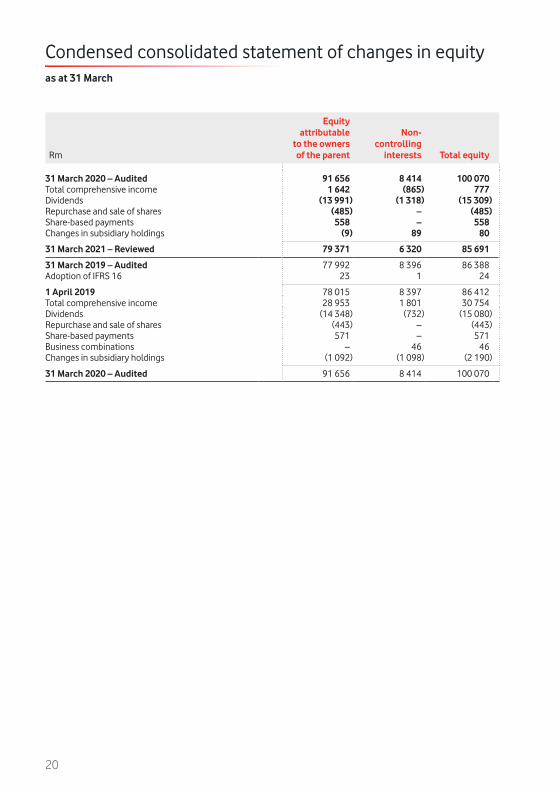
31 March 2020 – Audited 91 656 8 414 100 070Total comprehensive income 1 642 (865) 777Dividends (13 991) (1 318) (15 309)Repurchase and sale of shares (485) – (485)Share-based payments 558 – 558Changes in subsidiary holdings (9) 89 80
31 March 2021 – Reviewed 79 371 6 320 85 691
31 March 2019 – Audited 77 992 8 396 86 388Adoption of IFRS 16 23 1 24
1 April 2019 78 015 8 397 86 412Total comprehensive income 28 953 1 801 30 754Dividends (14 348) (732) (15 080)Repurchase and sale of shares (443) – (443)Share-based payments 571 – 571Business combinations – 46 46Changes in subsidiary holdings (1 092) (1 098) (2 190)
31 March 2020 – Audited 91 656 8 414 100 070
Condensed consolidated statement of changes in equityas at 31 March
20

Rm Note2021
Reviewed2020
Audited
Cash flows from operating activitiesCash generated from operations 9 40 789 39 251Tax paid (7 428) (6 417)
Net cash flows from operating activities 33 361 32 834
Cash flows from investing activitiesAdditions to property, plant and equipment and intangible assets (13 443) (13 890)Proceeds from disposal of property, plant and equipment and intangible assets 69 68Acquisition of subsidiary (net of cash and cash equivalents acquired) – (266)Acquisition of joint venture – (180)Disposal of subsidiaries (net of cash and cash equivalents disposed) 15 89Dividends received from associate 3 576 4 394Finance income received 723 763Other investing activities1 63 (142)
Net cash flows utilised in investing activities (8 997) (9 164)
Cash flows from financing activitiesBorrowings incurred 180 9 630Borrowings repaid (4 052) (7 086)Finance costs paid (3 945) (4 810)Dividends paid – equity shareholders (13 944) (14 358)Dividends paid – non-controlling interests (1 318) (732)Repurchase of shares2 (563) (502)Proceeds on sale of shares2 78 59Changes in subsidiary holdings (24) (2 048)
Net cash flows utilised in financing activities (23 588) (19 847)
Net increase in cash and cash equivalents 776 3 823Cash and cash equivalents at the beginning of the period 16 191 11 066Effect of foreign exchange rate changes (1 758) 1 302
Cash and cash equivalents at the end of the period 15 209 16 191
1. Consists mainly of an increase in restricted cash deposits of R1 201 million (31 March 2020: R445 million increase) from M-Pesa related activities, and decreased investment in treasury bills in Tanzania of R1 262 million (31 March 2020: R352 million decrease).
2. During the current year, cash flows relating to the repurchase and sale of shares that have previously been reported on a net basis, have been disclosed on a gross basis. The reclassification had no impact on any reported totals, headline earnings per share or on any amounts presented in the statement of financial position.
Condensed consolidated statement of cash flowsfor the year ended 31 March
21Vodacom Group Limited
Preliminary results for the year ended 31 March 2021
1. Basis of preparationThese preliminary condensed consolidated financial statements have been prepared in accordance with the framework concepts, the recognition and measurement criteria of International Financial Reporting Standards (IFRS) and in accordance with and containing the information required by International Accounting Standard (IAS) 34: Interim Financial Reporting as issued by the International Accounting Standards Board (IASB), the Financial Reporting Guides as issued by the South African Institute of Chartered Accounts’ (SAICA) Accounting Practices Committee, Financial Pronouncements as issued by the Financial Reporting Standards Council, the JSE Limited (JSE) Listings Requirements and the requirements of the Companies Act of South Africa, as amended. They have been prepared on the historical cost basis, except for certain financial instruments which are measured at fair value or at amortised cost, and are presented in South African rand, which is the parent Company's functional and presentation currency.
The significant accounting policies and methods of computation are consistent in all material respects with those applied in the previous year, except as disclosed in Note 2. The significant accounting policies are available for inspection at the Group's registered office.
The preparation of these preliminary condensed consolidated financial statements was supervised by the Chief Financial Officer, RK Morathi (CA) SA, M.Phil., H.Dip Tax.
The financial information has been reviewed by Ernst & Young Inc., whose unmodified review report is presented on page 16.
2. Change in accounting policiesThe Group adopted the new, revised or amended accounting pronouncements as issued by the IASB, which were effective and applicable to the Group from 1 April 2020, none of which had any material impact on the Group’s financial results for the period. The Group has not early adopted any new, revised or amended accounting pronouncements, that are not yet effective and the Group is not expecting these pronouncements to have a material impact on the financial results of the Group.
Amendments to IFRS 9, IAS 39, IFRS 7, IFRS 4 and IFRS 16 Interest Rate Benchmark Reform – Phase 2, issued by the IASB, is effective for periods commencing on or after 1 January 2021. The Group is keeping abreast of developments relating to interest rate benchmark reform, as and when communicated by the relevant financial authorities. As at 31 March 2021, there were no changes to any of the interest rate benchmarks that the Group is exposed to. The Group will continue to assess the impact of interest rate benchmark reform as the revised benchmark rates are published.
Full details on changes in accounting policies will be disclosed in the Group’s consolidated annual financial statements for the year ended 31 March 2021, which will be available online.
Notes to the preliminary condensed consolidated financial statementsfor the year ended 31 March
22

Rm2021
Reviewed2020
Audited
3. Segment analysisExternal customer segment revenue 98 302 90 746
South Africa 76 303 69 045International 21 999 21 681Corporate and eliminations – 20
Safaricom1 39 627 37 951Inter-segment revenue – –
South Africa 434 548International 747 811Corporate and eliminations (1 181) (1 359)
1. The Group has a 34.94% effective interest in Safaricom Plc (Safaricom) through its subsidiary Vodafone Kenya Limited, which the Group equity accounts for as an investment in an associate at 39.93%. Due to the significance of this investment, and the information available for review by the chief operating decision maker, Safaricom is presented as a separate segment. The above results represent 100% of the results of Safaricom.
23Vodacom Group Limited
Preliminary results for the year ended 31 March 2021

3. Segment analysis continuedRevenue is further disaggregated into product type below.
RmSouth Africa International
Corporate and
elimination Total Safaricom1
31 March 2021 – reviewedMobile contract revenue 20 829 1 469 (6) 22 292 3 420Mobile prepaid revenue 25 359 18 009 (2) 43 366 30 153
Customer service revenue 46 188 19 478 (8) 65 658 33 573
Mobile interconnect 1 742 1 330 (544) 2 528 1 426Fixed service revenue 3 556 1 233 (390) 4 399 1 429Other service revenue 4 919 105 (35) 4 989 1 172
Service revenue 56 405 22 146 (977) 77 574 37 600
Equipment revenue 14 672 285 (21) 14 936 1 527Non-service revenue 5 299 303 (183) 5 419 500
Revenue from contracts with customers 76 376 22 734 (1 181) 97 929 *
Interest income recognised as revenue 296 12 – 308 *Other2 65 – – 65 *
Revenue 76 737 22 746 (1 181) 98 302 39 627
1. The Group has a 34.94% effective interest in Safaricom Plc (Safaricom) through its subsidiary Vodafone Kenya Limited, which the Group equity accounts for as an investment in an associate at 39.93%. Due to the significance of this investment, and the information available for review by the chief operating decision maker, Safaricom is presented as a separate segment. The above results represent 100% of the results of Safaricom.
2. Other revenue largely represents lease revenues recognised under IFRS 16 “Leases”.
* Not reviewed by the chief operating decision maker.
Notes to the preliminary condensed consolidated financial statements continued
24

3. Segment analysis continued
Rm South Africa International
Corporate and
elimination Total Safaricom1
31 March 2020 – auditedMobile contract revenue 19 841 1 344 (6) 21 179 3 510Mobile prepaid revenue 23 372 17 327 – 40 699 29 230
Customer service revenue 43 213 18 671 (6) 61 878 32 740
Mobile interconnect 1 893 1 328 (644) 2 577 1 227Fixed service revenue 3 189 1 709 (471) 4 427 1 296Other service revenue 4 417 91 (36) 4 472 1 056
Service revenue 52 712 21 799 (1 157) 73 354 36 319
Equipment revenue 13 543 411 (17) 13 937 1 247Non-service revenue 3 164 274 (165) 3 273 385
Revenue from contracts with customers 69 419 22 484 (1 339) 90 564 *
Interest income recognised as revenue 114 8 – 122 *Other2 60 – – 60 *
Revenue 69 593 22 492 (1 339) 90 746 37 951
1. The Group has a 34.94% effective interest in Safaricom Plc (Safaricom) through its subsidiary Vodafone Kenya Limited, which the Group equity accounts for as an investment in an associate at 39.93%. Due to the significance of this investment, and the information available for review by the chief operating decision maker, Safaricom is presented as a separate segment. The above results represent 100% of the results of Safaricom.
2. Other revenue largely represents lease revenues recognised under IFRS 16 “Leases”.
* Not reviewed by the chief operating decision maker.
Rm2021
Reviewed2020
Audited
EBITDA 39 299 37 610
South Africa 30 745 29 094International 8 784 8 679Corporate and eliminations (230) (163)
Safaricom1 20 125 19 950Operating profit 27 652 27 711
South Africa 20 515 19 684International 3 833 4 582Corporate and eliminations 3 304 3 445
Safaricom1 11 886 12 856
1. The Group has a 34.94% effective interest in Safaricom Plc (Safaricom) through its subsidiary Vodafone Kenya Limited, which the Group equity accounts for as an investment in an associate at 39.93%. Due to the significance of this investment, and the information available for review by the chief operating decision maker, Safaricom is presented as a separate segment. The above results represent 100% of the results of Safaricom, including the impact of net fair value adjustments on tangible and intangible assets.
25Vodacom Group Limited
Preliminary results for the year ended 31 March 2021
Notes to the preliminary condensed consolidated financial statements continued
3. Segment analysis continued
Rm2021
Reviewed2020
Audited
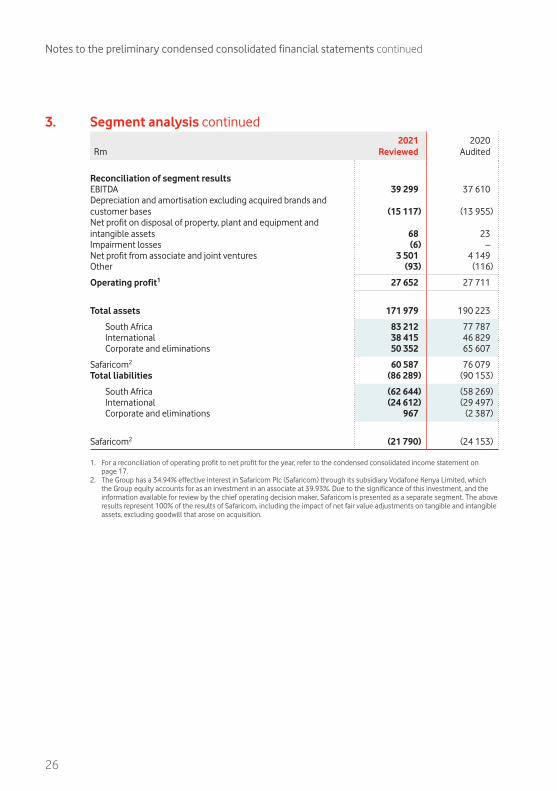
Reconciliation of segment resultsEBITDA 39 299 37 610Depreciation and amortisation excluding acquired brands and customer bases (15 117) (13 955)Net profit on disposal of property, plant and equipment and intangible assets 68 23Impairment losses (6) –Net profit from associate and joint ventures 3 501 4 149Other (93) (116)
Operating profit1 27 652 27 711
Total assets 171 979 190 223
South Africa 83 212 77 787International 38 415 46 829Corporate and eliminations 50 352 65 607
Safaricom2 60 587 76 079Total liabilities (86 289) (90 153)
South Africa (62 644) (58 269)International (24 612) (29 497)Corporate and eliminations 967 (2 387)
Safaricom2 (21 790) (24 153)
1. For a reconciliation of operating profit to net profit for the year, refer to the condensed consolidated income statement on page 17.
2. The Group has a 34.94% effective interest in Safaricom Plc (Safaricom) through its subsidiary Vodafone Kenya Limited, which the Group equity accounts for as an investment in an associate at 39.93%. Due to the significance of this investment, and the information available for review by the chief operating decision maker, Safaricom is presented as a separate segment. The above results represent 100% of the results of Safaricom, including the impact of net fair value adjustments on tangible and intangible assets, excluding goodwill that arose on acquisition.
26

Cents2021
Reviewed2020
Audited
4. Per share calculations4.1 Earnings and dividends per share
Basic earnings per share 978 939Diluted earnings per share 956 923Headline earnings per share 980 945Diluted headline earnings per share 957 928Dividends per share 820 840
Million2021
Reviewed2020
Audited
4.2 Weighted average number of ordinary shares outstanding for the purpose of calculatingBasic and headline earnings per share 1 695 1 697Diluted earnings and diluted headline earnings per share 1 735 1 728
4.3 Ordinary shares for the purpose of calculating dividends per share:400 cents per share declared on 10 May 2019 1 836440 cents per share declared on 8 November 2019 1 836405 cents per share declared on 7 May 2020 1 836415 cents per share declared on 13 November 2020 1 836
Vodacom Group Limited acquired 3 589 285 shares in the market during the period at an average price of R129.24 per share for the Group’s forfeitable share plan. The Innovator Trust, a structured entity consolidated by the Group in terms of IFRS 10: Consolidated Financial Statements, also purchased 794 068 shares at an average price of R124.37. Share repurchases did not exceed 1% of Vodacom Group Limited's issued share capital.
Dividend per share calculations are based on a dividend paid of R15 054 million (31 March 2020: R15 421 million) of which R74 million (31 March 2020: R60 million) was offset against the forfeitable share plan reserve, R11 million (31 March 2020: R9 million) expensed as staff expenses and R126 million (31 March 2020: R130 million) paid to Wheatfields Investments 276 (Pty) Limited, a wholly-owned subsidiary holding treasury shares on behalf of the Group. An amount of R939 million (31 March 2020: R961 million) was paid to YeboYethu Investment Company (RF) (Pty) Limited, a special purpose vehicle holding shares in Vodacom Group Limited on behalf of broad-based black economic empowerment participants, of which R96 million was paid out as a trickle dividend to participants. R11 million (31 March 2020: R6 million) was paid to The Innovator Trust. The Group declared a final dividend in respect of the year ended 31 March 2021 after the reporting period (Note 13).
27Vodacom Group Limited
Preliminary results for the year ended 31 March 2021

4. Per share calculations continued
Rm2021
Reviewed2020
Audited
4.4 Headline earnings reconciliationEarnings attributable to equity shareholders for basic and diluted earnings per share 16 581 15 944Adjusted for:
Net profit on disposal of property, plant and equipment and intangible assets1 (73) (25)Impairment losses 6 –Bargain purchase gain on acquisition by joint venture2 – (745)Loss on disposal of subsidiaries 70 819
Net loss on disposal, before foreign currency translation of the operations 55 492Foreign currency translation differences recognised through profit or loss on disposal of foreign operations 15 327
16 584 15 993Tax impact of adjustments 22 10Non-controlling interests' share in adjustments 3 31
Headline earnings for headline- and diluted headline earnings per share3 16 609 16 034
1. Includes attributable share of net profit on disposal of property, plant and equipment and intangible assets of associate and joint ventures of R5 million (31 March 2020: R 2 million).
2. Includes attributable share of bargain purchase gain recognised by Safaricom, our joint venture partner, of R213 million for the year ended 31 March 2020.
3. This disclosure is a requirement of the JSE Limited. It has been calculated in accordance with Circular 1/2019 as issued by SAICA.
5. Related partiesThe amounts disclosed in Notes 5.1 and 5.2 include significant balances and transactions with the Group’s parent, entities in its group as well as an associate and joint ventures. Full details of related party transactions will be disclosed in the Group’s consolidated annual financial statements for the year ended 31 March 2021, which will be available online.
Rm2021
Reviewed2020
Audited
5.1 Balances with related partiesBorrowings (including accrued finance cost) 28 804 28 753Dividend receivable from associate included in trade and other receivables 972 –
5.2 Transactions with related partiesDividends declared (9 107) (9 329)Finance costs (1 953) (2 280)
Notes to the preliminary condensed consolidated financial statements continued
28

5. Related parties continued5.3 Directors and key management personnel
Compensation paid to the Group’s Board and key management personnel will be disclosed in the Group’s consolidated annual financial statements for the year ended 31 March 2021, which will be available online.
PJ Moleketi, Chairman of the Group stepped down from the Board at the annual general meeting held on Tuesday, 21 July 2020 and was succeeded by SJ Macozoma. SJ Macozoma was first appointed to the Board in July 2017. Following the appointment of SJ Macozoma as Chairman, DH Brown was appointed as lead independent non-executive director with effect from Wednesday, 22 July 2020.
P Klotz and CB Thomson were appointed to the Board as non-executive director and independent non-executive director respectively with effect from Wednesday, 1 April 2020. On his appointment as a director, CB Thomson became a member of the Audit, Risk & Compliance Committee.
KL Shuenyane joined the Board as an independent non-executive director following the annual general meeting of the company which was held on Tuesday, 21 July 2020. On his appointment as a director, KL Shuenyane became a member of the Audit, Risk & Compliance Committee and Social & Ethics Committee.
NC Nqweni has been appointed as alternate to P Mahanyele-Dabengwa with effect from 1 April 2020, and was appointed as a member of the Audit, Risk & Compliance Committee and Social & Ethics Committee following the annual general meeting of the company which was held on Tuesday, 21 July 2020.
T Streichert resigned from the position of Group Chief Financial Officer and stepped down from the Board on 30 June 2020.
S Mdlalose was appointed to the Board on 1 July 2020 and served as the acting Chief Financial Officer up until 31 October 2020. S Mdlalose also stepped down from the Board on 31 October 2020. RK Morathi was appointed to the Board and as the new Group Chief Financial Officer, with effect from 1 November 2020.
V Badrinath resigned from the Board on 31 December 2020. AM O’Leary was appointed to the Board on 1 January 2021.
Rm2021
Reviewed2020
Audited
6. Capital commitmentsCapital expenditure contracted for but not yet incurred1 4 045 3 537
1. The Group is committed to incur accelerated capital expenditure of US$110 million (R1 624 million) over four years of which approximately 47% has already occurred. Capital commitments as reflected above only include the aforementioned to the extent that open purchase orders have been raised.
29Vodacom Group Limited
Preliminary results for the year ended 31 March 2021

Rm2021
Reviewed2020
Audited
7. Capital expenditure incurredCapital expenditure additions including software 13 307 13 218
8. BorrowingsThere were no material new borrowings raised during the period ended 31 March 2021. Borrowings repaid consists of repayments on lease liabilities which are classified as borrowings under IFRS 16.
Rm2021
Reviewed2020
Audited
9. Cash flows from operating activitiesProfit before tax 23 781 23 058Adjusted for:
Net loss on disposal of subsidiaries 70 819Finance income (767) (884)Finance costs 4 190 4 702Net loss on remeasurement and disposal of financial instruments 378 16
Operating profit 27 652 27 711Adjusted for:
Depreciation and amortisation 15 117 13 955Net profit on disposal of property, plant and equipment and intangible assets (68) (23)Impairment losses 6 –Net credit losses on financial assets 1 078 802Share-based payment 554 502Net profit from associate and joint venture (3 501) (4 149)
Cash flows from operations before working capital changes 40 838 38 797Decrease in inventory 167 55Increase in trade and other receivables (2 569) (1 668)Increase in trade and other payables and provisions 2 353 2 067
Cash generated from operations 40 789 39 251
Notes to the preliminary condensed consolidated financial statements continued
30
10. Impact of COVID-19Since March 2020, the World Health Organisation officially declared the novel coronavirus, COVID-19, a pandemic, triggering various government interventions in order to stem the spread. In our assessment of the impact on our operations and the economies we operate in we have considered the following aspects:
10.1 Going concern considerationsThe going concern basis has been adopted in preparing the preliminary condensed consolidated financial statements for the Group. Telecommunication services are recognised as an essential service during the crisis, which allowed our businesses to continue to operate. As countries attempted to contain the spread of the virus, various forms of restrictions on movement have resulted in an increase in demand for the services we render.
The strength of our financial position will continue to allow us to lead our business through this volatile period. We continually evaluate the impact of the pandemic on our business over the short to medium term. The assessments include macro-economic factors in each of the countries we operate in, the impact on customer spend, liquidity of our customers, our own cash requirements as well as initiatives to contain cost.
10.2 Liquidity-, credit- and interest rate riskThe Group has sufficient funds and committed facilities available to address liquidity risk that may arise from customers experiencing cash flow constraints. In considering the impact on our contract customer base, we have reassessed our credit and risk policies pertaining to our customers and the impact on the recoverability of our debtors under IFRS 9, the impact of which is not significant to our financial results.
The majority of short-term debt is with Vodafone Luxembourg, of which R2 000 million will be repaid subsequent to year end, and R4 000 million is intended to be refinanced, while the remainder relates to short-term items on leases. These are not expected to pose any liquidity risk. The Group continues to monitor its debt exposure between fixed and variable rates, to ensure a balanced portfolio in an uncertain and volatile environment. In order to ensure that short-term liquidity can be met and volatility absorbed, the Group has access to rand denominated facilities of R7 882 million and foreign denominated facilities of R1 511 million.
31Vodacom Group Limited
Preliminary results for the year ended 31 March 2021
11. Contingent liabilities11.1 Guarantees
The Group has various guarantees in issue, relating to external financial obligations of its subsidiaries, which amounted to R97 million (31 March 2020: R64 million).
Foreign denominated guarantees amounting to R1 107 million (31 March 2020: R1 340 million) are in issue in support of the Group’s subsidiary, Vodacom Congo, relating to liabilities included in the consolidated statement of financial position.
11.2 Tax mattersThe Group is regularly subject to an evaluation by tax authorities of its direct and indirect tax filings, the most significant of which are capital allowances, withholding taxes, customs duty and transfer pricing in certain jurisdictions. The consequence of such reviews is that disputes may arise with tax authorities over the interpretation or application of certain tax rules to the Group’s business. The tax laws are in some instances ambiguous and subject to a broad range of interpretations. To address and manage this tax uncertainty, good governance is fundamental to the Group’s business sustainability. All major tax positions taken are subject to review by executive management and are reported to the Board. The Group has support from external advisors with regards to the positions taken in respect of the significant tax matters which confirms the application and interpretation of the tax legislation. The Group has considered all matters in dispute with the relevant tax authorities and has accounted for any exposure identified, if required. The Group has not disclosed all the details in respect of the open tax disputes as these matters are still under the dispute resolution process. These disputes may not necessarily be resolved in a manner that is favourable to the Group.
11.3 Legal contingencies The Group is currently involved in various legal disputes across its different jurisdictions and has, in consultation with its legal advisors, assessed the possible outcomes in these cases and has determined that adequate provision has been made in respect of all these cases as at 31 March 2021.
Notes to the preliminary condensed consolidated financial statements continued
32

12. Other matters12.1 Kenneth Makate (Mr Makate) vs Vodacom (Pty) Limited
Following the deadlock in the negotiations between the parties, Mr Makate elected to refer the matter to the Group’s Chief Executive Officer, in his judicially sanctioned role as a deadlock breaking mechanism (the deadlock breaker), to make a determination on the reasonable amount of compensation payable to him. The deadlock breaker has made such a determination, in accordance with the Constitutional Court order, but Mr Makate has rejected his determination. Mr Makate has since launched an application in the High Court of South Africa to have the decision of the deadlock breaker reviewed and set aside. The hearing took place from the 4th to the 6th of May, and judgement is awaited.
12.2 Independent Communications Authority of South Africa (ICASA) Invitation to Apply (ITA) ICASA issued two separate Invitations to Apply (ITA) on 2 October 2020 regarding the assignment of High Demand Spectrum (HDS) in South Africa, in respect of the provision of mobile broadband wireless access services for urban and rural areas using the complimentary International Mobile telecommunications (IMT) spectrum bands i.e. IMT700, IMT800, IMT2600 and IMT3500 ranges. The first ITA sets out ICASA’s licensing process for new individual electronic communications network services (I-ECNS) and Radio Frequency Spectrum Licences for the purpose of operating a wireless open access network (WOAN). The second ITA sets out the licensing process for assignment of HDS to the existing I-ECNS licensees for the purposes of providing national broadband wireless access services. Subsequent to the issuance of the invitations, on 22 December 2020, Telkom filed a court application, in respect of the ITAs. The filing inter alia sought to suspend the closing date for submission of applications for the licence to operate a WOAN, and interdict ICASA from assessing or adjudicating any applications received in respect of the ITAs, pending a full review of the ITAs processes. Separately, in January 2021, MTN petitioned the court to review the opt-in part of the second ITA. In March 2021, the High Court in Pretoria issued an order, interdicting ICASA from proceeding with the ITA process pending the final determination of Telkom’s application to review ICASA’s ITAs. The industry now awaits the outcome of the court proceedings before the future process and date can be determined.
12.3 ICASA inquiry into mobile broadband services On 16 November 2018, ICASA gave notice of its intention to conduct an inquiry into mobile broadband services. The purpose of the inquiry was to assess the state of competition, and to determine whether there were markets or market segments within the mobile broadband services value chain that may require regulatory intervention in terms of Chapter 10 of the Electronic Communications Act, 2005. Following a discussion document released during November 2019 and public hearings held during October 2019, ICASA issued a findings document and Draft Mobile Broadband Services Regulations on 26 March 2021. ICASA concluded that Vodacom and MTN have significant market power in certain retail and wholesale mobile service markets. Further, ICASA proposed several pro-competitive terms and intends to monitor retail prices and wholesale prices.
33Vodacom Group Limited
Preliminary results for the year ended 31 March 2021

12. Other matters continued 12.4 Application to the Competition Tribunal regarding agreements between
Vodacom (Pty) Limited (the Company) and Rain Networks (Pty) Limited (Rain) Telkom South Africa SOC Limited (Telkom) launched an application to the Competition Tribunal in October 2020 in respect of a transaction concluded by the Company and Rain. Telkom is applying to the Competition Tribunal for an order that, amongst others, the arrangements and transaction concluded by the Company and Rain constitutes a notifiable merger in terms of the Competition Act, which must be notified to the Competition Commission and that the Company and Rain are prohibited from taking any steps to further implement the transaction until such time as the merger has been approved. The Company has given notice of intention to oppose the matter. The proceedings are ongoing.
12.5 Vodacom Congo (RDC) SA (Vodacom Congo) Organisation for the Harmonisation of Business Law in Africa (OHADA) Vodacom Congo is not in compliance with the minimum capital requirements as set out under the OHADA. Vodacom Congo has to increase its share capital to meet the minimum OHADA requirements. A non-compliance gap remains, and the matter is continuously being discussed by the Board and shareholders of Vodacom Congo.
12.6 Vodacom Lesotho (Pty) Limited (Vodacom Lesotho) enforcement proceedings In December 2019, the Lesotho Communications Authority (LCA) issued a notice of enforcement against Vodacom Lesotho premised on its view that the company’s statutory external auditors were not independent, as required by the Companies Act. The statutory external auditors of Vodacom Lesotho are not affiliated to the Group auditors, Ernst & Young Inc.
On 28 September, the LCA issued a penalty of R134 million against Vodacom Lesotho. Despite Vodacom Lesotho reserving its rights for appeal within the statutory timeframe, on 8 October 2020, the LCA issued a notice of revocation of the operating licence of Vodacom Lesotho for failure to pay the penalty.
Vodacom Lesotho has launched an application in the Lesotho High Court to have both determinations of the LCA imposing the fine and revoking its operating licence, respectively, reviewed and set aside. The Lesotho High Court has, in the meantime, issued an order interdicting the LCA from, inter alia, enforcing the payment of the said fine and revoking Vodacom Lesotho’s operating licence. The Lesotho High Court heard the matter in December 2020, and Vodacom Lesotho is awaiting judgement.
13. Events after the reporting period The Board is not aware of any matter or circumstance arising since the end of the reporting period, not otherwise dealt with herein, which significantly affects the financial position of the Group or the results of its operations or cash flows for the period, other than the following:
13.1 Dividend declared after the reporting date and not recognised as a liability A final dividend of R7 527 million (410 cents per ordinary share) for the period ended 31 March 2021, was declared on 17 May 2021, payable on 28 June 2021 to shareholders recorded in the register at the close of business on 25 June 2021. The net dividend after taking into account dividend withholding tax for those shareholders not exempt from dividend withholding tax is 328.00000 cents per share.
Notes to the preliminary condensed consolidated financial statements continued
34

13. Events after the reporting period continued13.2 Participation by the Group in a consortium bidding for a mobile
telecommunications licence in the Federal Democratic Republic of Ethiopia The Government of the Federal Democratic Republic of Ethiopia, through the Ethiopian Communications Authority (ECA), issued a final request for proposals on 5 March 2021 for the award of two full service mobile telecommunication licences in Ethiopia. On 26 April 2021, the Group participated as a minority in a consortium (effective interest of 6.2%), controlled by Safaricom Plc, bidding for a mobile telecommunication licence in the Federal Democratic Republic of Ethiopia. The ECA has indicated that successful bidders will be announced within thirty days (subject to timing subsequently advised by the ECA). As part of and in relation to the bid submission, the consortium issued guarantees in favour of the ECA.
14. Fair value The carrying amounts of financial assets at amortised cost, trade receivables, bank and cash balances, bank overdraft and trade and other payables approximate their fair value due to short-term maturity.
The aggregate fair value, if determinable, of interest bearing borrowings, excluding leases, with a carrying amount of R36 934 million (2020: R33 608 million) amounts to R37 444 million (2020: R34 312 million). Fair value is based on level two of the fair value hierarchy2. Estimated interest for fixed interest rate financial liabilities is calculated with reference to the applicable zero coupon yield curves at the reporting date, as published by Bloomberg. Where the fair value could be determined by using the discounted cash flow method, with a discount rate based on market-related interest rates, the discount rate varied between 5.25% and 6.33% (2020: 7.7% and 9.0%) for rand-denominated borrowings.
14.1 Fair value hierarchy The table below sets out the valuation basis of financial instruments measured at fair value:
Rm2021
Reviewed2020
Audited
Level one1
Financial assets at fair value through profit or lossUnit trust investments 341 320Level two2
Financial assets at fair value through other comprehensive incomeFinance receivables3 4 706 4 084Financial assets and liabilities at fair value through profit or lossDerivative financial assets4 122 658Derivative financial liabilities4 (205) (335)
4 964 4 727
1. Level one classification is used when the valuation is determined using quoted prices in an active market.2. Level two classification is used when valuation inputs used to determine fair value are observable for the asset/(liability), either
directly as prices or indirectly when derived from prices. 3. The Group provides financing to customers to acquire devices at an additional contractual charge which is included in finance
receivables. The business model under IFRS 9 for finance receivables has been determined to be "hold to collect and sell". Finance receivables are valued using a market approach, with cash flows discounted at the 24 month weighted average credit risk adjusted risk free rate at which finance receivables are sold across multiple financial institutions.
4. The fair value of foreign exchange forward contracts and firm commitment assets and liabilities are determined with reference to quoted market prices for similar instruments, being the mid forward rates and spot rates, respectively, as at the reporting date.
35Vodacom Group Limited
Preliminary results for the year ended 31 March 2021

Operating results for the year ended 31 March 2021
RmSouth Africa
% change
20/21Inter-
national
% change
20/21Corporate/
Eliminations Group
% change
20/21 Safaricom1
% change
20/21
Mobile contract revenue 20 829 5.0 1 469 9.3 (6) 22 292 5.3 3 420 (2.6)Mobile prepaid revenue 25 359 8.5 18 009 3.9 (2) 43 366 6.6 30 153 3.2
Customer service revenue 46 188 6.9 19 478 4.3 (8) 65 658 6.1 33 573 2.5
Mobile interconnect 1 742 (8.0) 1 330 0.2 (544) 2 528 (1.9) 1 426 16.2Fixed service revenue 3 556 11.5 1 233 (27.9) (390) 4 399 (0.6) 1 429 10.3Other service revenue 4 919 11.4 105 15.4 (35) 4 989 11.6 1 172 11.0
Service revenue 56 405 7.0 22 146 1.6 (977) 77 574 5.8 37 600 3.5
Equipment revenue 14 756 8.0 297 (29.1) (21) 15 032 6.9 1 527 22.5Non-service revenue 5 576 73.0 303 10.6 (183) 5 696 70.9 500 29.9
Revenue 76 737 10.3 22 746 1.1 (1 181) 98 302 8.3 39 627 4.4
Direct expenses (32 191) 16.7 (6 166) (4.7) 1 010 (37 347) 13.6 (12 593) 13.2Staff expenses (4 639) 12.1 (1 778) (0.7) (573) (6 990) 8.9 (2 366) 13.1Publicity expenses (1 120) (11.5) (591) (5.3) (7) (1 718) (9.9) (594) (27.4)Other operating expenses (7 999) 5.3 (5 495) 11.3 521 (12 973) 7.9 (3 938) (0.6)Depreciation and amortisation (10 274) 10.2 (4 835) 4.6 (8) (15 117) 8.3 (8 182) 7.1Impairment charges – – (6) – – (6) – – n/aNet profit from associate and joint ventures 1 – (42) – 3 542 3 501 (15.6) (68) (112.6)
Operating profit 20 515 4.2 3 833 (16.3) 3 304 27 652 (0.2) 11 886 (7.5)
EBITDA 30 745 5.7 8 784 1.2 (230) 39 299 4.5 20 125 0.9EBITDA margin (%) 40.1 (1.7ppt) 38.6 – 40.0 (1.4ppt) 50.8 (1.8ppt)
Included in service revenue:Financial services revenue 2 372 18.9 4 513 13.0 – 6 885 15.0 12 391 1.7
Note: 1. The Group’s effective interest of 34.94% in Safaricom Plc (Safaricom) is accounted for as an investment in associate. Results represent 100% of Safaricom
and is for information purposes only.
Supplementary information
36

Operating results for the year ended 31 March 2020
Rm South AfricaInter-
national Corporate/
Eliminations Group Safaricom1
Mobile contract revenue 19 841 1 344 (6) 21 179 3 510Mobile prepaid revenue 23 372 17 327 – 40 699 29 230
Customer service revenue 43 213 18 671 (6) 61 878 32 740
Mobile interconnect 1 893 1 328 (644) 2 577 1 227Fixed service revenue 3 189 1 709 (471) 4 427 1 296Other service revenue 4 417 91 (36) 4 472 1 056
Service revenue 52 712 21 799 (1 157) 73 354 36 319
Equipment revenue 13 657 419 (17) 14 059 1 247Non-service revenue 3 224 274 (165) 3 333 385
Revenue 69 593 22 492 (1 339) 90 746 37 951
Direct expenses (27 587) (6 467) 1 177 (32 877) (11 123)Staff expenses (4 140) (1 791) (490) (6 421) (2 092)Publicity expenses (1 265) (624) (18) (1 907) (818)Other operating expenses (7 597) (4 936) 509 (12 024) (3 960)Depreciation and amortisation (9 322) (4 624) (9) (13 955) (7 640)Impairment charges – – – – –Net profit from associate and joint ventures 2 532 3 615 4 149 538
Operating profit 19 684 4 582 3 445 27 711 12 856
EBITDA 29 094 8 679 (163) 37 610 19 950EBITDA margin (%) 41.8 38.6 – 41.4 52.6
Included in service revenue:Financial services revenue 1 995 3 993 – 5 988 12 185
Note: 1. The Group’s effective interest of 34.94% in Safaricom Plc (Safaricom) is accounted for as an investment in associate. Results represent 100% of
Safaricom and is for information purposes only.
37Vodacom Group Limited
Preliminary results for the year ended 31 March 2021
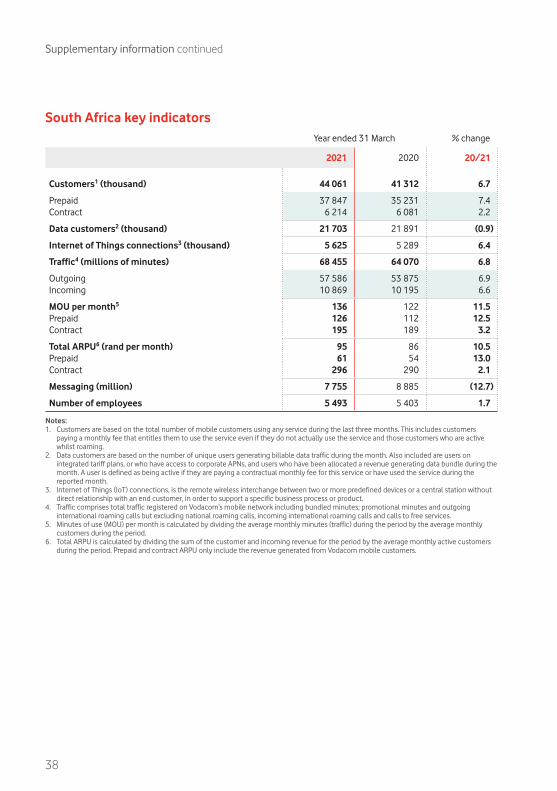
South Africa key indicatorsYear ended 31 March % change
2021 2020 20/21
Customers1 (thousand) 44 061 41 312 6.7
Prepaid 37 847 35 231 7.4Contract 6 214 6 081 2.2
Data customers2 (thousand) 21 703 21 891 (0.9)
Internet of Things connections3 (thousand) 5 625 5 289 6.4
Traffic4 (millions of minutes) 68 455 64 070 6.8
Outgoing 57 586 53 875 6.9Incoming 10 869 10 195 6.6
MOU per month5 136 122 11.5Prepaid 126 112 12.5Contract 195 189 3.2
Total ARPU6 (rand per month) 95 86 10.5Prepaid 61 54 13.0Contract 296 290 2.1
Messaging (million) 7 755 8 885 (12.7)
Number of employees 5 493 5 403 1.7
Supplementary information continued
Notes:1. Customers are based on the total number of mobile customers using any service during the last three months. This includes customers
paying a monthly fee that entitles them to use the service even if they do not actually use the service and those customers who are active whilst roaming.
2. Data customers are based on the number of unique users generating billable data traffic during the month. Also included are users on integrated tariff plans, or who have access to corporate APNs, and users who have been allocated a revenue generating data bundle during the month. A user is defined as being active if they are paying a contractual monthly fee for this service or have used the service during the reported month.
3. Internet of Things (IoT) connections, is the remote wireless interchange between two or more predefined devices or a central station without direct relationship with an end customer, in order to support a specific business process or product.
4. Traffic comprises total traffic registered on Vodacom’s mobile network including bundled minutes; promotional minutes and outgoing international roaming calls but excluding national roaming calls, incoming international roaming calls and calls to free services.
5. Minutes of use (MOU) per month is calculated by dividing the average monthly minutes (traffic) during the period by the average monthly customers during the period.
6. Total ARPU is calculated by dividing the sum of the customer and incoming revenue for the period by the average monthly active customers during the period. Prepaid and contract ARPU only include the revenue generated from Vodacom mobile customers.
38
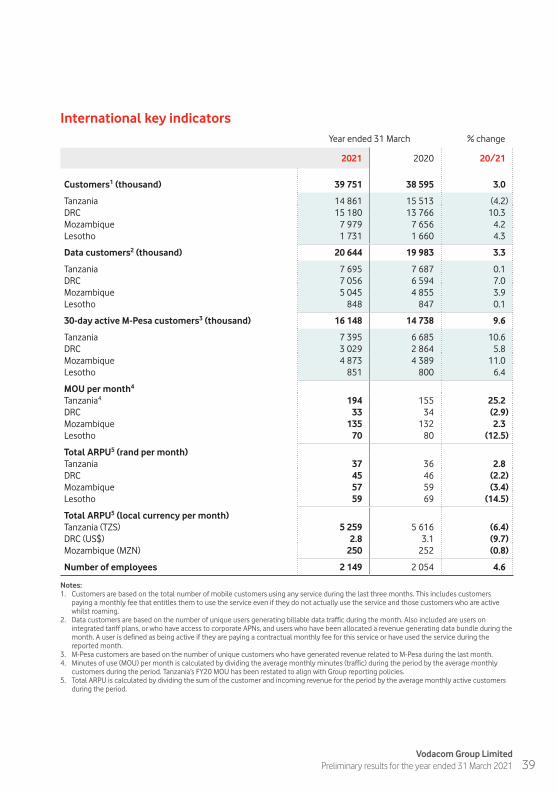
International key indicatorsYear ended 31 March % change
2021 2020 20/21
Customers1 (thousand) 39 751 38 595 3.0
Tanzania 14 861 15 513 (4.2)DRC 15 180 13 766 10.3Mozambique 7 979 7 656 4.2Lesotho 1 731 1 660 4.3
Data customers2 (thousand) 20 644 19 983 3.3
Tanzania 7 695 7 687 0.1DRC 7 056 6 594 7.0Mozambique 5 045 4 855 3.9Lesotho 848 847 0.1
30-day active M-Pesa customers3 (thousand) 16 148 14 738 9.6
Tanzania 7 395 6 685 10.6DRC 3 029 2 864 5.8Mozambique 4 873 4 389 11.0Lesotho 851 800 6.4
MOU per month4
Tanzania4 194 155 25.2DRC 33 34 (2.9)Mozambique 135 132 2.3Lesotho 70 80 (12.5)
Total ARPU5 (rand per month)Tanzania 37 36 2.8DRC 45 46 (2.2)Mozambique 57 59 (3.4)Lesotho 59 69 (14.5)
Total ARPU5 (local currency per month)Tanzania (TZS) 5 259 5 616 (6.4)DRC (US$) 2.8 3.1 (9.7)Mozambique (MZN) 250 252 (0.8)
Number of employees 2 149 2 054 4.6
Notes:1. Customers are based on the total number of mobile customers using any service during the last three months. This includes customers
paying a monthly fee that entitles them to use the service even if they do not actually use the service and those customers who are active whilst roaming.
2. Data customers are based on the number of unique users generating billable data traffic during the month. Also included are users on integrated tariff plans, or who have access to corporate APNs, and users who have been allocated a revenue generating data bundle during the month. A user is defined as being active if they are paying a contractual monthly fee for this service or have used the service during the reported month.
3. M-Pesa customers are based on the number of unique customers who have generated revenue related to M-Pesa during the last month.4. Minutes of use (MOU) per month is calculated by dividing the average monthly minutes (traffic) during the period by the average monthly
customers during the period. Tanzania’s FY20 MOU has been restated to align with Group reporting policies.5. Total ARPU is calculated by dividing the sum of the customer and incoming revenue for the period by the average monthly active customers
during the period.
39Vodacom Group Limited
Preliminary results for the year ended 31 March 2021

Safaricom key indicatorsYear ended 31 March % change
2021 2020 20/21
Customers1 (thousand) 39 902 35 607 12.1Data customers2 (thousand) 20 044 19 622 2.2M-Pesa customers3 (thousand) 28 307 24 910 13.6ARPU4 (local currency per month) 551.3 614.6 (10.3)
International financial review per countryYear ended 31 March % change
2021 2020 20/21
Revenue (local currency)Tanzania (TZSm) 974 391 1 032 667 (5.6)DRC (US$000) 509 156 511 523 (0.5)Mozambique (MZNm) 25 462 24 601 3.5Lesotho (LSLm) 1 209 1 377 (12.2)
EBITDA (local currency)Tanzania (TZSm) 316 341 359 690 (12.1)DRC (US$000) 197 926 194 369 1.8Mozambique (MZNm) 12 410 11 504 7.9Lesotho (LSLm) 517 619 (16.5)
Supplementary information continued
Notes:1 A customer is defined as a Subscriber Identity Module (SIM), or in territories where SIMs do not exist, a unique mobile telephone number
which has access to the network for any purpose (including data only usage) except telemetric applications. 2 Data customers are based on the number of unique users generating billable data traffic during the month. Also included are users on
integrated tariff plans, or who have access to corporate APNs, and users who have been allocated a revenue generating data bundle during the month. A user is defined as being active if they are paying a contractual monthly fee for this service or have used the service during the month reported.
3 Number of unique customers who have generated revenue related to M-Pesa in the past 30 days.4 ARPU is calculated by dividing the average total service revenue by the average monthly customers during the period.
40

Historical financial review
Revenue for the quarter ended
Rm31 March
202131 December
202030 September
202030 June
202031 March
202031 December
201930 September
2019
South Africa 20 294 19 729 19 459 17 255 17 493 18 183 17 358International 5 315 5 685 5 952 5 794 5 558 5 789 5 869Corporate and eliminations (285) (280) (297) (319) (320) (346) (365)
Group revenue 25 324 25 134 25 114 22 730 22 731 23 626 22 862
Revenue YoY % change for the quarter endedReported Normalised*
%31 March
202131 December
202030 September
202030 June
202031 March
2021
South Africa 16.0 8.5 12.1 4.2 16.0International (4.4) (1.8) 1.4 9.8 4.0Corporate and eliminations (10.9) (19.1) (18.6) (3.6) (10.9)
Group service revenue 11.4 6.4 9.9 5.6 13.7
Service revenue for the quarter ended
Rm31 March
202131 December
202030 September
202030 June
202031 March
202031 December
201930 September
2019
South Africa 14 481 14 306 14 240 13 378 13 348 13 567 13 220International 5 194 5 543 5 751 5 658 5 397 5 622 5 668Corporate and eliminations (243) (222) (237) (275) (293) (290) (318)
Group service revenue 19 432 19 627 19 754 18 761 18 452 18 899 18 570
Service revenue YoY % change for the quarter endedReported Normalised*
%31 March
202131 December
202030 September
202030 June
202031 March
2021
South Africa 8.5 5.4 7.7 6.4 8.5International (3.8) (1.4) 1.5 10.7 4.3Corporate and eliminations (17.1) (23.4) (25.5) (7.4) (17.1)
Group service revenue 5.3 3.9 6.4 7.6 7.8
41Vodacom Group Limited
Preliminary results for the year ended 31 March 2021

Exchange ratesAverage YTD Closing YTD
31 March % change 31 March % change
2021 2020 20/21 2021 2020 20/21
US$/ZAR 16.36 14.79 10.6 14.77 17.86 (17.3)ZAR/MZN 4.43 4.27 3.7 4.58 3.78 21.2ZAR/TZS 142.57 155.93 (8.6) 157.05 129.62 21.2EUR/ZAR 19.04 16.42 16.0 17.35 19.60 (11.5)ZAR/KES 6.67 6.93 (3.8) 7.41 5.88 26.0
Average QTD Closing QTD
31 March 2021
31 December2020
30 September2020
30 June2020
31 March 2021
31 December2020
30 September2020
30 June2020
US$/ZAR 14.95 15.61 16.92 17.94 14.77 14.69 16.68 17.38ZAR/MZN 4.96 4.72 4.20 3.82 4.58 5.08 4.34 4.04ZAR/TZS 155.10 148.80 137.24 129.14 157.05 157.88 139.09 133.41EUR/ZAR 18.03 18.60 19.78 19.75 17.35 17.97 19.56 19.51ZAR/KES 7.34 7.02 6.39 5.95 7.41 7.43 6.50 6.13
Supplementary information continued
42
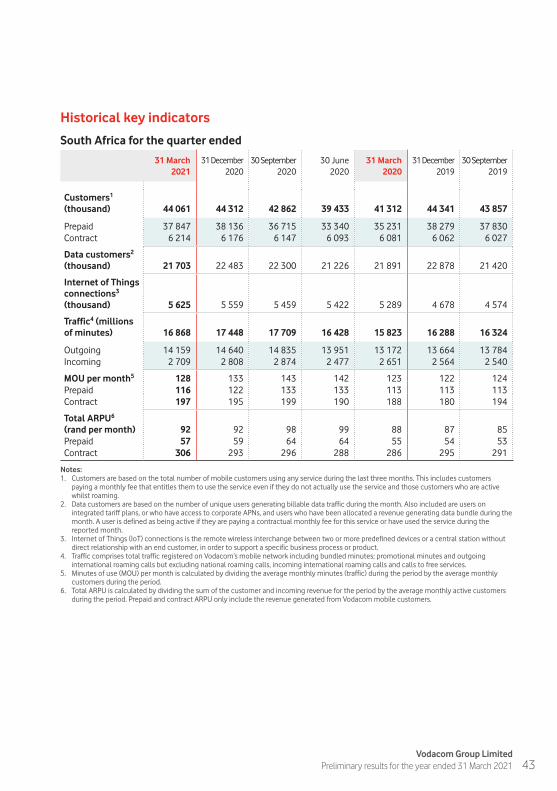
Historical key indicators
South Africa for the quarter ended
31 March 2021
31 December2020
30 September2020
30 June2020
31 March 2020
31 December2019
30 September2019
Customers1 (thousand) 44 061 44 312 42 862 39 433 41 312 44 341 43 857
Prepaid 37 847 38 136 36 715 33 340 35 231 38 279 37 830Contract 6 214 6 176 6 147 6 093 6 081 6 062 6 027
Data customers2 (thousand) 21 703 22 483 22 300 21 226 21 891 22 878 21 420
Internet of Things connections3 (thousand) 5 625 5 559 5 459 5 422 5 289 4 678 4 574
Traffic4 (millions of minutes) 16 868 17 448 17 709 16 428 15 823 16 288 16 324
Outgoing 14 159 14 640 14 835 13 951 13 172 13 664 13 784Incoming 2 709 2 808 2 874 2 477 2 651 2 564 2 540
MOU per month5 128 133 143 142 123 122 124Prepaid 116 122 133 133 113 113 113Contract 197 195 199 190 188 180 194
Total ARPU6 (rand per month) 92 92 98 99 88 87 85Prepaid 57 59 64 64 55 54 53Contract 306 293 296 288 286 295 291
Notes:1. Customers are based on the total number of mobile customers using any service during the last three months. This includes customers
paying a monthly fee that entitles them to use the service even if they do not actually use the service and those customers who are active whilst roaming.
2. Data customers are based on the number of unique users generating billable data traffic during the month. Also included are users on integrated tariff plans, or who have access to corporate APNs, and users who have been allocated a revenue generating data bundle during the month. A user is defined as being active if they are paying a contractual monthly fee for this service or have used the service during the reported month.
3. Internet of Things (IoT) connections is the remote wireless interchange between two or more predefined devices or a central station without direct relationship with an end customer, in order to support a specific business process or product.
4. Traffic comprises total traffic registered on Vodacom’s mobile network including bundled minutes; promotional minutes and outgoing international roaming calls but excluding national roaming calls, incoming international roaming calls and calls to free services.
5. Minutes of use (MOU) per month is calculated by dividing the average monthly minutes (traffic) during the period by the average monthly customers during the period.
6. Total ARPU is calculated by dividing the sum of the customer and incoming revenue for the period by the average monthly active customers during the period. Prepaid and contract ARPU only include the revenue generated from Vodacom mobile customers.
43Vodacom Group Limited
Preliminary results for the year ended 31 March 2021

Historical key indicators
International for the quarter ended
31 March 2021
31 December2020
30 September2020
30 June2020
31 March 2020
31 December2019
30 September2019
Customers1 (thousand) 39 751 39 415 38 600 37 676 38 595 38 241 36 587
Tanzania 14 861 15 171 14 958 14 743 15 513 15 597 14 755DRC 15 180 14 818 14 470 13 909 13 766 13 402 12 995Mozambique 7 979 7 744 7 677 7 556 7 656 7 522 7 279Lesotho 1 731 1 682 1 495 1 468 1 660 1 720 1 558
Data customers2 (thousand) 20 644 20 744 20 442 19 955 19 983 20 593 19 678
Tanzania 7 695 7 881 7 742 7 714 7 687 8 369 8 166DRC 7 056 6 850 6 912 6 531 6 594 6 330 6 071Mozambique 5 045 5 068 4 948 4 884 4 855 4 984 4 656Lesotho 848 945 840 826 847 910 785
MOU per month3
Tanzania3 201 198 198 181 148 153 165DRC 32 33 34 32 34 36 34Mozambique 135 143 135 129 128 141 133Lesotho 64 79 72 67 73 84 85
30-day active M-Pesa customers4 (thousand) 16 148 15 988 15 562 14 686 14 738 14 847 14 297
Tanzania 7 395 7 447 7 449 7 124 6 685 7 477 7 197DRC 3 029 2 963 2 781 2 504 2 864 2 316 2 228Mozambique 4 873 4 805 4 670 4 465 4 389 4 305 4 217Lesotho 851 773 662 593 800 749 655
Total ARPU5 (rand per month)Tanzania 33 37 40 39 32 37 39DRC 42 44 48 47 46 46 48Mozambique 52 57 58 60 58 61 62Lesotho 53 63 63 57 62 70 71
Total ARPU5 (local currency per month)Tanzania (TZS) 5 152 5 467 5 437 4 978 4 755 5 826 6 050DRC (US$) 2.8 2.8 2.8 2.6 3.0 3.1 3.3Mozambique (MZN) 257 271 245 228 245 260 261
Supplementary information continued
Notes:1. Customers are based on the total number of mobile customers using any service during the last three months. This includes customers
paying a monthly fee that entitles them to use the service even if they do not actually use the service and those customers who are active whilst roaming.
2. Data customers are based on the number of unique users generating billable data traffic during the month. Also included are users on integrated tariff plans, or who have access to corporate APNs, and users who have been allocated a revenue generating data bundle during the month. A user is defined as being active if they are paying a contractual monthly fee for this service or have used the service during the reported month.
3. Minutes of use (MOU) per month is calculated by dividing the average monthly minutes (traffic) during the period by the average monthly customers during the period. Tanzania’s historical MOU has been restated to align with Group reporting policies.
4. M-Pesa customers are based on the number of unique customers who have generated revenue related to M-Pesa during the last month.5. Total ARPU is calculated by dividing the sum of the customer and incoming revenue for the period by the average monthly active customers
during the period.
44
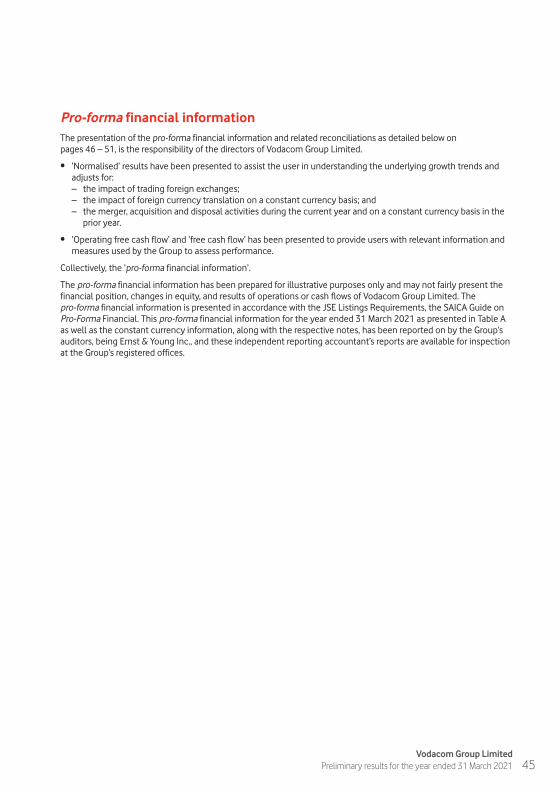
Pro-forma financial informationThe presentation of the pro-forma financial information and related reconciliations as detailed below on pages 46 – 51, is the responsibility of the directors of Vodacom Group Limited.
• ‘Normalised’ results have been presented to assist the user in understanding the underlying growth trends and adjusts for:
– the impact of trading foreign exchanges; – the impact of foreign currency translation on a constant currency basis; and – the merger, acquisition and disposal activities during the current year and on a constant currency basis in the
prior year.
• ‘Operating free cash flow’ and ‘free cash flow’ has been presented to provide users with relevant information and measures used by the Group to assess performance.
Collectively, the ‘pro-forma financial information’.
The pro-forma financial information has been prepared for illustrative purposes only and may not fairly present the financial position, changes in equity, and results of operations or cash flows of Vodacom Group Limited. The pro-forma financial information is presented in accordance with the JSE Listings Requirements, the SAICA Guide on Pro-Forma Financial. This pro-forma financial information for the year ended 31 March 2021 as presented in Table A as well as the constant currency information, along with the respective notes, has been reported on by the Group’s auditors, being Ernst & Young Inc., and these independent reporting accountant’s reports are available for inspection at the Group’s registered offices.
45Vodacom Group Limited
Preliminary results for the year ended 31 March 2021

Table A: Reconciliation of normalised values for the year ended 31 March 2021Foreign exchange
RmReported
results1Trading
FX2Translation
FX3
Mergers,acquisitions
and disposals4 Normalised*
RevenueGroup 98 302 – – (33) 98 269International 22 746 – – (33) 22 713South Africa 76 737 – – – 76 737
Service revenueGroup 77 574 – – (33) 77 541International 22 146 – – (33) 22 113South Africa 56 405 – – – 56 405
M-Pesa revenueInternational 4 513 – – – 4 513
Total expensesGroup 59 028 (61) – 3 58 970International 14 030 (81) – 3 13 952South Africa 45 949 4 – – 45 953
EBITDAGroup 39 299 61 – – 39 360International 8 784 81 – – 8 865South Africa 30 745 (4) – – 30 741
Net profit from associate and joint venturesGroup 3 501 37 – 59 3 597Safaricom 3 542 37 – 18 3 597
Operating profitGroup 27 652 98 – 62 27 812International 3 833 81 – 45 3 959South Africa 20 515 (4) – – 20 511
Supplementary information continued
46

Table B: Reconciliation of normalised values for the year ended 31 March 2020Foreign exchange
RmReported
results1Trading
FX2Translation
FX3
Mergers,acquisitions
and disposals4 Normalised*
RevenueGroup 90 746 – 1 371 (591) 91 526International 22 492 – 1 372 (591) 23 273South Africa 69 593 – (1) – 69 592
Service revenueGroup 73 354 – 1 320 (581) 74 093International 21 799 – 1 321 (581) 22 539South Africa 52 712 – (1) – 52 711
M-Pesa revenueInternational 3 993 – 272 – 4 265
Total expensesGroup 53 229 (27) 910 (439) 53 673International 13 818 (11) 909 (439) 14 277South Africa 40 589 (14) (1) – 40 574
EBITDAGroup 37 610 27 457 (89) 38 005International 8 679 11 460 (89) 9 061South Africa 29 094 14 (3) – 29 105
Net profit from associate and joint venturesGroup 4 149 (9) 67 (745) 3 462Safaricom 3 615 (9) 115 (212) 3 509
Operating profitGroup 27 711 18 210 (732) 27 207International 4 582 11 96 (520) 4 169South Africa 19 684 14 (1) – 19 697
47Vodacom Group Limited
Preliminary results for the year ended 31 March 2021
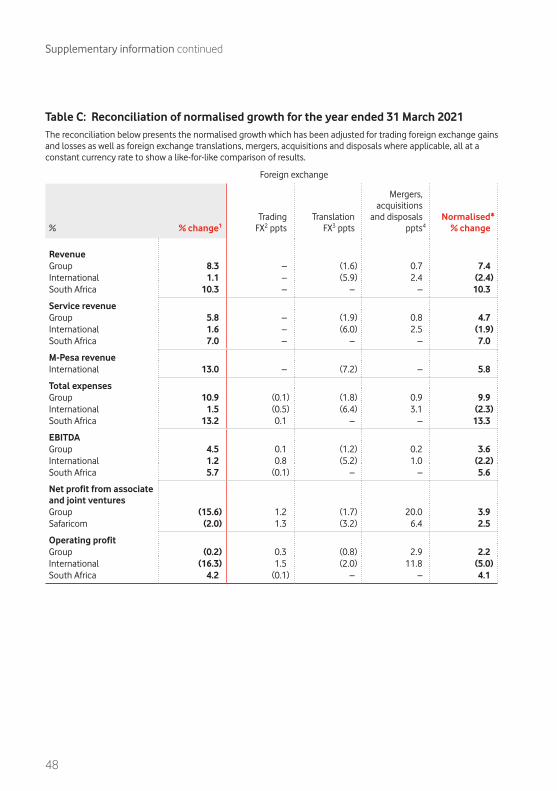
Table C: Reconciliation of normalised growth for the year ended 31 March 2021The reconciliation below presents the normalised growth which has been adjusted for trading foreign exchange gains and losses as well as foreign exchange translations, mergers, acquisitions and disposals where applicable, all at a constant currency rate to show a like-for-like comparison of results.
Foreign exchange
% % change1Trading
FX2 pptsTranslation
FX3 ppts
Mergers,acquisitions
and disposals ppts4
Normalised*% change
RevenueGroup 8.3 – (1.6) 0.7 7.4International 1.1 – (5.9) 2.4 (2.4)South Africa 10.3 – – – 10.3
Service revenueGroup 5.8 – (1.9) 0.8 4.7International 1.6 – (6.0) 2.5 (1.9)South Africa 7.0 – – – 7.0
M-Pesa revenueInternational 13.0 – (7.2) – 5.8
Total expensesGroup 10.9 (0.1) (1.8) 0.9 9.9International 1.5 (0.5) (6.4) 3.1 (2.3)South Africa 13.2 0.1 – – 13.3
EBITDAGroup 4.5 0.1 (1.2) 0.2 3.6International 1.2 0.8 (5.2) 1.0 (2.2)South Africa 5.7 (0.1) – – 5.6
Net profit from associate and joint venturesGroup (15.6) 1.2 (1.7) 20.0 3.9Safaricom (2.0) 1.3 (3.2) 6.4 2.5
Operating profitGroup (0.2) 0.3 (0.8) 2.9 2.2International (16.3) 1.5 (2.0) 11.8 (5.0)South Africa 4.2 (0.1) – – 4.1
Supplementary information continued
48
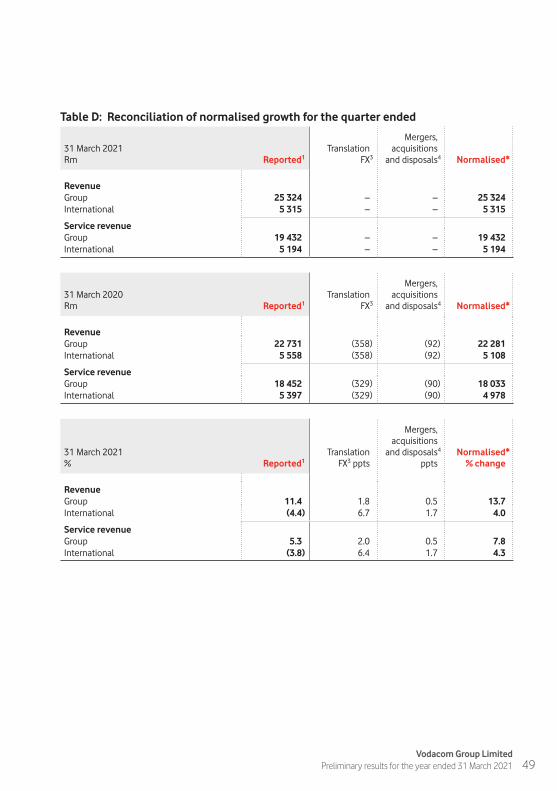
Table D: Reconciliation of normalised growth for the quarter ended
31 March 2021Rm Reported1
TranslationFX3
Mergers,acquisitions
and disposals4 Normalised*
RevenueGroup 25 324 – – 25 324International 5 315 – – 5 315
Service revenueGroup 19 432 – – 19 432International 5 194 – – 5 194
31 March 2020Rm Reported1
TranslationFX3
Mergers,acquisitions
and disposals4 Normalised*
RevenueGroup 22 731 (358) (92) 22 281International 5 558 (358) (92) 5 108
Service revenueGroup 18 452 (329) (90) 18 033International 5 397 (329) (90) 4 978
31 March 2021% Reported1
TranslationFX3 ppts
Mergers,acquisitions
and disposals4
pptsNormalised*
% change
RevenueGroup 11.4 1.8 0.5 13.7International (4.4) 6.7 1.7 4.0
Service revenueGroup 5.3 2.0 0.5 7.8International (3.8) 6.4 1.7 4.3
49Vodacom Group Limited
Preliminary results for the year ended 31 March 2021

Notes:
1. The financial information relating to revenue, service revenue, total expenses, EBITDA, operating profit and net profit from associate and joint ventures re extracted without adjustment from the preliminary condensed consolidated financial statements for the year ended 31 March 2021.
2. Trading foreign exchange adjustments (FX) are foreign exchange gains/losses on foreign denominated monetary assets and liabilities resulting from trading activities of entities within the Group, which is included with other operating expenses as per the preliminary condensed consolidated income statement.
3. The Group’s presentation currency is the South African rand. Our International operations utilise a number of functional currencies, for example the United States dollar, Tanzanian shilling, and Mozambican metical. Translation foreign exchange (FX) arises from the translation of the results, at average rates, of subsidiaries’ functional currencies to Vodacom’s presentation currency, being rand. For year-end purposes, IFRS monthly results are translated at the prevailing average monthly exchange rate and the translated value is accumulated for the twelve-month period. For the pro-forma financial information for the year ended 31 March 2020, these exchange variances are eliminated by applying the average rate for the year ended 31 March 2021 (which is derived by dividing the individual subsidiary’s translated rand value with the functional currency for the period as applicable to each specified line item) to the 31 March 2020 numbers, thereby giving a user a view of the performance which excludes exchange variances. The effective translation rates for pro-forma financial information is similar to those used for IFRS purposes. The prevailing exchange rates for the current and comparative periods are disclosed on page 42.
4. Mergers, acquisitions and disposals, as per page 46 and 47 relates certain subsidiaries with Vodacom Business Africa group being disposed during the year ended 31 March 2020 and the year ended 31 March 2021, realising a net loss of R70 million (FY20: R819 million). Refer to note 4.4 in the preliminary condensed consolidated financial statements for the year ended 31 March 2021. The year ended 31 March 2020 has been adjusted to reflect at constant currency as detailed in note 3.
5. The percentage change relates to the year-on-year percentage growth calculated as the percentage change between the year-to-date 31 March 2021 and year-to-date ended 31 March 2020.
6. The percentage change relates to the quarter to date year-on-year percentage growth calculated as the percentage change between the quarter-to-date 31 March 2021 and the quarter-to-date 31 March 2020 values.
* Normalised growth presents performance on a comparable basis. This adjusts for trading foreign exchange, foreign currency fluctuation on a constant currency basis (using the current year as base) and excludes the impact of merger, acquisition and disposal activities, at a constant currency basis where applicable, to show a like-for-like comparison of results.
Supplementary information continued
50

Table E: Reconciliation of operating free cash flow and free cash flowYear ended 31 March
Rm 2021 2020
Cash generated from operations1 40 789 39 251Cash capital expenditure2 (13 325) (12 943)Lease liability payments3 (4 266) (4 046)Movement in amounts due to M-Pesa account holders4 (1 168) (480)
Operating free cash flow 22 030 21 782Tax paid1 (7 428) (6 417)Dividends received from associate1 3 576 4 394Finance income received1 723 763Finance costs paid5 (2 609) (3 506)Net dividends received from associate and paid non-controlling shareholders1 (1 318) (732)
Free cash flow 14 974 16 284
The reconciliation presents the reconciliation of cash generated from operators to free cash flow. Free cash flow excludes the movement in amounts due to M-Pesa account holders and held on their behalf. Management excludes these balances to present a view of the true commercial cash conversion in the operation.
Notes:1. Extracted without adjustment from the preliminary condensed consolidated statement of cash flows for the year ended 31 March 2021.2. Cash capital expenditure as per the preliminary condensed consolidated statement of cash flows, excluding net capital expenditure of licence
and spectrum fee of R67 million (FY20: R861 million) and acquisition of customer base of R0 million (FY20: R18 million). 3. Lease liability payments includes interest on lease liabilities of R1 336 million (FY20: R1 304 million).4. Movements included in cash generated from operations relate to money held on behalf of M-Pesa customers, which is not available for use by
the Group. 5. This represents the finance costs paid of R3 945 million (FY20: R4 810 million), as extracted from the preliminary condensed consolidated
statement of cash flows for the year ended 31 March 2021, net of Interest on lease liabilities of R1 336 million (FY20: R1 304 million).
51Vodacom Group Limited
Preliminary results for the year ended 31 March 2021

Additional financial and operational measuresThis announcement contains certain financial (i.e. Vodacom Business service revenue and EBITDA) and operational (i.e. customers, ARPUs and number of employees) measures which are presented in addition to the financial information disclosed in the preliminary condensed consolidated financial statements for the year ended 31 March 2021 which have been prepared in terms of IFRS. The Group’s management believes these measures provide valuable additional information in understanding the performance of the Group or the Group’s businesses because they provide measures used by the Group to assess performance. However, this additional information presented is not uniformly defined by all companies, including those in the Group’s industry. Accordingly, it may not be comparable with similarly titled measures and disclosures by other companies. Additionally, although these measures are important in the management of the business, they should not be viewed in isolation or as replacements for or alternatives to, but rather as complementary to, the preliminary condensed consolidated financial statements for the year ended 31 March 2021. The financial measures have been extracted from the management accounts upon which the preliminary condensed consolidated financial statements for the year ended 31 March 2021 are based. Refer to pages 13 for details relating to capital expenditure and the supplementary information on pages 46 to 51 for a reconciliation thereof to the reported results included in this announcement.
TrademarksVodafone, the Vodafone logo, M-Pesa, Connected Farmer, Vodafone Supernet, Vodafone Mobile Broadband, Vodafone WebBox, Vodafone Passport, Vodafone live!, Power to You, Vodacom, Vodacom 4 Less and Vodacom Change the World are trademarks of Vodafone Group Plc (or have applications pending). Other product and company names mentioned herein may be the trademarks of their respective owners.
Supplementary information continued
52

Forward-looking statementsThis announcement which sets out the annual results for Vodacom Group Limited for the year ended 31 March 2021 contains ‘forward-looking statements’, which have not been reviewed or reported on by the Group’s auditors, with respect to the Group’s financial condition, results of operations and businesses and certain of the Group’s plans and objectives. In particular, such forward-looking statements include, but are not limited to, statements with respect to: expectations regarding the Group’s financial condition or results of operations including the confirmation of the Group’s targets, expectations for the Group’s future performance generally; expectations regarding the operating environment and market conditions and trends; intentions and expectations regarding the development, launch and expansion of products, services and technologies; growth in customers and usage; expectations regarding spectrum licence acquisitions; expectations regarding adjusted EBITDA, capital additions, free cash flow, and foreign exchange rate movements; and expectations regarding the integration or performance of current and future investments, associates, joint ventures, non-controlled interests and newly acquired businesses.
Forward-looking statements are sometimes, but not always, identified by their use of a date in the future or such words as ‘will’, ‘anticipates’, ‘aims’, ‘could’, ‘may’, ‘should’, ‘expects’, ‘believes’, ‘intends’, ‘plans’ or ‘targets’ (including in their negative form). By their nature, forward-looking statements are inherently predictive, speculative and involve risk and uncertainty because they relate to events and depend on circumstances that may or may not occur in the future. There are several factors that could cause actual results and developments to differ materially from those expressed or implied by these forward-looking statements. These factors include, but are not limited to, the following: changes in economic or political conditions in markets served by operations of the Group; greater than anticipated competitive activity; higher than expected costs or capital expenditures; slower than expected customer growth and reduced customer retention; changes in the spending patterns of new and existing customers; the Group’s ability to expand its spectrum position or renew or obtain necessary licences; the Group’s ability to achieve cost savings; the Group’s ability to execute its strategy in fibre deployment, network expansion, new product and service roll-outs, mobile data, Vodacom Business and broadband; changes in foreign exchange rates, as well as changes in interest rates; the Group’s ability to realise benefits from entering into partnerships or joint ventures and entering into service franchising and brand licensing; unfavourable consequences to the Group of making and integrating acquisitions or disposals; changes to the regulatory framework in which the Group operates; the impact of legal or other proceedings; loss of suppliers or disruption of supply chains; developments in the Group’s financial condition, earnings and distributable funds and other factors that the Board takes into account when determining levels of dividends; the Group’s ability to satisfy working capital and other requirements; changes in statutory tax rates or profit mix; and/or changes in tax legislation or final resolution of open tax or non-tax legal issues.
All subsequent written or oral forward-looking statements attributable to the Company, to any member of the Group or to any persons acting on their behalf are expressly qualified in their entirety by the factors referred to above. No assurances can be given that the forward-looking statements in this document will be realised. Subject to compliance with applicable law and regulations, Vodacom does not intend to update these forward-looking statements and does not undertake any obligation to do so.
53Vodacom Group Limited
Preliminary results for the year ended 31 March 2021

Corporate information
Vodacom Group Limited(Incorporated in the Republic of South Africa)Registration number: 1993/005461/06(ISIN: ZAE000132577 Share Code: VOD)(ISIN: US92858D2009 ADR code: VDMCY)(Vodacom)
DirectorsSJ Macozoma (Chairman), MS Aziz Joosub (CEO), RK Morathi (CFO), DH Brown, P Klotz1, P Mahanyele-Dabengwa (Alternate NC Nqweni), AM O’Leary2, JWL Otty3, KL Shuenyane, S Sood4, CB Thomson, LS Wood3 (Alternate F Bianco5)
1. Swedish 2. Irish 3. British 4. Indian 5. Italian
Registered OfficeVodacom Corporate Park,082 Vodacom Boulevard,Midrand 1685(Private Bag X9904, Sandton 2146)
Transfer SecretaryComputershare Investor Services (Proprietary) Limited(Registration number 2004/003647/07)Rosebank Towers15 Biermann AvenueRosebank 2196South Africa(PO Box 61051, Marshalltown 2107, South Africa)
SponsorUBS South Africa (Pty) Limited
ADR Depository BankDeutsche Bank Trust Company Americas
Company Secretary SF Linford
Investor RelationsJP Davids
Media RelationsB Kennedy
54


56