preliminary full year results 2019 - mtu aero engines...military business 431 459 6% commercial...
TRANSCRIPT

Preliminary Full Year Results 2019
20 February 2020 - Investor Relations
Conference Call with Investors & Analysts

© MTU Aero Engines AG. The information contained herein is proprietary to the MTU Aero Engines group companies.
2
Business Highlights
• Market fundamentals strong in 2019
• GTF deliveries on track and retrofit work progressing
• Maiden flight of B777x in January 2020, powered by GE9x engines
• MRO contract wins at record level with 7.5 bn US$
• First engine inducted at EME Aero
• Partnership with Safran for the Next Generation Fighter Engine
engaged
• MTU included in German large cap index DAX
• Dividend proposal of 3.40€ per share
20 February 2020 Preliminary Full Year Results 2019 - Investor Relations

© MTU Aero Engines AG. The information contained herein is proprietary to the MTU Aero Engines group companies.
Financial Highlights 2019
20 February 2020 Preliminary Full Year Results 2019 - Investor Relations 3
Revenues
(in m€)
EBIT adjusted
(in m€)
Net income adj.
(in m€)
Free Cash Flow
(in m€)
4,567 4,628
FY 2018 FY 2019
671
757
FY 2018 FY 2019
479
538
FY 2018 FY 2019
203
358
FY 2018 FY 2019
(14.7%)
(16.4%)
+13%
+12%
+77%
+1%
*) Organically 5%
*

© MTU Aero Engines AG. The information contained herein is proprietary to the MTU Aero Engines group companies.
20 February 2020 Preliminary Full Year Results 2019 - Investor Relations 4
Guidance 2019 achieved
Guidance 2019 Actuals 2019
Revenues ~ 4.7 bn€ 4,628 m€
EBIT adj. margin ~ 16% (~750 m€) 16.4% (757 m€)
Net Income adj. Growth in line with EBIT adj. 538 m€
CCR* 65% - 70% 67% (358 m€)

© MTU Aero Engines AG. The information contained herein is proprietary to the MTU Aero Engines group companies.
(in m €) FY 2018 FY 2019 Change
Revenues 1,827 1,996 9%
Military Business 431 459 6%
Commercial Business 1,396 1,537 10%
EBIT adj. 431 496 15%
EBIT adj. margin % 23.6% 24.8%
5
OEM Segment
Preliminary Full Year Results 2019 - Investor Relations20 February 2020
• US$ Commercial business growth: ~ 4%
• Military revenues up by 6%
• EBIT margin slightly up

© MTU Aero Engines AG. The information contained herein is proprietary to the MTU Aero Engines group companies.
6
Commercial MRO
Preliminary Full Year Results 2019 - Investor Relations20 February 2020
(in m €) FY 2018 FY 2019 Change
Revenues 2,800 2,711 -3%
EBIT adj. 240 261 9%
EBIT adj. margin % 8.6% 9.6%
• US$ Organic Revenue growth ~ 7%*
• EBIT margin increase due to shift of V2500 IAE contract and performance MTU Zhuhai
* Adjusted by MTU Zhuhai IAE contract shift

© MTU Aero Engines AG. The information contained herein is proprietary to the MTU Aero Engines group companies.
Organic Growth
Military revenues Up mid single digit
Commercial OE Up high single digit
Commercial Spares Up mid to high single digit
Commercial MRO Up in the low twenties
7
Guidance 2020: Further growth of EBIT adj. and Free Cash Flow Confirmed
*) CCR = Free Cash Flow vs. Net Income adj.
EBIT adj. High single digit growth
Net Income adj. Growth in line with EBIT adj.
CCR* ~ 70%
Preliminary Full Year Results 2019 - Investor Relations20 February 2020

© MTU Aero Engines AG. The information contained herein is proprietary to the MTU Aero Engines group companies.
8
Appendix
Preliminary Full Year Results 2019 - Investor Relations20 February 2020

© MTU Aero Engines AG. The information contained herein is proprietary to the MTU Aero Engines group companies.
9
Group Order Book up 13 %
Appendix
20 February 2020 Preliminary Full Year Results 2019 - Investor Relations
Order book 2018/12/31 Order book 2019/12/31
+13%
17.6 bn€
19.8 bn€

© MTU Aero Engines AG. The information contained herein is proprietary to the MTU Aero Engines group companies.
10
US$ Exchange Rate / Hedge Portfolio
20 February 2020 Preliminary Full Year Results 2019 - Investor Relations
Hedge book as of February 20, 2020 (% of net exposure)
1,330
(=75%)
1,060
(=57%)
680
(=35%)280
(=14%)
2020 2021 2022 2023
in m$
1.18Average hedge
rate (€/US$) 1.18 1.17 1.18
Appendix

© MTU Aero Engines AG. The information contained herein is proprietary to the MTU Aero Engines group companies.
11
Profit & Loss
Preliminary Full Year Results 2019 - Investor Relations20 February 2020
Appendix
Q4 2018 Q4 2019 Change FY 2018 FY 2019 Change
Revenues 1,248 1,225 -2% 4,567 4,628 1%
Total cost of sales -1,036 -988 -3,716 -3,697
Gross profit 213 237 11% 851 931 9%
Gross profit margin % 17.0% 19.3% 18.6% 20.1%
R&D according to IFRS -18 -20 -61 -66
SG&A -49 -49 -199 -203
Other operating income (expense) -6 -13 -17 -39
P&L of companies accounted at equity and equity investments 10 32 46 83
EBIT reported 150 186 24% 620 706 14%
EBIT adjusted 163 199 23% 671 757 13%
EBIT adjusted margin % 13.0% 16.3% 14.7% 16.4%
Financial result -1 -15 -13 -39
Profit before tax (EBT) 149 171 15% 607 667 10%
Taxes (IFRS) -32 -38 -154 -178
Net Income reported 117 134 15% 453 488 8%
Net Income adj. 116 146 479 538
EPS reported* 2.23 2.47 8.67 9.23
EPS adj. 2.25 2.80 9.29 10.38
* without non-controlling interests

© MTU Aero Engines AG. The information contained herein is proprietary to the MTU Aero Engines group companies.
12Preliminary Full Year Results 2019 - Investor Relations20 February 2020
Q4 2018 Q4 2019 Change FY 2018 FY 2019 Change
EBIT reported 150 186 24% 620 706 14%
Adjustment (PPA Depreciation & Amortization) 5 5 21 21
Adjustment (IAE Upshare) 8 8 30 30
EBIT adjusted 163 199 23% 671 757 13%
thereof P&L of companies accounted "at equity" 9 31 44 80
Interest result 1 -2 -1 -17
Interest for pension provisions -4 -4 -14 -15
EBT adj. w/o P&L "at equity" 152 163 7% 613 645 5%
Tax rate normalized -29% -29% -29% -29%
Taxes -44 -47 -178 -187
Net Income adj. 116 146 25% 479 538 12%
EPS adj. 2.25 2.80 24% 9.29 10.38 12%
Appendix
Reconciliation to adjusted Key Performance Indicators

© MTU Aero Engines AG. The information contained herein is proprietary to the MTU Aero Engines group companies.
13
Segment Revenues and EBIT adj.
Preliminary Full Year Results 2019 - Investor Relations20 February 2020
Appendix
Q4 2018 Q4 2019 Change FY 2018 FY 2019 Change
Revenues Group 1,248 1,225 -2% 4,567 4,628 1%
OEM Commercial 359 399 11% 1,396 1,537 10%
OEM Military 128 135 6% 431 459 6%
MRO 780 716 -8% 2,800 2,711 -3%
Consolidation -18 -25 -59 -79
EBIT adjusted Group 163 199 23% 671 757 13%
OEM (Commercial / Military) 91 126 39% 431 496 15%
MRO 72 74 2% 240 261 9%
Consolidation 0 0 0 0
EBIT adjusted margin Group 13.0% 16.3% 14.7% 16.4%
OEM (Commercial / Military) 18.6% 23.5% 23.6% 24.8%
MRO 9.2% 10.3% 8.6% 9.6%

© MTU Aero Engines AG. The information contained herein is proprietary to the MTU Aero Engines group companies.
14
Research & Development
Preliminary Full Year Results 2019 - Investor Relations20 February 2020
Appendix
Q4 2018 Q4 2019 Change FY 2018 FY 2019 Change
Total R&D 54 48 -11% 201 214 7%
Customer funded R&D -8 -9 -6% -24 -31 -30%
Company expensed R&D 45 39 -14% 177 183 3%
Capitalization of R&D -19 -7 -82 -83
Amortisation 4 7 15 22
Total R&D impact P&L (on EBIT) 31 39 24% 111 123 10%
thereof booked into sales and COGS 13 18 50 57
thereof booked into R&D according to IFRS (P&L) 18 20 61 66

© MTU Aero Engines AG. The information contained herein is proprietary to the MTU Aero Engines group companies.
15
Financial Result
Preliminary Full Year Results 2019 - Investor Relations20 February 2020
Appendix
Q4 2018 Q4 2019 Change FY 2018 FY 2019 Change
Interest income 3 1 -54% 8 6 -17%
Interest expense -1 -3 -143% -8 -24 -183%
Interest result 1 -2 -283% -1 -17 <-300%
Financial result on other items -2 -13 -12 -22
US$ / non cash valuations / others 1 -9 2 -7
Interest for pension provisions -4 -4 -14% -14 -15
Financial result -1 -15 -13 -39 -202%

© MTU Aero Engines AG. The information contained herein is proprietary to the MTU Aero Engines group companies.
16
MTU’s Cash development January – December 2019
Preliminary Full Year Results 2019 - Investor Relations20 February 2020
Appendix
99
832
-472
0-31 29
-324
4 2
140
CF from
operating
activities
CF from
investing
activities
Payments for
liquidity
management
Sales
FinancingCash and
cash
equivalents
Dec 31st
2019
Cash and
cash
equivalents
Jan 1st
2019
41
Acquisition
payments for
program shares
CF from
financing
activities
Translation
differences
Adjustments
+358Free Cashflow:
Adjusted Non-operating
exceptional items: -2

© MTU Aero Engines AG. The information contained herein is proprietary to the MTU Aero Engines group companies.
17Preliminary Full Year Results 2019 - Investor Relations20 February 2020
Appendix
Cash Flow
(in m €) FY 2018 FY 2019 Change
Net Income IFRS 453 488 8%
Depreciation and amortization 201 260
Change in provisions and liabilities 185 176
Change in working capital -320 -142
Taxes 17 42
Interest, derivatives, others 60 8
Cash Flow from operating activities 595 832 40%
Net Investment in intangible assets -72 -128
Net Investment in R&D payments and entry fees -48 -22
Net Capital expenditure on property, plant and equipment -184 -299
Net Investments in financial assets -31 -23
Cash Flow from investing activities -336 -472 -40%
Adjustments -56 -2
Free Cash Flow 203 358 77%
Cash Flow from financing activities -263 -324 -23%
Cash and cash equivalents at 31.12. 99 140
© MTU Aero Engines AG. The information contained herein is proprietary to the MTU Aero Engines group companies.
18Preliminary Full Year Results 2019 - Investor Relations20 February 2020
Appendix
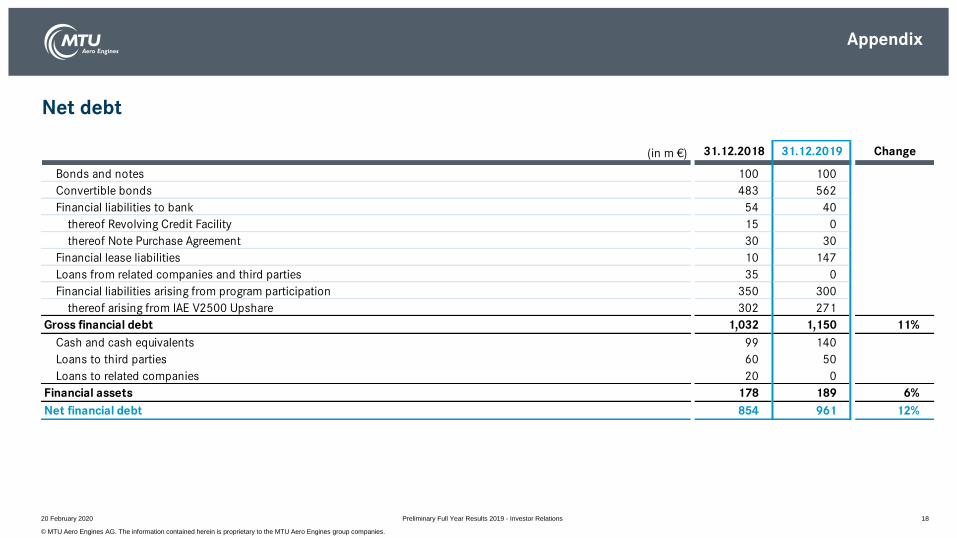
Net debt
(in m €) 31.12.2018 31.12.2019 Change
Bonds and notes 100 100
Convertible bonds 483 562
Financial liabilities to bank 54 40
thereof Revolving Credit Facility 15 0
thereof Note Purchase Agreement 30 30
Financial lease liabilities 10 147
Loans from related companies and third parties 35 0
Financial liabilities arising from program participation 350 300
thereof arising from IAE V2500 Upshare 302 271
Gross financial debt 1,032 1,150 11%
Cash and cash equivalents 99 140
Loans to third parties 60 50
Loans to related companies 20 0
Financial assets 178 189 6%
Net financial debt 854 961 12%

© MTU Aero Engines AG. The information contained herein is proprietary to the MTU Aero Engines group companies.
19
Working capital
Preliminary Full Year Results 2019 - Investor Relations20 February 2020
Appendix
(in m €) 31.12.2018 31.12.2019 Change
Inventories 996 1,279
Prepayments -293 -396
Receivables 1,996 2,083
Payables -1,331 -1,456
Working Capital 1,368 1,510 10%

© MTU Aero Engines AG. The information contained herein is proprietary to the MTU Aero Engines group companies.
20
Balance Sheet
Preliminary Full Year Results 2019 - Investor Relations20 February 2020
Appendix
(in m €) 31.12.2018 31.12.2019 Change
Intangible assets 1,073 1,163
Property, plant, equipment 799 1,101
other non-current assets 1,844 1,892
Total non-current assets 3,716 4,155 12%
Current assets 3,135 3,610 15%
Total assets 6,851 7,765 13%
Equity 2,144 2,421 13%
Non-current liabilities 1,902 2,130 12%
Current liabilities 2,804 3,214 15%
Total equity and liabilities 6,851 7,765 13%
thereof pension provisions 879 976

© MTU Aero Engines AG. The information contained herein is proprietary to the MTU Aero Engines group companies.
21
PPA Depreciation / Amortization
Preliminary Full Year Results 2019 - Investor Relations20 February 2020
Appendix
Q4 2018 Q4 2019 Change FY 2018 FY 2019 Change
OEM 43 50 162 183
MRO 14 20 39 77
Total depreciation / amortization* 57 71 25% 201 260 29%
PPA OEM 5 5 19 19
PPA MRO 1 1 2 2
IAE Upshare OEM 8 8 30 30
PPA depreciation / amortization & IAE Upshare amortization (EBIT adjustments) 13 13 1% 51 51 0%
OEM 31 38 113 134
MRO 13 20 36 75
Depreciation / amortization w/o PPA and w/o IAE Upshare 44 58 32% 149 208 39%
* incl. amortization of intangible assets, capitalized program assets and purchased development
© MTU Aero Engines AG. The information contained herein is proprietary to the MTU Aero Engines group companies.
22
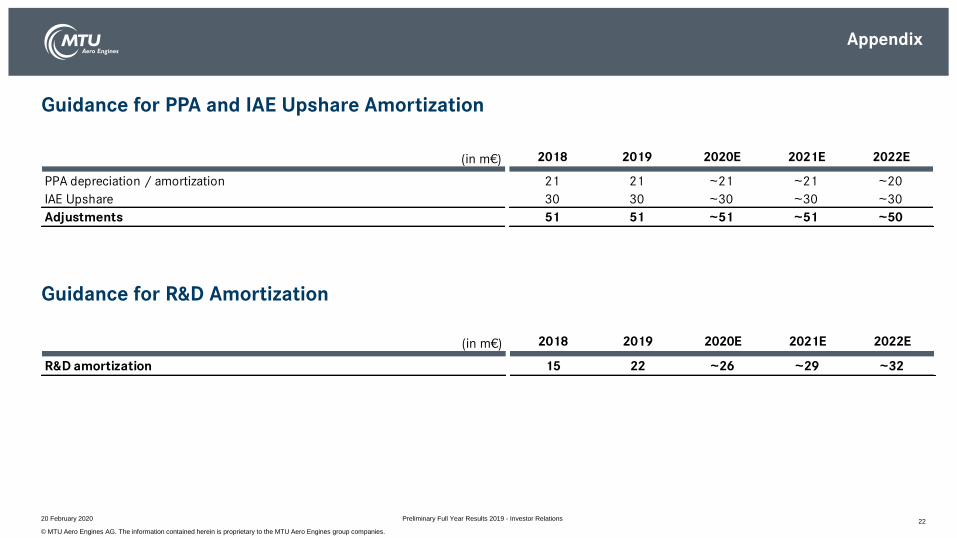
Guidance for PPA and IAE Upshare Amortization
Guidance for R&D Amortization
20 February 2020 Preliminary Full Year Results 2019 - Investor Relations
Appendix
(in m€) 2018 2019 2020E 2021E 2022E
PPA depreciation / amortization 21 21 ~21 ~21 ~20
IAE Upshare 30 30 ~30 ~30 ~30
Adjustments 51 51 ~51 ~51 ~50
(in m€) 2018 2019 2020E 2021E 2022E
R&D amortization 15 22 ~26 ~29 ~32

© MTU Aero Engines AG. The information contained herein is proprietary to the MTU Aero Engines group companies.
Cautionary Note Regarding Forward-Looking Statements
Certain of the statements contained herein may be statements of future expectations and other forward-looking statements that are based on management’s currentviews and assumptions and involve known and unknown risks and uncertainties that could cause actual results, performance or events to differ materially from thoseexpressed or implied in such statements. In addition to statements that are forward-looking by reason of context, the words “may,” “will,” “should,” “expect,” “plan,”“intend,” “anticipate,” “forecast,” “believe,” “estimate,” “predict,” “potential,” or “continue” and similar expressions identify forward-looking statements.
Actual results, performance or events may differ materially from those in such statements due to, without limitation, (i) competition from other companies in MTU’sindustry and MTU’s ability to retain or increase its market share, (ii) MTU’s reliance on certain customers for its sales, (iii) risks related to MTU’s participation inconsortia and risk and revenue sharing agreements for new aero engine programs, (iv) the impact of non-compete provisions included in certain of MTU’s contracts,(v) the impact of a decline in German or other European defense budgets or changes in funding priorities for military aircraft, (vi) risks associated with governmentfunding, (vii) the impact of significant disruptions in MTU’s supply from key vendors, (viii) the continued success of MTU’s research and development initiatives, (ix)currency exchange rate fluctuations, (x) changes in tax legislation, (xi) the impact of any product liability claims, (xii) MTU’s ability to comply with regulations affectingits business and its ability to respond to changes in the regulatory environment, (xiii) the cyclicality of the airline industry and the current financial difficulties ofcommercial airlines, (xiv) our substantial leverage and (xv) general local and global economic conditions. Many of these factors may be more likely to occur, or morepronounced, as a result of terrorist activities and their consequences.
The company assumes no obligation to update any forward-looking statement.
Any securities referred to herein have not been and will not be registered under the U.S. Securities Act of 1933, as amended (the “Securities Act”), and may not be offered or sold without registration thereunder or pursuant to an available exemption therefrom. Any public offering of securities of MTU Aero Engines to be made in the United States would have to be made by means of a prospectus that would be obtainable from MTU Aero Engines and would contain detailed information about the issuer of the securities and its management, as well as financial statements.
Neither this document nor the information contained herein constitutes an offer to sell or the solicitation of an offer to buy any securities.
These materials do not constitute an offer of securities for sale in the United States; the securities may not be offered or sold in the United States absent registration or an exemption from registration.
No money, securities or other consideration is being solicited, and, if sent in response to the information contained herein, will not be accepted.
2320 February 2020 Preliminary Full Year Results 2019 - Investor Relations
© MTU Aero Engines AG. The information contained herein is proprietary to the MTU Aero Engines group companies.
This document contains proprietary information of the MTU Aero Engines AG group companies. The document and its contents shall not
be copied or disclosed to any third party or used for any purpose other than that for which it is provided, without the prior written
agreement of MTU Aero Engines AG.
24
Proprietary Notice
20 February 2020 Preliminary Full Year Results 2019 - Investor Relations