preliminary feasibility study and strategic … feasibility study and strategic ... dimensions of...
TRANSCRIPT
1
Preliminary Feasibility Study and Strategic Deployment Plan
for
Renewable and Sustainable Energy Projects
University of Connecticut
Storrs Campus, Mansfield CT
March 31, 2012
2
The Connecticut Center for Advanced Technology, Inc1 (CCAT) developed this Preliminary Feasibility Study and Strategic
Deployment Plan for Renewable and Sustainable Energy Projects at the University of Connecticut (UConn) Storrs campuses
through collaboration with many members of UConn’s faculty and staff. Specifically, CCAT acknowledges the contributions of
UConn’s Office of Environmental Policy, the Center for Clean Energy Engineering, and Facilities Operations.
Prepared by:
Connecticut Center for Advanced Technology, Inc.
222 Pitkin Street
East Hartford, CT 06108
www.ccat.us
1 CCAT helps private and public entities to apply innovative tools and practices to increase efficiencies, improve workforce development and
boost competitiveness. CCAT's Energy Initiative works to improve the economic competitiveness of the region by advancing community-
supported solutions to reduce energy costs and increase reliability. As part of this goal, CCAT's Energy Initiative develops regional models
for improved energy use, and helps to foster partnerships between industry, government and academia to promote renewable energy,
hydrogen and fuel cell technology.
3
TABLE OF CONTENTS
INTRODUCTION ............................................................................................................................................. 7
EXECUTIVE SUMMARY ............................................................................................................................... 8
SOLAR THERMAL ........................................................................................................................................ 12 UConn Dairy Bar ........................................................................................................................................... 14 Shippee Hall .................................................................................................................................................. 17 Hollister Hall ................................................................................................................................................. 21 Putnam Refectory .......................................................................................................................................... 25 Horsebarn Hill Sciences Complex Building #4 Annex ................................................................................. 29
SOLAR PHOTOVOLTAIC (PV) ................................................................................................................... 32 Solar Related Research .................................................................................................................................. 32 Center for Clean Energy Engineering ............................................................................................................ 35 Homer Babbidge Library ............................................................................................................................... 39 Horsebarn Hill Sciences Complex Building #4 Annex ................................................................................. 40 Information Technology Engineering Building ............................................................................................. 41
SMALL SCALE WIND ................................................................................................................................... 46 Small Wind Related Research ....................................................................................................................... 48 Homer Babbidge Library ............................................................................................................................... 49 North Campus Site ......................................................................................................................................... 54 Longley Building ........................................................................................................................................... 59
GEOTHERMAL .............................................................................................................................................. 67 Geothermal Related Research........................................................................................................................ 68 Thompson Hall .............................................................................................................................................. 69 Horsebarn Hill Sciences Complex Building #4 Annex ................................................................................. 74
STATIONARY FUEL CELLS ....................................................................................................................... 79 Fuel Cell Related Research ............................................................................................................................ 79 Homer Babbidge Library ............................................................................................................................... 81 Information Technology Engineering Building ............................................................................................. 87 Horsebarn Hill Sciences Complex Building #4 Annex ................................................................................. 92
BIOFUELS ....................................................................................................................................................... 98 Biogas Related Research ............................................................................................................................... 98 Longley Building - Biodiesel....................................................................................................................... 100 Center for Clean Energy Engineering - Biogas ........................................................................................... 105
CONCLUSION .............................................................................................................................................. 108

4
INDEX OF FIGURES
Figure 1 - Solar Thermal System .................................................................................................................................................... 12
Figure 2 - Aerial View of UConn Dairy Bar Site ............................................................................................................................ 14
Figure 3 - Aerial View of Shippee Hall Site ................................................................................................................................... 17
Figure 4 - Aerial View of West Campus Residence Halls (Hollister Hall Site) ............................................................................. 21
Figure 5 - Aerial View of the Putnam Hall Site .............................................................................................................................. 25
Figure 6 - Aerial View of Horsebarn Hill Sciences Complex Building #4 Annex Site .................................................................. 29
Figure 7 - Solar PV ......................................................................................................................................................................... 32
Figure 8 - Aerial View of the Center for Clean Energy Engineering .............................................................................................. 35
Figure 9 - South Facing Roof Area Figure 10 – Arial of Homer Babbidge Library of the Library ................ 39
Figure 11 – Aerial View of Horsebarn Hill Sciences Complex Building #4 Annex....................................................................... 40
Figure 12 – Aerial View of the ITE Building ................................................................................................................................. 41
Figure 13 - Small Wind Systems..................................................................................................................................................... 46
Figure 14 - Aerial View of Homer Babbidge Library Site .............................................................................................................. 49
Figure 15 -Aerial View of North Campus Site................................................................................................................................ 54
Figure 16 - Aerial View of Longley Building Site .......................................................................................................................... 59
Figure 17 – Visibility Analysis for a Small Wind System at the Homer Babbidge Library ........................................................... 64
Figure 18 – Visibility Analysis for a Small Wind System at the North Campus Site ..................................................................... 65
Figure 19 - Visibility Analysis for a Small Wind System at the Longley Building Site................................................................. 66
Figure 20 - Geothermal Heat Pump System .................................................................................................................................... 67
Figure 21 - Aerial View of Thompson Building Site ...................................................................................................................... 69
Figure 22 – Aerial View of Building #4 Annex Site ....................................................................................................................... 74
Figure 23 - Fuel Cell System........................................................................................................................................................... 79
Figure 24 – Aerial View of Homer Babbidge Library Site ............................................................................................................. 82
Figure 25 – Aerial View of ITE Building Site ................................................................................................................................ 88
Figure 26 – Aerial View of Building #4 Annex Site ....................................................................................................................... 93
Figure 27 - Aerial View of Longley Building Site ........................................................................................................................ 100
Figure 28 - Aerial View of the Compost facility and the Center for Clean Energy Engineering ................................................. 105
5
Index of Tables
Table 1- Summary of Renewable Energy Technologies, Costs, and Capacity ................................................................................. 9
Table 2 – Summary of Potential Renewable Energy Applications at the University of Connecticut at Storrs ............................... 10
Table 3 – Summary of Solar Thermal Analysis .............................................................................................................................. 13
Table 4 – Summary of Solar PV Analyses ...................................................................................................................................... 34
Table 5 – Summary of Small Wind Analyses ................................................................................................................................. 48
Table 6 – Summary of Geothermal System Analyses ..................................................................................................................... 68
Table 7 – Average System Size and Cost for Geothermal Projects in Connecticut (October 2009 – November 2011) ................. 72
Table 8 – Average System Size and Cost for Geothermal Projects in Connecticut (October 2009 – November 2011) ................. 77
Table 9 – Summary of Fuel Cell System Analyses ......................................................................................................................... 80
Table 10 - Expected System Electric and Thermal Productivity for Fuel Cells with Heat Recovery ............................................. 81
Table 11 - Emission Values for Fuels Cells (300 kW – 400 kW) Operating on Methane .............................................................. 82
Table 12 - Water Consumption and Discharge Rates for Phosphoric Acid and Molten Carbonate Fuel Cells .............................. 84
Table 13 - Dimensions of Fuel Cell Stack and Balance of Plant for Phosphoric Acid and Molten Carbonate Fuel Cells ............. 85
Table 14 - Expected System Electric and Thermal Productivity for Fuel Cells without Heat Recovery ........................................ 87
Table 15 - Emission Values for Fuels Cells (100 kW – 200 kW, No Heat Recovery) ................................................................... 88
Table 16 - Dimensions of Fuel Cell Stack and Balance of Plant for Solid Oxide Fuel Cells ......................................................... 90
Table 17- Expected System Electric and Thermal Productivity for Fuel Cells That Can Meet Smaller Base and Peaking Loads: 92
Table 18 - Emission Values for a 5 kW Fuel Cell Operating on Methane ...................................................................................... 94
Table 19 - Water Consumption and Discharge Rates for a 5 kW Proton Exchange Membrane Fuel Cell ..................................... 95
Table 20 - Dimensions of Fuel Cell Stack and Balance of Plant for a 5 kW Proton Exchange Membrane Fuel Cell ................... 96
Table 21 – Estimated Annual Emissions Impacts of Using 50,000 Gallons of B100 Biodiesel ................................................... 101
Table 22 – Estimated Annual Emissions Impacts of Using 75,000 Gallons of B100 Biodiesel ................................................... 101

6
Index of Appendices
Appendix I - The 2009 Calculated New England Marginal Emission Rates (lb/MWh) Values ................................................... 109

7
Introduction
This Preliminary Feasibility Study and Strategic Deployment Plan (Plan) for Renewable & Sustainable Energy Projects
identifies and assesses target locations for the development of 12 demonstration-scale renewable and sustainable energy projects
for the following technologies: solar thermal, solar photovoltaic, wind, fuel cells, geothermal, and biofuels. The development of
renewable and sustainable energy projects at the University of Connecticut (UConn) at Storrs will facilitate 1) technology
transfer and 2) collaborative research into green energy sources and smart storage; 3) reduce carbon dioxide (CO2) and other
greenhouse gases (GHG);, and 4) integrate environmental principles into the student’s learning experience. These clean and
renewable energy technologies will reduce GHG emissions by displacing emissions associated with the use of fossil fuels for
electric generation, thermal energy, and/or transportation. The deployment of renewable and sustainable energy technologies
identified in this Plan is consistent with the implementation of “The University of Connecticut Climate Action Plan”.
Furthermore, this Plan compliments and expands upon the potential development opportunities for renewable and sustainable
energy technologies identified within the Preliminary Feasibility Study and Strategic Plan for the Depot Campus.

8
Executive Summary
This Plan was developed to address UConn’s energy and environmental policy to:
Reduce greenhouse gas (GHG) emissions;
Support education and research interests
Address economic viability, including first cost and return on investment; and
Enhance community involvement.
This Plan specifically addresses the deployment of six renewable and sustainable energy technologies (solar thermal, solar
photovoltaics (PV), wind energy, geothermal, fuel cell, and biomass) at 12 locations on the main and Depot Campuses, for the
following buildings:
Center for Clean Energy Engineering (Depot)
Dairy Bar
Homer Babbidge Library
Horsebarn Hill Sciences Complex Building #4
Annex
Hollister Hall (Depot)
Information Technology Engineering Building
Longley Building (Depot)
North Campus (Field)
Putnam Refectory
Shippee Hall
Thompson Hall
The results of the analyses of the renewable and sustainable energy technologies at these locations provide opportunities to
reduce GHG emissions and air pollutants through a reduction in fossil fuel use. The results also suggest opportunities to support
education and research activities, and integrate environmental principles into the students’ learning experience. The deployment
sites that may provide the best opportunity for education and awareness based on access, use, and visibility include the following
deployment clusters: 1) Center for Environmental Sciences and Engineering (Building #4 Annex), 2) the Center for Clean
Energy Engineering (C2E2) and Longley Building, and 3) the Homer Babbidge Library and the Information Technology
Engineering Building. In addition, the UConn Dairy Bar may be an excellent location to highlight a demonstration scale
renewable energy technology because it attracts large numbers of students, faculty, and visitors year-round.
Based on the analyses, between approximately 5 tons and 9.5 tons of GHG emissions could be reduced using solar PV, wind, or
passive solar thermal systems annually. Other high efficiency technologies, such as fuel cells and geothermal systems, can
reduce fossil fuel use and GHG emissions associated with the production of electricity and/or thermal energy. Renewable energy
in the form of biodiesel can be used in boilers and vehicles at UConn to reduce GHG emissions. In 2010, UConn consumed
approximately 250,000 gallons of fuel oil for its oil fired boilers and transportation fleet. Currently, approximately 2-5 percent of
the annual fuel requirement for UConn’s bus system is supplemented with biodiesel. If 20 percent of UConn’s annual diesel/fuel
oil consumption (50,000 gallons) were displaced with locally produced biodiesel, UConn could reduce GHG emissions by
approximately 400 tons, annually.
Demonstration-scale renewable energy technologies identified in this Plan are typically more expensive than conventional
technologies. The larger the renewable energy system, the greater the first cost will be; however, larger systems may be more
economical on a $/kW basis than smaller systems of the same technology.

9
Table 1- Summary of Renewable Energy Technologies, Costs, and Capacity
Technology First Cost
Demonstration Scale
Capacity
System Cost
Solar Thermal $150 per Square Foot of
Collector Area
32 – 700 Square Feet $5,000 - $105,000
Solar PV $5,430/kW to 10 kW $54,000
Wind $6,800/kW 10 kW $68,000
Fuel Cells $5,500/kW to
$8,000/kW
100 - 400 kW $750,000 - $2,700,000
$10,000/kW 5 kW $50,000
Geothermal $9,000 – 10,000 per ton 3.1 – 40 tons $28,000 - $400,000
The consequence of these economics implies that most demonstration-scale renewable energy systems will not achieve a
financial payback within the life of the system without incentives. This is especially the case at UConn’s main campus where a
very efficient cogeneration facility can provide economical electricity and thermal energy to the buildings on campus that are
connected to a steam loop. Furthermore, the availability of renewable energy resources, such as wind, may limit to some extent
the amount of renewable energy that can be produced with existing renewable energy technologies.
Federal business investment tax credits and accelerated depreciation benefits assist in making demonstration-scale renewable
energy systems economically viable within the life of certain renewable energy systems. Federal investment tax credits are
currently available at 30 percent of the project cost and accelerated depreciation benefits may be monetized by a tax paying
entity for eligible technologies consistent with current law. In addition to these federal incentives, additional incentives, such as
an up front capital grant or a production payment may be necessary to achieve a financial payback within the life of certain
renewable energy systems. With federal and state incentives, large fuel cell systems (>100 kW) may provide attractive
opportunities to achieve a financial payback within the life of the system. In addition, a biodiesel production facility may be a
financially attractive opportunity if it can be operated profitably, safely, and without impacting the character of the Depot
Campus.
All demonstration scale renewable energy technologies evaluated provide opportunities for education, and academic and
research involvement. As discussed above, the availability of renewable energy resources limits to some extent the amount of
renewable energy that can be produced with existing renewable energy technologies and resources. However, with continued
research, renewable energy systems such as solar PV or wind may achieve greater efficiency that would provide greater
electrical or thermal output. In addition to increasing efficiency, the development of new less expensive materials or new
production methods may reduce system costs to a point where demonstration-scale renewable energy systems are cost effective
without federal or state incentives.

10
The deployment of renewable energy systems, as detailed in this Plan, could also support research efforts for power system
planning, and integration of these technologies into a smart grid. Further, the deployment of a variety of renewable energy
systems, such as solar PV, wind, and fuel cells, in close proximity to end users could also support research efforts to refine
power conditioning.
Table 2 below provides a summary of the potential renewable energy technologies evaluated, and estimates of the potential
annual renewable energy production and potential annual reductions of GHG emissions for the deployment sites assessed.
Table 2 – Summary of Potential Renewable Energy Applications at the University of Connecticut at Storrs
Technology Example Locations
Potential Renewable
Energy Generation
Capacity
Potential Annual
Renewable
Energy
Production
Potential Annual
Reductions of
CO2 Emissions
(Lbs)
Solar Thermal
Dairy Bar 36 SQFT 6.8 MMBtu 995
Shippee Hall 700 SQFT 130 MMBtu 18,837
Hollister Hall 145 SQFT 27 MMBtu 3,896
Putnam Refectory 530 SQFT 100 MMBtu 14,485
Horsebarn Hill Sciences
Complex Building #4
Annex
32 SQFT
6 MMBtu 889
Solar PV
Center for Clean Energy
Engineering 10 kW 11,520 kWh 10,575
Homer Babbidge Library 10 kW 11,520 kWh 10,575
Horsebarn Hill Sciences
Complex Building #4
Annex
10 kW 11,520 kWh 10,575
Information Technology
Engineering Building
10 kW
11,520 kWh
10,575
Wind
Homer Babbidge Library 10 kW 5,305 kWh 4,933
North Campus 10 kW 5,305 kWh 4,933
Longley Building
(Depot Campus)
10 kW
5,305 kWh
4,933

11
Table 2 – Summary of Potential Renewable Energy Applications at the University of Connecticut at Storrs – Cont.
Technology Example Locations
Potential
Renewable Energy
Generation
Capacity
Potential Annual
Renewable
Energy
Production
Potential Annual
Reductions of CO2
Emissions
(Lbs)
Fuel Cell
Homer Babbidge Library 300- 400 kW 2.27 million –
3.25 million kWh
534,000 –
860,000
Horsebarn Hill Sciences
Complex Building #4
Annex
5 kW 39,000 kWh 14,300
Information Technology
Engineering Building 100 – 200 kW
0.85 million –
1.7 million kWh 72,000 – 144,000
Geothermal
Thompson Hall
(Depot Campus) 40 Tons 1,017 MMBtu 60,875
Horsebarn Hill Sciences
Complex Building #4
Annex
3.1 Tons 106 MMBtu 5,200
BioGas Center for Clean Energy
Engineering 7 kW TBD TBD
Biodiesel
B100
Longley Building
(Depot Campus)
150,000
(Gallons per Year)
75,000
(Gallons per Year)
800,000 –
1.2 million

12
SOLAR THERMAL
Figure 1 - Solar Thermal System2
Solar thermal technology uses sunlight
to capture thermal energy primarily for
use in domestic hot water applications.
Solar thermal systems typically consist
of one or more solar thermal collectors,
which heats water, and a storage tank.
There are two types of solar thermal
systems: active, which have circulating
pumps and controls, and passive, which
do not. Passive solar water heating
systems are typically less expensive
than active systems, but are less
efficient. However, passive systems can
be more reliable and may last longer.
Solar thermal systems produce savings
by reducing the amount of fossil fuel
that would be consumed to produce
thermal energy (Btus) for water heating.
General siting criteria to consider when evaluating potential buildings/areas for the installation of a solar
thermal system includes:
Sites with sun exposure for 6-8 hours per day;
Building/structure capable of supporting renewable energy equipment without significant
reinforcing;
Building/structure has flat roof or sufficient pitch and orientation to maximize solar
potential;
Building/structure area sufficiently large to support renewable energy equipment;
Building/structure roof materials allow installation of renewable energy equipment and
will not need to be replaced within the life of the renewable energy equipment; and
Sites that utilize oil-fired boilers/furnaces to provide domestic hot water.
Solar thermal systems are best sized to function with existing thermal generation/storage infrastructure at
a facility. While not necessarily financially attractive relative to other investment opportunities, solar
thermal systems can achieve a payback within their useful life, but this is dependent upon the amount of
thermal energy that is being displaced and the cost of fuel used to generate that thermal energy by
conventional systems. Furthermore, solar thermal systems provide emissions reductions throughout the
life of the system. Such reductions are also dependent upon the amount of thermal energy that is being
displaced and the type of fuel used to generate that thermal energy by conventional systems.
2U.S. DOE, NREL, Sandia National Laboratories, “Solar Thermal Systems: Solar Heating R&D,”
http://www.nrel.gov/docs/gen/fy04/36831m.pdf, 2004
13
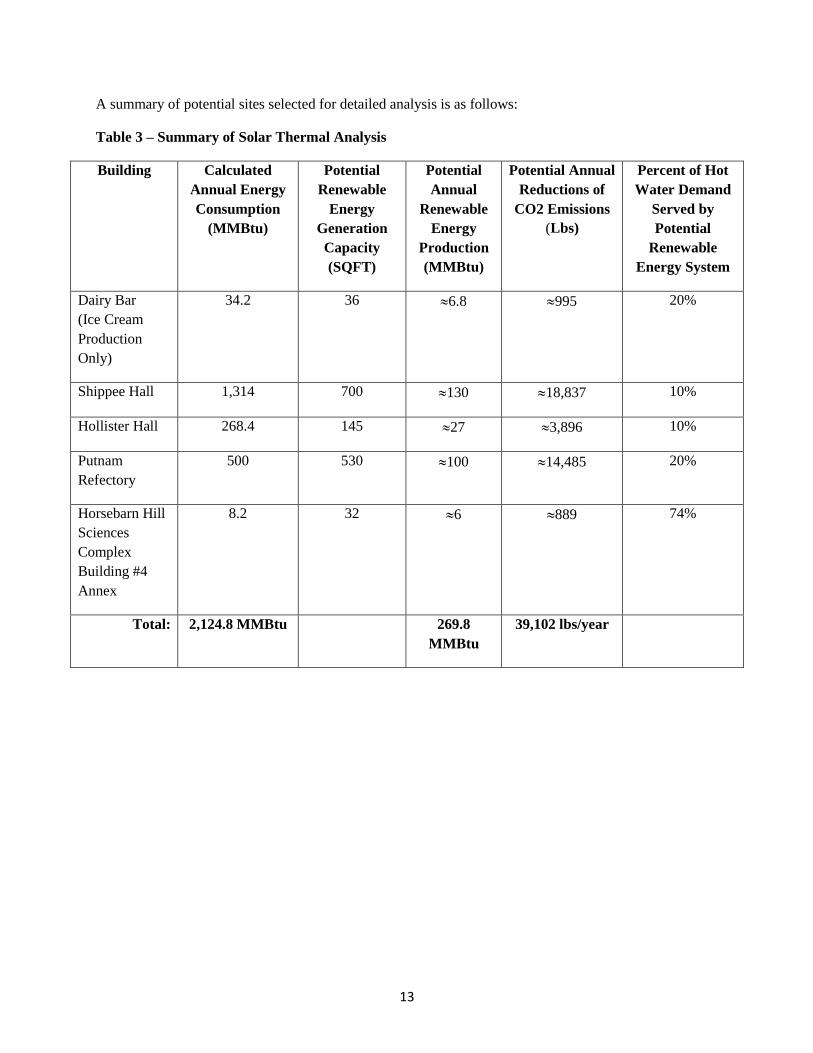
A summary of potential sites selected for detailed analysis is as follows:
Table 3 – Summary of Solar Thermal Analysis
Building Calculated
Annual Energy
Consumption
(MMBtu)
Potential
Renewable
Energy
Generation
Capacity
(SQFT)
Potential
Annual
Renewable
Energy
Production
(MMBtu)
Potential Annual
Reductions of
CO2 Emissions
(Lbs)
Percent of Hot
Water Demand
Served by
Potential
Renewable
Energy System
Dairy Bar
(Ice Cream
Production
Only)
34.2 36 6.8 995 20%
Shippee Hall 1,314 700 130 18,837 10%
Hollister Hall 268.4 145 27 3,896 10%
Putnam
Refectory
500 530 100 14,485 20%
Horsebarn Hill
Sciences
Complex
Building #4
Annex
8.2 32 6 889 74%
Total: 2,124.8 MMBtu 269.8
MMBtu
39,102 lbs/year

14
UConn Dairy Bar
UConn Dairy Bar Site
The UConn Dairy Bar, located at 3636 Horsebarn Hill Road Extension on the UConn main campus, is a
food sales establishment that offers ice cream produced on-site.
Solar Thermal System Visibility
In general, because solar thermal systems are deployed as roof mounted systems, their visibility by the
public may be limited. However, the Dairy Bar is a two story building, which may make the solar
collectors visible from adjacent buildings. Furthermore, if this site is selected for development, a
monitoring display could be installed in the Dairy Bar lobby with details on the solar thermal system’s
rooftop location and performance data.
Figure 2 - Aerial View of UConn Dairy Bar Site
Domestic Hot Water Demand and Solar Thermal System Sizing
Based on information provided by operating / production personnel, the Dairy Bar has a total annual clean-in-
place (CIP) hot water consumption (for the ice cream manufacturing) of approximately 68,400 gallons using
approximately 34.2 MMBtu of thermal energy for the calculated domestic hot water demand per year. As a
demonstration project, the solar thermal system has been sized to provide approximately 20 percent or 6.8
MMBtu of the thermal energy for the calculated CIP hot water use. Based on a solar thermal system efficiency
of 40 percent and the anticipated solar insolation for the Storrs area, the proposed solar thermal system’s
collector area would be approximately 36 square feet. An approximately 36 square foot solar thermal system
could fit on the existing roof structure; however, a structural analysis of Dairy Bar has not been completed for
this potential application.
N

15
Environmental Benefits of a Solar Thermal System
Solar thermal systems create environmental benefits by displacing fossil fuels used to produce thermal
energy. The UConn Dairy Bar site currently uses thermal energy produced from natural gas by the
cogeneration system on campus. The proposed solar thermal system would produce 6.8 MMBtus of
thermal energy per year. Because of efficiency losses from the cogeneration plant and the building
heating distribution system, it is estimated that there may be a reduction of approximately 8.5 MMBtus of
natural gas consumed for domestic hot water resulting in the following emissions reductions annually:3
0.782 lbs / year of NOx;
0.0051 lbs / year of SO2; and
995 lbs/year of CO2.
Regulatory Restrictions (Siting)
There are no state regulatory restrictions on the installation and/or use of solar thermal systems. Solar
thermal systems are not within the jurisdiction of the Connecticut Siting Council. The Town of Mansfield
does not exercise jurisdiction over building improvements installed on UConn’s Storrs campuses.4
Environmental Impacts and Permitting
The operation of an approximately 36 square foot solar thermal system would not generate any noise, air
emissions, or wastewater effluents; consequently, no air emission or wastewater discharge permits are
required. In addition, no adverse impacts on scenic resources, historic buildings, or endangered species or
species of special concern are anticipated.
Site Restrictions Due to Land Use / Master Planning Considerations
The 2006 Storrs Campus Master Plan Update5 does not contain any information which would indicate a
conflict with deploying a solar thermal system at this site. The 2004 Sustainable Design Guidelines of the
Master Plan specifies examining the application and economic feasibility of PV systems at new facilities
on campus.6 Although mechanically there are significant differences between a solar thermal system that
heats water and a PV system that produces electricity, they are very similar in appearance. A solar
thermal system could be roof mounted; consequently, no land use impacts are anticipated.
3 EIA, “Natural Gas 1998: Issues and Trends – Chapter 2: Natural Gas and the Environment,”
ftp://tonto.eia.doe.gov/pub/oil_gas/natural_gas/analysis_publications/natural_gas_1998_issues_trends/pdf/chapter2.
pdf , 1998 4 Personal communication with the Mansfield Department of Building and Housing Inspection and Mansfield Fire
Department 5 University of Connecticut, “Campus Sustainable Design Guidelines,” http://masterplan.uconn.edu/images/6-
0331storrs-small.pdf , January 2006 6 University of Connecticut, “Storrs Campus Master Plan Update,” http://masterplan.uconn.edu/images/SDG-
web.pdf, November 2004
16
Capital Cost
Typical costs for solar thermal systems approximate $150 per square foot of solar thermal collector area.
Consequently, a 36 square foot solar thermal system that could provide approximately 20 percent of the
calculated CIP hot water consumption would have a capital cost of approximately $5,430.7
Operation and Maintenance Cost
Operation and maintenance costs for solar thermal systems are likely to be small. Maintenance of solar
thermal systems is likely to involve periodic inspection of the collectors to ensure that vegetation isn’t
shading the collector area and that the collectors are clean; inspection of piping for potential fluid leaks;
inspection of flashing and sealing around roof penetrations; inspection of nuts and bolts attaching the
collectors to support structures; and inspection of the pressure relief valve for proper operation.8
Economics and Funding
At present, solar thermal systems require public funding to subsidize system costs sufficiently to justify
investment on a financial basis. Capital grants, federal business investment tax credits, and accelerated
depreciation benefits are required to achieve a financial payback within the life of the system. However,
because of the relatively small size and cost of a demonstration solar thermal project at the Dairy Bar, it is
questionable if a third party private entity, which could monetize the tax credits and depreciation, will
invest/develop such a project. A third party private entity may develop the potential Dairy Bar site if it
were included in a coordinated and comprehensive build out with other solar thermal systems on the
campuses at Storrs.
Analysis of Grant Funding for Financial Feasibility
A solar thermal system installed at the UConn Dairy Bar would not achieve a financial payback within
the projected life of the system without a capital grant. The primary drivers are the initial cost of the
system and relatively low energy costs at the site. However, a solar thermal system could achieve a
financial payback within the life of the system and an internal rate of return of 9.33 percent with a capital
grant of $5,054.
Site Orientation and Generation Loads
An approximately 36 SQFT solar thermal system could be located on the roof of the UConn Dairy Bar,
and could be oriented towards the south for optimal yield. Given the height of the roof area above ground
level, the proximity and height of nearby vegetation, it is suggested that the solar thermal panels be
located as on the northeast side of the building as close as possible to the water storage tank and oriented
towards the south. Analysis of the site indicates that the site could support more than 36 square feet of
solar thermal capacity; however, a structural analysis of Dairy Bar has not been completed for this
potential application.
7 Solar thermal system may not include water storage tank and installation costs.
8 U.S. DOE EERE, “Solar Heating Systems Maintenance and Repair,”
http://www.energysavers.gov/your_home/water_heating/index.cfm/mytopic=12950 , February 2011

17
Shippee Hall
Shippee Hall Site
The Lester E. Shippee Residence Hall (Shippee Hall), located at 1288 Storrs Road on the main campus at
Storrs, is home to several Learning Communities, including the Fine Arts Learning Community and
Connecting With the Arts Learning Community, as well as overflow housing for the Honors Community
in Buckley Hall.9 Shippee Hall currently houses approximately 300 residents. In addition, Shippee Hall
has facilities for food preparation for catered functions.
Solar Thermal System Visibility
In general, because solar thermal systems are deployed as roof mounted systems, their visibility by the
public may be limited. However, if this site is selected, a monitoring display could be installed in the
lobby with details on the solar thermal system’s rooftop location and performance data.
Figure 3 - Aerial View of Shippee Hall Site
Domestic Hot Water Demand and Solar Thermal System Sizing
As discussed above, Shippee Hall is used as both a residence hall and for the preparation of meals for catered
functions. In order to calculate the domestic hot water demand for the residence hall, it is assumed that
approximately 300 students will occupy the residence hall during the school year (late August through mid-
May; 266 days), and that approximately 166 students (55 percent) will occupy this residence hall during the
9 University of Connecticut Residential Life, “Student Housing – Shippee,” http://reslife.uconn.edu/shippee.html,
March, 2012
N
18
summer session (Mid-May through late August; 99 days). In order to calculate the domestic hot water demand
for the meal preparation, it is assumed that on average approximately 1,080 meals are prepared each day for
catered functions during the school year, and approximately 540 meals are prepared each day for catered
functions during the summer session for a total of approximately 340,000 meals per year.10
It is estimated that
the total domestic hot water demand for both the residents and meal preparation throughout the year is
approximately two million gallons using 1,314 MMBtu of thermal energy for the calculated domestic hot water
demand per year. The solar thermal system has been sized to provide approximately 10 percent or
approximately 130 MMBtu of the thermal energy for the calculated annual domestic hot water demand. Based
on a solar thermal system efficiency of 40 percent and the anticipated solar insolation for the Storrs area, the
proposed solar thermal system’s collector area would be approximately 700 square feet. An approximately 700
square foot solar thermal system could fit on the existing roof structure; however, a structural analysis of
Shippee Hall has not been completed for this potential application.
Environmental Benefits of a Solar Thermal System
Solar thermal systems create environmental benefits by displacing fossil fuels used to produce thermal
energy. Shippee Hall currently uses thermal energy produced from natural gas by the cogeneration system
on campus. The proposed solar thermal system would produce approximately 130 MMBtu of thermal
energy per year. Because of efficiency losses from the cogeneration plant and the building heating
distribution system, it is estimated that there may be a reduction of approximately 161 MMBtu of natural
gas consumed for domestic hot water usage resulting in the following emissions reductions annually:11
14.81 lbs / year of NOx emissions;
0.097 lbs / year of SO2 emissions; and
18,837 lbs/year of CO2.
Regulatory Restrictions (Siting)
There are no state regulatory restrictions on the installation and/or use of solar thermal systems. Solar
thermal systems are not within the jurisdiction of the Connecticut Siting Council. The Town of Mansfield
does not exercise jurisdiction over building improvements installed on UConn’s Storrs campuses.12
Environmental Impacts and Permitting
The operation of an approximately 700 square foot solar thermal system would not generate any noise, air
emissions, or wastewater effluents; consequently, no air emission or wastewater discharge permits are
required. In addition, no adverse impacts on scenic resources, historic buildings, or endangered species or
species of special concern are anticipated.
10
Information regarding occupancy and meal preparation provided by UConn on April 8, 2011. 11
EIA, “Natural Gas 1998: Issues and Trends – Chapter 2: Natural Gas and the Environment,”
ftp://tonto.eia.doe.gov/pub/oil_gas/natural_gas/analysis_publications/natural_gas_1998_issues_trends/pdf/chapter2.
pdf , 1998 12
Personal communication with the Mansfield Department of Building and Housing Inspection and Mansfield Fire
Department
19
Site Restrictions Due to Land Use / Master Planning Considerations
The 2006 Storrs Campus Master Plan Update13
does not contain any information which would indicate a
conflict with deploying a solar thermal system at this site. The 2004 Sustainable Design Guidelines of the
Master Plan specifies examining the application and economic feasibility of PV systems at new facilities
on campus.14
Although mechanically there are significant differences between a solar thermal system that
heats water and a PV system that produces electricity, they are very similar in appearance. A solar
thermal system could be roof mounted; consequently, no land use impacts are anticipated.
Capital Cost
Typical costs for solar thermal systems approximate $150 per square foot of solar thermal collector area.
Consequently, a 700 square foot solar thermal system that could provide approximately 10 percent of the
calculated domestic hot water consumption for Shippee Hall would have a capital cost of approximately
$105,000.15
Operation and Maintenance Cost
Operation and maintenance costs for solar thermal systems are likely to be small. Maintenance of solar
thermal systems is likely to involve periodic inspection of the collectors to ensure that vegetation isn’t
shading the collector area and that the collectors are clean; inspection of piping for potential fluid leaks;
inspection of flashing and sealing around roof penetrations; inspection of nuts and bolts attaching the
collectors to support structures; and inspection of the pressure relief valve for proper operation.16
Economics and Funding
At present, solar thermal systems require public funding to subsidize system costs sufficiently to justify
investment on a financial basis. Capital grants, federal business investment tax credits, and accelerated
depreciation benefits are required to achieve a financial payback within the life of the system. For the
analyses detailed below, deployment is assumed to take place in 2012, thereby forfeiting the 2011, 100
percent accelerated depreciation monetization benefit. Instead, a 50 percent first year bonus depreciation
monetization structure is assumed as provided under current law.17
Federal investment tax credits are currently available at 30 percent of the project cost and accelerated
depreciation benefits can be monetized by the developer. Hence, the project economics of a solar thermal
system would clearly be attractive if it were developed by a third party developer capable of garnering all
of the available tax credits and accelerated depreciation benefits associated with renewable energy
projects.
13
University of Connecticut, “Campus Sustainable Design Guidelines,” http://masterplan.uconn.edu/images/6-
0331storrs-small.pdf , January 2006 14
University of Connecticut, “Storrs Campus Master Plan Update,” http://masterplan.uconn.edu/images/SDG-
web.pdf, November 2004 15
Solar thermal system may not include water storage tank and installation costs. 16
U.S. DOE EERE, “Solar Heating Systems Maintenance and Repair,”
http://www.energysavers.gov/your_home/water_heating/index.cfm/mytopic=12950, February 2011 17
Dsireusa.org, “Modified Accelerated Cost-Recovery System (MACRS) + Bonus Depreciation (2008 – 2012),”
http://dsireusa.org/incentives/incentive.cfm?Incentive_Code=US06F&re=1&ee=1, October 14, 2011

20
Analysis of Grant Funding for Financial Feasibility
A solar thermal system installed at Shippee Hall would not achieve a financial payback within the
projected life of the system without a capital grant, investment tax credits, and depreciation. The primary
drivers are the initial cost of the system and relatively low energy costs at the site. However, a solar
thermal system could achieve a financial payback within the life of the system, an internal rate of return
of 9.3 percent, and a net present value of $2,770 with a capital grant of $61,250.18
Site Orientation and Generation Loads
An approximately 700 square foot solar thermal system could be located on the roof of Shippee Hall, and
could be oriented towards the south for optimal yield. Given the height of the roof area above ground
level, the proximity and height of nearby buildings, and the lack of vegetation near Shippee Hall, no
shading impacts are anticipated. Analysis of the site by UConn indicates that Shippee Hall has
approximately 2,950 square feet of south facing roof area that could support approximately 700 square
feet of solar thermal collectors; however, a structural analysis of Shippee Hall has not been completed for
this potential application.
18
Assumes an installed cost of $150/sqft or a total installed cost of $105,000, a discount rate of seven percent, and
receipt of all applicable tax credits and accelerated depreciation benefits.

21
Hollister Hall
Hollister Hall Site
Hollister Hall, located at 2016 Hillside Road on the main campus at Storrs, is part of the West Campus
Residence Halls and was the first environmental learning community, "EcoHouse", which opened on the
main campus in the Fall of 2009. Approximately 50 undergraduate students practice a more sustainable
lifestyle together in Hollister Hall.19
Solar Thermal System Visibility
In general, because solar thermal systems are deployed as roof mounted systems, their visibility by the
public may be limited. However, Hollister Hall is a four story building, which may make the solar
collectors visible from adjacent buildings. Furthermore, if this site is selected, a monitoring display could
be installed in the lobby with details on the solar thermal system’s rooftop location and performance data.
Figure 4 - Aerial View of West Campus Residence Halls (Hollister Hall Site)
Domestic Hot Water Demand and Solar Thermal System Sizing
As discussed above, Hollister Hall is used as a residence hall. In order to calculate the domestic hot water
demand for this residence hall, it is assumed that approximately 128 students will occupy this residence hall
during the school year (late August through mid-May; 266 days), and that approximately 70 students (55
19
Uconnhuskies.com, “Green Awareness Day,” http://www.uconnhuskies.com/ot/green-week.html, March 2012
N
Hollister Hall
22
percent) will occupy this residence hall during the summer session (Mid-May through late August; 99 days). It
is estimated that the total domestic hot water demand for the residents at Hollister Hall throughout the year is
approximately 537,000 gallons using 268.4 MMBtu of thermal energy for the calculated domestic hot water
demand per year. As a demonstration project, the solar thermal system has been sized to provide approximately
10 percent or 26.9 MMBtu of the thermal energy for the calculated annual domestic hot water demand. Based
on a solar thermal system efficiency of 40 percent, and the anticipated solar insolation for the Storrs area, the
proposed solar thermal system collector area would be approximately 145 square feet. An approximately 145
square foot solar thermal system could fit on the existing roof structure; however, a structural analysis of
Hollister Hall has not been completed for this potential application.
Environmental Benefits of a Solar Thermal System
Solar thermal systems create environmental benefits by displacing fossil fuels used to produce thermal
energy. Hollister Hall currently uses thermal energy produced from natural gas by the cogeneration
system on campus. The proposed solar thermal system would produce 26.9 MMBtu of thermal energy per
year. Because of efficiency losses from the cogeneration plant and the building heating distribution
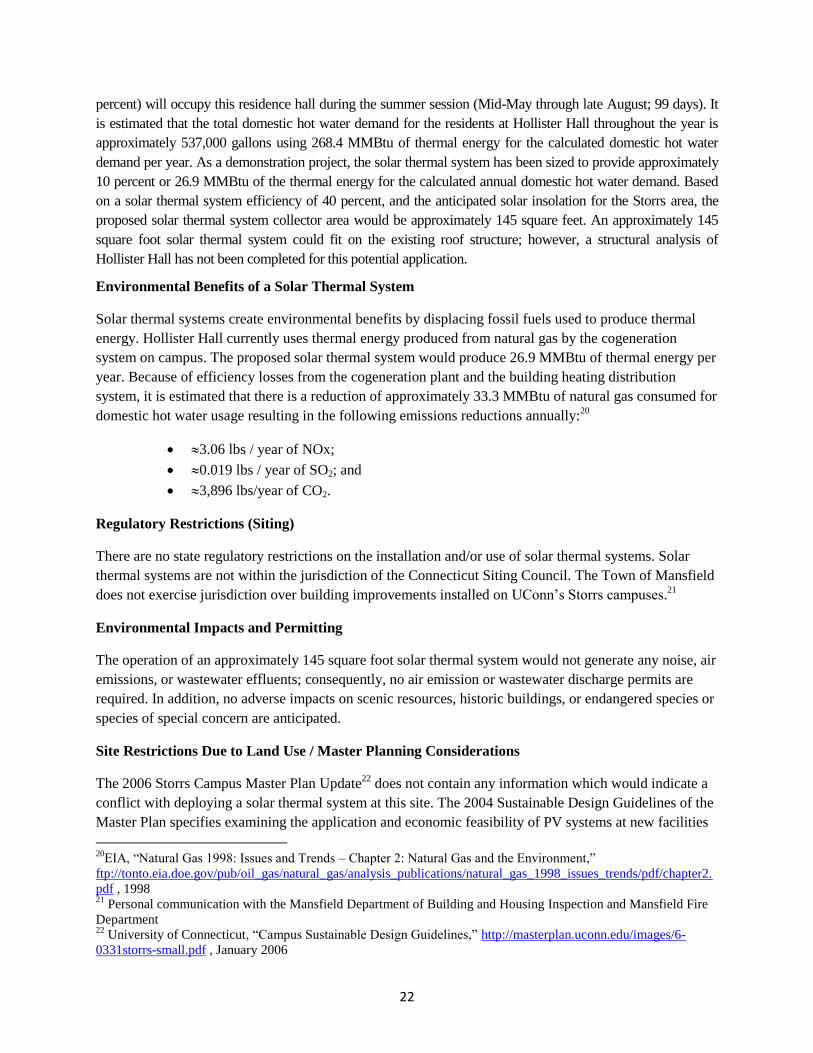
system, it is estimated that there is a reduction of approximately 33.3 MMBtu of natural gas consumed for
domestic hot water usage resulting in the following emissions reductions annually:20
3.06 lbs / year of NOx;
0.019 lbs / year of SO2; and
3,896 lbs/year of CO2.
Regulatory Restrictions (Siting)
There are no state regulatory restrictions on the installation and/or use of solar thermal systems. Solar
thermal systems are not within the jurisdiction of the Connecticut Siting Council. The Town of Mansfield
does not exercise jurisdiction over building improvements installed on UConn’s Storrs campuses.21
Environmental Impacts and Permitting
The operation of an approximately 145 square foot solar thermal system would not generate any noise, air
emissions, or wastewater effluents; consequently, no air emission or wastewater discharge permits are
required. In addition, no adverse impacts on scenic resources, historic buildings, or endangered species or
species of special concern are anticipated.
Site Restrictions Due to Land Use / Master Planning Considerations
The 2006 Storrs Campus Master Plan Update22
does not contain any information which would indicate a
conflict with deploying a solar thermal system at this site. The 2004 Sustainable Design Guidelines of the
Master Plan specifies examining the application and economic feasibility of PV systems at new facilities
20
EIA, “Natural Gas 1998: Issues and Trends – Chapter 2: Natural Gas and the Environment,”
ftp://tonto.eia.doe.gov/pub/oil_gas/natural_gas/analysis_publications/natural_gas_1998_issues_trends/pdf/chapter2.
pdf , 1998 21
Personal communication with the Mansfield Department of Building and Housing Inspection and Mansfield Fire
Department 22
University of Connecticut, “Campus Sustainable Design Guidelines,” http://masterplan.uconn.edu/images/6-
0331storrs-small.pdf , January 2006

23
on campus.23
Although mechanically there are significant differences between a solar thermal system that
heats water and a PV system that produces electricity, they are very similar in appearance. A solar
thermal system could be roof mounted; consequently, no land use impacts are anticipated.
Capital Cost
Typical costs for solar thermal systems approximate $150 per square foot of solar thermal collector area.
Consequently, a 145 square foot solar thermal system that could provide approximately 10 percent of the
calculated domestic hot water consumption for Hollister Hall would have a capital cost of approximately
$21,750.24
Operation and Maintenance Cost
Operation and maintenance costs for solar thermal systems are likely to be small. Maintenance of solar
thermal systems is likely to involve periodic inspection of the collectors to ensure that vegetation isn’t
shading the collector area and that the collectors are clean; inspection of piping for potential fluid leaks;
inspection of flashing and sealing around roof penetrations; inspection of nuts and bolts attaching the
collectors to support structures; and inspection of the pressure relief valve for proper operation.25
Economics and Funding
At present, solar thermal systems require public funding to subsidize system costs sufficiently to justify
investment on a financial basis. Capital grants, federal business investment tax credits, and accelerated
depreciation benefits are required to achieve a financial payback within the life of the system. For the
analyses detailed below, deployment is assumed to take place in 2012, thereby forfeiting the 2011, 100
percent accelerated depreciation monetization benefit. Instead, a 50 percent first year bonus depreciation
monetization structure is assumed as provided under current law.26
Federal investment tax credits are currently available at 30 percent of the project cost and accelerated
depreciation benefits can be monetized by the developer. Hence, the project economics of a solar thermal
system would clearly be attractive if it were developed by a third party developer capable of garnering all
of the available tax credits and accelerated depreciation benefits associated with renewable energy
projects.
Analysis of Grant Funding for Financial Feasibility
A solar thermal system installed at Hollister Hall would not achieve a financial payback within the
projected life of the system without a capital grant, investment tax credits, and depreciation. The primary
drivers are the initial cost of the system and relatively low energy costs at the site. However, a solar
23
University of Connecticut, “Storrs Campus Master Plan Update,” http://masterplan.uconn.edu/images/SDG-
web.pdf, November 2004 24
Solar thermal system may not include water storage tank and installation costs. 25
U.S. DOE EERE, “Solar Heating Systems Maintenance and Repair,”
http://www.energysavers.gov/your_home/water_heating/index.cfm/mytopic=12950, February 2011 26
Dsireusa.org, “Modified Accelerated Cost-Recovery System (MACRS) + Bonus Depreciation (2008 – 2012),”
http://dsireusa.org/incentives/incentive.cfm?Incentive_Code=US06F&re=1&ee=1, October 14, 2011

24
thermal system could achieve a financial payback within the life of the system, an internal rate of return
of 7.9 percent, and a net present value of $233 with a capital grant of $12,500.27
Site Orientation and Generation Loads
An approximately 145 square foot solar thermal system could be located on the roof of Hollister Hall, and
could be oriented towards the south for optimal yield. Given the height of the roof area above ground
level, the proximity and height of nearby buildings, and the presence of vegetation near Hollister Hall,
there may be some shading impacts. However, an analysis of the site indicates that Hollister Hall has
approximately 5,500 square feet of roof area which could make locating the solar collectors in an area that
is not impacted by shading feasible. A structural analysis of Hollister Hall has not been completed for this
potential application.
27
Assumes an installed cost of $150/sqft or a total installed cost of $21,750, a discount rate of seven percent, and
receipt of all applicable tax credits and accelerated depreciation benefits.
25
Putnam Refectory
Putnam Refectory Site
The Putnam Refectory (Putnam Hall), located on Alumni Drive on the main campus at Storrs, is a dining
hall and home to the Hill Stop Grab & Go, which features made-to-order grinders and wraps. Putnam Hall
is located adjacent to and serves meals for the residents of the Hilltop Residence Halls, which consist of
two high-rise towers, Ellsworth and Hale Halls.
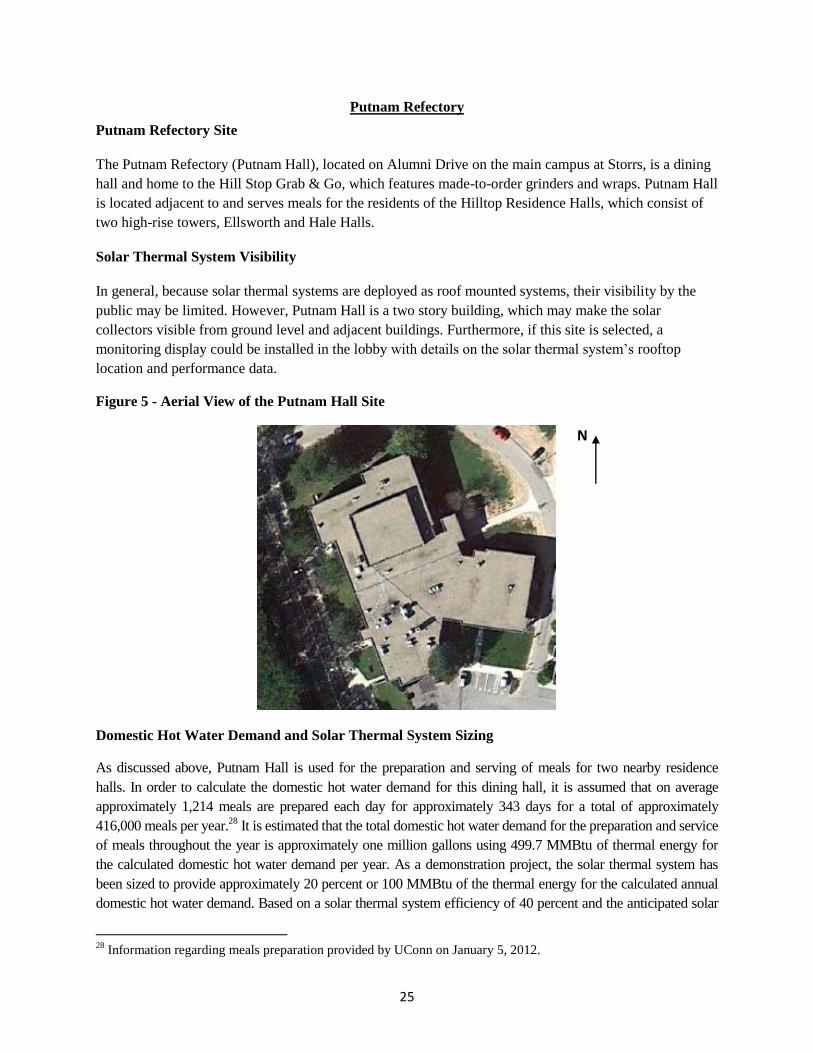
Solar Thermal System Visibility
In general, because solar thermal systems are deployed as roof mounted systems, their visibility by the
public may be limited. However, Putnam Hall is a two story building, which may make the solar
collectors visible from ground level and adjacent buildings. Furthermore, if this site is selected, a
monitoring display could be installed in the lobby with details on the solar thermal system’s rooftop
location and performance data.
Figure 5 - Aerial View of the Putnam Hall Site
Domestic Hot Water Demand and Solar Thermal System Sizing
As discussed above, Putnam Hall is used for the preparation and serving of meals for two nearby residence
halls. In order to calculate the domestic hot water demand for this dining hall, it is assumed that on average
approximately 1,214 meals are prepared each day for approximately 343 days for a total of approximately
416,000 meals per year.28
It is estimated that the total domestic hot water demand for the preparation and service
of meals throughout the year is approximately one million gallons using 499.7 MMBtu of thermal energy for
the calculated domestic hot water demand per year. As a demonstration project, the solar thermal system has
been sized to provide approximately 20 percent or 100 MMBtu of the thermal energy for the calculated annual
domestic hot water demand. Based on a solar thermal system efficiency of 40 percent and the anticipated solar
28
Information regarding meals preparation provided by UConn on January 5, 2012.
N
26
insolation for the Storrs area, the proposed solar thermal system collector area would be approximately 530
square feet. An approximately 530 square foot solar thermal system could fit on the existing roof structure;
however, a structural analysis of Putnam Hall has not been completed for this potential application.
Environmental Benefits of a Solar Thermal System
Solar thermal systems create environmental benefits by displacing fossil fuels used to produce thermal
energy. Putnam Hall currently uses thermal energy produced from two natural gas fired boilers located in
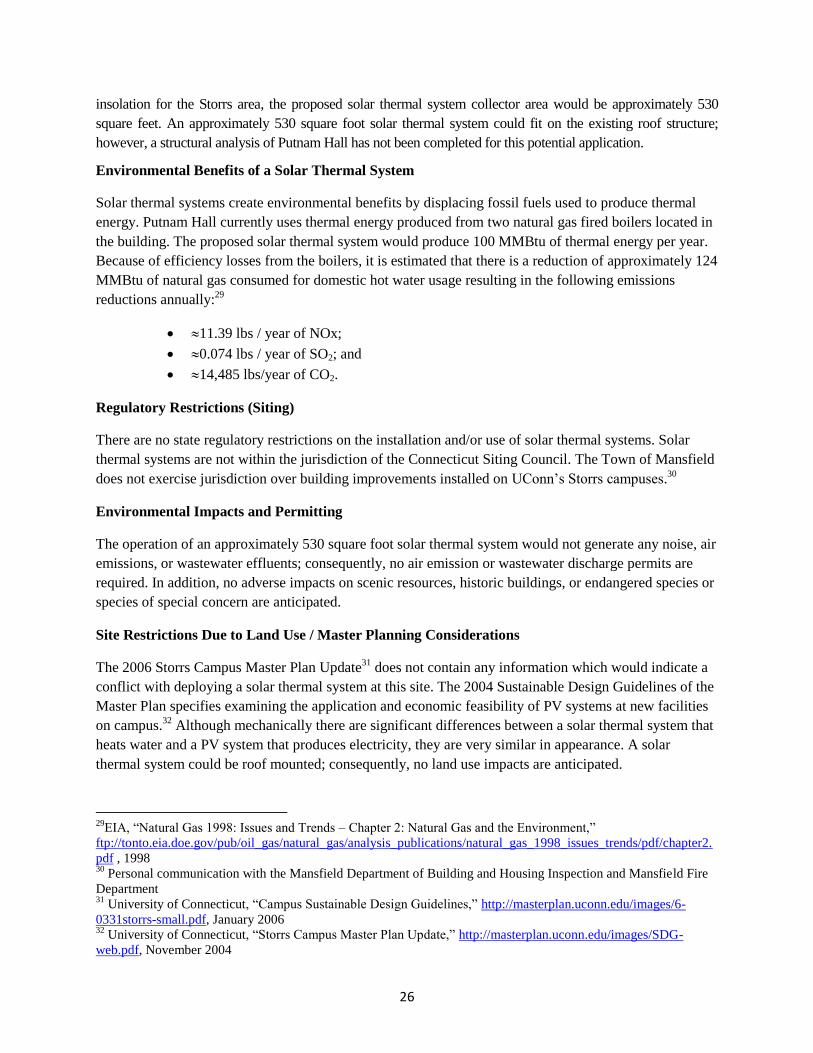
the building. The proposed solar thermal system would produce 100 MMBtu of thermal energy per year.
Because of efficiency losses from the boilers, it is estimated that there is a reduction of approximately 124
MMBtu of natural gas consumed for domestic hot water usage resulting in the following emissions
reductions annually:29
11.39 lbs / year of NOx;
0.074 lbs / year of SO2; and
14,485 lbs/year of CO2.
Regulatory Restrictions (Siting)
There are no state regulatory restrictions on the installation and/or use of solar thermal systems. Solar
thermal systems are not within the jurisdiction of the Connecticut Siting Council. The Town of Mansfield
does not exercise jurisdiction over building improvements installed on UConn’s Storrs campuses.30
Environmental Impacts and Permitting
The operation of an approximately 530 square foot solar thermal system would not generate any noise, air
emissions, or wastewater effluents; consequently, no air emission or wastewater discharge permits are
required. In addition, no adverse impacts on scenic resources, historic buildings, or endangered species or
species of special concern are anticipated.
Site Restrictions Due to Land Use / Master Planning Considerations
The 2006 Storrs Campus Master Plan Update31
does not contain any information which would indicate a
conflict with deploying a solar thermal system at this site. The 2004 Sustainable Design Guidelines of the
Master Plan specifies examining the application and economic feasibility of PV systems at new facilities
on campus.32
Although mechanically there are significant differences between a solar thermal system that
heats water and a PV system that produces electricity, they are very similar in appearance. A solar
thermal system could be roof mounted; consequently, no land use impacts are anticipated.
29
EIA, “Natural Gas 1998: Issues and Trends – Chapter 2: Natural Gas and the Environment,”
ftp://tonto.eia.doe.gov/pub/oil_gas/natural_gas/analysis_publications/natural_gas_1998_issues_trends/pdf/chapter2.
pdf , 1998 30
Personal communication with the Mansfield Department of Building and Housing Inspection and Mansfield Fire
Department 31
University of Connecticut, “Campus Sustainable Design Guidelines,” http://masterplan.uconn.edu/images/6-
0331storrs-small.pdf, January 2006 32
University of Connecticut, “Storrs Campus Master Plan Update,” http://masterplan.uconn.edu/images/SDG-
web.pdf, November 2004

27
Capital Cost
Typical costs for solar thermal systems approximate $150 per square foot of solar thermal collector area.
Consequently, a 530 square foot solar thermal system that could provide approximately 20 percent of the
calculated domestic hot water consumption for Putnam Hall would have a capital cost of approximately
$79,500.33
Operation and Maintenance Cost
Operation and maintenance costs for solar thermal systems are likely to be small. Maintenance of solar
thermal systems is likely to involve periodic inspection of the collectors to ensure that vegetation isn’t
shading the collector area and that the collectors are clean; inspection of piping for potential fluid leaks;
inspection of flashing and sealing around roof penetrations; inspection of nuts and bolts attaching the
collectors to support structures; and inspection of the pressure relief valve for proper operation.34
Economics and Funding
At present, solar thermal systems require public funding to subsidize system costs sufficiently to justify
investment on a financial basis. Capital grants, federal business investment tax credits, and accelerated
depreciation benefits are required to achieve a financial payback within the life of the system. For the
analyses detailed below, deployment is assumed to take place in 2012, thereby forfeiting the 2011, 100
percent accelerated depreciation monetization benefit. Instead, a 50 percent first year bonus depreciation
monetization structure is assumed as provided under current law.35
Federal investment tax credits are currently available at 30 percent of the project cost and accelerated
depreciation benefits can be monetized by the developer. Hence, the project economics of a solar thermal
system would clearly be attractive if it were developed by a third party developer capable of garnering all
of the available tax credits and accelerated depreciation benefits associated with renewable energy
projects.
Analysis of Grant Funding for Financial Feasibility
A solar thermal system installed at Putnam Hall would not achieve a financial payback within the
projected life of the system without a capital grant, investment tax credits, and depreciation. The primary
drivers are the initial cost of the system and relatively low energy costs at the site. However, a solar
thermal system could achieve a financial payback within the life of the system, an internal rate of return
of 9.33 percent, and a net present value of $2,133 with a capital grant of $46,235.36
33
Solar thermal system may not include water storage tank and installation costs. 34
U.S. DOE EERE, “Solar Heating Systems Maintenance and Repair,”
http://www.energysavers.gov/your_home/water_heating/index.cfm/mytopic=12950, February 2011 35
Dsireusa.org, “Modified Accelerated Cost-Recovery System (MACRS) + Bonus Depreciation (2008 – 2012),”
http://dsireusa.org/incentives/incentive.cfm?Incentive_Code=US06F&re=1&ee=1, October 14,2011 36
Assumes an installed cost of $150/sqft or a total installed cost of $79,500, a discount rate of seven percent, and
receipt of all applicable tax credits and accelerated depreciation benefits.

28
Site Orientation and Generation Loads
An approximately 530 square foot solar thermal system could be located on the roof of Putnam Hall, and
could be oriented towards the south for optimal yield. Given the height of the roof area above ground
level, the proximity and height of nearby buildings, and the lack of vegetation near Putnam Hall, no
shading impacts are anticipated. An analysis of the site indicates that Putnam Hall has well over 2,000
square feet of south facing roof area on the southeast side of the building that could support
approximately 530 square feet of solar thermal collectors; however, a structural analysis of Putnam Hall
has not been completed for this potential application.
.

29
Horsebarn Hill Sciences Complex Building #4 Annex
Horsebarn Hill Sciences Complex Building #4 Annex Site
Building #4 Annex, located on Horsebarn Hill Road on the main campus at Storrs, is used by faculty and
staff to promote multidisciplinary research, education and outreach in environmental sciences,
engineering, policy, and sustainability.37
Solar Thermal System Visibility
A solar thermal system could be deployed on the south facing roof of the Building #4 Annex building.
Although the south facing side of Building #4 Annex building is not visible from the street, it may be
visible from other locations on the main campus. In addition, if this site is selected, a monitoring display
could be installed in the facility’s lobby with details on the solar thermal system’s location and
performance data.
Figure 6 - Aerial View of Horsebarn Hill Sciences Complex Building #4 Annex Site
Domestic Hot Water Demand and Solar Thermal System Sizing
As discussed above, Building #4 Annex is used by faculty and students for research and educational activities,
as well as providing analytical services. In order to calculate the domestic hot water demand for Building #4
Annex, it is assumed that on average approximately 35 members of the faculty and staff utilizes the building
approximately 250 days per year.38
It is estimated that the total domestic hot water demand for hand washing
and cleaning throughout the year is approximately 13,125 gallons using 8.2 MMBtu of thermal energy for the
calculated domestic hot water demand per year. Approximately 32 square feet of solar thermal collector area
37
University of Connecticut Center for Environmental Sciences and Engineering, http://www.cese.uconn.edu/,
March 2012 38
Information regarding meal preparation provided by UConn on January 10, 2012.
N
30
could provide approximately 74 percent or 6 MMBtu of the thermal energy for Building #4 Annex based on a
solar thermal system efficiency of 40 percent and the anticipated solar insolation for the Storrs area. An
approximately 32 square foot solar thermal system could fit on the existing roof structure however, a structural
analysis of Building #4 Annex has not been completed for this potential application.
Environmental Benefits of a Solar Thermal System
Solar thermal systems create environmental benefits by displacing fossil fuels used to produce thermal
energy. Building #4 Annex currently uses thermal energy produced from natural gas by a boiler located in
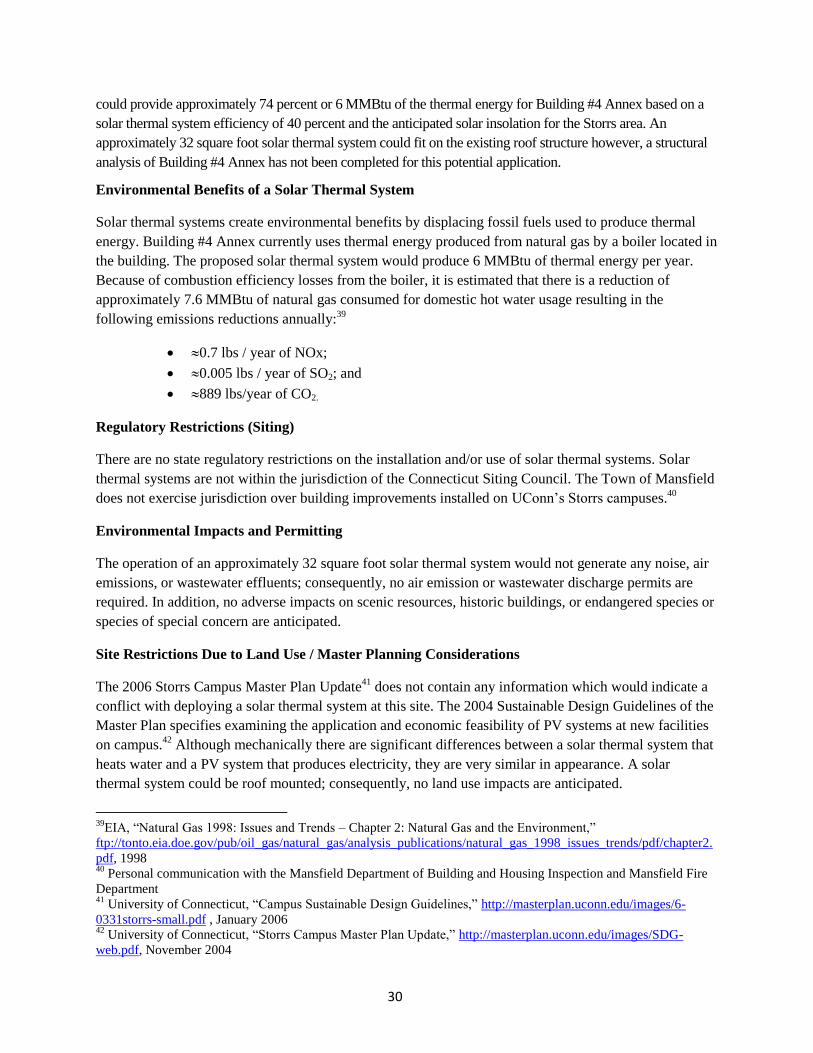
the building. The proposed solar thermal system would produce 6 MMBtu of thermal energy per year.
Because of combustion efficiency losses from the boiler, it is estimated that there is a reduction of
approximately 7.6 MMBtu of natural gas consumed for domestic hot water usage resulting in the
following emissions reductions annually:39
0.7 lbs / year of NOx;
0.005 lbs / year of SO2; and
889 lbs/year of CO2.
Regulatory Restrictions (Siting)
There are no state regulatory restrictions on the installation and/or use of solar thermal systems. Solar
thermal systems are not within the jurisdiction of the Connecticut Siting Council. The Town of Mansfield
does not exercise jurisdiction over building improvements installed on UConn’s Storrs campuses.40
Environmental Impacts and Permitting
The operation of an approximately 32 square foot solar thermal system would not generate any noise, air
emissions, or wastewater effluents; consequently, no air emission or wastewater discharge permits are
required. In addition, no adverse impacts on scenic resources, historic buildings, or endangered species or
species of special concern are anticipated.
Site Restrictions Due to Land Use / Master Planning Considerations
The 2006 Storrs Campus Master Plan Update41
does not contain any information which would indicate a
conflict with deploying a solar thermal system at this site. The 2004 Sustainable Design Guidelines of the
Master Plan specifies examining the application and economic feasibility of PV systems at new facilities
on campus.42
Although mechanically there are significant differences between a solar thermal system that
heats water and a PV system that produces electricity, they are very similar in appearance. A solar
thermal system could be roof mounted; consequently, no land use impacts are anticipated.
39
EIA, “Natural Gas 1998: Issues and Trends – Chapter 2: Natural Gas and the Environment,”
ftp://tonto.eia.doe.gov/pub/oil_gas/natural_gas/analysis_publications/natural_gas_1998_issues_trends/pdf/chapter2.
pdf, 1998 40
Personal communication with the Mansfield Department of Building and Housing Inspection and Mansfield Fire
Department 41
University of Connecticut, “Campus Sustainable Design Guidelines,” http://masterplan.uconn.edu/images/6-
0331storrs-small.pdf , January 2006 42
University of Connecticut, “Storrs Campus Master Plan Update,” http://masterplan.uconn.edu/images/SDG-
web.pdf, November 2004

31
Capital Cost
Typical costs for solar thermal systems approximate $150 per square foot of solar thermal collector area.
Consequently, a 32 square foot solar thermal system that could provide approximately 74 percent of the
calculated domestic hot water consumption for Building #4 Annex would have a capital cost of
approximately $4,800.43
Operation and Maintenance Cost
Operation and maintenance costs for solar thermal systems are likely to be small. Maintenance of solar
thermal systems is likely to involve periodic inspection of the collectors to ensure that vegetation isn’t
shading the collector area and that the collectors are clean; inspection of piping for potential fluid leaks;
inspection of flashing and sealing around roof penetrations; inspection of nuts and bolts attaching the
collectors to support structures; and inspection of the pressure relief valve for proper operation.44
Economics and Funding
At present, solar thermal systems require public funding to subsidize system costs sufficiently to justify
investment on a financial basis. Capital grants, federal business investment tax credits, and accelerated
depreciation benefits are required to achieve a financial payback within the life of the system. However,
because of the relatively small size and cost of the demonstration solar thermal project at Building #4
Annex, it is questionable if a third party private entity, which could monetize the tax credits and
depreciation, will invest/develop such a project. A third party private entity may develop the potential
Building #4 Annex site if it were included in a coordinated and comprehensive build out with other solar
thermal systems around the campus.
Analysis of Grant Funding for Financial Feasibility
A solar thermal system installed at Building #4 Annex would not achieve a financial payback within the
projected life of the system without a capital grant. The primary drivers are the initial cost of the system
and relatively low energy costs at the site. However, a solar thermal system could achieve a financial
payback within the life of the system and an internal rate of return of 3.83 percent with a capital grant of
$4,066.
Site Orientation and Generation Loads
An approximately 32 square foot solar thermal system could be located on the roof of Building #4 Annex
and could be oriented towards the south for optimal yield. Given the height of the roof area above ground
level, the proximity and height of nearby buildings, and the lack of vegetation near the building, no
shading impacts are anticipated. An analysis of the site indicates that the building has sufficient roof area
on the south or west side of the Building #4 Annex to support approximately 32 square feet of solar
thermal collectors; however, a structural analysis of buildings have not been completed for this potential
application.
43
Solar thermal system may not include water storage tank and installation costs. 44
U.S. DOE EERE, “Solar Heating Systems Maintenance and Repair,”
http://www.energysavers.gov/your_home/water_heating/index.cfm/mytopic=12950, February 2011

32
SOLAR PHOTOVOLTAIC (PV)
Photovoltaic (PV) cells convert sunlight directly into electricity. There are now three generations of PV
technologies available on the market: traditional PV cells are flat plates made from silicon; second
generation PV cells, or “thin film” cells, which consist of layers of semiconductors only a few
micrometers thick; and third generation PV cells made from a diverse set of materials, including solar
inks, solar dyes, and conductive plastics. Typically, traditional PV cells are more expensive on a $ / kW
basis of installed capacity than second or third generation PV cells, but traditional PV cells have a higher
efficiency.45
This analysis assumed that traditional PV systems would be deployed at a capacity factor of
13.15 percent.
Figure 7 - Solar PV46
In general, PV systems are technically
feasible in Connecticut anywhere adequate
electrical interconnections and a sound
building roof or secure ground mount area
exist. The Department of Energy National
Renewable Energy Laboratory (NREL’s)
PV Watts model reports a value of 4.35
kWh/M2/day of incident solar radiation in
Mansfield, Connecticut. Typically, PV
systems are engineered for the greatest
average kWh output per year in order to
maximize the amount of electrical energy that can be net metered. Consequently, yields are optimized
when the PV panels are mounted such that they face due south along an inclined plane. General siting
criteria to consider when evaluating potential buildings for the installation of PV systems include:
Sites with sun exposure for 6-8 hours per day;
Building/structure capable of supporting renewable energy equipment without significant
reinforcing;
Building/structure has flat roof or sufficient pitch and orientation to maximize solar
potential;
Building/structure area sufficiently large to support renewable energy equipment
Building/structure roof materials allow installation of renewable energy equipment and
will not need to be replaced within the life of the renewable energy equipment; and
Sites that have a daytime (peak) electric demand.
Solar Related Research
UConn faculty is engaged in research for power electronics, energy conversion, renewable energy, and
smart grid applications. This research is of high value to advance the commercial viability of energy
45
National Renewable Energy Laboratory, “Learning About Renewable Energy,”
http://www.nrel.gov/learning/re_photovoltaics.html, December 06, 2011 46
Sandia National Laboratories; http://www.sandia.gov/LabNews/ln02-10-12/pv_1260.jpg

33
technologies, and has high value for student education. Further, this research can be conducted on
demonstration scale applications.
Dr. Sung-Yeul Park is a professor of Electrical Engineering is primarily interested in implementing a
power conditioning system that would integrate the electricity from a variety of alternative energy
resources into one usable electrical output. Dr. Park’s research goal is to increase efficiency, reliability
and stability of these systems. Dr. Park is interested in pursuing two main venues: purchasing a
commercial system and analyzing how it operates or designing and building a novel system and
controlling certain aspects of its operational dynamics. Dr. Park would like to tie the systems use into his
research and student education. To implement such a system, a variety of electricity-producing energy
sources must be in near proximity. Moreover, Dr. Park might be interested in making a small, portable
unit with micro-wind, micro-solar, fuel cells, conventional grid electricity attached to it that he could
utilize a power conditioning system on. Dr. Park is already working with the smart grid/smart building
group on campus.
Dr. Alexander G. Agrios, Assistant Professor, and Dr. Howard Epstein, Professor, both of UConn’s
Department of Civil & Environmental Engineering and Center for Clean Energy Engineering are working
with SolarChange from Fairfield, CT. They are involved in a solar demonstration project which uses a
solar concentrator approach to produce electricity and hot water. They have installed six roof top units (6’
x 4’ wide x 3’ high) on the flat roof of the Cap Lab at the Depot Campus.
Dr. Zhang, Assistant Professor in UConn’s Electrical & Computer Engineering Department, is interested
in research areas that involve renewable and sustainable energy, integration of solar and wind energy
conversion systems into smart grid systems, reliability evaluation of PV and wind farms, and power
system planning and operation. Dr. Zhang has worked extensively on PV generation and has published
several IEEE Transactions papers on PV power system reliability evaluation, modeling and control. Dr.
Zhang has identified the PV power system as one of his main research areas, and has submitted several
grant proposals about grid interconnection of PV systems.
Dr. Peter Luh, SNET Professor of Communications & Information Technologies at UConn’s Department
of Electrical & Computer Engineering, Dr. Sung-Yeul Park, Dr. Peng Zhang Dr. Alex Agrios, and Dr.
Laurent Michel are members of a multidisciplinary research group working on integration of an ultra
large PV farm into power systems.

34
A summary of potential sites selected for detailed analysis is as follows:
Table 4 – Summary of Solar PV Analyses
Building Existing/Estimated
Annual Energy
Consumption
(kWh)
Potential
Renewable
Energy
Generation
Capacity
Potential
Annual
Renewable
Energy
Production
(kWh)
Potential
Annual
Reductions
of CO2
Emissions
(lbs)
Percent of
Annual
Electricity
Demand Served
by Potential
Renewable
Energy System
Dep
ot
Cam
pus
Center for
Clean Energy
Engineering
(C2E2)
435,059
(2010)
10 kW 11,520 10,575 2.6%
Mai
n C
ampus
Homer
Babbidge
Library
6,333,618
(2011)
10 kW 11,520 10,575 0.2%
Horsebarn Hill
Sciences
Complex
Building #4
Annex
321,467
(2011)
10 kW 11,520 10,575 3.6%
Information
Technology
Engineering
Building
2,224,985
(2011)
10 kW 11,520 10,575 0.5%
Total: 40 kW 46,080
kWh
42,300
lbs/year

35
Center for Clean Energy Engineering
Center for Clean Energy Engineering Site
The Center for Clean Energy Engineering (C2E2), located at 44 Weaver Road on the Depot Campus at
Storrs, engages in advanced technological research related to clean energy technologies. C2E2 has 16,000
square feet of laboratory and office space, equipment for prototype manufacturing, cell assembly,
materials characterization, and fuel cell testing and diagnostics.
A 400 kW phosphoric acid fuel cell will be installed at the facility as a result of a grant from the
American Recovery and Reinvestment Act of 2009. The installation of a 10 kW photovoltaic (PV) system
in addition to the fuel cell will demonstrate C2E2’s leadership in clean energy, and support academic
interests for integrating clean energy technologies through a microgrid and/or smart grid. The facility is
on the Depot Campus’ master electrical meter; consequently, electricity produced at C2E2 can be utilized
in other facilities on the Depot Campus.
Solar PV System Visibility
The potential location for a 10 kW PV system is the south facing roof near the entrance to the facility
(Figure 8), which would provide optimal orientation for system yield and would be in an area of high
public visibility. If the site is selected a monitoring display could be installed in the facility’s lobby to
provide performance data for a 10 kW PV system.
Figure 8 - Aerial View of the Center for Clean Energy Engineering
N

36
Environmental Benefits of 10 kW PV System
PV systems are an on-peak zero emissions renewable energy technology. As such, their avoided
emissions benefits are equal to the on peak marginal emissions rate (lbs/MWh) of electric power within
the region. The 2009 Calculated New England Marginal Emission Rates (lb/MWh) values are depicted in
Appendix I. A 10 kW PV system located at the Depot Campus is expected to generate approximately
11,520 kWh per year, or 11.52 MWh. A 10 kW PV system could therefore result in the following
emissions reductions annually:
1.95 to 2.19 lbs / year of NOx;47
2.76 lbs / year of SO2; and
10,575 lbs / year of CO2.
Regulatory Restrictions (Siting)
There are no state regulatory restrictions on the installation and/or use of PV systems. Certificates of
Environmental Compatibility and Public Need are not required for “…any customer-side distributed
resources project or a facility or grid-side distributed resources project or facility with a capacity of not
more than sixty-five megawatts, as long as such project meets air and water quality standards of the
Department of Environmental Protection...”48
Consequently, a 10 kW PV system would be exempt from
Siting Council regulations for an electric generation facility. In addition, the Town of Mansfield does not
exercise jurisdiction over building improvements, such as for PV systems, installed on UConn’s
campuses at Storrs.49
Environmental Impacts and Permitting
The operation of a 10 kW PV system would not generate any noise, air emissions, or wastewater
effluents; consequently, no air emission or wastewater discharge permits are required. In addition, no
adverse impacts on scenic resources, historic buildings, or endangered species or species of special
concern are anticipated.
Site Restrictions Due to Land Use / Master Planning Considerations
The 2000 UConn Outlying Parcels Master Plan50
does not contain any information which would indicate
a conflict with deploying a PV system at this potential site. The 2004 Sustainable Design Guidelines of
the Master Plan specifies examining the application and economic feasibility of PV systems at new
facilities on campus.51
The Green Depot Campus Initiative seeks to develop and demonstrate clean and
47
Based on a range of the on-peak ozone and non-ozone seasons 48
Connecticut General Statutes, Sec. 16-50k 49
Phone call with Mansfield Department of Building and Housing Inspection 50
University of Connecticut , “Outlying Parcels Master Plan,”
http://masterplan.uconn.edu/images/OPMP_5_22_2000.pdf, June 2000 51
University of Connecticut, “Campus Sustainable Design Guidelines,” http://masterplan.uconn.edu/images/SDG-
web.pdf, November 2004
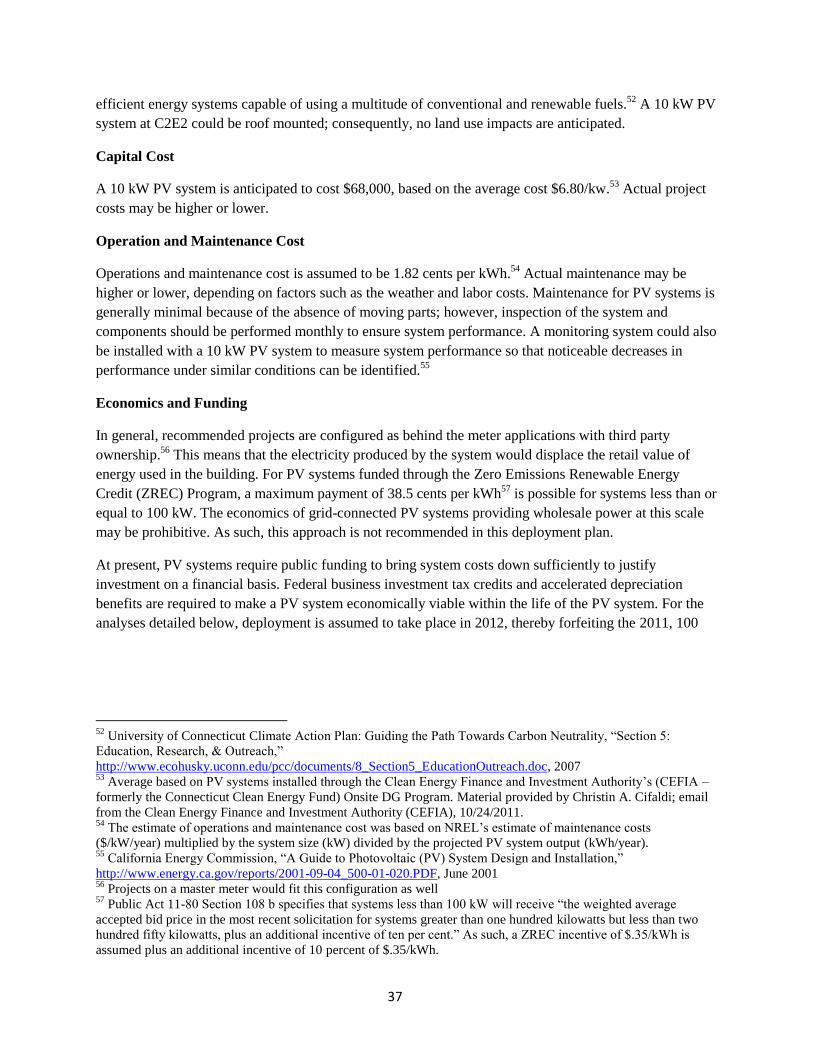
37
efficient energy systems capable of using a multitude of conventional and renewable fuels.52
A 10 kW PV
system at C2E2 could be roof mounted; consequently, no land use impacts are anticipated.
Capital Cost
A 10 kW PV system is anticipated to cost $68,000, based on the average cost $6.80/kw.53
Actual project
costs may be higher or lower.
Operation and Maintenance Cost
Operations and maintenance cost is assumed to be 1.82 cents per kWh.54
Actual maintenance may be
higher or lower, depending on factors such as the weather and labor costs. Maintenance for PV systems is
generally minimal because of the absence of moving parts; however, inspection of the system and
components should be performed monthly to ensure system performance. A monitoring system could also
be installed with a 10 kW PV system to measure system performance so that noticeable decreases in
performance under similar conditions can be identified.55
Economics and Funding
In general, recommended projects are configured as behind the meter applications with third party
ownership.56
This means that the electricity produced by the system would displace the retail value of
energy used in the building. For PV systems funded through the Zero Emissions Renewable Energy
Credit (ZREC) Program, a maximum payment of 38.5 cents per kWh57
is possible for systems less than or
equal to 100 kW. The economics of grid-connected PV systems providing wholesale power at this scale
may be prohibitive. As such, this approach is not recommended in this deployment plan.
At present, PV systems require public funding to bring system costs down sufficiently to justify
investment on a financial basis. Federal business investment tax credits and accelerated depreciation
benefits are required to make a PV system economically viable within the life of the PV system. For the
analyses detailed below, deployment is assumed to take place in 2012, thereby forfeiting the 2011, 100
52
University of Connecticut Climate Action Plan: Guiding the Path Towards Carbon Neutrality, “Section 5:
Education, Research, & Outreach,”
http://www.ecohusky.uconn.edu/pcc/documents/8_Section5_EducationOutreach.doc, 2007 53
Average based on PV systems installed through the Clean Energy Finance and Investment Authority’s (CEFIA –
formerly the Connecticut Clean Energy Fund) Onsite DG Program. Material provided by Christin A. Cifaldi; email
from the Clean Energy Finance and Investment Authority (CEFIA), 10/24/2011. 54
The estimate of operations and maintenance cost was based on NREL’s estimate of maintenance costs
($/kW/year) multiplied by the system size (kW) divided by the projected PV system output (kWh/year). 55
California Energy Commission, “A Guide to Photovoltaic (PV) System Design and Installation,”
http://www.energy.ca.gov/reports/2001-09-04_500-01-020.PDF, June 2001 56
Projects on a master meter would fit this configuration as well 57
Public Act 11-80 Section 108 b specifies that systems less than 100 kW will receive “the weighted average
accepted bid price in the most recent solicitation for systems greater than one hundred kilowatts but less than two
hundred fifty kilowatts, plus an additional incentive of ten per cent.” As such, a ZREC incentive of $.35/kWh is
assumed plus an additional incentive of 10 percent of $.35/kWh.

38
percent accelerated depreciation monetization benefit. Instead, a 50 percent first year bonus depreciation
monetization structure is assumed as provided under current law.58
Federal investment tax credits are currently available at 30 percent of the project cost and accelerated
depreciation benefits are monetized by a developer. Hence, the project economics of a 10 kW PV system
would clearly be more attractive if it were developed by a third party developer capable of garnering all of
the available tax credits and accelerated depreciation benefits associated with renewable energy projects.
Zero Emissions Renewable Energy Credit Program (ZREC Program)
An option for funding a PV system on the Depot Campus is to submit an application for funding for the
upcoming ZREC incentive program created as part of Connecticut Public Act 11-80. This program is
expected to begin in 2012 and will utilize a competitive performance based production incentive that
would provide grants for actual energy produced based on a $/MWh basis over a period of 15 years.
A 10 kW PV project for a large CL&P customer under October 2011 rates would achieve a positive cash
flow for all years if a fifteen year finance period is selected to match the ZREC program incentive
payment period at $.385/kWh with an avoided electricity cost of 13.20 cents per kWh (a total energy
value of $.517/kWh). The project would have a nine year payback, an internal rate of return of 9.42
percent, and a net present value of $6,449.59
Site Orientation and Generation Loads
A 10 kW PV system could be located on the south facing roof of C2E2 and could be oriented towards the
south for optimal yield. Given the height of the roof area above ground level, the proximity and height of
nearby buildings, and the lack of vegetation near C2E2, no shading impacts are anticipated. Analysis of
the site using U.S. Department of Energy software indicates that the site could support more than 10 kW
of PV capacity; however, a structural analysis of C2E2 has not been completed for this potential
application.
A 10 kW PV system at C2E2 could produce 11,519 kWh/year with an estimated capacity factor of 13.15
percent. When combined, the electric output from the 10 kW PV system and the electric output from a
400 kW fuel cell (a 400 kW phosphoric acid fuel cell is estimated to produce 3,250,000 kWh per year,
initially), are not expected to exceed the aggregate annual load of the Depot Campus (measured at
approximately 4,500,000 kWh/year). Use of net metering will ensure that the full retail value of the
electricity produced at C2E2 is captured by the project. This potential deployment site was also assessed
in the Preliminary Feasibility Study and Strategic Plan for the Depot Campus.
58
Dsireusa.org, “Modified Accelerated Cost-Recovery System (MACRS) + Bonus Depreciation (2008 – 2012),”
http://dsireusa.org/incentives/incentive.cfm?Incentive_Code=US06F&re=1&ee=1, October 14,2011 59
Assumes an installed cost of $6.80 per watt or a totaled installed cost of $68,000, a discount rate of seven percent,
and receipt of all applicable tax credits and accelerated depreciation benefits.

39
Potential sites that were analyzed for the deployment of 10 kW of PV capacity at the main campus at
Storrs include the Homer Babbidge Library, the Horsebarn Hill Sciences Complex Building #4 Annex,
and the Information Technology Engineering Building. Because a 10 kW PV system at any of the three
potential deployment sites identified above would have very similar project characteristics, the
environmental benefits, regulatory requirements, permitting, capital and maintenance costs, and project
economics would be the same and are summarized below.
Homer Babbidge Library
Homer Babbidge Library Site
The Homer Babbidge Library, located at 369 Fairfield Way on the main campus at Storrs, has the largest
public collection of research in Connecticut and houses computer labs, instruction classrooms, digitizing
and scanning services, tutor and writing services, the Map and Geographic Information Center, and the
Roper Public Opinion archives.
Solar PV System Visibility
The potential site where a 10 kW PV system could be deployed is located on the southeast side near the
top of the Homer Babbidge Library (Figure 9 & Figure 9). As such, it would not be highly visible from
ground level or from other areas of the campus. However, if the potential site is selected, a monitoring
display could be installed in the Library’s lobby with details on the PV system’s location, orientation and
performance data.
Figure 9 - South Facing Roof Area Figure 10 – Arial of Homer Babbidge Library
of the Library
N
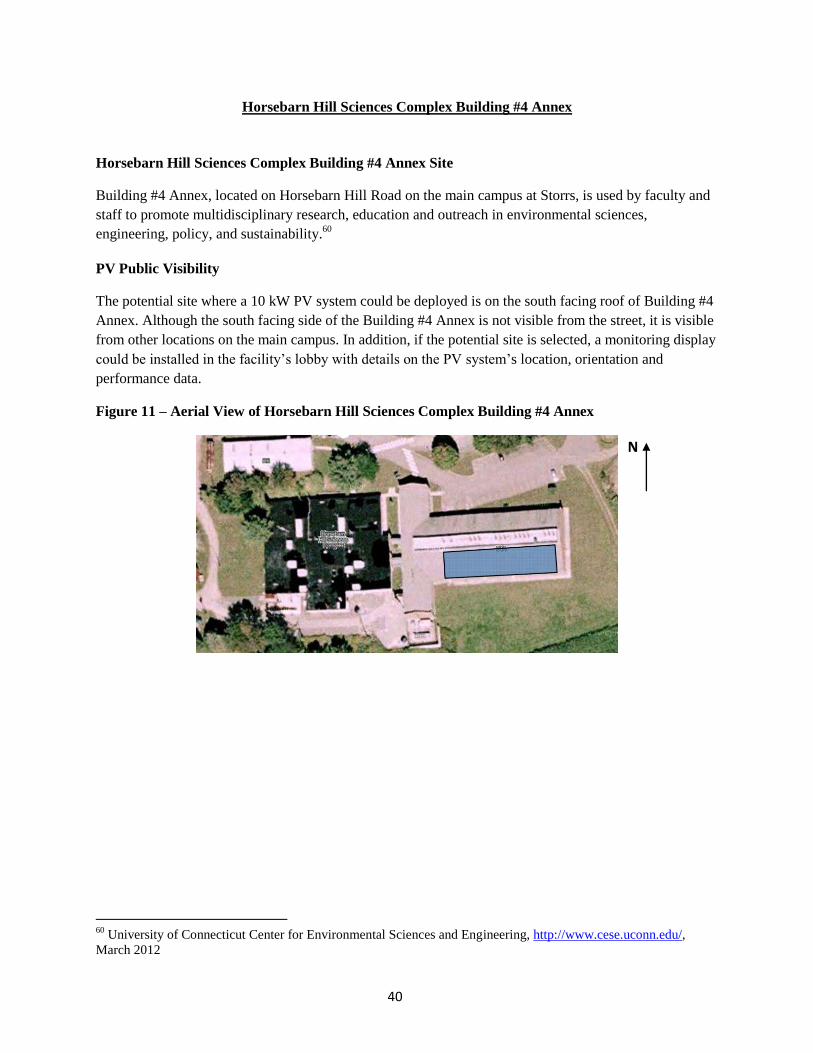
40
Horsebarn Hill Sciences Complex Building #4 Annex
Horsebarn Hill Sciences Complex Building #4 Annex Site
Building #4 Annex, located on Horsebarn Hill Road on the main campus at Storrs, is used by faculty and
staff to promote multidisciplinary research, education and outreach in environmental sciences,
engineering, policy, and sustainability.60
PV Public Visibility
The potential site where a 10 kW PV system could be deployed is on the south facing roof of Building #4
Annex. Although the south facing side of the Building #4 Annex is not visible from the street, it is visible
from other locations on the main campus. In addition, if the potential site is selected, a monitoring display
could be installed in the facility’s lobby with details on the PV system’s location, orientation and
performance data.
Figure 11 – Aerial View of Horsebarn Hill Sciences Complex Building #4 Annex
60
University of Connecticut Center for Environmental Sciences and Engineering, http://www.cese.uconn.edu/,
March 2012
N
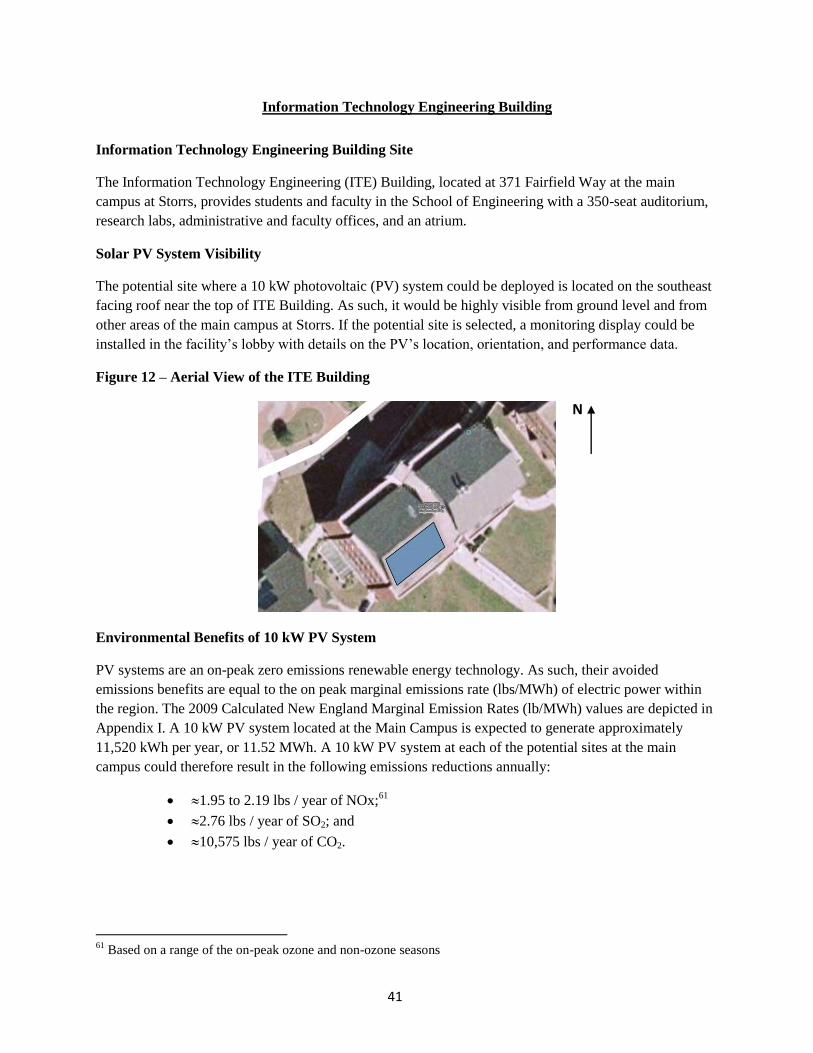
41
Information Technology Engineering Building
Information Technology Engineering Building Site
The Information Technology Engineering (ITE) Building, located at 371 Fairfield Way at the main
campus at Storrs, provides students and faculty in the School of Engineering with a 350-seat auditorium,
research labs, administrative and faculty offices, and an atrium.
Solar PV System Visibility
The potential site where a 10 kW photovoltaic (PV) system could be deployed is located on the southeast
facing roof near the top of ITE Building. As such, it would be highly visible from ground level and from
other areas of the main campus at Storrs. If the potential site is selected, a monitoring display could be
installed in the facility’s lobby with details on the PV’s location, orientation, and performance data.
Figure 12 – Aerial View of the ITE Building
Environmental Benefits of 10 kW PV System
PV systems are an on-peak zero emissions renewable energy technology. As such, their avoided
emissions benefits are equal to the on peak marginal emissions rate (lbs/MWh) of electric power within
the region. The 2009 Calculated New England Marginal Emission Rates (lb/MWh) values are depicted in
Appendix I. A 10 kW PV system located at the Main Campus is expected to generate approximately
11,520 kWh per year, or 11.52 MWh. A 10 kW PV system at each of the potential sites at the main
campus could therefore result in the following emissions reductions annually:
1.95 to 2.19 lbs / year of NOx;61
2.76 lbs / year of SO2; and
10,575 lbs / year of CO2.
61
Based on a range of the on-peak ozone and non-ozone seasons
N
42
Regulatory Restrictions (Siting)
There are no state regulatory restrictions on the installation and/or use of PV systems. Certificates of
Environmental Compatibility and Public Need are not required for “…any customer-side distributed
resources project or a facility or grid-side distributed resources project or facility with a capacity of not
more than sixty-five megawatts, as long as such project meets air and water quality standards of the
Department of Environmental Protection...”62
Consequently, a 10 kW PV system would be exempt from
Siting Council regulations for an electric generation facility. In addition, the Town of Mansfield does not
exercise jurisdiction over building improvements, such as for PV systems, installed on UConn’s
campuses.63
Environmental Impacts and Permitting
The operation of a 10 kW PV system would not generate any noise, air emissions, or wastewater
effluents; consequently, no air emission or wastewater discharge permits are required. In addition, no
adverse impacts on scenic resources, historic buildings, or endangered species or species of special
concern are anticipated.
Site Restrictions Due to Land Use / Master Planning Considerations
The 2006 Storrs Campus Master Plan Update64
does not contain any information which would indicate a
conflict with deploying a PV system at this site. The 2004 Sustainable Design Guidelines of the Master
Plan specifies examining the application and economic feasibility of PV systems at new facilities on
campus.65
A 10 kW PV system could be roof mounted; consequently, no land use impacts are anticipated.
Capital Cost
A 10 kW PV system is anticipated to cost $68,000, based on the average cost $6.80/kw.66
Actual project
costs may be higher or lower.
Operation and Maintenance Cost
Operations and maintenance cost is assumed to be 1.82 cents per kWh.67
Actual maintenance may be
higher or lower, depending on factors such as the weather and labor costs. Maintenance for PV systems is
generally minimal because of the absence of moving parts; however, inspection of the system and
components should be performed monthly to ensure system performance. A monitoring system could also
62
Connecticut General Statutes, Sec. 16-50k 63
Phone call with Mansfield Department of Building and Housing Inspection 64
University of Connecticut, “Storrs Campus Master Plan Update,” http://masterplan.uconn.edu/images/6-
0331storrs-small.pdf, January 2006 65
University of Connecticut, “Campus Sustainable design Guidelines,” http://masterplan.uconn.edu/images/SDG-
web.pdf, November 2004 66
Average based on PV systems installed through the Clean Energy Finance and Investment Authority’s (CEFIA –
formerly the Connecticut Clean Energy Fund) Onsite DG Program. Material provided by Christin A. Cifaldi; email
from the Clean Energy Finance and Investment Authority (CEFIA), 10/24/2011. 67
The estimate of operations and maintenance cost was based on NREL’s estimate of maintenance costs
($/kW/year) multiplied by the system size (kW) divided by the projected PV system output (kWh/year).
43
be installed with a 10 kW PV system to measure system performance so that noticeable decreases in
performance under similar conditions can be identified.68
Economics and Funding
In general, recommended projects are configured as behind the meter applications with third party
ownership.69
This means that the electricity produced by the system would displace the retail value of
energy used in the building. For PV systems funded through the ZREC program, a maximum payment of
38.5 cents per kWh70
is possible for systems less than or equal to 100 kW. The economics of grid-
connected PV systems providing wholesale power at this scale may be prohibitive. As such, this approach
is not recommended in this deployment plan.
At present, PV systems require public funding to bring system costs down sufficiently to justify
investment on a financial basis. Federal business investment tax credits and accelerated depreciation
benefits are required to make a PV system economically viable within the life of the PV system. For the
analyses detailed below, deployment is assumed to take place in 2012, thereby forfeiting the 2011, 100
percent accelerated depreciation monetization benefit. Instead, a 50 percent first year bonus depreciation
monetization structure is assumed as provided under current law.71
Federal investment tax credits are currently available at 30 percent of the project cost and accelerated
depreciation benefits are monetized by a developer. Hence, the project economics of a 10 kW PV system
would clearly be more attractive if it were developed by a third party developer capable of garnering all of
the available tax credits and accelerated depreciation benefits associated with renewable energy projects.
Zero Emissions Renewable Energy Credit Program (ZREC Program)
An option for funding a PV system on the Depot Campus is to submit an application for funding for the
upcoming ZREC incentive program created as part of Connecticut Public Act 11-80. This program is
expected to begin in 2012 and will utilize a competitive performance based production incentive that
would provide grants for actual energy produced based on a $/MWh basis over a period of 15 years.
For each of the sites evaluated on the main campus at Storrs, a 10 kW PV project for a large CL&P
customer under October 2011 rates would achieve a positive cash flow for all years if a fifteen year
finance period is selected to match the ZREC program incentive payment period at $.385/kWh with an
avoided electricity cost of 11.35 cents per kWh (a total energy value of $.4985/kWh). The project would
have a nine year payback, an internal rate of return of 8.49 percent, and a net present value of $3,864. 72
68
California Energy Commission, “A Guide to Photovoltaic (PV) System Design and Installation,”
http://www.energy.ca.gov/reports/2001-09-04_500-01-020.PDF, June 2001 69
Projects on a master meter would fit this configuration as well 70
Public Act 11-80 Section 108 b specifies that systems less than 100 kW will receive “the weighted average
accepted bid price in the most recent solicitation for systems greater than one hundred kilowatts but less than two
hundred fifty kilowatts, plus an additional incentive of ten per cent.” As such, a ZREC incentive of $.35/kWh is
assumed plus an additional incentive of 10 percent of $.35/kWh. 71
Dsireusa.org, “Modified Accelerated Cost-Recovery System (MACRS) + Bonus Depreciation (2008 – 2012),”
http://dsireusa.org/incentives/incentive.cfm?Incentive_Code=US06F&re=1&ee=1, October 14,2011 72
Assumes an installed cost of $6.80 per watt or a totaled installed cost of $68,000, a discount rate of seven percent,
and receipt of all applicable tax credits and accelerated depreciation benefits.

44
Site Orientation and Generation Loads
A 10 kW PV system could be located on the south facing roof of the Homer Babbidge Library, the
Horsebarn Hill Sciences Complex Building #4 Annex, and/or the ITE Building and could be oriented
towards the south for optimal yield. Given the height of the roofs area above ground level, the proximity
and height of nearby buildings, and the lack of vegetation near the buildings, no shading impacts for any
of the sites are anticipated. Analysis of all three buildings using U.S. Department of Energy software
indicates that the buildings could support more than 10 kW of PV capacity on the roofs of the buildings;
however, a structural analysis of the Homer Babbidge Library, the Horsebarn Hill Sciences Complex
Building #4 Annex, or the ITE Building has not been completed for these potential applications.
A 10 kW PV system at the Homer Babbidge Library, the Horsebarn Hill Sciences Complex Building #4
Annex, and/or the ITE Building could each produce 11,520 kWh/year with an estimated capacity factor of
13.15 percent. The potential buildings on UConn’s main campus utilizes energy produced by a
cogeneration system; consequently, actual system economics may be more challenging because UConn’s
avoided electric utility cost is most likely lower than it would be if it purchased power from the grid.
45
Ground Mounted Systems
In situations where a building’s remaining roof life and or structural integrity to support roof mounted
systems is inadequate, ground mounted systems may be a possibility. Ground mounted systems are more
accessible and easy to maintain, but may impact future land uses and may be subject to vandalism or
theft. Ground mounted PV systems can be installed in a fixed position or with tracking, in order to
maximize the system’s productivity. Flat-plate PV panels in a fixed position have some advantages
including lower cost and fewer moving parts. However, because PV panels installed in a fixed position do
not adjust to variations in the sun’s angle or movement throughout the day, the amount of electricity
produced would be less than a tracking PV system. In some parts of the country, concentrating solar
power (CSP) technologies use mirrors to reflect and concentrate sunlight which creates thermal energy
that can then be used to produce electricity via a steam turbine or heat engine that drives a generator.
Estimates indicate that approximately four to six acres of land may be required to support the installation
of 500 kW (DC) of ground mounted PV capacity. Since UConn owns more than 4,000 acres of land in
the Town of Mansfield with a variety of undeveloped parcels, including the soon to be developed
Technology Park on the north campus in Storrs, sufficient land area exists to accommodate a land-based
solar array of this size. This system could provide energy for the Tech Park or could offset the anticipated
energy demand from the Reclaimed Water Facility (approximately 500 kW). The Reclaimed Water
Facility is currently under construction on the north campus and should be operational by the end of
2012.73
The installed cost for 500 kW (DC) of PV capacity is estimated to be approximately $3.6 million, based
on an estimated installed cost of $7.28 / W.74
UConn could enter into an Energy Services Agreement
(ESA) type contract backed by state production incentives and/or federal incentive programs that could
allow for the development of renewable energy projects with little to no upfront costs to the host site.
Development of this type of project would align with the recommendations outlined in UConn’s Climate
Action Plan that include a commitment to renewable energy goals for the campus’ energy supply and
incorporation of alternative energy sources into new construction, thereby reducing UConn’s carbon
footprint.
73
Correspondence from UConn dated January 27, 2012. 74
National Renewable Energy Laboratory, “The Open PV Project,” http://openpv.nrel.gov/. November 18, 2009.

46
SMALL SCALE WIND
All wind turbines function by capturing kinetic energy in the wind and turning it into mechanical power.
Blades capture the wind over their swept area to turn a shaft, which connects to a generator to produce
electricity.75
Small wind systems typically range in size from 20 watts to 100 kW.76
In general, the
economics of small wind energy systems at the main or Depot Campuses at UConn may not be cost
effective without financial support, including capital grants, tax credits, depreciation, and production
incentives due to the suspected wind resources in the area.
Figure 13 - Small Wind Systems77
Small wind turbines can be separated into
two basic types determined by orientation of
the turbine. Wind turbines that rotate with a
horizontal axis are more common, while
vertical axis wind turbines are less
frequently used for electric generation. A
tower-mounted horizontal axis turbine
system typically consists of a wind turbine, a
guyed or self supporting tower, foundations
for the tower and guy wires, tower guy
wires, electrical grounding, electrical power
meter or interconnection point. Most wind
turbines currently in use are horizontal axis
turbines. These systems typically take
advantage of wind resources at a hub height
of 30 meters (100 feet) or greater.78
The availability of wind resources is very important when siting wind turbines. The greater the wind
resources, the more electricity can be generated per turbine rotor swept area. The available power in the
wind is proportional to the cube of its speed, so if the average wind speed doubles from 4.5 meters/second
to 9 meters/second, the power available to the wind generator increases by a factor of 8. The main and
Depot Campuses at UConn are predominately within the upper limit of a Class I or lower limit of a Class
II wind resource area. Class II wind resources at a 10 meter hub height (33 feet) are defined as having an
average wind speed of 4.5 to 5.1 meters per second (9.8 – 11.5 miles per hour) or a wind power density of
100 watts per meter squared. 79
Aside from the presence of adequate wind resources, technical considerations for mounting wind turbine
systems include electric grid interconnection under various scenarios. Roof mounted systems may be the
75
Energy Efficiency & Renewable Energy, “Wind Powering America,”
http://www.windpoweringamerica.gov/windmaps/, February 7, 2012 76
NREL, “Small Wind Electric Systems,” http://www.nrel.gov/docs/fy07osti/42005.pdf, 2002 77
American Wind Energy Association; http://archive.awea.org/faq/wwt_basics.html 78
EERE, Energy Basics, “ Wind Turbines,”
http://www.eere.energy.gov/basics/renewable_energy/wind_turbines.html, August 2011 79
Mean wind speed is based on Rayleigh speed distribution of equivalent mean wind power density. National
Renewable Energy Laboratory; http://rredc.nrel.gov/wind/pubs/atlas/tables/1-1T.html

47
least costly because the electrical interconnections are more readily available. Moreover, roof mounted
systems also have the advantage of not requiring the use of additional land area to site the turbine.
General criteria to consider when evaluating potential buildings for the installation of a small wind
turbine system include:
Sites that provide unobstructed wind resources; and
Building/structure capable of supporting renewable energy equipment without significant
reinforcing.
In addition, there are a few issues that are typically associated with the development of wind turbines:
tower failures, noise, visibility, avian mortality, and ice throw. These concerns are usually attributed to
large wind turbines and wind turbine farms; however, these concerns may also be raised during
consideration of small wind systems, and must be addressed in a site specific manner.
Turbine/Tower failures: Turbines mounted on towers are engineered to withstand high winds. Proper
installation and annual maintenance of a wind turbine/tower would reduce the likelihood of a tower
failing. Several common reasons for tower failure include improper torque on guy line grip clips,
improper guy line tensioning, improper guy line radii, improper anchor installation, improper torque on
tower connections, and improper height of installed guy lines.80
Noise: Turbine and blade noise can be modeled to estimate noise levels for compliance with noise
regulations at receptor sites for various land uses. Residential receptors typically have more stringent
regulatory requirements than commercial or industrial receptors.
Visibility: Visibility can be modeled to determine the impact on the view shed and surrounding land uses
during various times of the year. For educational purposes, potential sites that are visible from many
locations would be favorable. However, the shadow caused by the sun on the rotating wind turbine rotors
may cause a “flicker” shadow. The “flicker” shadow is usually caused when the sun is relatively low in
the sky and behind the tower. The impact of flicker can be minimized with proper siting in a site specific
manner.
Avian Mortality – the majority of the research conducted on avian mortality has focused on large wind
turbines and wind turbine farms. It has been estimated that approximately two birds’ fatalities may result
from avian collisions with a wind tower annually, which accounts for less than 0.01 percent of all
anthropogenic avian fatalities annually.81
Guyed towers, because of the presence of guy wires, are more
likely to result in avian collisions than self supporting monopole towers.
Icing: When ice forms and builds up on the blades, the rotor will turn more slowly, which would reduce
the danger of ice being thrown off.82
To minimize potential problems with icing, the turbine rotors can be
purchased with a black finish, heated elements, or braked to reduce the potential for ice throw. In
addition, the tower/turbine can be located in an area that is inaccessible to pedestrians.
80
Installation Manual - BWC EXCEL Wind Turbine and Guyed-Lattice Towers, September 2011 81
A Summary and Comparison of Bird Mortality from Anthropogenic Causes with an Emphasis on Collisions,
Erickson et al, USDA Forest Service Gen. Tech. Rep. PSW-GTR-191. 2005. 82
American Wind Energy Association, “Small Wind,”
http://archive.awea.org/smallwind/toolbox2/factsheet_public_safety.html, March 2012

48
Small Wind Related Research
The School of Engineering at UConn provides students with both classroom instruction and hands-on
laboratory experience. As such, UConn is well suited to evaluate innovative wind turbine designs and
applications on the main or Depot Campuses. For the purpose of assessing the economic and
environmental benefits of small wind turbine systems, this analysis will evaluate a commercially available
10 kW horizontal axis wind turbine system.
A summary of potential sites selected for detailed analysis is as follows:
Table 5 – Summary of Small Wind Analyses
Building Existing/Estimat
ed Annual
Energy
Consumption
(kWh)
Potential
Renewable
Energy
Generation
Capacity
Potential
Annual
Renewable
Energy
Production
(kWh)
Potential
Annual
Reductions
of CO2
Emissions
(lbs)
Percent of
Annual
Electricity
Demand Served
by Potential
Renewable
Energy System
Homer
Babbidge
Library
6,333,618
(2011)
10 kW 5,305 4,933 0.8%
North Campus N/A 10 kW 5,305 4,933 N/A
Longley
Building
(Depot
Campus)
336,000
(Occupied)
10 kW 5,305 4,933 1.6%
Total: 30 kW 15,915
kWh
14,799
lbs/year

49
Homer Babbidge Library
Homer Babbidge Library Site
The Homer Babbidge Library, located at 369 Fairfield Way on the main campus at Storrs, has the largest
public collection of research in Connecticut and houses computer labs, instruction classrooms, digitizing
and scanning services, tutor and writing services, the Map and Geographic Information Center, and the
Roper Public Opinion archives.
Small Wind System Visibility
The potential site where a 10 kW small wind system could be deployed is on top of the building, located
on the east/central portion of the roof area. It is anticipated that if the turbine is installed on a tower,
approximately 10 meters above the roof, it would be visible from various locations on campus. Based on
a visibility analysis, a wind turbine on a 10 meter tower on top of an approximately 60 foot tall building
would be visible from approximately 37 percent of the land area within one mile of the Homer Babbidge
Library (Figure 17).83
Consequently, the Homer Babbidge Library may provide an excellent opportunity
to increase awareness regarding the deployment of renewable technology on the main campus at Storrs.
Figure 14 - Aerial View of Homer Babbidge Library Site
83
Land area depicted in Figure 17 as having visibility of a 10 meter tower on top of the Babbidge Library may be
affected by other buildings and vegetation at eye level.
N

50
Environmental Benefits of a 10 kW Small Wind System
Small wind power systems are a zero emissions, renewable energy technology. As such, their avoided
emissions benefits are equal to the annual average emissions rate (lbs/MWh) of electric power within the
region. The 2009 Calculated New England Marginal Emission Rates (lb/MWh) values are depicted in
Appendix I. A 10 kW small wind system located at the Storrs campuses is expected to generate 5,305
kWh per year, or 5.305 MWh. A 10 kW small wind system could therefore result in the following
emissions reductions annually:
0.9 lbs / year of NOx;84
1.16 lbs / year of SO2; and
4,933 lbs / year of CO2.
Regulatory Restrictions (Siting)
There are no state regulatory restrictions on the installation and/or use of small wind systems. Certificates
of Environmental Compatibility and Public Need are not required for “…any customer-side distributed
resources project or a facility or grid-side distributed resources project or facility with a capacity of not
more than sixty-five megawatts, as long as such project meets air and water quality standards of the
Department of Environmental Protection...”85
Consequently, a 10 kW small wind system would be
exempt from Siting Council regulations for an electric generation facility. In addition, the Town of
Mansfield does not exercise jurisdiction over building improvements, such as for wind systems, installed
on UConn’s Storrs campuses.86
Environmental Impacts and Permitting
The operation of a 10 kW small wind system would not generate any air emissions, or wastewater
effluents; consequently, no air emission or wastewater discharge permits are required.
A 10 kW turbine is expected to generate as much as 55 decibels of sound, which is approximately the
same as a conversation between two people one meter apart.87,88
According to Connecticut DEEP
regulations (Sec. 22a-69-3.5 (b)), “No person in a Class B Noise Zone shall emit noise exceeding the
levels stated herein and applicable to adjacent Noise Zones:”.
84
Based on a range of the off-peak ozone and non-ozone seasons 85
Connecticut General Statutes, Sec. 16-50k 86
Personal communication with the Mansfield Department of Building and Housing Inspection and Mansfield Fire
Department 87
Canadian Centre for Occupational Health and Safety, “Noise – Basic Information,”
http://www.ccohs.ca/oshanswers/phys_agents/noise_basic.html, January 9, 2006 88
American Wind Energy Association, “Small Wind,”
http://archive.awea.org/smallwind/toolbox2/factsheet_public_safety.html, March 2012
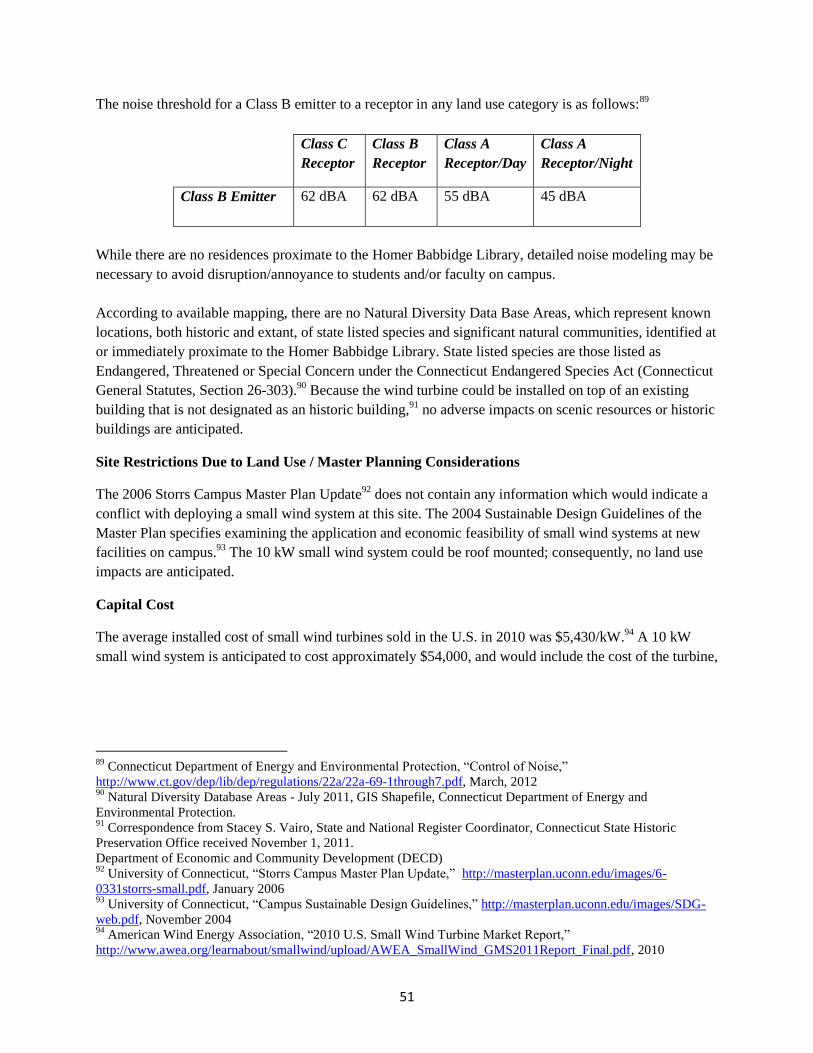
51
The noise threshold for a Class B emitter to a receptor in any land use category is as follows:89
Class C
Receptor
Class B
Receptor
Class A
Receptor/Day
Class A
Receptor/Night
Class B Emitter
62 dBA 62 dBA 55 dBA 45 dBA
While there are no residences proximate to the Homer Babbidge Library, detailed noise modeling may be
necessary to avoid disruption/annoyance to students and/or faculty on campus.
According to available mapping, there are no Natural Diversity Data Base Areas, which represent known
locations, both historic and extant, of state listed species and significant natural communities, identified at
or immediately proximate to the Homer Babbidge Library. State listed species are those listed as
Endangered, Threatened or Special Concern under the Connecticut Endangered Species Act (Connecticut
General Statutes, Section 26-303).90
Because the wind turbine could be installed on top of an existing
building that is not designated as an historic building,91
no adverse impacts on scenic resources or historic
buildings are anticipated.
Site Restrictions Due to Land Use / Master Planning Considerations
The 2006 Storrs Campus Master Plan Update92
does not contain any information which would indicate a
conflict with deploying a small wind system at this site. The 2004 Sustainable Design Guidelines of the
Master Plan specifies examining the application and economic feasibility of small wind systems at new
facilities on campus.93
The 10 kW small wind system could be roof mounted; consequently, no land use
impacts are anticipated.
Capital Cost
The average installed cost of small wind turbines sold in the U.S. in 2010 was $5,430/kW.94
A 10 kW
small wind system is anticipated to cost approximately $54,000, and would include the cost of the turbine,
89
Connecticut Department of Energy and Environmental Protection, “Control of Noise,”
http://www.ct.gov/dep/lib/dep/regulations/22a/22a-69-1through7.pdf, March, 2012 90
Natural Diversity Database Areas - July 2011, GIS Shapefile, Connecticut Department of Energy and
Environmental Protection. 91
Correspondence from Stacey S. Vairo, State and National Register Coordinator, Connecticut State Historic
Preservation Office received November 1, 2011.
Department of Economic and Community Development (DECD) 92
University of Connecticut, “Storrs Campus Master Plan Update,” http://masterplan.uconn.edu/images/6-
0331storrs-small.pdf, January 2006 93
University of Connecticut, “Campus Sustainable Design Guidelines,” http://masterplan.uconn.edu/images/SDG-
web.pdf, November 2004 94
American Wind Energy Association, “2010 U.S. Small Wind Turbine Market Report,”
http://www.awea.org/learnabout/smallwind/upload/AWEA_SmallWind_GMS2011Report_Final.pdf, 2010
52
inverter, guyed tower, tower wires, shipping, foundation and anchoring, wire run, turbine installation and
tower erection, electrical hook-up, and inspection fees. 95
Operation and Maintenance Cost
Maintenance for small wind systems at this scale is likely to cost between $200 and $700 per year.96
A
maintenance cost of $500 per year would equate to nine cents per kWh based on the expected output of a
10 kW small wind system at the main campus. This maintenance typically involves inspecting and
tightening bolts and electrical connections, inspecting the machines for corrosion and the guy wires for
tension, inspecting and replacing any worn leading edge tape on the turbine blades, replacing the turbine
and/or bearings after 10 years.97
A monitoring system could also be installed with a 10 kW small wind
system to measure system performance so that noticeable decreases in performance under similar
conditions can be identified.98
Economics and Funding
In general, recommended projects are configured as behind the meter applications with third party
ownership.99
This means that the electricity produced by the system would displace the retail value of
energy used in the building. For small wind systems funded through the ZREC program, a maximum
payment of 38.5 cents per kWh100
is possible for systems less than or equal to 100 kW. The economics of
grid connected renewable distributed generation systems providing wholesale power at this scale may be
prohibitive even with available incentives. As such, this approach is not recommended in this deployment
plan.
At present, small wind systems require substantial public funding to justify investment on a financial
basis. Capital grants, federal business investment tax credits, accelerated depreciation benefits, and a
production incentive are required to make a small wind system economically viable within the life of the
system. For the analyses detailed below, deployment is assumed to take place in 2012, thereby forfeiting
the 2011, 100 percent depreciation monetization benefit. Instead, a 50 percent first year bonus
depreciation monetization structure is assumed as provided under current law.101
Federal investment tax credits are currently available at 30 percent of the project cost and depreciation
benefits can be monetized by the developer. Hence, the project economics of a 10 kW small wind system
95
Bergey.com, “Retail Price List,” http://production-images.webapeel.com/bergey/assets/2012/3/6/98837/PriceList-
March.pdf, March 2012 96
American Wind Energy Association, “2010 U.S. Small Wind Turbine Market Report,”
http://www.awea.org/learnabout/smallwind/upload/AWEA_SmallWind_GMS2011Report_Final.pdf, 2010 97
U.S. DOE EERE, “Installing and Maintaining a Small Electric Wind System,”
http://www.energysavers.gov/your_home/electricity/index.cfm/mytopic=10990, February 9, 2011 98
California Energy Commission, “A Guide to Photovoltaic (PV) System Design and Installation,”
http://www.energy.ca.gov/reports/2001-09-04_500-01-020.PDF, June 2001 99
Projects on a master meter would fit this configuration as well 100
Public Act 11-80 Section 108 b specifies that systems less than 100 kW will receive “the weighted average
accepted bid price in the most recent solicitation for systems greater than one hundred kilowatts but less than two
hundred fifty kilowatts, plus an additional incentive of ten per cent.” As such, a ZREC incentive of $.35/kWh is
assumed plus an additional incentive of 10 percent of $.35/kWh. 101
Dsireusa.org, “Modified Accelerated Cost-Recovery System (MACRS) + Bonus Depreciation (2008 – 2012),”
http://dsireusa.org/incentives/incentive.cfm?Incentive_Code=US06F&re=1&ee=1, October 14,2011

53
would clearly be more attractive if it were developed by a third party developer capable of garnering all of
the available tax credits and depreciation benefits associated with renewable energy projects.
Pro Forma Analysis of Grant Funding for Financial Feasibility
A 10 kW small wind system installed at the Homer Babbidge Library would not achieve a financial
payback within the projected life of the system. The primary driver is the initial cost of the system and the
lack of sufficient wind resources in the area. Estimates of system yields at a hub height of approximately
30 meters above ground level indicate that the system would have a capacity factor of approximately six
percent. However, a 10 kW small wind system could achieve a four year financial payback, an internal
rate of return of 10 percent, and a net present value of $3,212 with a capital grant of $23,000,102
an
installed cost of $5.43 per watt, a ZREC of $0.385/kWh for fifteen years, a discount rate of seven percent,
and receipt of all applicable tax credits and depreciation benefits.
Site Orientation and generation loads
The small wind turbine system could be mounted on the roof of the Homer Babbidge Library. The top of
the Homer Babbidge Library is taller than any adjacent building or vegetation; consequently, no
obstruction of wind resources is anticipated.
A 10 kW small wind turbine system at Homer Babbidge Library could produce 5,305 kWh/year with an
estimated capacity factor of six percent. The potential site on UConn’s main campus utilizes energy
produced by a cogeneration system; consequently, actual system economics may be more challenging
because UConn’s avoided electric utility cost is most likely lower than it would be if it purchased power
from the grid. Because of the relatively small amount of electricity produced and the variable and
intermittent nature of wind resources through the day and year, it is not anticipated that the operation of a
10 kW small wind turbine system would adversely impact the operation of the University’s cogeneration
facility.
102
Assumes an installed cost of $5.43 per watt or $54,300, a ZREC of $0.385/kWh for fifteen years, a discount rate
of seven percent, and receipt of all applicable tax credits and depreciation benefits.
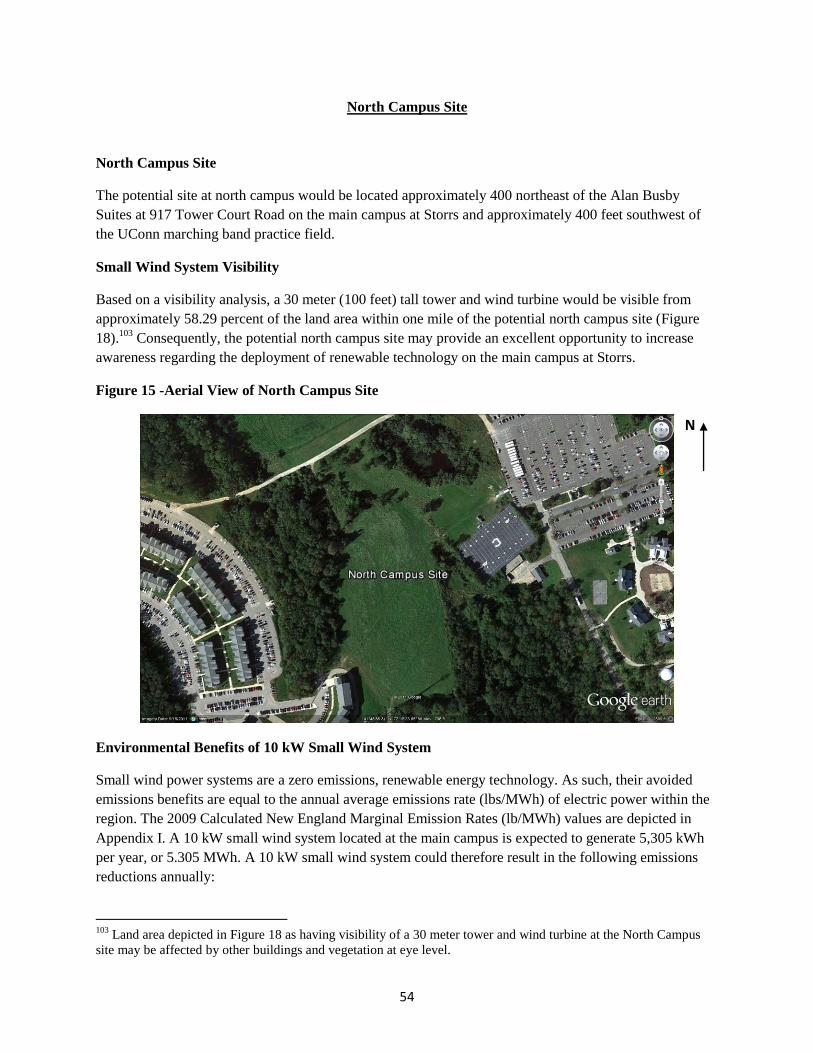
54
North Campus Site
North Campus Site
The potential site at north campus would be located approximately 400 northeast of the Alan Busby
Suites at 917 Tower Court Road on the main campus at Storrs and approximately 400 feet southwest of
the UConn marching band practice field.
Small Wind System Visibility
Based on a visibility analysis, a 30 meter (100 feet) tall tower and wind turbine would be visible from
approximately 58.29 percent of the land area within one mile of the potential north campus site (Figure
18).103
Consequently, the potential north campus site may provide an excellent opportunity to increase
awareness regarding the deployment of renewable technology on the main campus at Storrs.
Figure 15 -Aerial View of North Campus Site
Environmental Benefits of 10 kW Small Wind System
Small wind power systems are a zero emissions, renewable energy technology. As such, their avoided
emissions benefits are equal to the annual average emissions rate (lbs/MWh) of electric power within the
region. The 2009 Calculated New England Marginal Emission Rates (lb/MWh) values are depicted in
Appendix I. A 10 kW small wind system located at the main campus is expected to generate 5,305 kWh
per year, or 5.305 MWh. A 10 kW small wind system could therefore result in the following emissions
reductions annually:
103
Land area depicted in Figure 18 as having visibility of a 30 meter tower and wind turbine at the North Campus
site may be affected by other buildings and vegetation at eye level.
N
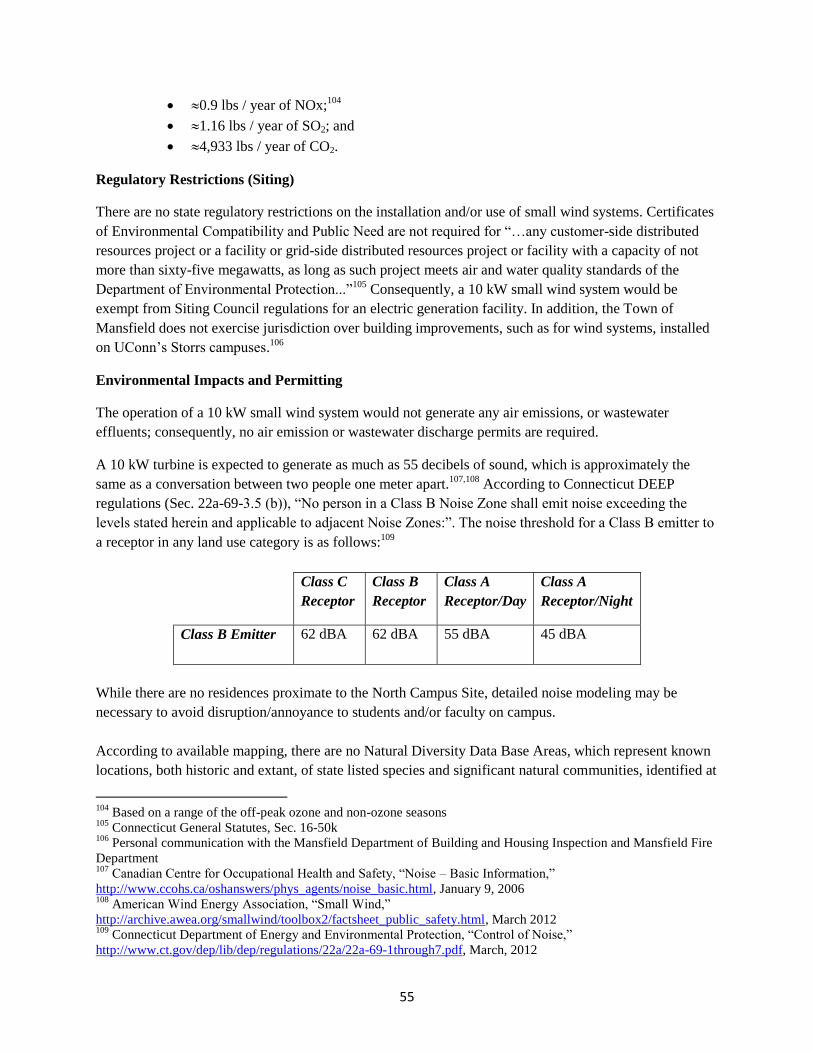
55
0.9 lbs / year of NOx;104
1.16 lbs / year of SO2; and
4,933 lbs / year of CO2.
Regulatory Restrictions (Siting)
There are no state regulatory restrictions on the installation and/or use of small wind systems. Certificates
of Environmental Compatibility and Public Need are not required for “…any customer-side distributed
resources project or a facility or grid-side distributed resources project or facility with a capacity of not
more than sixty-five megawatts, as long as such project meets air and water quality standards of the
Department of Environmental Protection...”105
Consequently, a 10 kW small wind system would be
exempt from Siting Council regulations for an electric generation facility. In addition, the Town of
Mansfield does not exercise jurisdiction over building improvements, such as for wind systems, installed
on UConn’s Storrs campuses.106
Environmental Impacts and Permitting
The operation of a 10 kW small wind system would not generate any air emissions, or wastewater
effluents; consequently, no air emission or wastewater discharge permits are required.
A 10 kW turbine is expected to generate as much as 55 decibels of sound, which is approximately the
same as a conversation between two people one meter apart.107,108
According to Connecticut DEEP
regulations (Sec. 22a-69-3.5 (b)), “No person in a Class B Noise Zone shall emit noise exceeding the
levels stated herein and applicable to adjacent Noise Zones:”. The noise threshold for a Class B emitter to
a receptor in any land use category is as follows:109
Class C
Receptor
Class B
Receptor
Class A
Receptor/Day
Class A
Receptor/Night
Class B Emitter
62 dBA 62 dBA 55 dBA 45 dBA
While there are no residences proximate to the North Campus Site, detailed noise modeling may be
necessary to avoid disruption/annoyance to students and/or faculty on campus.
According to available mapping, there are no Natural Diversity Data Base Areas, which represent known
locations, both historic and extant, of state listed species and significant natural communities, identified at
104
Based on a range of the off-peak ozone and non-ozone seasons 105
Connecticut General Statutes, Sec. 16-50k 106
Personal communication with the Mansfield Department of Building and Housing Inspection and Mansfield Fire
Department 107
Canadian Centre for Occupational Health and Safety, “Noise – Basic Information,”
http://www.ccohs.ca/oshanswers/phys_agents/noise_basic.html, January 9, 2006 108
American Wind Energy Association, “Small Wind,”
http://archive.awea.org/smallwind/toolbox2/factsheet_public_safety.html, March 2012 109
Connecticut Department of Energy and Environmental Protection, “Control of Noise,”
http://www.ct.gov/dep/lib/dep/regulations/22a/22a-69-1through7.pdf, March, 2012

56
or immediately proximate to the North Campus site. State listed species are those listed as Endangered,
Threatened or Special Concern under the Connecticut Endangered Species Act (Connecticut General
Statutes, Section 26-303).110
According to available mapping and information, there are no inland wetland soils, defined as "Any of the
soil types designated as poorly drained, very poorly drained, alluvial, and floodplain by the National
Cooperative Soil Survey, as may be amended from time to time, of the Natural Resources Conservation
Service of the United States Department of Agriculture" at the potential north campus site.111
The potential north campus site is located in a cleared field, which has been used for agricultural
production. The potential north campus site is located approximately 300 feet west of an 327-foot tower
and an 80-foot tower, earth station dishes, and telecommunications shelters. 112
Because the wind turbine
could be installed proximate to existing tower structures and there are no designated historic buildings
on/near the potential north campus site, no adverse impacts on scenic resources or historic buildings are
anticipated.
Site Restrictions Due to Land Use / Master Planning Considerations
The 2006 Storrs Campus Master Plan Update113
does not contain any information which would indicate a
conflict with deploying a small wind system at this site. The 2004 Sustainable Design Guidelines of the
Master Plan specifies examining the application and economic feasibility of small wind systems at new
facilities on campus.114
The 10 kW small wind system could be deployed in an open field at the North
Campus site; consequently, some open space could be unavailable for future development at or near the
wind system site.
Capital Cost
The average installed cost of small wind turbines sold in the U.S. in 2010 was $5,430/kW.115
A 10 kW
small wind system at the North Campus site is anticipated to cost approximately $54,000, and would
include the cost of the turbine, inverter, guyed tower, tower wires, shipping, foundation and anchoring,
wire run, turbine installation and tower erection, electrical hook-up, and inspection fees. 116
110
Natural Diversity Database Areas - July 2011, GIS Shapefile, Connecticut Department of Energy and
Environmental Protection. 111
Inland Wetland Soils; GIS Shapefile, Connecticut Department of Energy and Environmental Protection. The
original data was collected from published surveys from 1962 to 1981, field mapping from 1985 through 2001 and
additional attribute documentation to 3/23/2007. GIS Shapefile, Connecticut Department of Energy and
Environmental Protection. Wetlands/Watercourses/Waterbodies Map, Town of Mansfield Plan of Conservation and
Development, April 2006. 112
Docket 179 - Findings of Fact, Connecticut Siting Council, November 19, 1997. 113
University of Connecticut, “Storrs Campus Master Plan Update,” http://masterplan.uconn.edu/images/6-
0331storrs-small.pdf, January 2006 114
University of Connecticut, “Campus Sustainable Design Guidelines,” http://masterplan.uconn.edu/images/SDG-
web.pdf, November 2004 115
American Wind Energy Association, “2010 U.S. Small Wind Turbine Market Report,”
http://www.awea.org/learnabout/smallwind/upload/AWEA_SmallWind_GMS2011Report_Final.pdf, 2010 116
Bergey.com, “Retail Price List,” http://production-images.webapeel.com/bergey/assets/2012/3/6/98837/PriceList-
March.pdf, March 2012
57
Operation and Maintenance Cost
Maintenance for small wind systems at this scale is likely to cost between $200 and $700 per year.117
A
maintenance cost of $500 per year would equate to nine cents per kWh based on the expected output of a
10 kW small wind system at the main campus. This maintenance typically involves inspecting and
tightening bolts and electrical connections, inspecting the machines for corrosion and the guy wires for
tension, inspecting and replacing any worn leading edge tape on the turbine blades, replacing the turbine
and/or bearings after 10 years.118
A monitoring system could also be installed with a 10 kW small wind
system to measure system performance so that noticeable decreases in performance under similar
conditions can be identified.119
Economics and Funding
In general, recommended projects are configured as behind the meter applications with third party
ownership.120
This means that the electricity produced by the system would displace the retail value of
energy used in the building. For small wind systems funded through the ZREC program, a maximum
payment of 38.5 cents per kWh121
is possible for systems less than or equal to 100 kW. The economics of
grid connected renewable distributed generation systems providing wholesale power at this scale may be
prohibitive even with available incentives. As such, this approach is not recommended in this deployment
plan.
At present, small wind systems require substantial public funding to justify investment on a financial
basis. Capital grants, federal business investment tax credits, accelerated depreciation benefits, and a
production incentive are required to make a small wind system economically viable within the life of the
system. For the analyses detailed below, deployment is assumed to take place in 2012, thereby forfeiting
the 2011, 100 percent depreciation monetization benefit. Instead, a 50 percent first year bonus
depreciation monetization structure is assumed as provided under current law.122
Federal investment tax credits are currently available at 30 percent of the project cost and depreciation
benefits can be monetized by the developer. Hence, the project economics of a 10 kW small wind system
would clearly be more attractive if it were developed by a third party developer capable of garnering all of
the available tax credits and depreciation benefits associated with renewable energy projects.
117
American Wind Energy Association, “2010 U.S. Small Wind Turbine Market Report,”
http://www.awea.org/learnabout/smallwind/upload/AWEA_SmallWind_GMS2011Report_Final.pdf, 2010 118
U.S. DOE EERE, Installing and Maintaining a Small Electric Wind System,”
http://www.energysavers.gov/your_home/electricity/index.cfm/mytopic=10990, February 9, 2011 119
California Energy Commission, “A Guide to Photovoltaic (PV) System Design and Installation,”
http://www.energy.ca.gov/reports/2001-09-04_500-01-020.PDF, June 2001 120
Projects on a master meter would fit this configuration as well 121
Public Act 11-80 Section 108 b specifies that systems less than 100 kW will receive “the weighted average
accepted bid price in the most recent solicitation for systems greater than one hundred kilowatts but less than two
hundred fifty kilowatts, plus an additional incentive of ten per cent.” As such, a ZREC incentive of $.35/kWh is
assumed plus an additional incentive of 10 percent of $.35/kWh. 122
Dsireusa.org, “Modified Accelerated Cost-Recovery System (MACRS) + Bonus Depreciation (2008 – 2012),”
http://dsireusa.org/incentives/incentive.cfm?Incentive_Code=US06F&re=1&ee=1, October 14,2011

58
Analysis of Grant Funding for Financial Feasibility
A 10 kW small wind system installed at the North Hillside site would not achieve a financial payback
within the projected life of the system. The primary driver is the initial cost of the system and the lack of
sufficient wind resources in the area. Estimates of system yields at a hub height of 30 meters above
ground level indicate that the system would have a capacity factor of approximately six percent.
However, a 10 kW small wind system could achieve a four year financial payback, an internal rate of
return of 10 percent, and a net present value of $3,212 with a capital grant of $23,000.123
Site Orientation and Generation Loads
Although the potential north campus site is high in elevation relative to the adjacent land and is used for
agricultural production, adjacent vegetation may impact available wind resources. It is recommended that
wind monitoring equipment be deployed at the potential north campus site prior to undertaking
development of the 30 meter tower and 10 kW small wind turbine system to confirm the wind resources
in the area.
A 10 kW small wind turbine system at the potential north campus site could produce 5,305 kWh/year
with an estimated capacity factor of six percent. The electricity produced by the 10 kW small wind
turbine system could be integrated with the electricity produced by the University’s cogeneration system;
consequently, actual system economics may be more challenging because UConn’s avoided electric
utility cost is most likely lower than it would be if it purchased power from the grid. Because of the
relatively small amount of electricity produced and the variable and intermittent nature of wind resources
through the day and year, it is not anticipated that the operation of a 10 kW small wind turbine system
would adversely impact the operation of the University’s cogeneration facility.
123
Assumes an installed cost of $5.43 per watt or $54,300, a ZREC of $0.385/kWh for fifteen years, a discount rate
of seven percent, and receipt of all applicable tax credits and depreciation benefits.
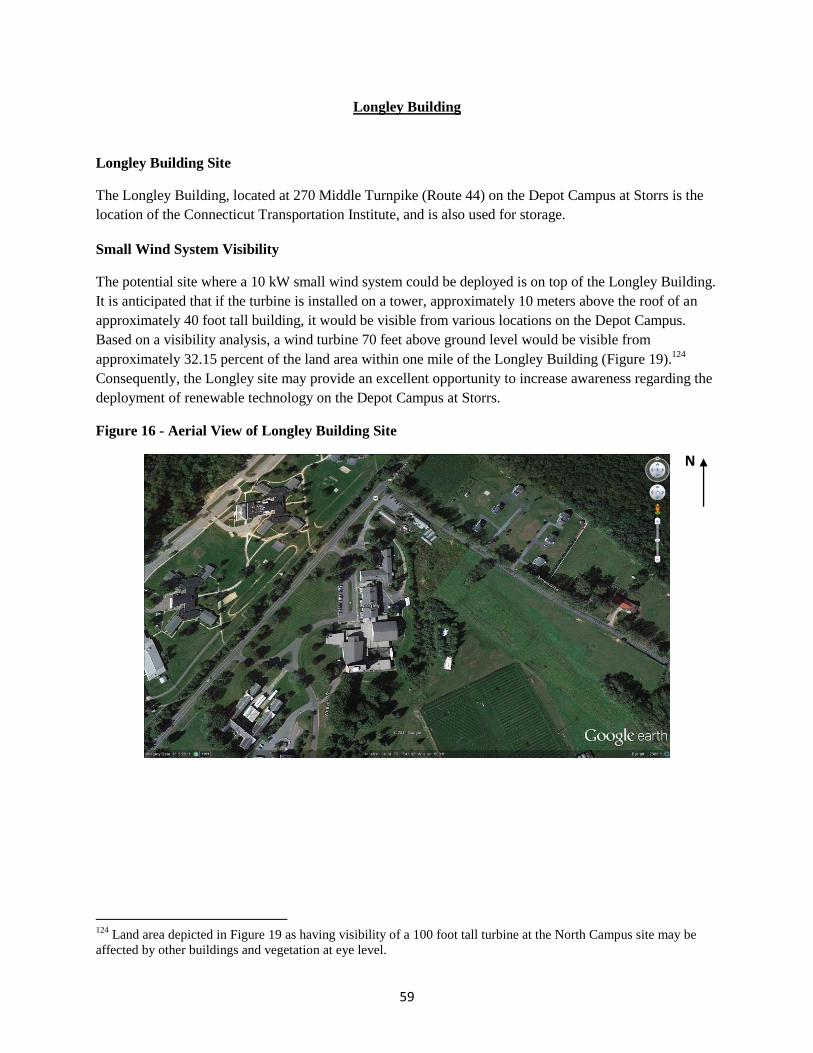
59
Longley Building
Longley Building Site
The Longley Building, located at 270 Middle Turnpike (Route 44) on the Depot Campus at Storrs is the
location of the Connecticut Transportation Institute, and is also used for storage.
Small Wind System Visibility
The potential site where a 10 kW small wind system could be deployed is on top of the Longley Building.
It is anticipated that if the turbine is installed on a tower, approximately 10 meters above the roof of an
approximately 40 foot tall building, it would be visible from various locations on the Depot Campus.
Based on a visibility analysis, a wind turbine 70 feet above ground level would be visible from
approximately 32.15 percent of the land area within one mile of the Longley Building (Figure 19).124
Consequently, the Longley site may provide an excellent opportunity to increase awareness regarding the
deployment of renewable technology on the Depot Campus at Storrs.
Figure 16 - Aerial View of Longley Building Site
124
Land area depicted in Figure 19 as having visibility of a 100 foot tall turbine at the North Campus site may be
affected by other buildings and vegetation at eye level.
N

60
Environmental Benefits of a 10 kW Small Wind System
Small wind power systems are a zero emissions, renewable energy technology. As such, their avoided
emissions benefits are equal to the annual average emissions rate (lbs/MWh) of electric power within the
region. The 2009 Calculated New England Marginal Emission Rates (lb/MWh) values are depicted in
Appendix I. A 10 kW small wind system located at the Depot Campus is expected to generate 5,305 kWh
per year, or 5.305 MWh. A 10 kW small wind system could therefore result in the following emissions
reductions annually:
0.9 lbs / year of NOx;125
1.16 lbs / year of SO2; and
4,933 lbs / year of CO2.
Regulatory Restrictions (Siting)
There are no state regulatory restrictions on the installation and/or use of small wind systems. Certificates
of Environmental Compatibility and Public Need are not required for “…any customer-side distributed
resources project or a facility or grid-side distributed resources project or facility with a capacity of not
more than sixty-five megawatts, as long as such project meets air and water quality standards of the
Department of Environmental Protection...”126
Consequently, a 10 kW small wind system would be
exempt from Siting Council regulations for an electric generation facility. In addition, the Town of
Mansfield does not exercise jurisdiction over building improvements, such as for wind systems, installed
on UConn’s Storrs campuses127
Environmental Impacts and Permitting
The operation of a 10 kW small wind system would not generate any air emissions, or wastewater
effluents; consequently, no air emission or wastewater discharge permits are required.
A 10 kW turbine is expected to generate as much as 55 decibels of sound, which is approximately the
same as a conversation between two people one meter apart.128,129
According to Connecticut DEEP
regulations (Sec. 22a-69-3.5 (b)), “No person in a Class B Noise Zone shall emit noise exceeding the
levels stated herein and applicable to adjacent Noise Zones:”.
125
Based on a range of the off-peak ozone and non-ozone seasons 126
Connecticut General Statutes, Sec. 16-50k 127
Personal communication with the Mansfield Department of Building and Housing Inspection and Mansfield Fire
Department 128
Canadian Centre for Occupational Health and Safety, “Noise – Basic Information,”
http://www.ccohs.ca/oshanswers/phys_agents/noise_basic.html, January 9, 2006 129
American Wind Energy Association, “Small Wind,”
http://archive.awea.org/smallwind/toolbox2/factsheet_public_safety.html, March 2012
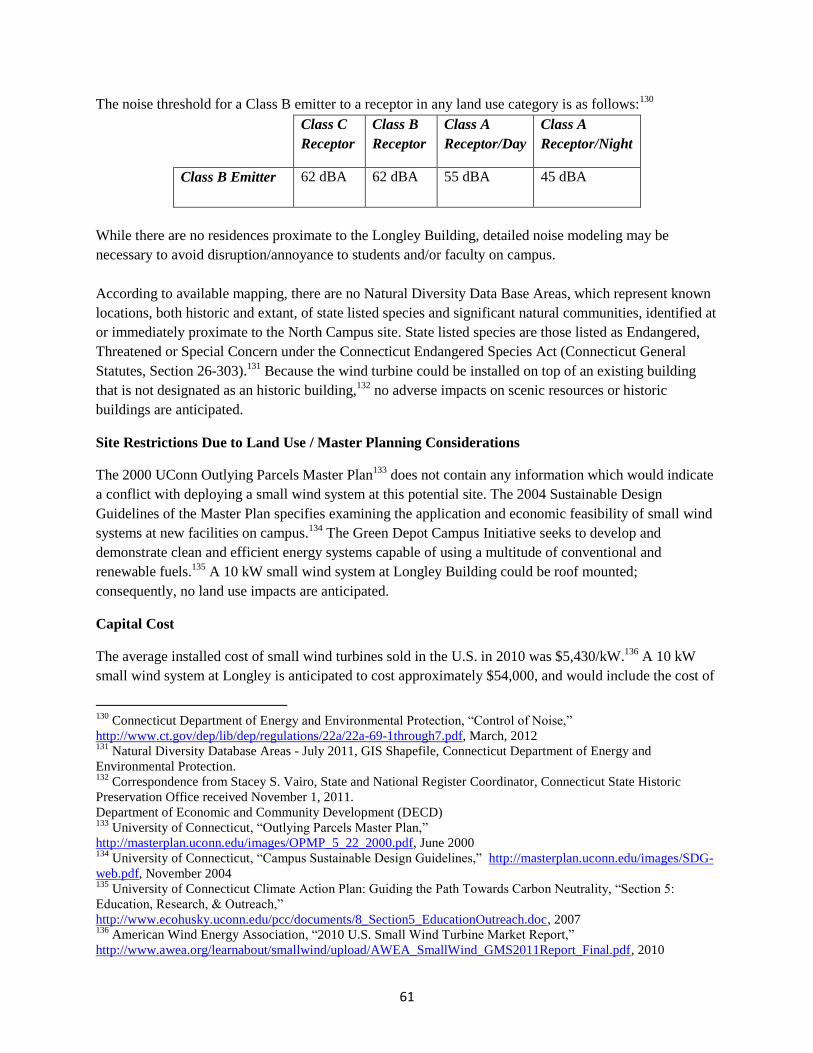
61
The noise threshold for a Class B emitter to a receptor in any land use category is as follows:130
Class C
Receptor
Class B
Receptor
Class A
Receptor/Day
Class A
Receptor/Night
Class B Emitter
62 dBA 62 dBA 55 dBA 45 dBA
While there are no residences proximate to the Longley Building, detailed noise modeling may be
necessary to avoid disruption/annoyance to students and/or faculty on campus.
According to available mapping, there are no Natural Diversity Data Base Areas, which represent known
locations, both historic and extant, of state listed species and significant natural communities, identified at
or immediately proximate to the North Campus site. State listed species are those listed as Endangered,
Threatened or Special Concern under the Connecticut Endangered Species Act (Connecticut General
Statutes, Section 26-303).131
Because the wind turbine could be installed on top of an existing building
that is not designated as an historic building,132
no adverse impacts on scenic resources or historic
buildings are anticipated.
Site Restrictions Due to Land Use / Master Planning Considerations
The 2000 UConn Outlying Parcels Master Plan133
does not contain any information which would indicate
a conflict with deploying a small wind system at this potential site. The 2004 Sustainable Design
Guidelines of the Master Plan specifies examining the application and economic feasibility of small wind
systems at new facilities on campus.134
The Green Depot Campus Initiative seeks to develop and
demonstrate clean and efficient energy systems capable of using a multitude of conventional and
renewable fuels.135
A 10 kW small wind system at Longley Building could be roof mounted;
consequently, no land use impacts are anticipated.
Capital Cost
The average installed cost of small wind turbines sold in the U.S. in 2010 was $5,430/kW.136
A 10 kW
small wind system at Longley is anticipated to cost approximately $54,000, and would include the cost of
130
Connecticut Department of Energy and Environmental Protection, “Control of Noise,”
http://www.ct.gov/dep/lib/dep/regulations/22a/22a-69-1through7.pdf, March, 2012 131
Natural Diversity Database Areas - July 2011, GIS Shapefile, Connecticut Department of Energy and
Environmental Protection. 132
Correspondence from Stacey S. Vairo, State and National Register Coordinator, Connecticut State Historic
Preservation Office received November 1, 2011.
Department of Economic and Community Development (DECD) 133
University of Connecticut, “Outlying Parcels Master Plan,”
http://masterplan.uconn.edu/images/OPMP_5_22_2000.pdf, June 2000 134
University of Connecticut, “Campus Sustainable Design Guidelines,” http://masterplan.uconn.edu/images/SDG-
web.pdf, November 2004 135
University of Connecticut Climate Action Plan: Guiding the Path Towards Carbon Neutrality, “Section 5:
Education, Research, & Outreach,”
http://www.ecohusky.uconn.edu/pcc/documents/8_Section5_EducationOutreach.doc, 2007 136
American Wind Energy Association, “2010 U.S. Small Wind Turbine Market Report,”
http://www.awea.org/learnabout/smallwind/upload/AWEA_SmallWind_GMS2011Report_Final.pdf, 2010

62
the turbine, inverter, guyed tower, tower wires, shipping, foundation and anchoring, wire run, turbine
installation and tower erection, electrical hook-up, and inspection fees.137
Operation and Maintenance Cost
Maintenance for small wind systems at this scale is likely to cost between $200 and $700 per year.138
A
maintenance cost of $500 per year would equate to nine cents per kWh based on the expected output of a
10 kW small wind system at the Depot campus. This maintenance typically involves inspecting and
tightening bolts and electrical connections, inspecting the machines for corrosion and the guy wires for
tension, inspecting and replacing any worn leading edge tape on the turbine blades, replacing the turbine
and/or bearings after 10 years.139
A monitoring system could also be installed with a 10 kW small wind
system to measure system performance so that noticeable decreases in performance under similar
conditions can be identified.140
Economics and Funding
In general, recommended projects are configured as behind the meter applications with third party
ownership.141
This means that the electricity produced by the system would displace the retail value of
energy used in the building. For small wind systems funded through the zero emission renewable energy
credit (ZREC) program, a maximum payment of 38.5 cents per kWh142
is possible for systems less than or
equal to 100 kW. The economics of grid connected renewable distributed generation systems providing
wholesale power at this scale may be prohibitive even with available incentives. As such, this approach is
not recommended in this deployment plan.
At present, small wind systems require substantial public funding to justify investment on a financial
basis. Capital grants, federal business investment tax credits, accelerated depreciation benefits, and a
production incentive are required to make a small wind system economically viable within the life of the
system. For the analyses detailed below, deployment is assumed to take place in 2012, thereby forfeiting
the 2011, 100 percent accelerated depreciation monetization benefit. Instead, a 50 percent first year bonus
depreciation monetization structure is assumed as provided under current law.143
Federal investment tax credits are currently available at 30 percent of the project cost and depreciation
benefits can be monetized by the developer. Hence, the project economics of a 10 kW small wind system
137
Bergey.com, “Retail Price List,” http://production-images.webapeel.com/bergey/assets/2012/3/6/98837/PriceList-
March.pdf, March 2012 138
American Wind Energy Association, “2010 U.S. Small Wind Turbine Market Report,”
http://www.awea.org/learnabout/smallwind/upload/AWEA_SmallWind_GMS2011Report_Final.pdf, 2010 139
U.S. DOE EERE, “Installing and Maintaining a Small Electric Wind System,”
http://www.energysavers.gov/your_home/electricity/index.cfm/mytopic=10990, February 9, 2011 140
California Energy Commission, “A Guide to Photovoltaic (PV) System Design and Installation,”
http://www.energy.ca.gov/reports/2001-09-04_500-01-020.PDF, June 2001 141
Projects on a master meter would fit this configuration as well 142
Public Act 11-80 Section 108 b specifies that systems less than 100 kW will receive “the weighted average
accepted bid price in the most recent solicitation for systems greater than one hundred kilowatts but less than two
hundred fifty kilowatts, plus an additional incentive of ten per cent.” As such, a ZREC incentive of $.35/kWh is
assumed plus an additional incentive of 10 percent of $.35/kWh. 143
Dsireusa.org, “Modified Accelerated Cost-Recovery System (MACRS) + Bonus Depreciation (2008 – 2012),”
http://dsireusa.org/incentives/incentive.cfm?Incentive_Code=US06F&re=1&ee=1, October 14,2011

63
would clearly be more attractive if it were developed by a third party developer capable of garnering all of
the available tax credits and depreciation benefits associated with renewable energy projects.
Analysis of Grant Funding for Financial Feasibility
A 10 kW small wind system installed at the Longley building would not achieve a financial payback
within the projected life of the system. The primary driver is the initial cost of the system and the lack of
sufficient wind resources in the area. Estimates of system yields at a hub height of 30 meters above
ground level indicate that the system would have a capacity factor of approximately six percent.
However, a 10 kW small wind system could achieve a four year financial payback, an internal rate of
return of 11 percent, and a net present value of $4,621 with a capital grant of $23,000.144
Site Orientation and Generation Loads
A 10 kW small wind turbine system could be mounted on the roof of the Longley Building. The wind
turbine top of the Longley Building is taller than any adjacent building or vegetation; consequently, no
obstruction of wind resources is anticipated.
The Longley Building is served by a single utility service from Connecticut Light and Power through a
master meter for the whole Depot Campus. It is estimated that the Longley Building consumes a total of
approximately 440,000 kWh annually. A 10 kW small wind turbine system at the Longley Building could
produce 5,305 kWh/year, with an estimated capacity factor of six percent, and provide approximately 1.2
percent of the Longley Building’s electrical requirements. This potential deployment site was also
assessed in the Preliminary Feasibility Study and Strategic Plan for the Depot Campus.
144
Assumes an installed cost of $5.43 per watt or $54,300, a ZREC of $0.385/kWh for fifteen years, a discount rate
of seven percent, and receipt of all applicable tax credits and depreciation benefits.

64
Figure 17 – Visibility Analysis for a Small Wind System at the Homer Babbidge Library
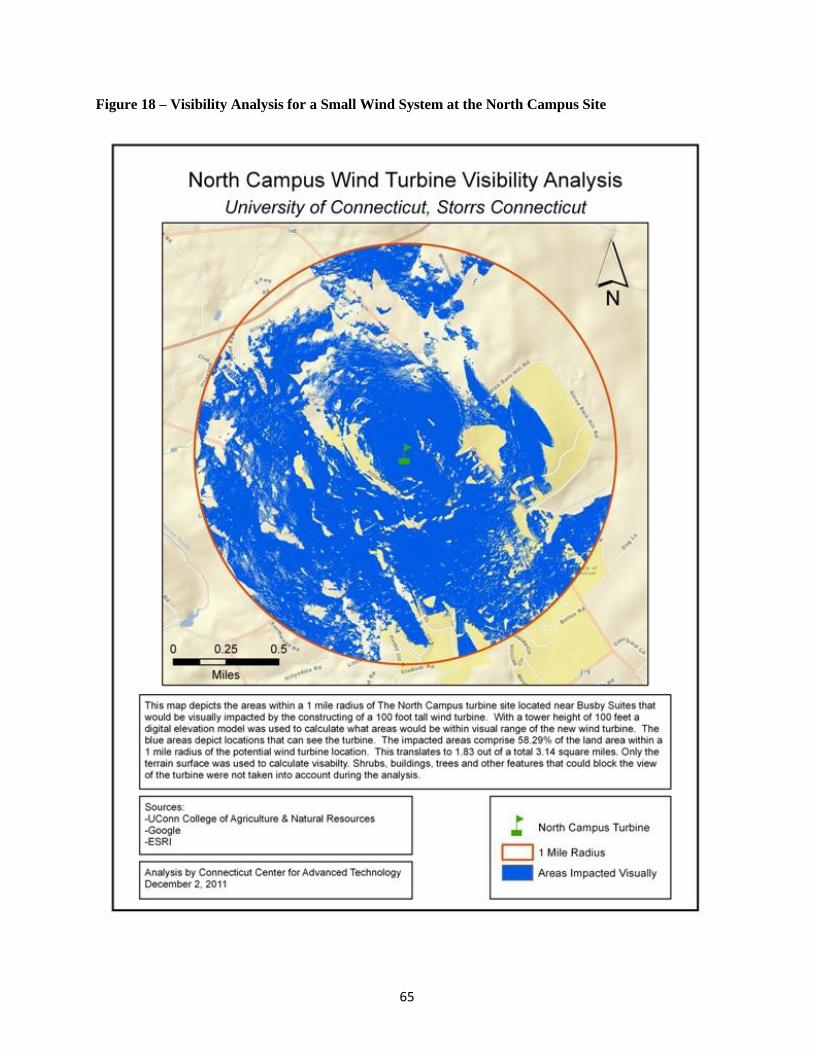
65
Figure 18 – Visibility Analysis for a Small Wind System at the North Campus Site

66
Figure 19 - Visibility Analysis for a Small Wind System at the Longley Building Site

67
GEOTHERMAL
Geothermal heat pumps are used for space heating and cooling as well as water heating. Geothermal heat
pump systems utilize the naturally occurring thermal energy from the ground in order to provide heating
and cooling to buildings. Heat pump systems offer individual space temperature controls and work best
for systems with multiple zones. Heat pump systems also fit well into systems with a dedicated outside
air system (DOAS) with a conventional heat source because heat pumps often do not provide a high
enough temperature rise to meet indoor requirements.
Figure 20 - Geothermal Heat Pump System145
There are two basic types of geothermal heat pump systems closed loop and open loop systems. Closed
loop systems use water or an antifreeze solution that
is circulated through plastic pipes typically beneath
the earth’s surface. Open loop systems typically use
well or surface water as the heat exchange fluid that
circulates directly through the heat pump system and
then the water returns to the ground through the well
or surface discharge. The use of existing wells may
provide an opportunity for the supply of thermal
energy without the added costs associated with well
installation. At this time, commercial heat exchange
products that extract or expel thermal energy from/to
existing well water infrastructure are not well
developed, but this application may represent an
opportunity for selected development using faculty
resources. 146
147
General criteria to consider when evaluating potential buildings/areas for the installation of geothermal
heat pump systems include:
Sites that utilize boilers/furnaces to provide thermal energy; and
Buildings that have significant cooling loads and are not served by the existing “chill” loop,
or sites with or near equipment used for absorption chilling, or sites that have chilled water
cooling.
145
Connecticut Clean Energy Fund, “Geothermal Heat Pump Incentive Program – Commercial,”
www.ctcleanenergy.com/YourBusinessorInstitution/GeothermalIncentiveProgramCommercial/tabid/521/Default.asp
x, march 2012 146
International Ground Source Heat Pump Association, “What is Geothermal,”
www.igshpa.okstate.edu/geothermal/geothermal.htm, March 2012 147
U.S. DOE EERE, “Types of Geothermal Heat Pump Systems,”
www.energysavers.gov/your_home/space_heating_cooling/index.cfm/mytopic=12650, February 9, 2011

68
Geothermal Related Research
UConn has the capacity to undertake research related to geothermal efficiency, use of heat transfer, and
performance. This research would be consistent with on-site demonstration and operation to improve
opportunities for technology commercialization, student education, and public outreach.
Gary A. Robbins, Professor of Geology, Department of Natural Resources and the Environment, is
interested in the use of geothermal technology as 1) a teaching aid for a number of water-related courses
in Geosciences, Natural Resources, and Engineering; and 2) to undertake research on improving the
efficiency of geothermal systems, including convection. Further, Professor Robbins may seek to construct
monitoring wells near heat exchange borings, heat exchange borings that can accommodate alternative
designs. A demonstration scale geothermal system would support Professor Robbins’ outreach programs
for the public on the workings and advantages of geothermal systems.
A summary of potential sites selected for detailed analysis is as follows:
Table 6 – Summary of Geothermal System Analyses
Building Calculated
Annual Energy
Consumption
(Natural Gas
Only) (MMBtu)
Potential
Renewable
Energy
Generation
Capacity
(Tons)
Potential
Annual
Renewable
Energy
Production
(MMBtu)
Potential Net
Annual
Reductions of
CO2
Emissions
(lbs)
Percent of Floor
Area Served by
Potential
Renewable
Energy System
Thompson Hall
(Depot)
3,087 40 1,017 60,875 41%
Horsebarn Hill
Sciences Complex
Building #4 Annex
4,020 3.1 106 5,200 3.3%
Total: 7,107 MMBtu 1,123 MMBtu 54,900
lbs/year
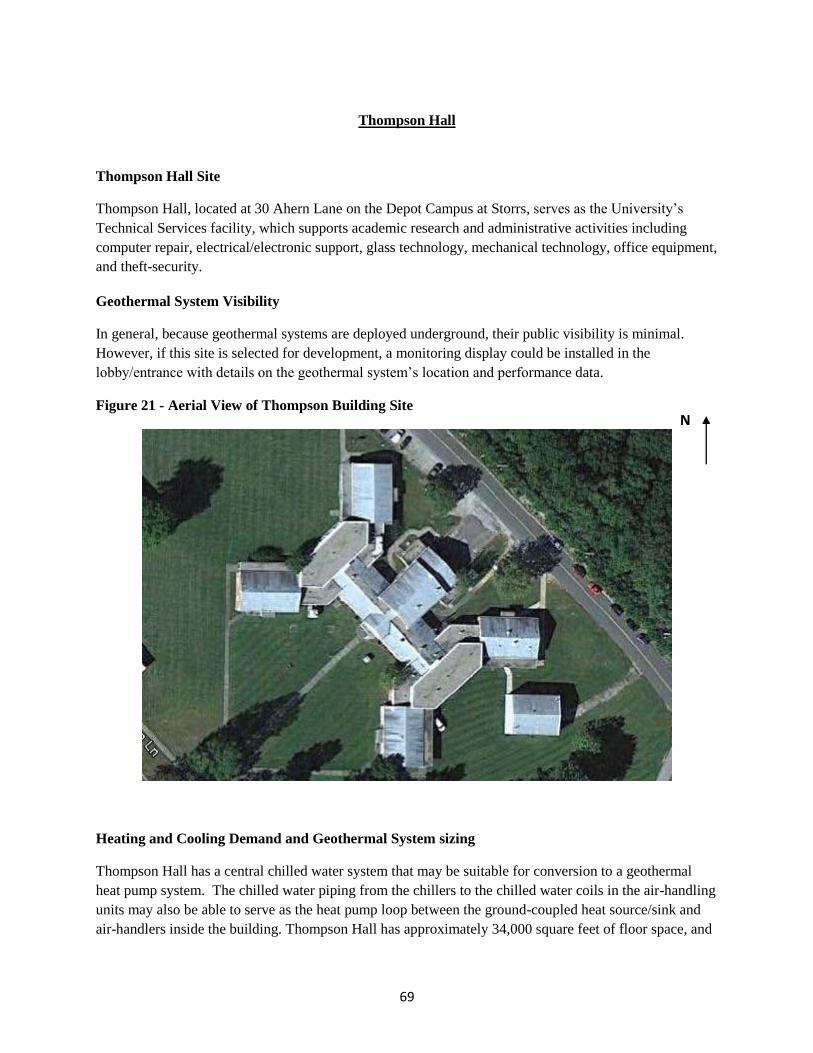
69
Thompson Hall
Thompson Hall Site
Thompson Hall, located at 30 Ahern Lane on the Depot Campus at Storrs, serves as the University’s
Technical Services facility, which supports academic research and administrative activities including
computer repair, electrical/electronic support, glass technology, mechanical technology, office equipment,
and theft-security.
Geothermal System Visibility
In general, because geothermal systems are deployed underground, their public visibility is minimal.
However, if this site is selected for development, a monitoring display could be installed in the
lobby/entrance with details on the geothermal system’s location and performance data.
Figure 21 - Aerial View of Thompson Building Site
Heating and Cooling Demand and Geothermal System sizing
Thompson Hall has a central chilled water system that may be suitable for conversion to a geothermal
heat pump system. The chilled water piping from the chillers to the chilled water coils in the air-handling
units may also be able to serve as the heat pump loop between the ground-coupled heat source/sink and
air-handlers inside the building. Thompson Hall has approximately 34,000 square feet of floor space, and
N

70
is currently served by two natural gas fired hot water heaters, a dual fuel boiler (natural gas and oil), and a
40 ton chiller.
The capacity of a geothermal system designed to serve the equivalent of a 40 ton chiller will produce
480,000 Btu per hour. In 2010, Thompson Hall consumed approximately 3,087 MMBtu of natural gas for
heating and domestic hot water. A 40 ton geothermal system at approximately 480,000 Btu per hour
could provide heat to approximately 14,000 square feet or 41 percent of Thompson Hall.148
Assuming a
combustion efficiency of 80 percent for the existing boilers and a coefficient of performance (COP) of
4.0, approximately 1,017 MMBtu of natural gas would be displaced by approximately 74,500 kWh of
electricity.
Assuming 100 percent of the cooling load is served by a 40 ton geothermal system and a COP of 4.0, the annual
electrical consumption for cooling would be reduced from approximately 48,220 kWh to approximately 36,165
kWh per year, for an annual savings of approximately 12,000 kWh per year.
Environmental Benefits of a Geothermal Heat Pump System
As detailed above, a geothermal system would increase electricity consumption and reduce natural gas
consumption during heating periods, and decrease electricity consumption during periods that require
cooling. The 2009 Calculated New England Marginal Emission Rates (lb/MWh) values are detailed in
Appendix I.
The geothermal system located at Thompson Hall is expected to have the following emissions
characteristics:
An increase of 62.5 MWh of electricity consumption for the geothermal system would result in an
increase of the following emissions annually:
o 10.6 lbs of NOx;
o 13.8 lbs of SO2; and
o 58,125 lbs of CO2.
A reduction of 1,017 MMBtus of natural gas consumed due to the geothermal system would
result in a decrease of the following emissions annually:149
o 93.6 lbs of NOx;
o 0.6 lbs of SO2; and
o 119,000 lbs/year of CO2.
The application of a geothermal system would result in the following net emissions reductions /
increase by pollutant annually:
A decrease of 83 lbs of NOx;
148
Does not include natural gas used for domestic hot water. 149
EIA, “Natural Gas 1998: Issues and Trends – Chapter 2: Natural Gas and the Environment,”
ftp://tonto.eia.doe.gov/pub/oil_gas/natural_gas/analysis_publications/natural_gas_1998_issues_trends/pdf/chapter2.
pdf, 1998

71
An increase of 13.15 lbs of SO2; and
A decrease of 60,875 lbs of CO2.
Regulatory Restrictions (Siting)
There are no state regulatory siting restrictions for the installation and/or use of geothermal systems. The
Town of Mansfield does not exercise jurisdiction over building improvements installed on UConn’s
Storrs campuses.150
Environmental Impacts and Permitting
Closed loop geothermal heat pump systems do not result in any point source air or water discharges;
therefore, no air emissions or water discharge permit is required. An open loop heat pump system that
discharges water to waters of the state, including all surface waters, ground waters and Publicly Owned
Treatment Works may require a permit.151
For open loop heat pump systems, Connecticut DEEP uses
both individual and general permits to regulate discharge activities. Individual permits are issued directly
to an applicant, whereas general permits, which are less costly and may be quicker to obtain, are permits
issued to authorize similar minor activities by one or more applicants. For open loop heat pump systems
that circulate and discharge less than 50,000 gallons per day (GPD), a general permit may be required.
For open loop heat pump systems that circulate and discharge more than 50,000 GPD, an “individual”
discharge permit will be required.152
There are no Natural Diversity Data Base Areas, which represent known locations, both historic and
extant, of state listed species and significant natural communities, identified at or immediately proximate
to Thompson Hall. State listed species are those listed as Endangered, Threatened or Special Concern
under the Connecticut Endangered Species Act.153
Because the geothermal system would be installed
underground at an existing building that is not designated as an historic building,154
no adverse impacts on
scenic resources or historic buildings are anticipated.
According to available mapping and information, there are no inland wetland soils, defined as "Any of the
soil types designated as poorly drained, very poorly drained, alluvial, and floodplain by the National
Cooperative Soil Survey, as may be amended from time to time, of the Natural Resources Conservation
Service of the United States Department of Agriculture" adjacent to Thompson Hall.155
150
Personal communication with the Mansfield Department of Building and Housing Inspection and Mansfield Fire
Department 151
Sections 22a-416 through 22a-438 of the Connecticut General Statutes (CGS) and Sections 22a-430-1 through
22a-430-7 of the Regulations of Connecticut State Agencies (RCSA) 152
Personal communications with the Department of Energy and Environmental Protection, January 20, 2012,
February 14, 2012; http://www.ct.gov/dep/cwp/view.asp?a=2709&q=324208&depNav_GID=1643 153
(Connecticut General Statutes, Section 26-303), Natural Diversity Database Areas - July 2011, GIS Shapefile,
Connecticut Department of Energy and Environmental Protection. 154
Correspondence from Stacey S. Vairo, State and National Register Coordinator, Connecticut State Historic
Preservation Office received November 1, 2011.
Department of Economic and Community Development (DECD) 155
Inland Wetland Soils; GIS Shapefile, Connecticut Department of Energy and Environmental Protection. The
original data was collected from published surveys from 1962 to 1981, field mapping from 1985 through 2001 and
additional attribute documentation to 3/23/2007. GIS Shapefile, Connecticut Department of Energy and
72
Site Restrictions Due to Land Use / Master Planning Considerations
The 2000 UConn Outlying Parcels Master Plan156
does not contain any information which would indicate
a conflict with deploying a geothermal system at this potential site. The Green Depot Campus Initiative
seeks to develop and demonstrate clean and efficient energy systems capable of using a multitude of
conventional and renewable fuels.157
A geothermal system would be deployed underground. The
development of a geothermal system may limit future land use development plans directly over or near a
geothermal system.
Capital Cost
The cost of a geothermal system will depend on whether the system will require drilling vertically deep
wells, use existing wells, or use loops in a horizontal fashion below ground. The cost of drilling wells also
will vary depending on the terrain, depth, and other local factors.158
A 40 ton geothermal system is
estimated to cost approximately $403,000. Geothermal projects funded under the American Recovery and
Reinvestment Act program in Connecticut have exhibited the following characteristics:
Table 7 – Average System Size and Cost for Geothermal Projects in Connecticut (October 2009 –
November 2011)159
Residential Commercial
Average System Size 4.8 Tons 40.7 Tons
Average System Cost ($/Ton) $8,782 $10,085
Operation and Maintenance Cost
Maintenance costs for geothermal systems are typically lower than for conventional technologies.160
This
is most likely due to the fact that the heat pump involves no combustion of fossil fuels and consists
primarily of low cost pumps and pipe systems.
Environmental Protection. Wetlands/Watercourses/Waterbodies Map, Town of Mansfield Plan of Conservation and
Development, April 2006. 156
University of Connecticut, “Outlying Parcels Master Plan,”
http://masterplan.uconn.edu/images/OPMP_5_22_2000.pdf, June 2000 157
University of Connecticut Climate Action Plan: Guiding the Path Towards Carbon Neutrality, “Section 5:
Education, Research, & Outreach,”
http://www.ecohusky.uconn.edu/pcc/documents/8_Section5_EducationOutreach.doc, 2007 158
The University of Alabama, Geo-Heat Center, Oregon Institute of Technology “Cost Containment for Ground-
Source Heat Pumps,” http://geoheat.oit.edu/pdf/tp72.pdf, Kavanaugh, Steve; Gilbreath, Christopher, December 1995 159
Clean Energy Finance and Investment Authority, Geothermal Heat Pump Incentive Program - Commercial
http://www.ctcleanenergy.com/YourBusinessorInstitution/GeothermalIncentiveProgramCommercial/tabid/521/Defa
ult.aspx, March 2, 2012 160
U.S. DOE EERE, “Selecting and Installing a Geothermal Heat Pump System,”
www.energysavers.gov/your_home/space_heating_cooling/index.cfm/mytopic=12670, February 9, 2011

73
Economics and Funding
At present, geothermal systems require significant state and federal funding to be competitive with
conventional technologies. The economics of geothermal projects may be improved if development is
undertaken and financed by a third party for-profit developer capable of garnering all of the federal
business investment tax credits and accelerated depreciation benefits associated with renewable energy
projects.161
For systems deployed in 2012, a 50 percent first year bonus depreciation monetization
structure is assumed as provided for under current law.162
Pro Forma Analysis of Grant Funding for Financial Feasibility
A 40 ton geothermal system installed at Thompson Hall is estimated to cost approximately $400,000, and
would not achieve a financial payback within the projected life of the system. The primary driver is the
initial cost of the system and relatively low natural gas prices used by conventional technology. However,
a geothermal system could achieve a financial payback within 2 years and an internal rate of return of
8.17 percent with a capital grant of approximately $267,000.163
Site Orientation and Generation Loads
The geothermal system could be deployed underground near Thompson Hall depending on the location of
underground utilities. Because geothermal systems are installed five or more feet below grade, or consist
of wells that extend tens to hundreds of feet below grade where the temperature is nearly constant,
orientation of the system relative to direction (north or south side) is not critical. A 40 ton geothermal
system is calculated to produce approximately 1,017 MMBtu for heating and 40,184 ton-hours for
cooling per year. It is anticipated that approximately 41 percent of the building’s heating requirements
and 100 percent of the cooling requirements will be met with a 40 ton geothermal system. This potential
deployment site was also assessed in the Preliminary Feasibility Study and Strategic Plan for the Depot
Campus.
161
A developer may include the original equipment manufacturer. 162
Dsireusa.org, “Modified Accelerated Cost-Recovery System (MACRS) + Bonus Depreciation (2008 – 2012),”
http://dsireusa.org/incentives/incentive.cfm?Incentive_Code=US06F&re=1&ee=1, October 14, 2011 163
Assumes an installed cost of $10,085 per ton, a discount rate of seven percent, and receipt of all applicable tax
credits and accelerated depreciation benefits.

74
Horsebarn Hill Sciences Complex Building #4 Annex
Horsebarn Hill Sciences Complex Building #4 Annex Site
Building #4 Annex, located on Horsebarn Hill Road on the main campus at Storrs, is used by faculty and
staff to promote multidisciplinary research, education and outreach in environmental sciences,
engineering, policy, and sustainability.
Geothermal System Visibility
In general, because geothermal systems are deployed underground, their public visibility is minimal.
However, if this site is selected for development, a monitoring display could be installed in the
lobby/entrance with details on the geothermal system’s location and performance data.
Figure 22 – Aerial View of Building #4 Annex Site
Heating and Cooling Demand and Geothermal System Sizing
The Building #4 Annex is approximately 23,000 square feet in area, and is estimated to use approximately
4,020 MMBtu of thermal energy annually.164
Currently, the Building #4 Annex is supplied with thermal
energy by natural gas fired boilers for space heating and domestic hot water. The cooling system consists
of a chiller/cooling tower, which provides the chilled water to the Building #4 Annex, and an air cooled
condenser that may provide back-up for the building.
164
Correspondence from UConn dated February 2, 2012
N

75
The capacity of a geothermal system at Building #4 Annex has been designed to replace fan coil unit #30,
which serves approximately 770 square feet or approximately 3.3 percent of the building’s floor area. A
3.1 ton geothermal system at Building #4 Annex could produce 25,000 Btu per hour.165
In 2011, Building
#4 Annex consumed approximately 4,020 MMBtu of natural gas for heating and domestic hot water.
Assuming a combustion efficiency of 80 percent for the existing boilers and a COP of 4.0, approximately
106 MMBtu of natural gas would be displaced by approximately 7,760 kWh of electricity.
Based on a 3.1 ton geothermal system and a COP of 4.0, the annual electrical consumption for cooling would be
reduced from approximately 3,700 kWh to approximately 2,800 kWh per year, for an annual savings of
approximately 900 kWh per year.
Environmental Benefits of a Geothermal Heat Pump System
As detailed above, a geothermal system would increase electricity consumption and reduce natural gas
consumption during heating periods, and decrease electricity consumption during periods that require
cooling. The 2009 Calculated New England Marginal Emission Rates (lb/MWh) values are detailed in
Appendix I.
A 3.1 ton geothermal system located at Building #4 Annex is expected to have the following emissions
characteristics:
An increase of 6.86 MWh of electricity consumption for the geothermal system would result in an
increase of the following emissions annually:
o 1.2 lbs of NOx;
o 1.5 lbs of SO2; and
o 6,380 lbs of CO2.
A reduction of 106 MMBtus of natural gas consumed due to the geothermal system would result
in a decrease of the following emissions:166
o 9.8 lbs of NOx;
o 0.06 lbs of SO2; and
o 12,400 lbs/year of CO2.
The application of a geothermal system would result in the following net emissions reductions /
increase by pollutant annually:
A decrease of 8.6 lbs of NOx;
An increase of 1.4 lbs of SO2; and
A decrease of 6,020 lbs of CO2.
165
Does not include natural gas used for domestic hot water. 166
EIA, “Natural Gas 1998: Issues and Trends – Chapter 2: Natural Gas and the Environment,”
ftp://tonto.eia.doe.gov/pub/oil_gas/natural_gas/analysis_publications/natural_gas_1998_issues_trends/pdf/chapter2.
pdf, 1998

76
Regulatory Restrictions (Siting)
There are no state regulatory siting restrictions on the installation and/or use of geothermal systems. The
Town of Mansfield does not exercise jurisdiction over building improvements installed on UConn’s
Storrs campuses.167
Environmental Impacts and Permitting
Closed loop geothermal heat pump systems do not result in any point source air or water discharges;
therefore, no air emissions or water discharge permit is required. An open loop heat pump system that
discharges water to waters of the state, including all surface waters, ground waters and Publicly Owned
Treatment Works may require a permit.168
For open loop heat pump systems, Connecticut DEEP uses
both individual and general permits to regulate discharge activities. Individual permits are issued directly
to an applicant, whereas general permits, which are less costly and may be quicker to obtain, are permits
issued to authorize similar minor activities by one or more applicants. For open loop heat pump systems
that circulate and discharge less than 50,000 GPD, a general permit may be required. For open loop heat
pump systems that circulate and discharge more than 50,000 GPD, an “individual” discharge permit will
be required.169
There are Natural Diversity Data Base Areas, which represent known locations, both historic and extant,
of state listed species and significant natural communities, proximate to Building #4 Annex. However, the
area immediately south and east of Building #4 Annex is not within the boundary of Natural Diversity
Data Base Area buffer. State listed species are those listed as Endangered, Threatened or Special Concern
under the Connecticut Endangered Species Act (Connecticut General Statutes, Section 26-303).170
Because the geothermal system would be installed underground at an existing building that is not
designated as an historic building,171
no adverse impacts on scenic resources or historic buildings are
anticipated.
According to available mapping and information, there are no inland wetland soils, defined as "Any of the
soil types designated as poorly drained, very poorly drained, alluvial, and floodplain by the National
Cooperative Soil Survey, as may be amended from time to time, of the Natural Resources Conservation
Service of the United States Department of Agriculture" adjacent to and immediately south of Building #4
Annex.172
Soil types that are designated as poorly drained have been identified to the east of Building #4
Annex.
167
Personal communication with the Mansfield Department of Building and Housing Inspection and Mansfield Fire
Department 168
Sections 22a-416 through 22a-438 of the Connecticut General Statutes (CGS) and Sections 22a-430-1 through
22a-430-7 of the Regulations of Connecticut State Agencies (RCSA) 169
Personal communications with the Department of Energy and Environmental Protection, January 20, 2012,
February 14, 2012; http://www.ct.gov/dep/cwp/view.asp?a=2709&q=324208&depNav_GID=1643 170
Natural Diversity Database Areas - July 2011, GIS Shapefile, Connecticut Department of Energy and
Environmental Protection. 171
Correspondence from Stacey S. Vairo, State and National Register Coordinator, Connecticut State Historic
Preservation Office received November 1, 2011.
Department of Economic and Community Development (DECD) 172
Inland Wetland Soils; GIS Shapefile, Connecticut Department of Energy and Environmental Protection. The
original data was collected from published surveys from 1962 to 1981, field mapping from 1985 through 2001 and

77
Site Restrictions Due to Land Use / Master Planning Considerations
The 2000 UConn Outlying Parcels Master Plan173
does not contain any information which would indicate
a conflict with deploying a geothermal system at this potential site. A geothermal system would be
deployed underground; consequently, no land use impacts are anticipated; however, the development of a
geothermal system may limit future land use development plans directly over or near a geothermal
system.
Capital Cost
The cost of a geothermal system will depend on whether the system will require drilling vertically deep
wells, use existing wells, or use loops in a horizontal fashion below ground. The cost of drilling wells also
will vary depending on the terrain, depth, and other local factors.174
A 3.1 ton geothermal system is
estimated to cost approximately $11,700. A Geothermal projects funded under the American Recovery
and Reinvestment Act program in Connecticut have exhibited the following characteristics:
Table 8 – Average System Size and Cost for Geothermal Projects in Connecticut (October 2009 –
November 2011) 175
Residential Commercial
Average System Size 4.8 Tons 40.7 Tons
Average System Cost ($/Ton) $8,782 $10,085
Operation and Maintenance Cost
Maintenance costs for geothermal heat pumps are typically lower than for conventional technologies.176
This is most likely due to the fact that the heat pump involves no combustion of fossil fuels and consists
primarily of low cost pumps and pipe systems.
additional attribute documentation to 3/23/2007.GIS Shapefile, Connecticut Department of Energy and
Environmental Protection. Wetlands/Watercourses/Waterbodies Map, Town of Mansfield Plan of Conservation and
Development, April 2006. 173
University of Connecticut, “Outlying Parcels Master Plan,”
http://masterplan.uconn.edu/images/OPMP_5_22_2000.pdf, June 2000 174
The University of Alabama, Geo-Heat Center, Oregon Institute of Technology “Cost Containment for Ground-
Source Heat Pumps,” http://geoheat.oit.edu/pdf/tp72.pdf, Kavanaugh, Steve; Gilbreath, Christopher, December 1995 175
Clean Energy Finance and Investment Authority, Geothermal Heat Pump Incentive Program - Commercial
http://www.ctcleanenergy.com/YourBusinessorInstitution/GeothermalIncentiveProgramCommercial/tabid/521/Defa
ult.aspx, March 2, 2012 176
U.S. DOE EERE, “ Selecting and Installing a Geothermal Heat Pump,”
www.energysavers.gov/your_home/space_heating_cooling/index.cfm/mytopic=12670, February 9, 2011

78
Economics and Funding
At present, geothermal systems require significant state and federal funding to be competitive with
conventional technologies. The economics of geothermal projects may be improved if development is
undertaken and financed by a third party for-profit developer capable of garnering all of the federal
business investment tax credits and accelerated depreciation benefits associated with renewable energy
projects. For systems deployed in 2012, a 50 percent first year bonus depreciation monetization structure
is assumed as provided for under current law.177
Pro Forma Analysis of Grant Funding for Financial Feasibility
A 3.1 ton geothermal system installed at Building #4 Annex is estimated to cost approximately $27,000,
and would not achieve a financial payback within the projected life of the system. The primary driver is
the initial cost of the system and relatively low natural gas prices used by conventional technology.
However, a geothermal system could achieve a financial payback within 2 years, an internal rate of return
of 8.71 percent, and a net present value of $820 with a capital grant of approximately $16,700.178
Site Orientation and Generation Loads
A geothermal system could be deployed adjacent to the building, possibly on the south side near the
chiller/cooling tower to facilitate integration with the buildings HVAC equipment. Because geothermal
systems are installed five or more feet below grade, or consist of wells that extend tens to hundreds of feet
below grade where the temperature is nearly constant, orientation of the system relative to direction (north
or south side) is not critical. Alternatively, an open loop geothermal heat pump system may be considered
due to the presence of approximately 20 existing wells located to the north and east of Building #4
Annex. It is estimated that a 3.1 ton open loop geothermal heat pump system would require approximately
8,900 gallons of water per day.179
A detailed analysis of water resources to sustain operational
requirements would need to be undertaken. A 3.1 ton geothermal system is calculated to produce
approximately 106 MMBtu for heating and approximately 3,100 ton-hours for cooling per year. It is
anticipated that by replacing fan coil unit #30, approximately 3.3 percent of the building’s heating
requirements a will met with a 3.1 ton geothermal system.
177
Dsireusa.org, “Modified Accelerated Cost-Recovery System (MACRS) + Bonus Depreciation (2008 – 2012),”
http://dsireusa.org/incentives/incentive.cfm?Incentive_Code=US06F&re=1&ee=1, October 14, 2011 178
Assumes an installed cost of $8,700 per ton, a discount rate of seven percent, and receipt of all applicable tax
credits and accelerated depreciation benefits. 179
Iowa Energy Center Energy Resource Station, “Geothermal Heat Pump Systems – GeoExchange Technology,”
http://www.michigan.gov/documents/CIS_EO_KC-MAY06-Workshop_159640_7.pdf, Klaassen, Curtis, 2006
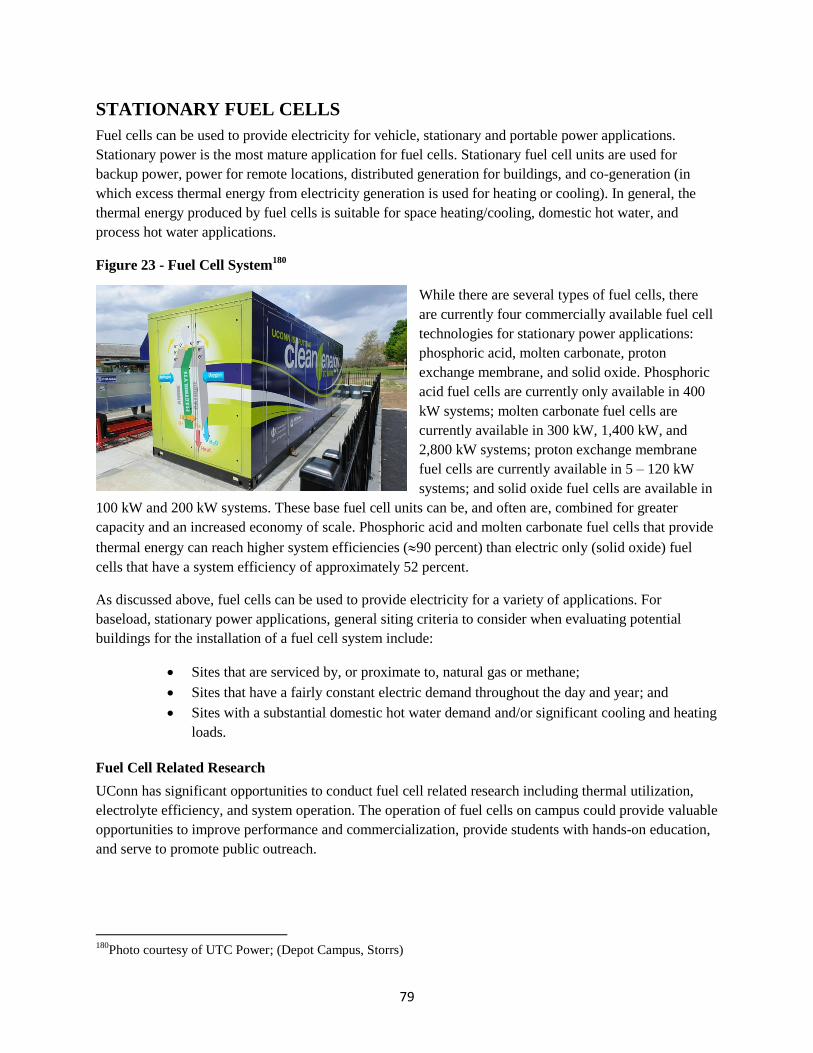
79
STATIONARY FUEL CELLS
Fuel cells can be used to provide electricity for vehicle, stationary and portable power applications.
Stationary power is the most mature application for fuel cells. Stationary fuel cell units are used for
backup power, power for remote locations, distributed generation for buildings, and co-generation (in
which excess thermal energy from electricity generation is used for heating or cooling). In general, the
thermal energy produced by fuel cells is suitable for space heating/cooling, domestic hot water, and
process hot water applications.
Figure 23 - Fuel Cell System180
While there are several types of fuel cells, there
are currently four commercially available fuel cell
technologies for stationary power applications:
phosphoric acid, molten carbonate, proton
exchange membrane, and solid oxide. Phosphoric
acid fuel cells are currently only available in 400
kW systems; molten carbonate fuel cells are
currently available in 300 kW, 1,400 kW, and
2,800 kW systems; proton exchange membrane
fuel cells are currently available in 5 – 120 kW
systems; and solid oxide fuel cells are available in
100 kW and 200 kW systems. These base fuel cell units can be, and often are, combined for greater
capacity and an increased economy of scale. Phosphoric acid and molten carbonate fuel cells that provide
thermal energy can reach higher system efficiencies (90 percent) than electric only (solid oxide) fuel
cells that have a system efficiency of approximately 52 percent.
As discussed above, fuel cells can be used to provide electricity for a variety of applications. For
baseload, stationary power applications, general siting criteria to consider when evaluating potential
buildings for the installation of a fuel cell system include:
Sites that are serviced by, or proximate to, natural gas or methane;
Sites that have a fairly constant electric demand throughout the day and year; and
Sites with a substantial domestic hot water demand and/or significant cooling and heating
loads.
Fuel Cell Related Research
UConn has significant opportunities to conduct fuel cell related research including thermal utilization,
electrolyte efficiency, and system operation. The operation of fuel cells on campus could provide valuable
opportunities to improve performance and commercialization, provide students with hands-on education,
and serve to promote public outreach.
180
Photo courtesy of UTC Power; (Depot Campus, Storrs)
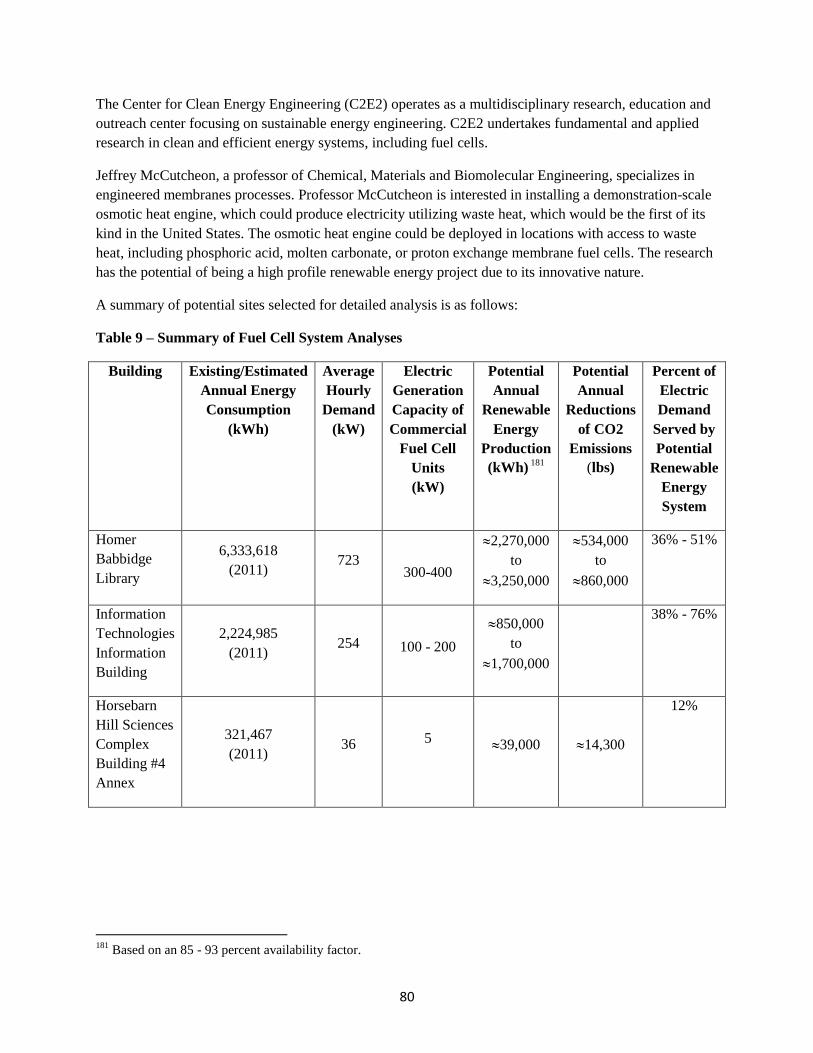
80
The Center for Clean Energy Engineering (C2E2) operates as a multidisciplinary research, education and
outreach center focusing on sustainable energy engineering. C2E2 undertakes fundamental and applied
research in clean and efficient energy systems, including fuel cells.
Jeffrey McCutcheon, a professor of Chemical, Materials and Biomolecular Engineering, specializes in
engineered membranes processes. Professor McCutcheon is interested in installing a demonstration-scale
osmotic heat engine, which could produce electricity utilizing waste heat, which would be the first of its
kind in the United States. The osmotic heat engine could be deployed in locations with access to waste
heat, including phosphoric acid, molten carbonate, or proton exchange membrane fuel cells. The research
has the potential of being a high profile renewable energy project due to its innovative nature.
A summary of potential sites selected for detailed analysis is as follows:
Table 9 – Summary of Fuel Cell System Analyses
Building Existing/Estimated
Annual Energy
Consumption
(kWh)
Average
Hourly
Demand
(kW)
Electric
Generation
Capacity of
Commercial
Fuel Cell
Units
(kW)
Potential
Annual
Renewable
Energy
Production
(kWh) 181
Potential
Annual
Reductions
of CO2
Emissions
(lbs)
Percent of
Electric
Demand
Served by
Potential
Renewable
Energy
System
Homer
Babbidge
Library
6,333,618
(2011) 723
300-400
2,270,000
to
3,250,000
534,000
to
860,000
36% - 51%
Information
Technologies
Information
Building
2,224,985
(2011) 254
100 - 200
850,000
to
1,700,000
38% - 76%
Horsebarn
Hill Sciences
Complex
Building #4
Annex
321,467
(2011) 36
5 39,000 14,300
12%
181
Based on an 85 - 93 percent availability factor.
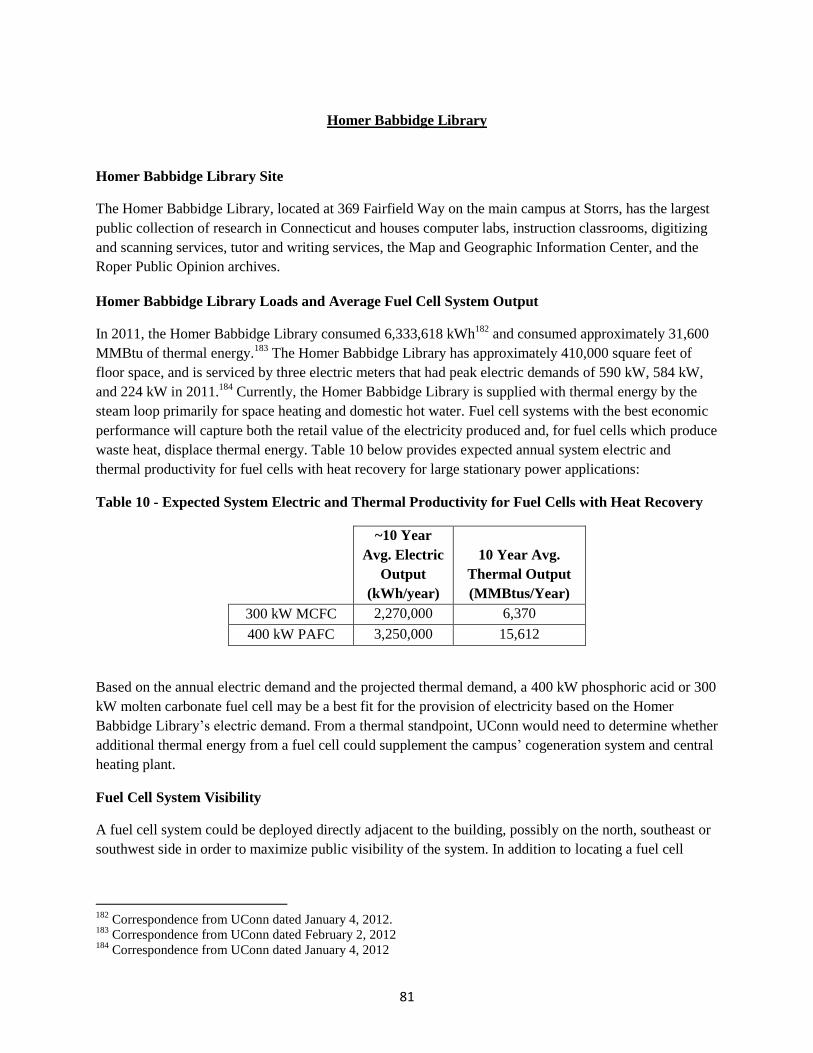
81
Homer Babbidge Library
Homer Babbidge Library Site
The Homer Babbidge Library, located at 369 Fairfield Way on the main campus at Storrs, has the largest
public collection of research in Connecticut and houses computer labs, instruction classrooms, digitizing
and scanning services, tutor and writing services, the Map and Geographic Information Center, and the
Roper Public Opinion archives.
Homer Babbidge Library Loads and Average Fuel Cell System Output
In 2011, the Homer Babbidge Library consumed 6,333,618 kWh182
and consumed approximately 31,600
MMBtu of thermal energy.183
The Homer Babbidge Library has approximately 410,000 square feet of
floor space, and is serviced by three electric meters that had peak electric demands of 590 kW, 584 kW,
and 224 kW in 2011.184
Currently, the Homer Babbidge Library is supplied with thermal energy by the
steam loop primarily for space heating and domestic hot water. Fuel cell systems with the best economic
performance will capture both the retail value of the electricity produced and, for fuel cells which produce
waste heat, displace thermal energy. Table 10 below provides expected annual system electric and
thermal productivity for fuel cells with heat recovery for large stationary power applications:
Table 10 - Expected System Electric and Thermal Productivity for Fuel Cells with Heat Recovery
~10 Year
Avg. Electric
Output
(kWh/year)
10 Year Avg.
Thermal Output
(MMBtus/Year)
300 kW MCFC 2,270,000 6,370
400 kW PAFC 3,250,000 15,612
Based on the annual electric demand and the projected thermal demand, a 400 kW phosphoric acid or 300
kW molten carbonate fuel cell may be a best fit for the provision of electricity based on the Homer
Babbidge Library’s electric demand. From a thermal standpoint, UConn would need to determine whether
additional thermal energy from a fuel cell could supplement the campus’ cogeneration system and central
heating plant.
Fuel Cell System Visibility
A fuel cell system could be deployed directly adjacent to the building, possibly on the north, southeast or
southwest side in order to maximize public visibility of the system. In addition to locating a fuel cell
182
Correspondence from UConn dated January 4, 2012. 183
Correspondence from UConn dated February 2, 2012 184
Correspondence from UConn dated January 4, 2012

82
system in a prominent, high visibility location, a monitoring display could be installed in the lobby with
information on the fuel cell, how it works, and performance data.
Figure 24 – Aerial View of Homer Babbidge Library Site
Environmental Benefits of a Fuel Cell System
Fuel cells that provide baseload power for stationary power applications are typically configured to
operate on a hydrogen rich fuel, such as natural gas. Fuel cells that provide baseload power for stationary
power applications are a low emissions renewable energy technology. As such, the avoided emissions
benefits are equal to the annual average emissions (lbs/MWh) of electric power within the region
(Appendix I) and the emissions associated with the provision of thermal energy, less the emissions from a
fuel cell.
Table 11 - Emission Values for Fuels Cells (300 kW – 400 kW) Operating on Methane
Air Emissions Emissions Values185
(lb/MWh)
NOx .01 - <.07
SO2 .0001
CO2 (with heat recovery) 487 - 680
CO2 (without heat recovery) 980 – 1,050
185
UTC Power PureCell System Model 400 Product Data Sheet, DFC 300 Product Data Sheet, FuelCell Energy; 2-
10-12.
N

83
Regulatory Restrictions (Siting)
Certificates of Environmental Compatibility and Public Need (Certificate) are not required for “(1) fuel
cells built within the state with a generating capacity of two hundred fifty kilowatts or less, or (2) fuel
cells built out of state with a generating capacity of ten kilowatts or less”. Further, “the council shall, in
the exercise of its jurisdiction over the siting of generating facilities, approve by declaratory ruling …(B)
the construction or location of any fuel cell, unless the council finds a substantial adverse environmental
effect, or of any customer-side distributed resources project or facility or grid-side distributed resources
project or facility with a capacity of not more than sixty-five megawatts.”186
In order to confirm
compliance with applicable environmental regulations and receive a formal decision regarding the
applicability of a Certificate for a fuel cell system, a Petition for Declaratory Ruling is required to be filed
with the Connecticut Siting Council. The Town of Mansfield does not exercise jurisdiction over building
improvements, such as for fuel cell systems, installed on UConn’s campus.187
Environmental Impacts and Permitting
The operation of a fuel cell system would generate noise, air emissions, and potentially a wastewater
discharge.
Phosphoric acid fuel cells create 60 decibels of noise at 33 feet.188
Molten carbonate fuel cells can create
65 decibels of noise at 10 feet.189
According to Connecticut DEEP regulations (Sec. 22a-69-3.5 (b)), “No
person in a Class B Noise Zone shall emit noise exceeding the levels stated herein and applicable to
adjacent Noise Zones:” The noise threshold for a Class B emitter to a receptor in any land use category is
as follows:190
Class C
Receptor
Class B
Receptor
Class A
Receptor/Day
Class A
Receptor/Night
Class B Emitter
62 dBA 62 dBA 55 dBA 45 dBA
While there are no residences proximate to the Homer Babbidge Library, noise impacts should be
considered when selecting a technology and the exact location for a fuel cell system, and detailed noise
modeling may be necessary to avoid disruption/annoyance to students and/or faculty on campus.
As discussed above, the application of a fuel cell system with natural gas as a fuel will generate air
emissions. However, because of the low emission characteristics of this technology, a 300 kW or 400 kW
186
Connecticut General Statutes, Sec. 16-50k 187
Phone call with Mansfield Department of Building and Housing Inspection 188
UTC Power, “The PureCell Model 400 Energy Solution,”, 2011
http://www.utcpower.com/files/DS0112_PureCell_400_111011.pdf 189
FuelCell Energy, “DCF1500 Key Features,”
http://www.fuelcellenergy.com/files/FCE%201500%20Product%20Design-lo-rez%20FINAL.pdf, December, 2010 190
Connecticut Department of Energy and Environmental Protection, “Control of Noise,”
http://www.ct.gov/dep/lib/dep/regulations/22a/22a-69-1through7.pdf, March, 2012

84
fuel cell may not require a new source review general permit for air emissions pursuant to Section 22a-
174-3a of the Regulations of Connecticut State Agencies.191
In addition, some fuel cells both consume and discharge water. It is anticipated that any wastewater from
a fuel cell at the Homer Babbidge Library would be discharged to UConn’s wastewater collection and
treatment system, but such discharge is not expected to be significant. According to the Connecticut
DEEP, a Miscellaneous General Permit for wastewater discharge may be required.192
Table 12 - Water Consumption and Discharge Rates for Phosphoric Acid and Molten Carbonate Fuel Cells
Water Consumption (gallons
per minute)
Water Discharge (gallons
per minute)
Phosphoric Acid Fuel
Cells
none during normal operating
conditions when ambient
temperatures are below 85 F.
Less than 1 gpm above 86 F.
none during normal operating
conditions. Maximum of 1
gpm at 110 F
Molten Carbonate
Fuel Cells
.9 average,
10 during WTS backflush
.45 average,
10 during WTS backflush
The deployment of a fuel cell at the Homer Babbidge Library is not expected to result in any adverse
impacts on scenic resources, historic buildings, or endangered species or species of special concern.
Site Restrictions Due to Land Use / Master Planning Considerations
The 2006 Storrs Campus Master Plan Update193
does not contain any information which would indicate a
conflict with deploying a fuel cell system at this site. The 2004 Sustainable Design Guidelines specifies
exploring “fuel cells and other alternative energy supply systems. Capture the heat created from fuel cells
as a strategy to increase operational efficiency.194
In terms of land use, a 300 kW or 400 kW fuel cell
system would require the following space requirements:
191
Department of Energy & Environmental Protection, “Air Emission – New Source Review Program,”
http://www.ct.gov/dep/cwp/view.asp?a=2709&q=324136&depNav_GID=1643, October 2009 192
Bureau of Materials Management and Compliance Assurance, “General Permit for Miscellaneous Discharges of
Sewer Compatible (MISC) Wastewater,”
http://www.ct.gov/dep/lib/dep/Permits_and_Licenses/Water_Discharge_General_Permits/misc_gp.pdf, April 30,
2011 193
University of Connecticut, “Storrs Campus Master Plan Update,” http://masterplan.uconn.edu/images/6-
0331storrs-small.pdf, January 2006 194
University of Connecticut, “Campus Sustainable Design Guidelines,” http://masterplan.uconn.edu/images/SDG-
web.pdf, November 2004

85
Table 13 - Dimensions of Fuel Cell Stack and Balance of Plant for Phosphoric Acid and Molten
Carbonate Fuel Cells
Length Width Height (Max)
300 kW Molten Carbonate Fuel Cell 28' 20' 15' 1'
400 kW Phosphoric Acid Fuel Cell +
Optional Cooling Module Setup
Lengthwise
43' 3" 8' 9' 11"
Capital Cost
A fuel cell system is expected to cost between $5,500 and $8,000 per kW. Actual project costs may be
higher or lower.
Operation and Maintenance Cost
In general, it is reasonable to assume that operations and maintenance costs will be approximately one
and one half to two cents per kWh. Operation and maintenance of fuel cell systems is typically handled
by or through the original equipment manufacturer or project developer, and usually involves cleaning,
replacement of filters, inspection of all fluid connections, routine water purification measurements, and to
verify proper function of all communications equipment.
Economics and Funding
In general, recommended projects are configured as behind the meter applications. This means they
would displace the full per kWh retail value of the electricity produced by the system. In addition, for
systems funded through the Low Emissions Renewable Energy Credit (LREC) program, a maximum
payment of $200/MWh is possible. This program is expected to begin in 2012 and will utilize a
competitive performance based production incentive for actual energy produced based on a $/MWh basis
over a period of 15 years. The economics of grid connected fuel cell systems providing wholesale power
at this scale may be prohibitive. As such, this approach is not recommended in this deployment plan.
The economics of fuel cell projects may be improved if development is undertaken and financed by a
third party for-profit developer capable of garnering all of the federal business investment tax credits and
accelerated depreciation benefits associated with renewable energy projects.195
For systems deployed in
2012, a 50 percent first year bonus depreciation monetization structure is assumed as provided for under
current law.196
A 300 kW or 400 kW fuel cell system installed at the Homer Babbidge Library could achieve a financial
payback within the life of the system.197
The economics of fuel cell systems will vary based on such
195
A developer may include the original equipment manufacturer. 196
Dsireusa.org, “Modified Accelerated Cost-Recovery System (MACRS) + Bonus Depreciation (2008 – 2012),”
http://dsireusa.org/incentives/incentive.cfm?Incentive_Code=US06F&re=1&ee=1, October 14, 2011 197
Assumes receipt of all applicable tax credits and depreciation benefits, a discount rate of 7 percent, natural gas at
$8 / MMBtu, and an LREC value of $100 / MWh.

86
factors as capital and installed costs, thermal output and utilization, state and federal incentives, and
electrical output and costs.
Site Orientation and Generation Loads
Fuel cell systems are designed for installation outdoors under a variety of weather conditions. A fuel cell
system could be located directly adjacent to the Homer Babbidge Library for enhanced public education.
A 300 kW or 400 kW fuel cell system is calculated to produce between approximately 2,270,000 and
3,250,000 kWh and between approximately 6,370 and 15,612 MMBtu per year. It is anticipated that all of
the electricity generated by a 300 kW or 400 kW fuel cell system would be used by UConn. UConn has
supported the installation of a proton exchange membrane fuel cell on the main campus, and plans to
install a 400 kW phosphoric acid fuel cell at the Depot Campus. The addition of another fuel cell on
campus would demonstrate UConn’s interest in, and contributions to, the advancement of hydrogen and
fuel cell technology.
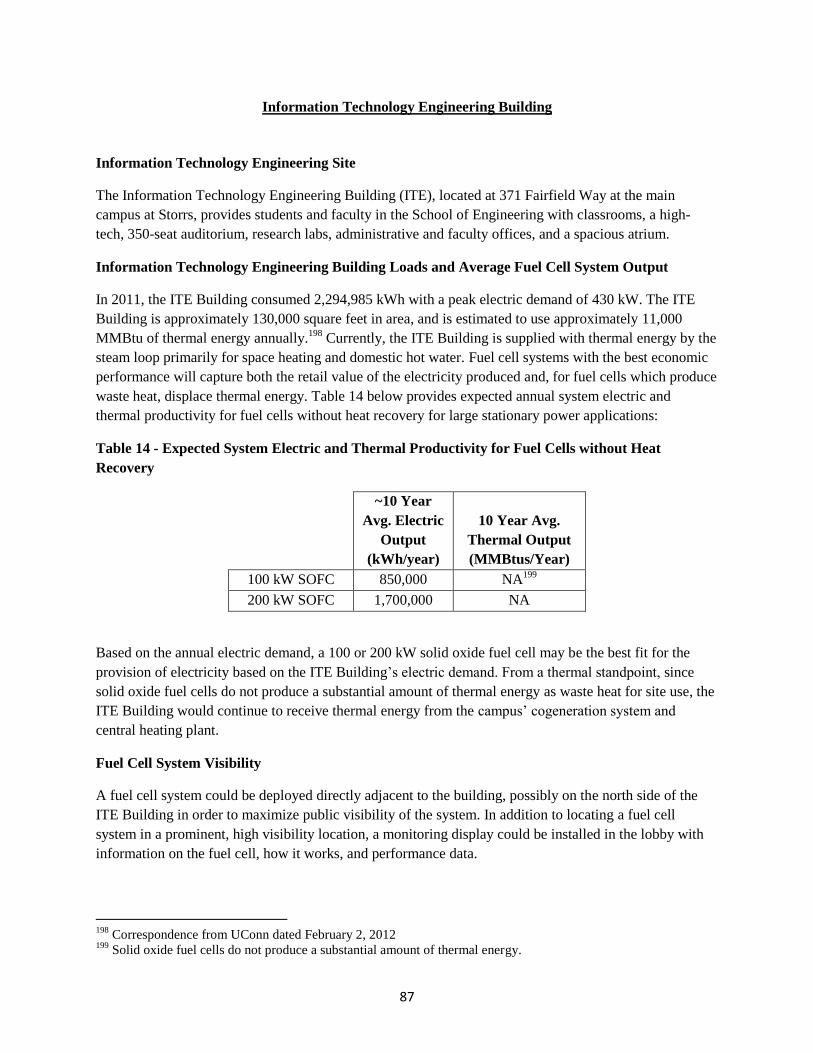
87
Information Technology Engineering Building
Information Technology Engineering Site
The Information Technology Engineering Building (ITE), located at 371 Fairfield Way at the main
campus at Storrs, provides students and faculty in the School of Engineering with classrooms, a high-
tech, 350-seat auditorium, research labs, administrative and faculty offices, and a spacious atrium.
Information Technology Engineering Building Loads and Average Fuel Cell System Output
In 2011, the ITE Building consumed 2,294,985 kWh with a peak electric demand of 430 kW. The ITE
Building is approximately 130,000 square feet in area, and is estimated to use approximately 11,000
MMBtu of thermal energy annually.198
Currently, the ITE Building is supplied with thermal energy by the
steam loop primarily for space heating and domestic hot water. Fuel cell systems with the best economic
performance will capture both the retail value of the electricity produced and, for fuel cells which produce
waste heat, displace thermal energy. Table 14 below provides expected annual system electric and
thermal productivity for fuel cells without heat recovery for large stationary power applications:
Table 14 - Expected System Electric and Thermal Productivity for Fuel Cells without Heat
Recovery
~10 Year
Avg. Electric
Output
(kWh/year)
10 Year Avg.
Thermal Output
(MMBtus/Year)
100 kW SOFC 850,000 NA199
200 kW SOFC 1,700,000 NA
Based on the annual electric demand, a 100 or 200 kW solid oxide fuel cell may be the best fit for the
provision of electricity based on the ITE Building’s electric demand. From a thermal standpoint, since
solid oxide fuel cells do not produce a substantial amount of thermal energy as waste heat for site use, the
ITE Building would continue to receive thermal energy from the campus’ cogeneration system and
central heating plant.
Fuel Cell System Visibility
A fuel cell system could be deployed directly adjacent to the building, possibly on the north side of the
ITE Building in order to maximize public visibility of the system. In addition to locating a fuel cell
system in a prominent, high visibility location, a monitoring display could be installed in the lobby with
information on the fuel cell, how it works, and performance data.
198
Correspondence from UConn dated February 2, 2012 199
Solid oxide fuel cells do not produce a substantial amount of thermal energy.

88
Figure 25 – Aerial View of ITE Building Site
Environmental Benefits of a Fuel Cell System
Fuel cells that provide baseload power for stationary power applications are typically configured to
operate on a hydrogen rich fuel, such as natural gas. Fuel cells that provide baseload power for stationary
power applications are a low emissions renewable energy technology. As such, the avoided emissions
benefits are equal to the annual average emissions (lbs/MWh) of electric power within the region
(Appendix I) less the emissions from a fuel cell.
Table 15 - Emission Values for Fuels Cells (100 kW – 200 kW, No Heat Recovery)
Air Emissions Emissions Values200
(lb/MWh)
NOx 0.01 - <.07
SO2 0.0001
CO2 (without heat recovery) 773
200
Bloom EnergyES-5000 and ES 5400 Product Data Sheets.
N
ITE Building
Homer
Babbidge
Library
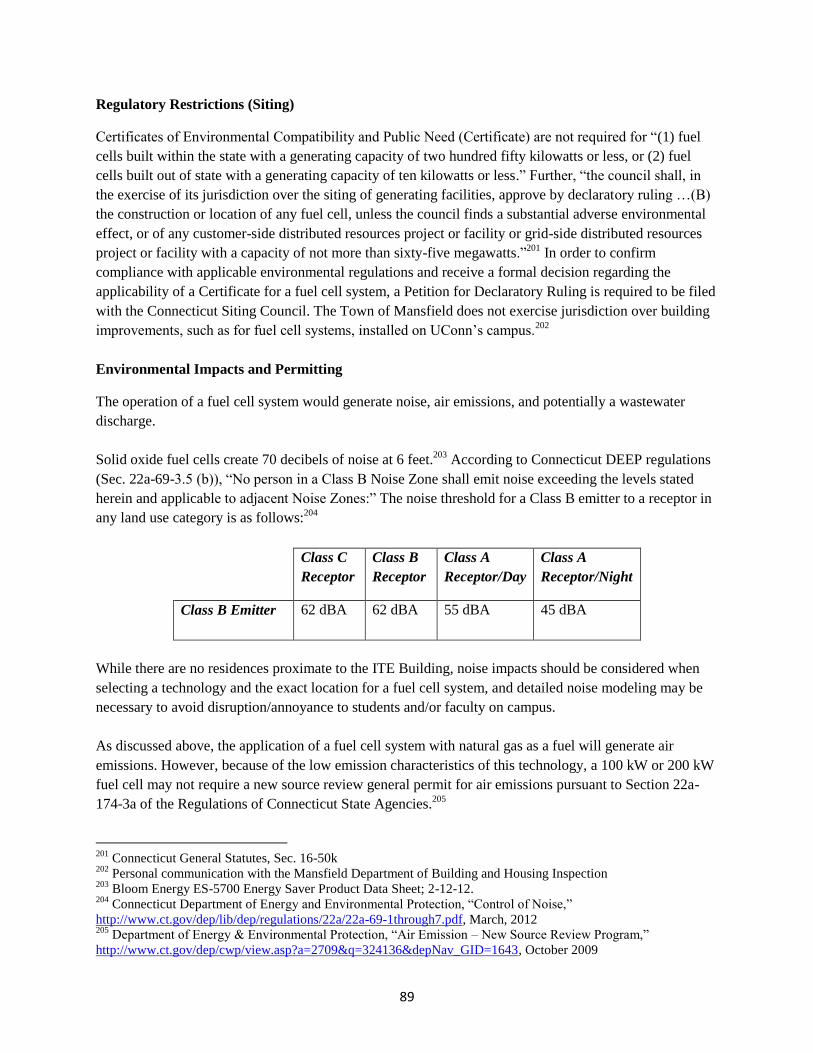
89
Regulatory Restrictions (Siting)
Certificates of Environmental Compatibility and Public Need (Certificate) are not required for “(1) fuel
cells built within the state with a generating capacity of two hundred fifty kilowatts or less, or (2) fuel
cells built out of state with a generating capacity of ten kilowatts or less.” Further, “the council shall, in
the exercise of its jurisdiction over the siting of generating facilities, approve by declaratory ruling …(B)
the construction or location of any fuel cell, unless the council finds a substantial adverse environmental
effect, or of any customer-side distributed resources project or facility or grid-side distributed resources
project or facility with a capacity of not more than sixty-five megawatts.”201
In order to confirm
compliance with applicable environmental regulations and receive a formal decision regarding the
applicability of a Certificate for a fuel cell system, a Petition for Declaratory Ruling is required to be filed
with the Connecticut Siting Council. The Town of Mansfield does not exercise jurisdiction over building
improvements, such as for fuel cell systems, installed on UConn’s campus.202
Environmental Impacts and Permitting
The operation of a fuel cell system would generate noise, air emissions, and potentially a wastewater
discharge.
Solid oxide fuel cells create 70 decibels of noise at 6 feet.203
According to Connecticut DEEP regulations
(Sec. 22a-69-3.5 (b)), “No person in a Class B Noise Zone shall emit noise exceeding the levels stated
herein and applicable to adjacent Noise Zones:” The noise threshold for a Class B emitter to a receptor in
any land use category is as follows:204
Class C
Receptor
Class B
Receptor
Class A
Receptor/Day
Class A
Receptor/Night
Class B Emitter
62 dBA 62 dBA 55 dBA 45 dBA
While there are no residences proximate to the ITE Building, noise impacts should be considered when
selecting a technology and the exact location for a fuel cell system, and detailed noise modeling may be
necessary to avoid disruption/annoyance to students and/or faculty on campus.
As discussed above, the application of a fuel cell system with natural gas as a fuel will generate air
emissions. However, because of the low emission characteristics of this technology, a 100 kW or 200 kW
fuel cell may not require a new source review general permit for air emissions pursuant to Section 22a-
174-3a of the Regulations of Connecticut State Agencies.205
201
Connecticut General Statutes, Sec. 16-50k 202
Personal communication with the Mansfield Department of Building and Housing Inspection 203
Bloom Energy ES-5700 Energy Saver Product Data Sheet; 2-12-12. 204
Connecticut Department of Energy and Environmental Protection, “Control of Noise,”
http://www.ct.gov/dep/lib/dep/regulations/22a/22a-69-1through7.pdf, March, 2012 205
Department of Energy & Environmental Protection, “Air Emission – New Source Review Program,”
http://www.ct.gov/dep/cwp/view.asp?a=2709&q=324136&depNav_GID=1643, October 2009
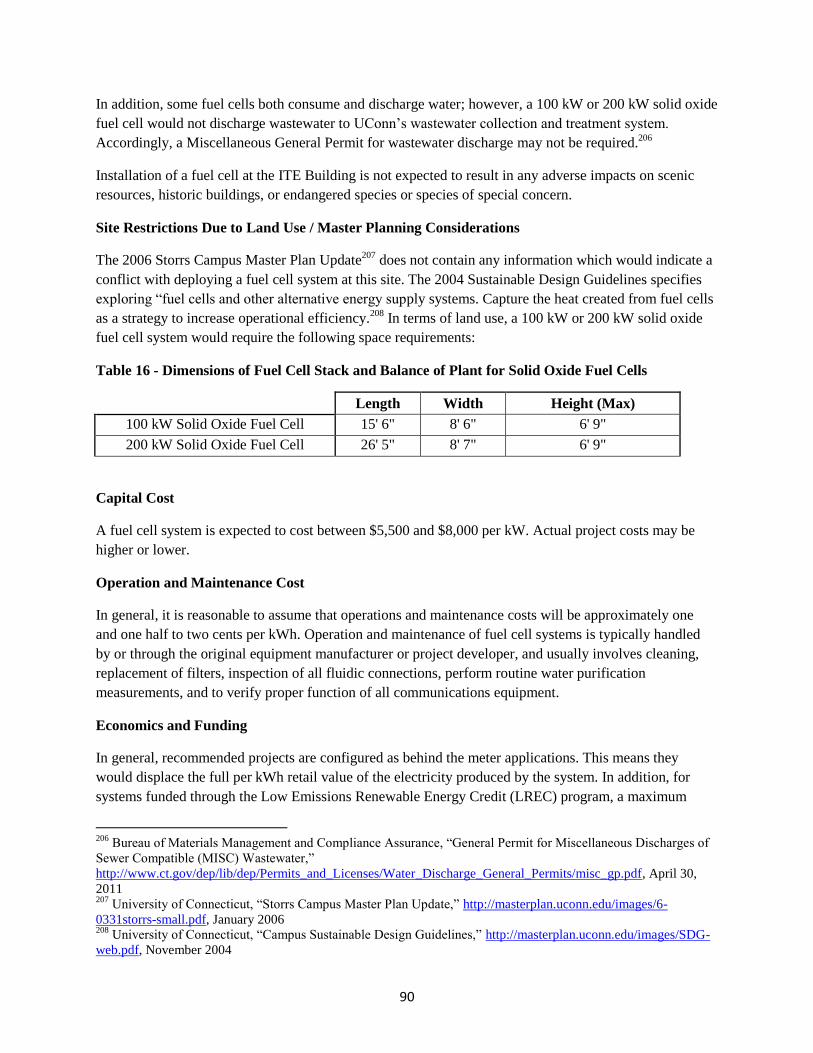
90
In addition, some fuel cells both consume and discharge water; however, a 100 kW or 200 kW solid oxide
fuel cell would not discharge wastewater to UConn’s wastewater collection and treatment system.
Accordingly, a Miscellaneous General Permit for wastewater discharge may not be required.206
Installation of a fuel cell at the ITE Building is not expected to result in any adverse impacts on scenic
resources, historic buildings, or endangered species or species of special concern.
Site Restrictions Due to Land Use / Master Planning Considerations
The 2006 Storrs Campus Master Plan Update207
does not contain any information which would indicate a
conflict with deploying a fuel cell system at this site. The 2004 Sustainable Design Guidelines specifies
exploring “fuel cells and other alternative energy supply systems. Capture the heat created from fuel cells
as a strategy to increase operational efficiency.208
In terms of land use, a 100 kW or 200 kW solid oxide
fuel cell system would require the following space requirements:
Table 16 - Dimensions of Fuel Cell Stack and Balance of Plant for Solid Oxide Fuel Cells
Length Width Height (Max)
100 kW Solid Oxide Fuel Cell 15' 6" 8' 6" 6' 9"
200 kW Solid Oxide Fuel Cell 26' 5" 8' 7" 6' 9"
Capital Cost
A fuel cell system is expected to cost between $5,500 and $8,000 per kW. Actual project costs may be
higher or lower.
Operation and Maintenance Cost
In general, it is reasonable to assume that operations and maintenance costs will be approximately one
and one half to two cents per kWh. Operation and maintenance of fuel cell systems is typically handled
by or through the original equipment manufacturer or project developer, and usually involves cleaning,
replacement of filters, inspection of all fluidic connections, perform routine water purification
measurements, and to verify proper function of all communications equipment.
Economics and Funding
In general, recommended projects are configured as behind the meter applications. This means they
would displace the full per kWh retail value of the electricity produced by the system. In addition, for
systems funded through the Low Emissions Renewable Energy Credit (LREC) program, a maximum
206
Bureau of Materials Management and Compliance Assurance, “General Permit for Miscellaneous Discharges of
Sewer Compatible (MISC) Wastewater,”
http://www.ct.gov/dep/lib/dep/Permits_and_Licenses/Water_Discharge_General_Permits/misc_gp.pdf, April 30,
2011 207
University of Connecticut, “Storrs Campus Master Plan Update,” http://masterplan.uconn.edu/images/6-
0331storrs-small.pdf, January 2006 208
University of Connecticut, “Campus Sustainable Design Guidelines,” http://masterplan.uconn.edu/images/SDG-
web.pdf, November 2004

91
payment of $200/MWh is possible. This program is expected to begin in 2012 and will utilize a
competitive performance based production incentive for actual energy produced based on a $/MWh basis
over a period of 15 years. The economics of grid connected fuel cell systems providing wholesale power
at this scale may be prohibitive. As such, this approach is not recommended in this deployment plan.
The economics of fuel cell projects may be improved if development is undertaken and financed by a
third party for-profit developer capable of garnering all of the federal business investment tax credits and
accelerated depreciation benefits associated with renewable energy projects.209
For systems deployed in
2012, a 50 percent first year bonus depreciation monetization structure is assumed as provided for under
current law.210
A 100 kW or 200 kW solid oxide fuel cell system installed at the ITE Building could achieve a financial
payback within the life of the system.211
The economics of fuel cell systems will vary based on such
factors as capital and installed costs, thermal output and utilization, state and federal incentives, and
electrical output and costs.
Site Orientation and Generation Loads
Fuel cell systems are designed for installation outdoors under a variety of weather conditions. A fuel cell
system could be located directly adjacent to the ITE Building for enhanced public education. A 100 kW
or 200 kW fuel cell system is calculated to produce between approximately 850,000 kWh and 1,700,000
kWh per year. It is anticipated that all of the electricity generated by a 100 kW or 200 kW fuel cell system
would be used by UConn. UConn has supported the installation of a proton exchange membrane fuel cell
on the main campus, and plans to install a 400 kW phosphoric acid fuel cell at the Depot Campus. The
addition of another fuel cell on campus would demonstrate UConn’s interest in, and contributions to, the
advancement of hydrogen and fuel cell technology.
As an alternative, a larger 800 kW – 1.4 MW fuel cell system located between the Homer Babbidge
Library and the ITE building could provide electricity and thermal energy for both buildings. Such a
configuration may provide for reduced costs through economy of scale, and support research interests for
integration of distributed energy resources and Smart Grid technologies.
209
A developer may include the original equipment manufacturer. 210
Dsireusa.org, “Modified Accelerated Cost-Recovery System (MACRS) + Bonus Depreciation (2008 – 2012),”
http://dsireusa.org/incentives/incentive.cfm?Incentive_Code=US06F&re=1&ee=1, October 14, 2011 211
Assumes receipt of all applicable tax credits and depreciation benefits, a discount rate of 7 percent, natural gas at
$8 / MMBtu, and an LREC value of $100 / MWh.

92
Horsebarn Hill Sciences Complex Building #4 Annex
Horsebarn Hill Sciences Complex Building #4 Annex Site
Building #4 Annex, located on Horsebarn Hill Road on the main campus at Storrs, is used by faculty and
staff to promote multidisciplinary research, education and outreach in environmental sciences,
engineering, policy, and sustainability.
Building #4 Annex Loads and Average Fuel Cell System Output
In 2011, the Building #4 Annex consumed 321,467 kWh212
and had a peak electric demand of 147 kW.
The Building #4 Annex is approximately 23,000 square feet in area, and is estimated to use approximately
3,200 MMBtu of thermal energy annually.213
Currently, the Building #4 Annex is supplied with thermal
energy by natural gas fired boilers for space heating and domestic hot water. The cooling system consists
of a chiller/cooling tower, which provides the chilled water to the Building 4 Annex, and an air cooled
condenser that may provide back-up for the Building #4 Annex.
Table 17- Expected System Electric and Thermal Productivity for Fuel Cells That Can Meet
Smaller Base and Peaking Loads:
~10 Year
Avg. Electric
Output
(kWh/year)
10 Year Avg.
Thermal Output
(MMBtus/Year)
5 kW PEM 39,000 152
Based on the annual electric demand and the projected thermal demand, a 5 kW proton exchange
membrane fuel cell may be a best fit for the provision of electricity based on the Building #4 Annex’s
electric and thermal demand. Currently, 5 kW fuel cell systems are commercially available for backup
power or baseload power applications. For this potential site, a 5 kW fuel cell system for baseload power
was assessed. From a thermal standpoint, UConn would need to determine whether thermal energy from a
fuel cell could supplement the building’s heating system. Fuel cell systems with the best economic
performance will capture both the retail value of the electricity produced and, for fuel cells which produce
waste heat, displace thermal energy.
212
Correspondence from UConn dated January 4, 2012. 213
Correspondence from UConn dated February 2, 2012
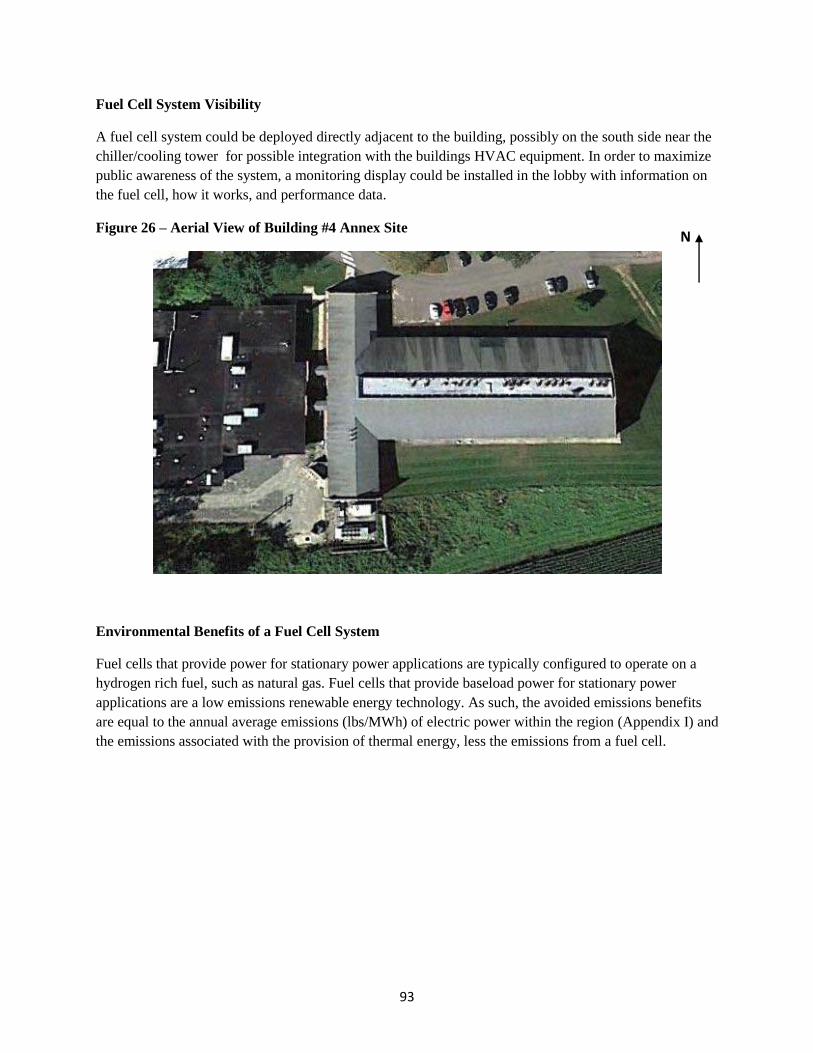
93
Fuel Cell System Visibility
A fuel cell system could be deployed directly adjacent to the building, possibly on the south side near the
chiller/cooling tower for possible integration with the buildings HVAC equipment. In order to maximize
public awareness of the system, a monitoring display could be installed in the lobby with information on
the fuel cell, how it works, and performance data.
Figure 26 – Aerial View of Building #4 Annex Site
Environmental Benefits of a Fuel Cell System
Fuel cells that provide power for stationary power applications are typically configured to operate on a
hydrogen rich fuel, such as natural gas. Fuel cells that provide baseload power for stationary power
applications are a low emissions renewable energy technology. As such, the avoided emissions benefits
are equal to the annual average emissions (lbs/MWh) of electric power within the region (Appendix I) and
the emissions associated with the provision of thermal energy, less the emissions from a fuel cell.
N

94
Table 18 - Emission Values for a 5 kW Fuel Cell Operating on Methane
Air Emissions Emissions Values214
(lb/MWh)
NOx negligible
SO2 negligible
CO2 (without heat recovery) 1,060
Regulatory Restrictions (Siting)
Certificates of Environmental Compatibility and Public Need (Certificate) are not required for “(1) fuel
cells built within the state with a generating capacity of two hundred fifty kilowatts or less, or (2) fuel
cells built out of state with a generating capacity of ten kilowatts or less.” Further, “the council shall, in
the exercise of its jurisdiction over the siting of generating facilities, approve by declaratory ruling …(B)
the construction or location of any fuel cell, unless the council finds a substantial adverse environmental
effect, or of any customer-side distributed resources project or facility or grid-side distributed resources
project or facility with a capacity of not more than sixty-five megawatts.”215
Consequently, a Petition for
Declaratory Ruling is required to be filed with the Connecticut Siting Council for any fuel cell The Town
of Mansfield does not exercise jurisdiction over building improvements, such as for fuel cell systems,
installed on UConn’s campus.216
Environmental Impacts and Permitting
The operation of a fuel cell system would generate noise, air emissions, and potentially a wastewater
discharge.
A 5 kW fuel cell system is expected to generate 60 decibels at three feet.217
According to Connecticut
DEEP regulations (Sec. 22a-69-3.5 (b)), “No person in a Class B Noise Zone shall emit noise exceeding
the levels stated herein and applicable to adjacent Noise Zones:”
214
ClearEdge Power - Corporate Overview and System Specifications for Commercial Applications; “ How Can a
ClearEdge5 System Help California Reach AB32, Which Mandates 20 percent CO2 Emissions Reductions By
2020”, 2-13-12. 215
Connecticut General Statutes, Sec. 16-50k 216
Personal correspondence with Mansfield Department of Building and Housing Inspection 217
Clear Edge Power - Corporate Overview and System Specifications for Commercial Applications; 2-13-12

95
The noise threshold for a Class B emitter to a receptor in any land use category is as follows:218
Class C
Receptor
Class B
Receptor
Class A
Receptor/Day
Class A
Receptor/Night
Class B Emitter
62 dBA 62 dBA 55 dBA 45 dBA
While there are no residences proximate to the Building #4 Annex, noise impacts should be considered
when selecting a technology and the exact location for a fuel cell system, and detailed noise modeling
may be necessary to avoid disruption/annoyance to students and/or faculty on campus.
As discussed above, the application of a fuel cell system with natural gas as a fuel will generate air
emissions. However, because of the low emission characteristics of this technology, a 5 kW fuel cell may
not require a new source review general permit for air emissions pursuant to Section 22a-174-3a of the
Regulations of Connecticut State Agencies.219
In addition, some fuel cells both consume and discharge water. It is anticipated that any wastewater from
a fuel cell at the Building #4 Annex would be discharged to UConn’s wastewater collection and treatment
system, but such discharge is not expected to be significant. According to the Connecticut DEEP, a
Miscellaneous General Permit for wastewater discharge may be required.220
Water consumption and
discharge information for a 5 kW proton exchange membrane fuel cell is as follows:
Table 19 - Water Consumption and Discharge Rates for a 5 kW Proton Exchange Membrane Fuel
Cell
Water Consumption (gallons
per minute)
Water Discharge (gallons
per minute)
Proton Exchange
Membrane Fuel Cells .016 .0056
The deployment of a 5 kW fuel cell at the Building #4 Annex is not expected to result in any adverse
impacts on scenic resources, historic buildings, or endangered species or species of special concern.
218
Connecticut Department of Energy and Environmental Protection, “Control of Noise,”
http://www.ct.gov/dep/lib/dep/regulations/22a/22a-69-1through7.pdf, March, 2012 219
Department of Energy & Environmental Protection, “Air Emission – New Source Review Program,”
http://www.ct.gov/dep/cwp/view.asp?a=2709&q=324136&depNav_GID=1643, October 2009 220
Bureau of Materials Management and Compliance Assurance, “General Permit for Miscellaneous Discharges of
Sewer Compatible (MISC) Wastewater,”
http://www.ct.gov/dep/lib/dep/Permits_and_Licenses/Water_Discharge_General_Permits/misc_gp.pdf, April 30,
2011
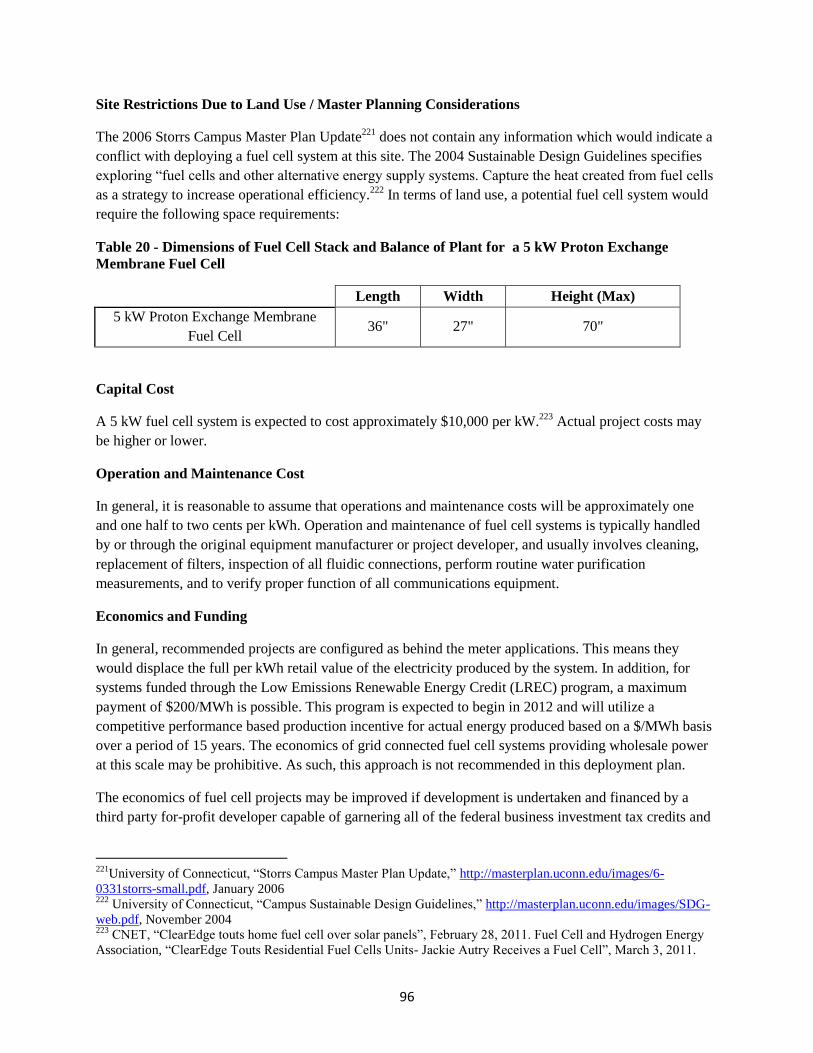
96
Site Restrictions Due to Land Use / Master Planning Considerations
The 2006 Storrs Campus Master Plan Update221
does not contain any information which would indicate a
conflict with deploying a fuel cell system at this site. The 2004 Sustainable Design Guidelines specifies
exploring “fuel cells and other alternative energy supply systems. Capture the heat created from fuel cells
as a strategy to increase operational efficiency.222
In terms of land use, a potential fuel cell system would
require the following space requirements:
Table 20 - Dimensions of Fuel Cell Stack and Balance of Plant for a 5 kW Proton Exchange
Membrane Fuel Cell
Length Width Height (Max)
5 kW Proton Exchange Membrane
Fuel Cell 36" 27" 70"
Capital Cost
A 5 kW fuel cell system is expected to cost approximately $10,000 per kW.223
Actual project costs may
be higher or lower.
Operation and Maintenance Cost
In general, it is reasonable to assume that operations and maintenance costs will be approximately one
and one half to two cents per kWh. Operation and maintenance of fuel cell systems is typically handled
by or through the original equipment manufacturer or project developer, and usually involves cleaning,
replacement of filters, inspection of all fluidic connections, perform routine water purification
measurements, and to verify proper function of all communications equipment.
Economics and Funding
In general, recommended projects are configured as behind the meter applications. This means they
would displace the full per kWh retail value of the electricity produced by the system. In addition, for
systems funded through the Low Emissions Renewable Energy Credit (LREC) program, a maximum
payment of $200/MWh is possible. This program is expected to begin in 2012 and will utilize a
competitive performance based production incentive for actual energy produced based on a $/MWh basis
over a period of 15 years. The economics of grid connected fuel cell systems providing wholesale power
at this scale may be prohibitive. As such, this approach is not recommended in this deployment plan.
The economics of fuel cell projects may be improved if development is undertaken and financed by a
third party for-profit developer capable of garnering all of the federal business investment tax credits and
221
University of Connecticut, “Storrs Campus Master Plan Update,” http://masterplan.uconn.edu/images/6-
0331storrs-small.pdf, January 2006 222
University of Connecticut, “Campus Sustainable Design Guidelines,” http://masterplan.uconn.edu/images/SDG-
web.pdf, November 2004 223
CNET, “ClearEdge touts home fuel cell over solar panels”, February 28, 2011. Fuel Cell and Hydrogen Energy
Association, “ClearEdge Touts Residential Fuel Cells Units- Jackie Autry Receives a Fuel Cell”, March 3, 2011.

97
accelerated depreciation benefits associated with renewable energy projects. 224
For systems deployed in
2012, a 50 percent first year bonus depreciation monetization structure is assumed as provided for under
current law.225
A 5 kW fuel cell system installed at the Building #4 Annex could achieve a financial payback within the
life of the system.226
The economics of fuel cell systems will vary based on such factors as capital and
installed costs, thermal output and utilization, state and federal incentives, and electrical output and costs.
Site Orientation and Generation Loads
Fuel cell systems are designed for installation outdoors under a variety of weather conditions. A fuel cell
system located at the Building #4 Annex could supplement other renewable energy technologies, and
serve as a cluster for enhanced public education. A 5 kW fuel cell system is calculated to produce
approximately 39,000 kWh and approximately 152 MMBtu of thermal energy per year. It is anticipated
that all of the electricity generated by a 5 kW fuel cell system would be used by UConn. UConn has
supported the installation of a proton exchange membrane fuel cell on the main campus, and plans to
install a 400 kW phosphoric acid fuel cell at the Depot Campus. The addition of another fuel cell on
campus would demonstrate UConn’s interest in, and contributions to, the advancement of hydrogen and
fuel cell technology.
224
A developer may include the original equipment manufacturer. 225
Dsireusa.org, “Modified Accelerated Cost-Recovery System (MACRS) + Bonus Depreciation (2008 – 2012),”
http://dsireusa.org/incentives/incentive.cfm?Incentive_Code=US06F&re=1&ee=1, October 14, 2011 226
Assumes receipt of all applicable tax credits and depreciation benefits, a discount rate of 7 percent, natural gas at
$8 / MMBtu, and an LREC value of $100 / MWh.

98
BIOFUELS
Biomass energy resources and biodiesel can both be considered for deployment at UConn Campus.
Biomass gasification involves the use of biomass as a feedstock (forest, agricultural, and certain organic
wood wastes), heat, and pressure in a controlled gasifier environment to make a hydrogen-rich fuel. This
hydrogen rich fuel can then be used by various technologies to produce electricity and thermal energy.
The use of biomass for solid-fuel boilers, which are designed to burn agriculture crop residues, such as
corn stover or wheat straw, forest residues, etc. could also produce steam or hot water. The biomass
steam can be used in a topping-cycle electrical generator to produce electricity first, then low-pressure
steam or hot water for other thermal purposes with the turbine-generator exhaust steam.
Biodiesel is a renewable fuel that can be manufactured from new and used vegetable oils, animal fats, and
recycled restaurant grease. Biodiesel’s physical properties are similar to those of petroleum diesel, but it
is a cleaner-burning alternative. The use of biodiesel can reduce emissions of pollutants that impact air
quality, and greenhouse gas emissions.227
Biodiesel can be produced using a variety of esterification
technologies. The oils and fats are filtered and preprocessed to remove water and contaminants. If free
fatty acids are present, they can be removed or transformed into biodiesel using special pretreatment
technologies. The pretreated oils and fats are then mixed with an alcohol (usually methanol) and a catalyst
(usually sodium hydroxide or potassium hydroxide). The oil molecules (triglycerides) are broken apart
and reformed into methyl esters and glycerin, which are then separated from each other and purified.
General criteria to consider when evaluating potential buildings/areas for the installation of a biofuels
facility includes:
Sites with access to both water and sewer service connections;
Sites at or near a source of biomass energy resources;
Truck access for the transport of feedstock, production materials, finished product, or
waste materials; and
Opportunity to use waste heat to reduce process costs.
Biogas Related Research
Richard Parnas, a professor of Chemical Engineering Department and the Institute of Materials Science
conducts research into continuous flow biodiesel reactors as well as spectroscopic remote testing
technology.
Steven Suib, a professor of Inorganic and Environmental Chemistry has conducted research into novel
biofuel catalysts for biofuel production. The development of new catalysts will enable the utilization of
new feedstocks for biodiesel production.
Radenka Maric, a professor in the Chemical, Materials & Biomolecular Engineering Department and
Ioulia Valla, an Assistant Research Professor in the Chemical, Materials & Biomolecular Engineering
Department plan to continue to conduct research on biomass gasification using the small scale
227
U.S. DOE EERE, “Vehicle Technologies Program,” http://www.afdc.energy.gov/afdc/pdfs/47504.pdf, February
2011

99
gasification system donated by the City of Stamford. The research will involve 1) the integration of the
gasifier with fuel cell systems, and 2) finding methods for cleaning and reforming remaining tars in the
gasification stream without resorting to low temperature clean up methods. This research will enable the
energy value of low value hydrocarbons to be utilized in energy generation, improving the efficiency of
the overall process. This small scale gasification system will be used to size and specify the components
for a lab scale gas clean up device to be used at the proof of concept stage. The input gas for this system
will be a simulated syngas, in order to retain control over the process parameters of the system. The proof
of concept system would be tested over a variety of process conditions to optimize its performance and
determine the operating range limitations.228
Jackie Sung, a professor of Mechanical Engineering, who specializes in fuels and combustion and Challa
Kumar, a professor of Chemistry who specializes in biocatalysts are interested in helping pursue the
development of a gasification or methanation facility on the Storrs campuses. Given a variety of fuel
feedstocks, the facility would be able to make gaseous or liquid fuels depending on the demand.
Farhed Shah, a professor of Agriculture and Resource Economics, specializes in conducting economic
analyses in a variety of fields, particularly on water resources. Deep Mukherjee is a graduate student
working with Dr. Shah who specializes in energy economics. Professor Shah and Mr. Mukherjee are
interested in performing cost/benefit analyses of biogas or composting facilities that may be deployed.
The analyses would examine the efficacy and potential of these technologies and may include
externalities such as reduction in harmful emissions and economic impact on the local community.
228
Correspondence from the University of Connecticut dated January 20, 2012
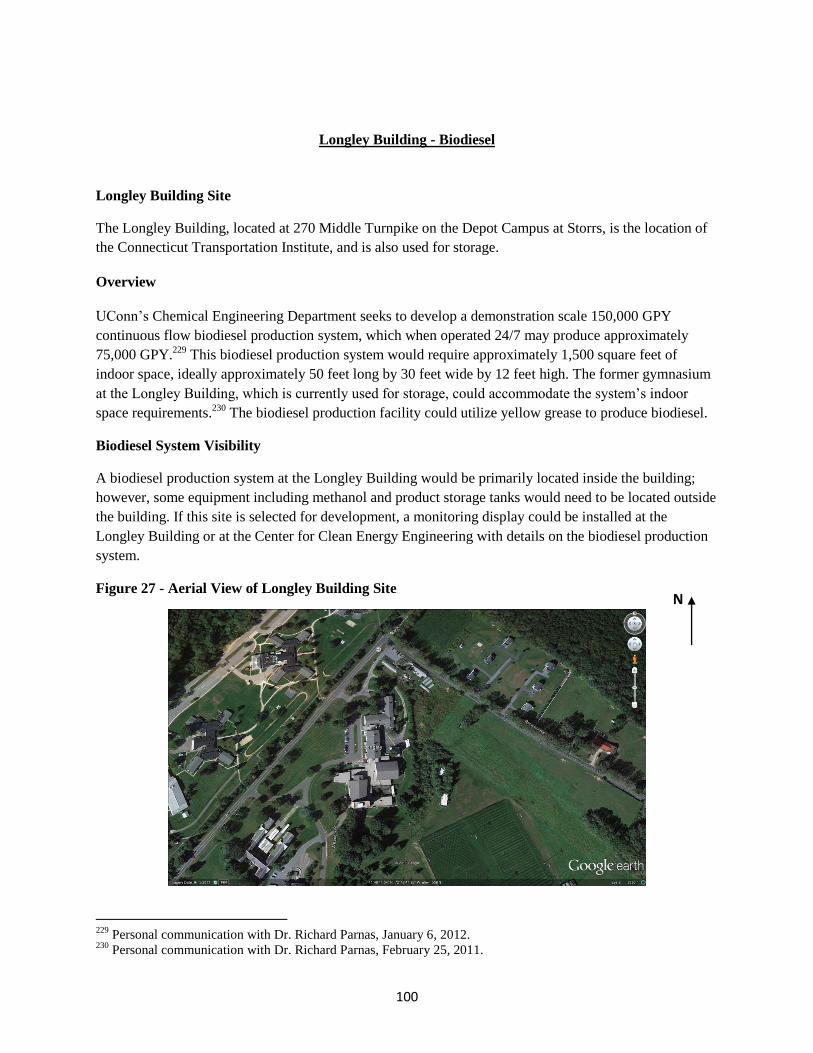
100
Longley Building - Biodiesel
Longley Building Site
The Longley Building, located at 270 Middle Turnpike on the Depot Campus at Storrs, is the location of
the Connecticut Transportation Institute, and is also used for storage.
Overview
UConn’s Chemical Engineering Department seeks to develop a demonstration scale 150,000 GPY
continuous flow biodiesel production system, which when operated 24/7 may produce approximately
75,000 GPY.229
This biodiesel production system would require approximately 1,500 square feet of
indoor space, ideally approximately 50 feet long by 30 feet wide by 12 feet high. The former gymnasium
at the Longley Building, which is currently used for storage, could accommodate the system’s indoor
space requirements.230
The biodiesel production facility could utilize yellow grease to produce biodiesel.
Biodiesel System Visibility
A biodiesel production system at the Longley Building would be primarily located inside the building;
however, some equipment including methanol and product storage tanks would need to be located outside
the building. If this site is selected for development, a monitoring display could be installed at the
Longley Building or at the Center for Clean Energy Engineering with details on the biodiesel production
system.
Figure 27 - Aerial View of Longley Building Site
229
Personal communication with Dr. Richard Parnas, January 6, 2012. 230
Personal communication with Dr. Richard Parnas, February 25, 2011.
N

101
Environmental Benefits of Biodiesel Production and Utilization
The environmental benefits of biodiesel production are accrued from using the finished biodiesel product
and displacing diesel fuel and its associated emissions. Biodiesel produced at UConn could be used for
the University’s fuel oil boilers and emergency generators, and diesel-fueled vehicles. UConn has
approximately 40 oil fired boilers at the Storrs campuses that consumed approximately 120,000 gallons of
fuel (heating) oil in 2010.231
In addition, approximately 130,000 gallons of diesel fuel were used by the
University’s shuttle buses in 2010. If approximately 20 percent of the University’s fuel oil requirements
(50,000 gallons per year) were displaced by biodiesel, UConn could realize the following emissions
impacts:
Table 21 – Estimated Annual Emissions Impacts of Using 50,000 Gallons of B100 Biodiesel
B100
Gallons
Emissions
Lbs of Emissions
Reduced/Increased
50,000
NOx +745
SO2 -221
CO2 -806,000
If approximately 75,000 gallons of the University’s fuel oil requirements were displaced by biodiesel,
UConn could realize the following emissions impacts:
Table 22 – Estimated Annual Emissions Impacts of Using 75,000 Gallons of B100 Biodiesel
B100
Gallons
Emissions
Lbs of Emissions
Reduced/Increased
75,000
NOx +1,162
SO2 -331
CO2 -1,209,000
Regulatory Restrictions (Siting)
There are no state regulatory siting restrictions on the development of a biodiesel production facility in
Connecticut. The Town of Mansfield does not exercise jurisdiction over building improvements installed
on UConn’s Storrs campuses.232
Environmental Impacts and permitting
The operation of a biodiesel production facility is not expected to generate substantial noise; however,
noise impacts should be considered when determining the facility’s equipment configuration and
operational requirements. Detailed noise modeling may be necessary to avoid disruption/annoyance to
231
Information obtained from UConn, September 21, 2011. 232
Personal communication with the Mansfield Department of Building and Housing Inspection and Mansfield Fire
Department

102
students and/or faculty on campus.
In general, permitting requirements will ultimately depend on the technology deployed at the facility, the
type of feedstocks, storage requirements, and operations. Typically, permits are required for onsite
processing of waste grease and other feedstocks. According to DEEP, most permitting/compliance
requirements have so far originated from the State Fire Marshall’s Office. Consistency with all applicable
fire code regulations will be required for completion and operation of a biodiesel production facility.
A biodiesel production facility would most likely have to comply with Emergency Planning and
Community Right-to-Know (EPCRA) guidelines because it is a facility that would store or handle
chemicals. Chemical Hazard Reporting Form may be required by the local emergency planning
committee, DEEP, and University and/or local fire response personnel for any material requiring a
material safety data sheet (such as methanol).
There may be air emissions associated with the use of methanol; consequently, an air permit may be
required if methanol emissions exceed allowable thresholds.
Development of a Spill Prevention, Control and Countermeasures (SPCC) Plan addressing oil storage as
for facilities which have greater than 1,320 gallons of oil stored in above ground tanks may be required. If
the facility has already prepared an SPCC Plan, or a Stormwater Pollution Prevention Plan, or some other
emergency or contingency plan, that plan may be amended to incorporate provisions to comply with
regulatory requirements.233
Connecticut DEEP uses both individual and general permits to regulate discharge activities. Individual
permits are issued directly to an applicant, whereas general permits, which are less costly and may be
quicker to obtain, are permits issued to authorize similar minor activities by one or more applicants. A
biodiesel production facility will require consistency with General Permit Registrations, including
Industrial Stormwater and Miscellaneous Discharges of Sewer Compatible Wastewaters Miscellaneous
Discharges of Sewer Compatible (MISC) Wastewater. For sites with a footprint greater than 5 acres, a
Construction Stormwater General Permit may also be required.234
There are no Natural Diversity Data Base Areas, which represent known locations, both historic and
extant, of state listed species and significant natural communities, identified at or immediately proximate
to Longley Building. State listed species are those listed as Endangered, Threatened or Special Concern
under the Connecticut Endangered Species Act (Connecticut General Statutes, Section 26-303).235
Because the biodiesel production facility would be installed primarily within an existing building that is
233
Ross Q. Bunnell, PE. Environmental Requirements for Biodiesel Facilities, 2007. Robert Hannon, Connecticut
Department of Energy and Environmental Protection, dated 2/28/2012. 234
Connecticut Department of Energy and Environmental Protection, “Genera Permits – An Environmental
Permitting Fact Sheet,” http://www.ct.gov/dep/cwp/view.asp?a=2709&q=324154&depNav_GID=1643, February
2012 235
Natural Diversity Database Areas - July 2011, GIS Shapefile, Connecticut Department of Energy and
Environmental Protection.
103
not designated as an historic building,236
no adverse impacts on scenic resources or historic buildings are
anticipated.
Site Restrictions Due to Land Use / Master Planning Considerations
The Outlying Parcels Master Plan seeks to preserve the character of UConn’s Depot Campus relative to
historic features and natural beauty.237
A small scale biodiesel production facility may be consistent with
the goals of the Master Plan. However, UConn should consider the impact that a biodiesel production
facility may have on the character of the Depot Campus when designing or configuring the site. The 2004
Sustainable Design Guidelines specifies exploring “fuel cells and other alternative energy supply systems.
Capture the heat created from fuel cells ...” as a strategy to increase operational efficiency.238
A biodiesel
production plant located at Longley Building, which utilizes waste heat from a fuel cell located at the
Center for Clean Energy Engineering, would be consistent with this aspect of the 2004 Sustainable
Design Guidelines. The 2006 Storrs Campus Master Plan Update239
does not contain any information
which would indicate a conflict with deploying a biodiesel production facility at this site.
Capital Cost
The capital costs for a biodiesel production facility can range from $950,000 for a 500,000 GPY facility
to $15 million for a 30 million GPY facility.240
It is estimated that a 150,000 GPY biodiesel production
facility could have a capital cost between $300,000 to $750,000.
Operation and Maintenance Cost
Maintenance of a biodiesel production facility may include routine maintenance on the reactor and
storage tanks, inspection of the ventilation system, and inspection of the wastewater treatment and
discharge systems where applicable. Operation and maintenance cost will vary depending on the size of
the facility, reaction efficiency and characteristics, capacity utilization, and reactor installation and
construction quality.
Economics and Funding
The economics of a biodiesel production facility is dependent on several factors including: (1) the
facility’s capital cost; (2) the cost of the biodiesel feedstocks; (3) the cost of methanol and other reactants;
(4) the value of all products and co-products; (5) utility costs; (6) prevailing labor costs; (7) the facility’s
capacity utilization; (8) permitting costs; and (9) the availability of grant funding.
236
Correspondence from Stacey S. Vairo, State and National Register Coordinator, Connecticut State Historic
Preservation Office received November 1, 2011.
Department of Economic and Community Development (DECD) 237
University of Connecticut, “Outlying Parcels Master Plan,”
http://masterplan.uconn.edu/images/OPMP_5_22_2000.pdf, June 2000 238
University of Connecticut, “Campus Sustainable Design Guidelines,” http://masterplan.uconn.edu/images/SDG-
web.pdf, November 2004 239
University of Connecticut, “Storrs Campus Master Plan Update,” http://masterplan.uconn.edu/images/6-
0331storrs-small.pdf, January 2006 240
Ascension-Publishing, “A Study on the Feasibility of Biodiesel Production in Georgia,” Table 3, p. 11,
http://www.ascension-publishing.com/BIZ/HD41.pdf, Shumaker, George, 2000

104
Currently, the Connecticut Center for Advanced Technology, Inc. (CCAT) administers Connecticut’s
Biodiesel Programs. At present, all biodiesel production and distribution facilities funding is committed
or expended. However, grants are available on a per gallon basis for the production of biodiesel.
Summary
UConn is estimated to use approximately 250,000 gallons of diesel per year for heating and
transportation. A 150,000 GPY biodiesel production facility could produce approximately 75,000 GPY of
domestically produced biodiesel each year. If all of the 75,000 gallons of biodiesel is used and displaces
the use of conventional diesel fuel and its associated emissions, UConn could reduce CO2 emissions by
approximately 1.2 million pounds per year. The production and use of biodiesel was also assessed in the
Preliminary Feasibility Study and Strategic Plan for the Depot Campus.

105
Center for Clean Energy Engineering - Biogas
Center for Clean Energy Engineering Site
The Center for Clean Energy Engineering (C2E2), located at 44 Weaver Road on the Depot Campus at
Storrs, engages in advanced technological research related to clean energy technologies. C2E2 has 16,000
square feet of laboratory and office space, equipment for prototype manufacturing, cell assembly,
materials characterization, and fuel cell testing and diagnostics. C2E2 is located approximately 2,000 feet
southwest of UConn’s compost facility located off Route 32 in Mansfield.
Overview
The City of Stamford, in partnership with the U.S. Department of Energy, CH2MHILL, and Carlin
Contracting developed a demonstration scale a gasification system as part of a pilot research and
development project to demonstrate that dried and pelletized wastewater residuals (sludge) can be used as
a renewable energy source to generate electrical power.241
The City of Stamford has agreed to donate the
small scale gasification system and electric generator to UConn.
Gasification System Visibility
The small scale gasification system and electric generator, which measures approximately 8 feet by 12
feet horizontal and less than 10 feet vertical, was constructed and mounted onto a 16 foot trailer for easy
transportation. Given the system’s size, visibility considerations are expected to be minimal. If the
gasification model is located at C2E2, students from various colleges at the university can view the
system, perform experiments, and create business concepts consistent with their educational goals.
Figure 28 - Aerial View of the Compost facility and the Center for Clean Energy Engineering
241
Stamford Biogas; http://www.stamfordbiogas.com/, March 2012
N
106
Environmental Benefits of Biogas Production and Utilization
A small scale gasification system and electric generator would achieve environmental benefits by
displacing fossil fuels used to produce electricity. However, the gasification process will generate a gas
that contains carbon monoxide, carbon dioxide, hydrogen, methane, and ethane/ethylene.242
Consequently, UConn will need to ensure compliance with the Connecticut Department of Energy and
Environmental Protection air permitting requirements.
Regulatory Restrictions (Siting)
Certificates of Environmental Compatibility and Public Need are not required for “…any customer-side
distributed resources project or a facility or grid-side distributed resources project or facility with a
capacity of not more than sixty-five megawatts, as long as such project meets air and water quality
standards of the Department of Environmental Protection...”243
However, in order to confirm compliance
with applicable environmental regulations and receive a formal decision regarding the applicability of a
Certificate for a small scale gasification system and electric generator, a Petition for Declaratory Ruling
may be required to be filed with the Connecticut Siting Council. The Town of Mansfield does not
exercise jurisdiction over building improvements, such as for fuel cell systems, installed on UConn’s
campuses.244
Site Restrictions Due to Land Use / Master Planning Considerations
The Outlying Parcels Master Plan seeks to preserve the character of UConn’s Depot Campus relative to
historic features and natural beauty.245
A small scale gasification system and electric generator may be
consistent with the goals of the Master Plan. However, UConn should consider the impact that a
gasification system and electric generator may have on the character of the Depot Campus when
configuring the trailer mounted system at the site. The 2004 Sustainable Design Guidelines specifies
exploring “fuel cells and other alternative energy supply systems” and “identification of systems that
increase the operational efficiencies.”246 A small scale gasification system and electric generator located at
C2E2, would be consistent with this aspect of the 2004 Sustainable Design Guidelines. The 2006 Storrs
Campus Master Plan Update247
does not contain any information which would indicate a conflict with
deploying a small scale gasification system and electric generator at this site.
242
Stamford Bio-Gas, http://www.stamfordbiogas.com/tests_data.html 243
Connecticut General Statutes, Sec. 16-50k 244
Phone call with Mansfield Department of Building and Housing Inspection 245
University of Connecticut, “Outlying Parcels Master Plan,”
http://masterplan.uconn.edu/images/OPMP_5_22_2000.pdf, June 2000 246
University of Connecticut, “Campus Sustainable Design Guidelines,” http://masterplan.uconn.edu/images/SDG-
web.pdf, November 2004 247
University of Connecticut, “Storrs Campus Master Plan Update,” http://masterplan.uconn.edu/images/6-
0331storrs-small.pdf, January 2006
107
Capital Cost
The small scale gasification system and 7 kW electric generator would be donated by the City of
Stamford.248
As such, there would not be a substantial capital outlay associated with this project.
Operation and Maintenance Cost
Operation costs associated with collection, delivery and processing of biomass feedstock would be
minimized given C2E2’s proximity to UConn’s compost facility. UConn’s compost facility receives 10 to
15 truckloads on dry manure from UConn’s agricultural operations each week.249
The small scale
gasification system could process up to 20 kilograms (44 pounds) of biomass material per hour. The
maintenance of the biogas system would include routine maintenance for the electric generator (i.e.
changing the oil, tune up, etc.), as well as ensuring proper functionality of the system’s other components.
Economics and Funding
The economics of a small scale gasification system and electric generator may be challenged due to labor
input requirements and the amount of electricity that could be generated by the system. However, this
small scale gasification system and electric generator would be used primarily to support research for
cleaning and reforming tars in the gas stream to improve energy utilization. As such, the economic
viability of the project as an investment grade renewable energy project is not applicable.
248
Correspondence from UConn dated August 30, 2011. 249
University of Connecticut Office of Environmental Policy, “UConn Compost Facility – Facility Information,”
http://www.ecohusky.uconn.edu/facilityinfo.htm, March 2012
108
Conclusion
This Plan demonstrates the potential viability of six renewable technologies (solar thermal, solar PV,
wind, geothermal, fuel cells, and biofuels), to operate at selected facility sites on the main and Depot
Campuses at Storrs. Operations will reduce GHG emissions, support research, provide economic return
on investment with use of federal and state incentives, and will enhance community involvement.
Analytical modeling identifies the potential reduction of approximately 1,570,000 to 2,370,000 lbs/year
of GHG emissions, approximately 1,400 MMBtus of renewable thermal energy production, 3.22 to 5.05
million kWh/year in renewable electricity production, and reductions of 50,000 to 75,000 gallons per year
of diesel fuel consumption. The energy produced may include processing of waste (biomass), notably to
reduce waste management costs and produce fungible fuels (biodiesel) to be used in buildings and for
transportation in UConn’s vehicles. The deployment of these technologies is consistent with UConn’s
GHG emissions reduction efforts, economic development, state environmental policy, and federal energy
policy. Furthermore, some of the deployment sites identified herein have also been assessed within the
Preliminary Feasibility Study and Strategic Plan for the Depot Campus.

109
Appendix I - The 2009 Calculated New England Marginal Emission Rates (lb/MWh) Values250
250
ISO New England, “2009 ISO New England Electric Generator Air Emissions Report-System Planning
Department,” www.iso-ne.com/genrtion_resrcs/reports/emission/final_2009_emissions.pdf, March 2011