preliminary evaluation of hydrologic factors related to radioactive … · preliminary evaluation...
TRANSCRIPT

UNITED STATESDEPARTMENT OF THE INTERIOR
GEOLOGICAL SURVEYWater Resources Division
PRELIMINARY EVALUATION OF HYDROLOGIC FACTORS
RELATED TO RADIOACTIVE WASTE STORAGE
IN BASALTIC ROCKS AT THE
HANFORD RESERVATION, WASHINGTON
By A. M. La Sala, Jr., and G. C. Doty
Prepared in cooperation with theU.S. Atomic Energy Commission
OPEN-FILE REPORT
Richland, Washington1971
8409200378 840809PDR WASTEWM-10 PDR
CONTENTS
Page
Abstract-------------------------------------------------------------- 1
Introduction------------------------------------------------------------ 3
The physical environment of the Hanford Reservation--------------------- 7
Results of the testing program on well ARH-DC-l------------------------- 9
Lithology of the rock units---------------------------------------
Ground-water head----------------------------- 18
Hydraulic properties of the basaltic rock sequence----------------- 22
Values of transmissivity and storage coefficient from
tests of isolated zones------------------------------------- 23
Values of transmissivity from pumping tests------------------- 37
Hydraulic conductivity of the rock units---------------------- 41
Physical tests on core samples-------------------------------- 47
Chemical and isotopic characteristics of the ground water---------- 49
Reliability of samples-------------------------------------- 49
Source of the water------------------------------------------ 52
Chemical and carbon isotope characteristics------------------- 54
Conclusions and discussion- -------------------------------------- 58
Recommendations--------------------------------------------- 62
Acknowledgments--------------------------------------------------------- 64
References-------------------------------------------------------- 66
iii

ILLUSTRATIONS
Page
Figure 1. Map of the Hanford Reservation showing generalized geologic
structural features---------------------------------------- 5
2. Graphic logs showing lithology, selected geophysical
characteristics, and drilling rate for well ARH-DC-1------- 12
3. Diagram showing approximate undisturbed ground-water
head for isolated water-bearing zones in well ARH-DC-1----- 19
4. Graph showing water-level change for injection test 2
in well ARH-DC-1------------------------------------------- 26
5. Plot of H/Ho versus time for injection test 2---------------- 27
6. Diagram showing possible relationship of water-level
trends occurring during injection and swabbing tests------- 30
7. Graphic comparison of measured water levels and water
levels computed from optimum solutions for injection
tests---------------------------------------------------- 32
8. Diagrams showing flow rates in the bore of well ARH-DC-1
during pumping tests, intervals repaired by cementing,
and probable values of transmissivity of rock zones-------- 39
9. Logarithmic plot of drawdown versus time for pumping test 4
and method of computing transmissivity for leaky arte-
sian conditions -------------------------------------- 40
10. Log showing values of transmissivity and hydraulic conduc-
tivity of lithologic zones in well ARH-DC-l---------------- 42
iv

TABLES
Page
Table 1. Principal geologic units of the Hanford Reservation and
their water-bearing properties------------------------------ 8
2. Descriptions of core samples from well ARH-DC---------------- 5
3. Descriptions of core samples from test hole DDH-1------------- 16
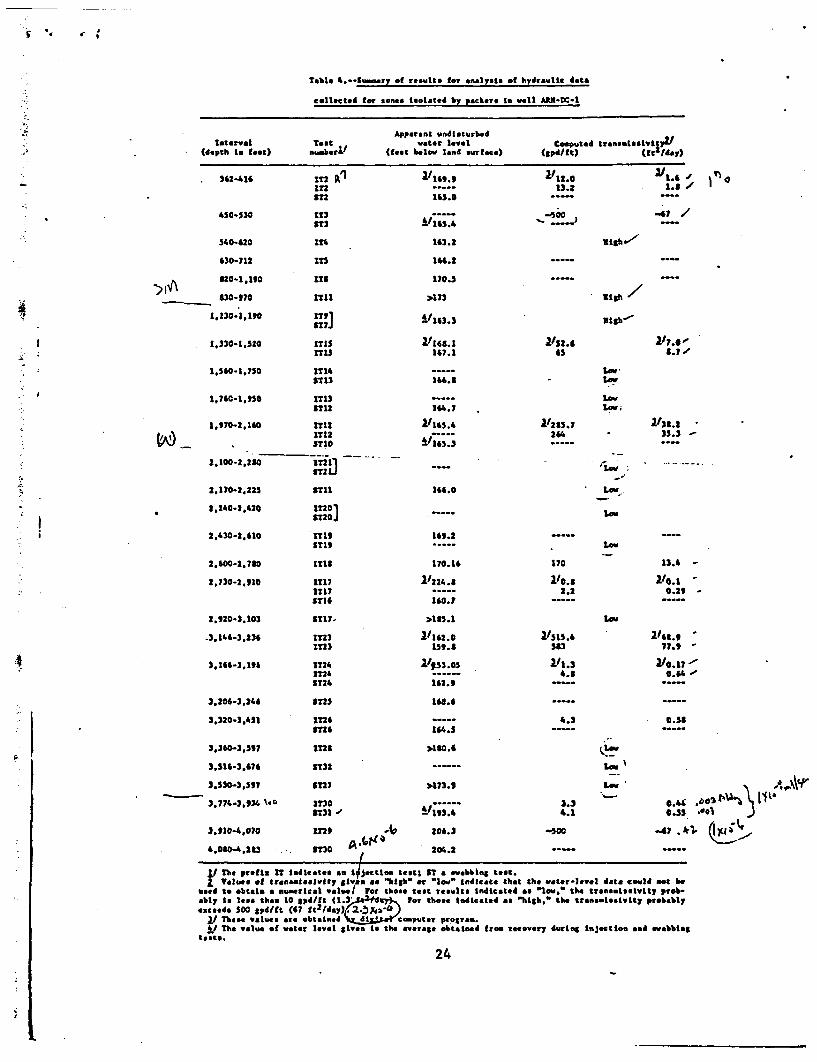
4. Summary of results for analysis of hydraulic data
collected for zones isolated by packers in well ARH-DC-1---- 24
5. Storage coefficients computed from hydraulic test data-------- 35
6. Summary of laboratory analyses of physical properties of
core samples from well ARH-DC-l----------------------------- 48
7. Chemical and isotopic analyses of water samples from
well ARH-DC-l----------------------------------------------- 50

PRELIMINARY EVALUATION OF HYDROLOGIC FACTORS
RELATED TO RADIOACTIVE WASTE STORAGE
IN BASALTIC ROCKS AT THE
HANFORD RESERVATION, WASHINGTON
By A. M. La Sala, Jr., and G. C. Doty
ABSTRACT
A preliminary study of the hydrologic factors related to the feasibility
of storing high-level radioactive wastes in deeply buried basaltic rocks of
the Hanford Reservation was begun in 1969 with the drilling of test well
ARH-DC-1. The factors of concern include the rate and direction of ground-
water movement, the characteristics of ground-water discharge, and the geo-
chemical nature of the waste-rock-water system that might affect the movement
of radionuclides. The well was drilled to 5,661 feet. Hydraulic testing to
determine the water-bearing properties of the rocks and to sample ground water
was carried out to a depth of 4,280 feet. Testing was not completed because
the well was lost following repairs to sections of the well that were caving.
Hydraulic testing consisted of (1) pumping tests which gave information
mainly on the upper 1,200 feet of the section and (2) tests of zones, ranging
from 80 to 200 feet in thickness, isolated with hydraulically inflatable pack-
ers, by injecting water or removing water with a swab. The intervals tested
using the packers were distributed throughout the well from the 362-foot depth
1

of the casing bottom to 4,280 feet in depth. Samples of ground water were
obtained during pumping tests and during swabbing of packer-isolated zones.
Analysis of the hydraulic data indicates that relatively permeable rocks
are interbedded with the basalt from about 500 feet to 1,200 feet in depth,
and that relatively permeable zones occur at depths of about 1,500 feet, 2,050
feet, 2,650 feet, 3,200 feet, and 4,000 feet. Values of hydraulic conductiv-
ity of the rock units penetrated by the well ranged from 1.6x1O 3 to 6.7 feet
per day, as computed from the injection test data.
The ground-water head in the upper basaltic rocks is about 165 feet below
the surface and varies little for most water-bearing zones to a depth of about
3,700 feet. It then decreases within a short depth interval to about 206 feet
below land surface in a permeable zone at about 4,000 feet in depth. This
lowest head is 365 feet above mean sea level and therefore is above the level
of the Columbia River to the east and south of the well. These facts suggest
that the ground water may be part of a system discharging to the Columbia River.
Samples of ground water were obtained from discrete water-bearing zones
after isolating them with inflatable packers. Analysis of the samples shows
these ground waters to be (1) high in silica, (2) high in fluoride (20 mgl),
(3) high in bicarbonate, carbonate, and pH, and (4) to have low calcium to
sodium and low calcium to magnesium ratios. The carbonate in the ground water
from 900 to 1,200 feet in depth has values of about +15 o/oo (parts perPDB
thousand), unusually positive values which, along with other characteristics,
serve to distinguish it from the ground water above and below it. The water
from a zone at 540 to 620 feet has an adjusted carbon-14 age of about 13,000
years. It, and the waters below it, have stable oxygen and hydrogen isotope
ratios that suggest that they entered the ground under colder climatic condi-
tions than those at the Hanford Reservation.
2

Under the prevailing head relationships and assuming that the observed
geohydrologic conditions are widespread, it may be feasible to store radio-
active wastes that would decay to low levels in 600 to 1,000 years in mined
cavities in thick impermeable rock layers below about 1,200 feet in depth.
However, further studies will be necessary to define the characteristics of
the ground-water system and to evaluate the conditions under which wastes
could move through the system to the human environment. An appraisal of pos-
sible areas of ground-water discharge should be made from a study of hydrologic
data available for the region of the Pasco Basin. Additional test wells
should be drilled on the Reservation to define geohydrologic conditions;
specifically the hydraulic gradients, head relationships, and the permeability
distribution in the basaltic rocks.
INTRODUCTION
A large quantity of high-level liquid radioactive wastes is stored in
below-ground tanks at the Hanford Reservation of the U.S. Atomic Energy Com-
mission. These wastes were produced almost entirely by chemical processing of
reactor fuels to extract plutonium and the bulk of the contained long-lived
radionuclides will decay to a low level of activity in about 600 to 1,000 years.
The wastes are presently contained in 149 tanks, ranging in size from
50,000 to 1,000,000 gallons, buried beneath about 10 feet of earth (Isaacson,
1969). Several alternative means of storage are under consideration, one of
which is the storage of the high-level wastes in a chamber that would be exca-
vated at depth in the basaltic rocks. This scheme requires, among other things,
(1) a body of competent rock thick enough to provide structural stability to
the chamber, and (2) a slow rate of movement of long-lived radioisotopes
through the chambered rock and surrounding rocks so that if they are carried
away from the chamber by flowing ground water they will not reach the surface

or sites of ground-water withdrawal before the radioactivity has been reduced
to a level considered to be innocuous.
In 1969, the Richland Operations Office of the U.S. Atomic Energy Commis-
sion began a formal study of the feasibility of storing high-level wastes in
a mined chamber in the basaltic rocks. The overall purposes of the study are
to investigate (1) the engineering feasibility of mining a chamber at some
depth between the surface and 4,500 feet, (2) the feasibility of different
means of handling and emplacing wastes in the chamber, and (3) the long-term
safety of the scheme. Included in the safety aspect are hydrologic factors
such as the rate and direction of ground-water movement, the characteristics
of ground-water discharge, and an appraisal of the geochemistry relevant to
chemical changes that might affect the migration and concentration of particu-
lar radionuclides.
The initial stage of the study centered around the drilling of a deep
test well, ARH-DC-1, in proximity to the waste-storage areas. (See fig. 1 for
location.) The well was planned for a depth of 7,500 feet but was drilled
only to a depth of 5,661 feet. Drilling began on April 27, 1969. Hydraulic
test data and water samples were collected to a depth of 4,280 feet. The well
was cased to a depth of 362 feet and was left open below this depth to allow
hydraulic testing and sampling of ground water. It was drilled by the rotary
method using air mist and aerated water with detergent for circulating mediums.
Bit size was 9-7/8 inch throughout the uncased interval, but the bore of the
well became considerably eroded during drilling. At a depth of 5,661 feet,
drilling was stopped so cement repairs could be made to the interval of
824-1,220 feet. On attempting to drill out the cement, the bit deviated from
the original hole. Considerable effort was made to recover the original hole,
but without success, and drilling was suspended on September 23, 1969. The

FIGURE 1.{COULD NOT BE CONVERTED TO SEARCHABLE TEXT}
The Hanford Reservation and Generalized GeologicStructural Features

overall purposes of the investigation relating to this well are:
1. To define the distribution of the ground-water head with depth.
2. To define the ground-water transmission and storage characteristics of the
basalt flows and interbedded rocks.
3. To estimate the age of the ground water.
4. To define the structural integrity of the rocks with respect to sinking a
shaft and mining a chamber.
5. To define the geochemical characteristics of the rocks and ground water in
order to predict chemical interactions with solutes containing radio-
isotopes.
6. To define the subsurface geologic structure and stratigraphy.
The U.S. Geological Survey provided assistance to the Richland Operations
Office in developing specifications for the well, in planning geophysical log-
ging and hydraulic testing in the well, and in the evaluation of results. Geo-
logical Survey personnel collected hydraulic data by conducting pumping tests,
injection tests, and swabbing tests, and by assisting in radioactive tracer
logging. The Geological Survey also made physical analyses of rock cores, and
collected and analyzed water samples from the well for chemical and isotopic
constituents. This report describes the work done by the Geological Survey,
presents summaries of the data collected along with appropriate analyses, and
gives conclusions about the ground-water system pertaining to the deep storage
of radioactive wastes. The work on the engineering aspects of rocks, the evalu-
ation of the possible chemical interactions between soluble wastes and the
rocks, and the definition of the stratigraphy and structure of the rocks is be-
ing carried on under the auspices of the Atlantic Richfield Hanford Company,
which has overall technical direction of the project.
6

THE PHYSICAL ENVIRONMENT OF THE HANFORD RESERVATION
The Hanford Reservation lies in a structural and topographic basin
through which the Columbia River flows generally southward. The basin is
bounded on the west by the Rattlesnake Hills, Yakima Ridge, and Umtanum Ridge
on the north by the Wahluke Slope which rises to the east-trending Saddle Moun-
tains; on the south by the Rattlesnake Hills and Red and Badger Mountains; and
on the east by a plateau. (See fig. 1.) The region is underlain by a basaltic
rock succession that exceeds 10,000 feet in thickness, consisting of younger
basaltic rocks of the Yakima Basalt of the Columbia River Group which
are exposed in the region and older basaltic rocks which are unexposed. Over-
lying the basalt are unconsolidated deposits consisting of gravel, sand, silt,
and clay. The stratigraphic positions and descriptions of the geologic units
are given in table 1.
The basaltic rocks are folded in a series of synclines and anticlines,
forming valleys and hills, respectively (fig. 1). Most of the Reservation is
underlain by the Pasco and Cold Creek synclines, which are the main parts of
the structural basin. Gable Mountain anticline trends across the Reservation
and separates these two synclines. Anticlinal structures form the hills bound-
ing the basin. The unconsolidated deposits partly fill the synclines and form
terraces overlapping the anticlines. Some deformation of the unconsolidated
deposits probably occurred contemporaneously with folding of the basaltic rocks,
but in general the unconsolidated deposits are undisturbed by tectonic forces.
The hydrology of the region is characteristic of a semiarid climate. The
average annual precipitation is about 6.3 inches per year. Significant peren-
nial surface-water flow occurs only in the Columbia and Yakima Rivers, which
have average annual discharges at the Reservation of 120,000 and 2,000 cubic
feet per second, respectively. Springs giving rise to some streamflow occur
7

Table l.--Principal geologic units of the Hanford Reservation and their water-bearing properties{COULD NOT BE CONVERTED TO SEARCHABLE TEXT}
in the upper part of Cold Creek valley and on the flanks of the Rattlesnake
Hills and Umtanum and Yakima Ridges. The flow from these springs generally
sinks into the ground within one-half to one mile of the origin.
Ground water occurs under artesian conditions in the basaltic rocks and
under water-table conditions in the unconsolidated deposits (table 1). Ground-
water recharge to the unconsolidated deposits occurs by (1) infiltration of
surface runoff from the ridges to the west and southwest, (2) discharge of
waste water to the ground as part of processing operations on the Reservation,
and (3) movement of water from the Yakima River year-round and, at high stages,
from the Columbia River into the deposits along its banks. Because of the low
precipitation, recharge through direct infiltration is probably insignificant.
Ground-water discharge is to the Columbia River.
The unconsolidated deposits are the most permeable of the geologic units
underlying the Reservation (table 1). These deposits contain the zone of most
active ground-water circulation on the Reservation, that is the zone in which
ground water moves comparatively rapidly and directly to the Columbia River.
This zone of circulation possibly extends into the uppermost fractured or
weathered rocks of the Yakima Basalt directly in contact with the unconsolidated
deposits. The basaltic rocks of the Reservation are less permeable than the
unconsolidated deposits. The direction and rate of movement of ground water
through them are unknown.
RESULTS OF THE TESTING PROGRAM ON WELL ARH-DC-1
The data collected during investigations on well ARH-DC-1 were utilized
in this report to (1) describe the lithology of the rocks penetrated by the
well and classify them into rock units pertinent to hydrologic investigations,
(2) describe the relationship of ground-water head to depth of the rocks, (3)
estimate the hydraulic characteristics of the rock units, and (4) describe the
9

ground water present in the rocks as to chemical and isotopic constituents
that may be indicative of the source and flow pattern of the water.
Methods of hydraulic testing and water sampling are described briefly
where appropriate to discussing the results of the program. The use of geo-
physical logs in planning and interpreting hydraulic testing and the methods
of testing using inflatable packers are the same techniques used by the U.S.
Geological Survey at the Nevada Test Site of the Atomic Energy Commission.
These techniques are described in detail by Blankennagel (1967).
Lithology of the Rock Units
The lithology of the rocks in well ARH-DC-1 was described mainly from
(1) geophysical logs made to depths of about 4,200 to 4,500 feet, (2) several
rock cores cut in the well, and (3) rock cores continuous to a depth of 1,165
feet in test hole DDH-l whose location is shown in figure 1.
Well ARH-DC-1 penetrated about 190 feet of unconsolidated deposits, con-
sisting principally of sand and gravel, and then entered the underlying basal-
tic rock sequence, which persisted to the bottom of the well at 5,661 feet.
A petroleum test well, Rattlesnake Hills Number 1 (fig. 1), drilled off the
Reservation about 12 miles southwest of well ARH-DC-1, is 10,655 feet deep and
did not completely penetrate the basaltic rock sequence (Raymond and Tillson,
1968). Therefore, a considerable thickness of basaltic rocks presumably lies
below the bottom of well ARH-DC-1.
Well ARH-DC-1 and hole DDH-l lie on the north flank of the Cold Creek syn-
cline. The rock units dip southward in this area, but the rocks appear to be
structurally uncomplicated and to exhibit a normal stratigraphic succession.
In interpreting the character of the rocks penetrated by the well, infor-
mation contained in reports by Bingham and Grolier (1966), Brown (1968),
Mackin (1961), and Schmincke (1967), which describe the lithology and
10

relationship of the basaltic rocks and interbedded sediments exposed in the
region, was found useful. Raymond and Tillson's (1968) evaluation of the geo-
physical logging characteristics of the rocks in the Rattlesnake Number 1 well
provided background information on interpreting the geophysical logs from well
ARH-DC-l.
A lithologic log of well ARH-DC-l is given in figure 2. Also included in
the figure to illustrate the geophysical logging characteristics that were con-
sidered in interpreting the lithology are density, electrical, caliper, and
gamma-ray logs. Other geophysical logs made in well ARH-DC-1 were dual induc-
tion laterolog, sidewall neutron porosity, borehole compensated density, bore-
hole compensated sonic, microlaterolog-microlog, single receiver-variable den-
sity sonic, borehole televiewer, temperature, radioactive tracer, casing collar
locator, variable density 3-D sonic, and velocity. These logs were also
studied in preparing the lithologic log, but are not presented here. They are,
however, included in a report by Fenix and Scisson, Inc. (1969). Cuttings and
drilling-rate logs prepared by contractors are also shown in figure 2. The
cuttings are not always indicative of the material being drilled at a particu-
lar depth, because they may mix with cuttings or materials that slough from
the walls of the well. Drilling rate is dependent on the resistance of the
rock but also on such factors as sharpness of the drill bit, speed of rotation,
and weight carried on the bit. The cuttings and drilling-rate logs do tend to
indicate sections of resistant basalt and soft sediments.
The interpretations of lithology from the available logging information
were keyed to descriptions of core samples from well ARH-DC-l by R. E. Brown,
Battelle Memorial Institute, Pacific Northwest Laboratory, and to descriptions
of core samples from hole DDH-1 by A. G. Lassila, U.S. Atomic Energy Commission,
Richland Operations Office. These descriptions are given in tables 2 and 3,
11
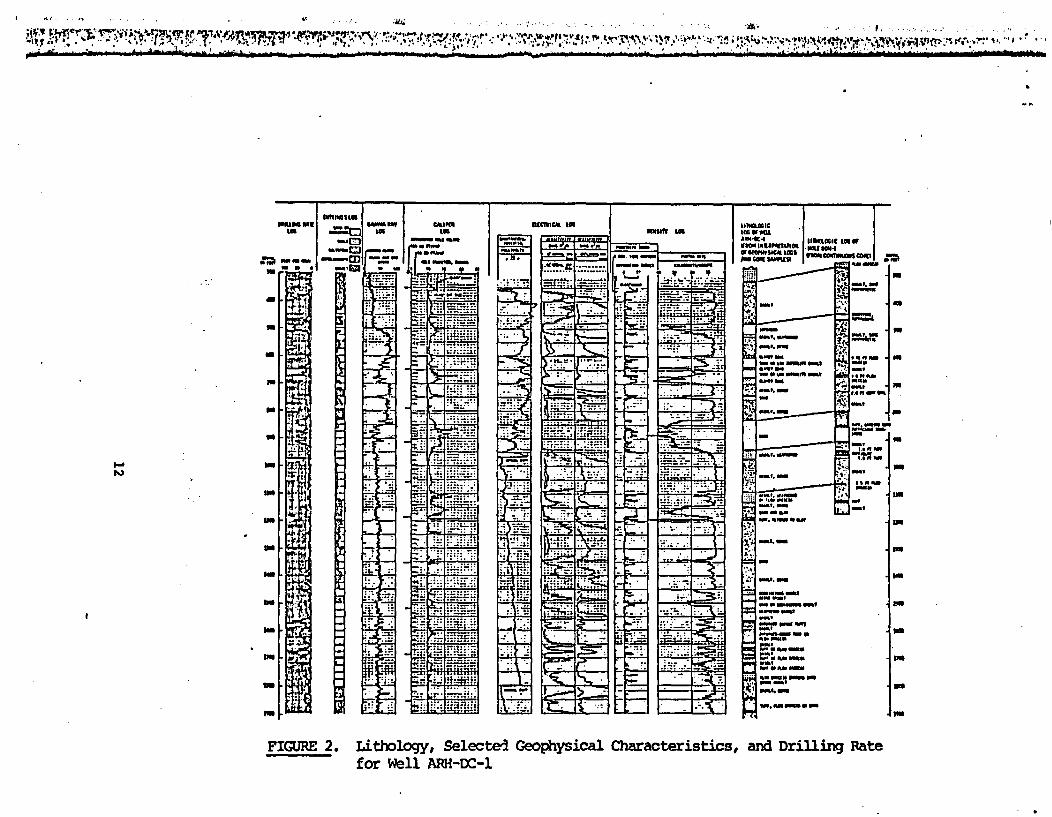
FIGURE 2. Lithology, Selected Geophysical Characteristics, and Drilling Ratefor Well ARH-DC-l

{COULD NOT BE CONVERTED TO SEARCHABLE TEXT}

{COULD NOT BE CONVERTED TO SEARCHABLE TEXT}

Table 2.-Descriptions of core samples from well ARH-DC-{COULD NOT BE CONVERTED TO SEARCHABLE TEXT}

{COULD NOT BE CONVERTED TO SEARCHABLE TEXT}

respectively. The tentative stratigraphic correlation of the rocks in well
ARH-DC-1 and hole DDH-1 are indicated in figure2 and reflect the southward dip
of the rocks off the flank of Gable Mountain anticline.
On the geophysical logs, competent dense basalt shows high electrical
resistivity, high density, and high sonic velocity. Sedimentary rocks show
different characteristics arising from their low electrical resistivity, low
density, and low sonic velocity. Gamma-ray activity of rocks is a function
of their radioisotope concentration and density. Cemented or compacted sedi-
ments, vesicular basalt, flow breccia, and palagonite may show various inter-
mediate characteristics. Thick zones of basalt, such as those from 325 to 480
feet and from 2,966 to 3,166 feet are readily identified on the geophysical
logs, as are the sedimentary sections at depths of about 500 and 900 feet.
Zones in which one or more geophysical characteristics are different from
those for competent basalt or soft sediments are more difficult and less cer-
tain of interpretation. In such instances, the authors made a judgment about
the types of rocks likely to have such logging characteristics. For instance,
the rocks in the zone from 1,090 to 1,120 feet have a low resistivity, a den-
sity and sonic velocity somewhat less than dense basalt, and a gamma-ray
activity similar to the overlying competent basalt. The caliper log shows a
rough, eroded well bore, which indicates that the rock is not competent. The
gamma log is interpreted as indicating the rock is basaltic, but the low resis-
tivity indicates that it contains water-filled openings. The rock may, there-
fore, be a weathered basalt or a flow breccia.
It can be expected that the authors' lithologic log will be revised as
more information is developed on the geophysical properties of the rocks under-
lying the Reservation. For purposes of this report, the lithologic log is sig-
nificant for identifying units that have distinctive physical and hydraulic
properties.
17

Ground-Water Head
The water level in an unpumped well is a composite of the heads in the
various water-bearing openings penetrated by the well. The position of the
water level is, in part, affected by movement of water through the well from
zones with higher head to zones with lower head. The water level approaches
an equilibrium that depends on the relative heads and the transmissivity of
the various water-bearing zones. Direct measurements can be made of the head
in discrete water-bearing zones penetrated by the well by isolating hydrauli-
cally the zone of interest in the well. This is done with packers operated by
a tool carried on a string of tubing that extends to the surface. The tubing
can be connected hydraulically to the isolated zone after setting the packers,
and the head in the zone can be measured as a depth to water in the tubing.
The measurements of ground-water head in well ARH-DC-1 through use of
such a packer tool are shown in figure 3. These data are not precise repre-
sentations of the undisturbed heads in the rocks, because of several factors.
Drilling the well had considerable influence on the heads. Circulation of air
mist and, during subsequent stage of drilling, aerated water removed ground
water from the rocks and in some cases caused the rocks to be invaded by air.
Pumping or blowing the well to clean out drilling fluid and facilitate collect-
ing water samples caused a lowering of head, particularly in the more permeable
zones. Other effects were caused by circulation of water between zones through
the well during geophysical logging and hydraulic testing. This caused a reduc-
tion of head in zones contributing water and an increase in head in zones receiv-
ing water. Recovery of water levels from these various effects doubtless was
occurring to some degree at the times most zones would be isolated by packers.
The method of hydraulic testing also produced an effect on the head in
the isolated zone. To both conduct injection tests and check functioning of
18

{COULD NOT BE CONVERTED TO SEARCHABLE TEXT}FIGURE 3. Approximate Undisturbed Ground-Water Head for Isolated
Water-Bearing Zones in Well ARH-DC-1

the packer tool, it was necessary to begin a test with the tubing filled with
water, so that a decline in water level signaled that the tool had opened to
the test zone. The water in the tubing created an increase in head in the
test zone, and measurements of the rate at which this head decayed provided
information on the hydraulic properties of the rock. However, to obtain a
measurement of the undisturbed head it would be necessary to wait for complete
decay of the additonal head imposed by the water in the tubing. In general,
this was impractical because of the time involved, and measurements were con-
tinued only until the rate of change of water levels was small. Most zones
were tested also by swabbing, a technique which withdraws water from the tubing
and lowers the head on the test zone. Recovery of water level was measured
until the rate of change was small. In general, then, it was assumed that the
undisturbed head would be between the lowest water level measured following
injection and the highest water level following swabbing. A value for undis-
turbed head was picked by extending the trends of graphs of the water-level
recoveries, or, where the rate of change was very slow, by taking the median
value between the lowest recovery level following injection and the highest
recovery level following swabbing. In general, these values were within 3 feet
of one another. These values for undisturbed heads were satisfactory for com-
puting hydraulic constants of the rocks as will be explained later. However,
there was no definite method by which antecedent effects on undisturbed head
due to influences from drilling or circulation through the well could be
evaluated. The original plan was to complete the well with several piezometers
finished in representative water-bearing zones. Measurements of water level
or pressure over several months would then have shown if the heads in these
zones were recovering from such disturbances and eventually would have provided
true values of undisturbed heads for comparison with the data obtained from
20

hydraulic tests. The well bore at depth, unfortunately, was lost following a
cementing operation and could not be relocated within the limitations of the
funds that were available.
The differences among the heads in different zones shown in figure 3 are
probably significant only with regard to major characteristics of the head
distribution. Small differences between adjacent zones may be due only to
effects of particular antecedent conditions or measuring errors. The distri-
bution of head with depth does show some significant characteristics, however,
in different parts of the well. From 362 feet (the depth of casing during the
hydraulic testing) to about 2,700 feet, the water level generally ranges from
165 to 170 feet below land surface. Zones from 540-620 feet and 1,760-1,950
feet in this depth interval have slightly higher measured heads and zones
from 820-1,190 and 2,600-2,780 feet have slightly lower heads. In the depth
interval from about 2,800 to 4,280 feet, the heads in the zones tested range
widely. The relatively high heads measured in the zones, 2,730-2,910 feet,
3,146-3,236 feet, and 3,166-3,196 feet are at variance with the lower heads in
adjacent zones. The heads in the depth interval from 2,800 to 3,450 feet may
well be relatively high and between 160 and 165 feet below land surface. It
should be noted that the higher heads measured were unlikely to be caused by
any factor other than entrapment of drilling air. However, the hydraulic-test
data did not indicate the presence of air in the rocks. The relatively low
heads in the test zones in the depth interval 2,800 to 3,600 feet may be indi-
cating drawdowns resulting from the production of water during drilling. The
rocks in these zones have very low permeability, and because they were tested
for the most part within one day after drilling was suspended, the heads may
not have recovered from production of water during drilling. Winograd (1970,
p. 20-21) points out that in low-permeability rocks at the Nevada Test Site,
recovery of water levels in wells usually requires a few days.
21

The relatively low water levels measured in the interval from 3,800 to
4,280 feet represent a real difference in head with respect to the heads
higher up the hole. Temperature logs and radioactive tracer logs of the well
both indicated downward movement of water from upper zones with higher heads
to about the depth of 4,000 feet. The head measured in the zone 3,910 to
4,070 feet may be higher than the undisturbed head because of the recharge
the zone received by the downward flow of water through the well.
Hydraulic Properties of the Basaltic Rock Sequence
The capacity of rocks to transmit and store water is described by the
magnitudes of hydraulic conductivity and storage coefficient, respectively.
The hydraulic conductivity is a measure of the rate at which a rock will trans-
mit water under field conditions and can be given with the dimensions of (1)
units of length per unit of time for a unit head loss or, equivalently, (2)
as a volume rate of flow per unit cross sectional area at a right angle to the
direction of flow under a unit hydraulic gradient. The storage coefficient
describes the characteristics of a rock in storing and releasing water. It is
a dimensionless number representing the volume of water released from or taken
into storage per unit surface area of the aquifer per unit change in head. In
confined aquifers, such as occur in the basaltic rocks, the storage coefficient
is determined principally by the elastic properties of the aquifer and the con-
fining beds and by the compressibility of water. In making field tests in
wells, the hydraulic conductivity cannot be determined directly. Instead, the
parameter "transmissivity" is determined. Transmissivity is equal to the aver-
age hydraulic conductivity multiplied by the thickness of the water bearing
zone. It is defined as the rate at which water is transmitted through a unit
width of the aquifer under a unit hydraulic gradient.
22

In well ARH-DC-1, tests were made to determine values of transmissivity
of the rocks by (1) isolating zones between packers, using the tool mentioned
previously in the section on ground-water head, and injecting water from the
filled tubing or withdrawing water from the tubing with a swab; and (2) by
pumping from the well itself using a submersible pump. The most reliable data
on transmissivities of isolated water-bearing zones were provided by the injec-
tion tests on zones isolated by packers. Swabbing of isolated zones and pump-
ing from the section open to the well were done primarily to obtain water sam-
ples, and the hydraulic effects produced by these operations could, in most
tests, be used only for order-of-magnitude estimates of transmissivity. Meas-
urements of hydraulic conductivity also were made in the laboratory on samples
of basalt obtained from cores cut in well ARH-DC-1.
Values of Transmissivity and Storage Coefficient
from Tests of Isolated Zones
The transmissivity values of test zones computed from the water-level
data obtained during injection and swabbing tests are summarized in table 4.
These computations were done by the method of Cooper, Bredehoeft, and
Papadopulos (1967), who present a solution for the change in water level in a
well of finite diameter after a known quantity of water is instantaneously in-
jected or withdrawn. These authors present a set of type curves computed from
this solution, which permits a determination of the transmissivity of an arte-
sian aquifer through a curve-matching technique. The aquifer is homogeneous,
of uniform thickness, and bounded top and bottom by impermeable rocks. This
solution is developed for a model in which a nonflowing well is cased to the
top of the artesian aquifer and is screened or open throughout the entire
thickness of the aquifer. When a well is instantaneously charged with a quan-
tity of water (as was done in the injection tests on well ARH-DC-1) or a
23
{COULD NOT BE CONVERTED TO SEARCHABLE TEXT}

quantity of water is withdrawn instantaneously (a procedure approximated by a
single pass swab test), the water level in the well instantaneously moves to
a new level and then begins to return to its original level. The solution
ignores only inertial forces on the column of water in the well, which are
small, and therefore is virtually exact.
In these authors' method for computing transmissivity, a semi-log plot of
the quotient of the head, H. divided by the initial head, HO versus the time,
t, at which H occurs, is matched to a family of type curves of H/HO versus the
expression Tt in which T is transmissivity and rc is the radius of the casing
or pipe to which the slug of water is added or removed. Each curve of the
family corresponds to a value of in which r is the radius of the
open well bore and S is the storage coefficient. The transmissivity can then
be computed by substituting the values for any match point in the relation-
ship
where
the value of at the match point,
y -the value of t at the match point.
This method of computation is illustrated using the data for injection
test 2, which are shown in figure These data are used to prepare the
plot of H/HO versus t, which is then matched to the family of type curves as
illustrated in figure 5. A match point is then selected and the appropriate
values are used to compute the transmissivity as is done in figure 5. As can
Water-level measuring instruments used in field studies were calibratedin meters. Actual field measurements are given in meters throughout this report.
25
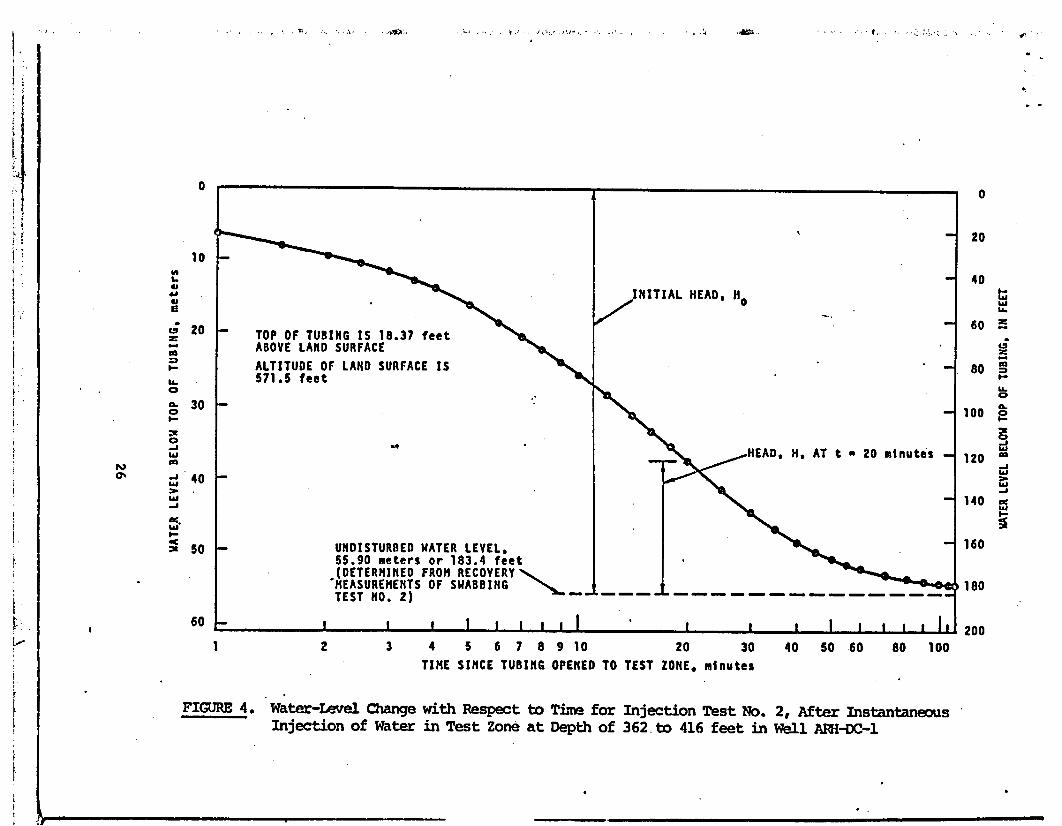
FIGURE 4.{COULD NOT BE CONVERTED TO SEARCHABLE TEXT}
Water-Level Change with Respect to Time forInjection of Water in Test Zone at Depth of
Injection Test No. 2, After Instantaneous362.to 416 feet in Well ARh-DC-1

FIGURE 5.{COULD NOT BE CONVERTED TO SEARCHABLE TEXT}
Plot of H/Ho Versus Time for Injection Test No. 2,matched to Type Curves of Cooper and others (1967),and Computation of Transmissivity

be seen in figure 4, it is necessary to determine the heads required for plot-
ting H/Ho in figure 5 from the water levels measured in the tubing and the un-
disturbed water level in the test zone. For an injection test, the initial
head is the difference in height between the water level in the completely
filled tubing and the undisturbed water level in the test zone. At time, t,
after the tool was opened, the corresponding head, H, is the difference in
height between the water level in the tubing and the undisturbed water level.
The data curve in figure 5 matches the type curve only in the central
region. This observation is generally true for the injection test data on the
well and may be explained as resulting from (1) antecedent effects on the water
level from drilling or within-hole circulation, as was explained in the section
on ground-water head; (2) lack of precision in determining the undisturbed head
because recovery measurements following injection and swabbing could not be
continued long enough; (3) significant departure of the physical situation dur-
ing a test from the model of Cooper and others (1967); or (4) malfunction of
the packer tool. With respect to these four explanations, only malfunction of
the packer tool could be directly investigated by means of pressure charts pro-
vided by the contractor operating the tool. The physical situation existing
during a test could be controlled only to the extent of setting the packers
against apparently dense rock, in zones bf high electrical resistivity which
were presumed to be of low permeability, so that vertical movement of water out
of the test zone would be at a minimum. Recovery of water levels from ante-
cedent conditions could in some tests be recognized from a plot of the water
levels during injection versus time, but the magnitude of the effect could not
be determined. If water levels were recovering from some antecedent conditions
during an injection test, then the actual heads existing during an injection
test would be greater than the heads indicated from the water level measured
28

several hours later at the end of recovery following a swabbing test. This
condition is shown diagrammatically in figure 6.
Because of the uncertainty as to the exact heads existing during the hy-
draulic tests, a computer program was developed to optimize the field data and
to obtain an optimal fit to the type curves of Cooper and others (1967). Pro-
gramming was done by Computer Sciences Corporation, and computations were made
on that firm's computer at the Richland Federal Building, under a contract
with the Atomic Energy Commission. Cooper and others (1967) give a table of
values for particular solutions of the theoretical equation, which were used
to plot the type curves. These values were used to generate a surface to which
it was attempted to fit the injection-test data, through an iterative procedure
by allowing transmissivity, alpha, and initial head to vary freely. Varying
initial head in the program also had the effect of varying each measured head
by the same increment. Thus, the optimum solution for an injection test gave
an Ho (numerically equivalent to the undisturbed water level in the test zone)
that was arrived at by a procedure that averaged the effect of any change in
head in the test zone that occurred as a result of conditions antecedent to
the test. A graduated correction to account for a water-level trend could have
been applied to the heads measured during a test but would have been impracti-
cable from the standpoint of the computing time required. As the program was
written, solutions generally required about 20 seconds of machine time. To
facilitate computations, values of transmissivity, alpha, and initial head are
estimated from a data plot and are used in the initial iteration. In running
the program, iterations usually produced values that were beyond the bounds of
the type surface. However, solutions could be obtained by changing the initial
values of the three parameters.
29

FIGURE 6.{COULD NOT BE CONVERTED TO SEARCHABLE TEXT}
Possible Relationship of Water-Level TrendsOccurring During Injection and Swabbing Tests

The results of the computer analysis of injection test data are given in
table 4 and figure 7. In order to test the solutions obtained, the optimum
values of transmissivity, alpha, and Ho were used to compute theoretical water
levels. The measured water levels and computed water levels agree closely,
as shown in figure 7. The optimum values of initial head computed from the
data also agree closely with the undisturbed water levels determined from re-
covery following injection and swabbing, with the exception of injection tests
17 and 24. It can also be seen that the transmissivity obtained by graphic
analysis of injection test 2 in figure 5 is of the same order of magnitude as
that obtained from the digital computer analysis as shown in figure 7. Graphic
analysis and computer analysis did, in all six tests of figure 7, give trans-
missivity values that were in reasonable agreement (table 4). The computed
optimum water levels are somewhat lower than the measured levels and may indi-
cate that (1) there was generally an upward trend in water level in the test
zones due to recovery from an antecedent drawdown, or (2) the test situations
deviated somewhat from the model of Cooper and others (1967). Vertical leak-
age, for example, would have caused the test zones to take in water at a some-
what faster rate than if flow were entirely lateral and it would appear that
the heads were somewhat greater than those actually existing. In injection
tests 17 and 24 in which the computed initial head is much greater than that
indicated by the field data, vertical leakage may have been considerable. It
is also possible that the computer program provided a local fit in these two
cases.
Storage coefficients for the tests solved with the computer program are
given in table 5 from the optimum values of alpha. Hydraulic tests utilizing
only one well, as did these, generally are not considered suitable for deter-
mining the storage coefficient. Cooper and others (1967) state that their
31

7. Graphic Comparison of Measured Water Levelsand Water Levels Computed from OptimumSolutions for Injection Tests
FIGUR
32

{COULD NOT BE CONVERTED TO SEARCHABLE TEXT}

INJECTION TEST NO. 23{COULD NOT BE CONVERTED TO SEARCHABLE TEXT}

Table 5.--Storage coefficients computed from hydraulic test data{COULD NOT BE CONVERTED TO SEARCHABLE TEXT}

graphical method of solution is relatively insensitive to variations in the
value of the storage coefficient. However, because a high degree of mathe-
matical precision was obtained with the digital computer, the sensitivity with
respect to the storage coefficient was improved somewhat over the graphical-
solution methods. The storage coefficients are, therefore, presented as order
of magnitude values, which would certainly be revised if suitable pumping-test
data were available.
Swabbing tests in which only one swab run was made can be analyzed in the
same manner as an injection test, except that the initial head is the initial
drawdown created by the swab. This initial head is computed indirectly, and
with low precision, from the quantity of water withdrawn by the swab and from
the undisturbed water level. The quantity of water withdrawn by the swab
could not be measured exactly because some water was always spilled and be-
cause the calibrated tank in which the water was collected and measured was
large and had a low sensitivity. Swabbing also produced some uncertain effects
by (1) creating a suction head on the test zone as the swab was lifted clear
of the water, and (2) creating an extraneous head by water leaking around the
swab and back down the tubing. It was possible then for the water-bearing
zone to receive three pulses, consisting of (1) the intended negative pulse
from withdrawing water from the tubing, (2) a positive pulse due to suction,
and (3) a later positive pulse from leakage. For the foregoing reasons, the
swabbing-test data were analyzed only to determine if they gave results of the
same order of magnitude as those obtained for corresponding injection tests.
Swabbing tests in which multiple swabbing runs were made could be analyzed
to determine transmissivity only by the method of Skibitzke (Ferris and others,
1962, p. 103-104). The assumption on which Skibitzke's model is based, that a
well is a line sink, does not allow an exact solution. If the number of swab
36

runs is very great, and the time between runs and the quantity withdrawn on
each run vary, the computations are long and tedious. Therefore, computations
were simplified by treating blocks of swab runs as being uniformly spaced in
time and as producing a uniform quantity of water. The values of transmissiv-
ity obtained were considered only from the standpoint of their orders-of-magni-
tude and to investigate the possibility that swabbing caused significant in-
crease in the transmissivity of the test zone by removal of cuttings or en-
trapped air.
Values of Transmissivity from Pumping Tests
Four pumping tests were run during testing sequences when well ARH-DC-l
was variously at depths of 712, 1,190, and 2,242 feet. As no nearby wells were
available, measurements of drawdown and recovery could be made only in well
ARH-DC-1. These tests were run in connection with pumping to clean the well
of drilling fluid, to sample the ground water, and to develop the water-bear-
ing zones, and not primarily to obtain hydraulic data. Because of this, and
because some difficulties were encountered in maintaining constant pumping
rates, the pumping-test data do not lend themselves well to analysis. Further-
more, in each time interval between pumping tests, cementing repairs were made
to the well. The cement did not stop the flow of water from the cemented zones
into the well during drilling or pumping, but undoubtedly had some effect in
reducing the flow. Despite the obvious difficulties with the pumping tests,
the data were analyzed so that some approximate values of transmissivity
could be obtained for permeable zones above 1,200 feet that could not be ade-
quately tested by injection.
During the pumping tests when drawdowns became relatively stable, a radio-
active tracer log was made of the well. In this procedure, a small quantity
of iodine-131 is ejected from a logging tool into the water in the well, and
37

its movement is followed by means of a detector in the tool. Approximate flow
rates of the water in the well can be computed from the data obtained, and the
relative contributions of different zones of rock can be estimated. The re-
sults of the tracer-ejector surveys obtained during pumping tests are suma-
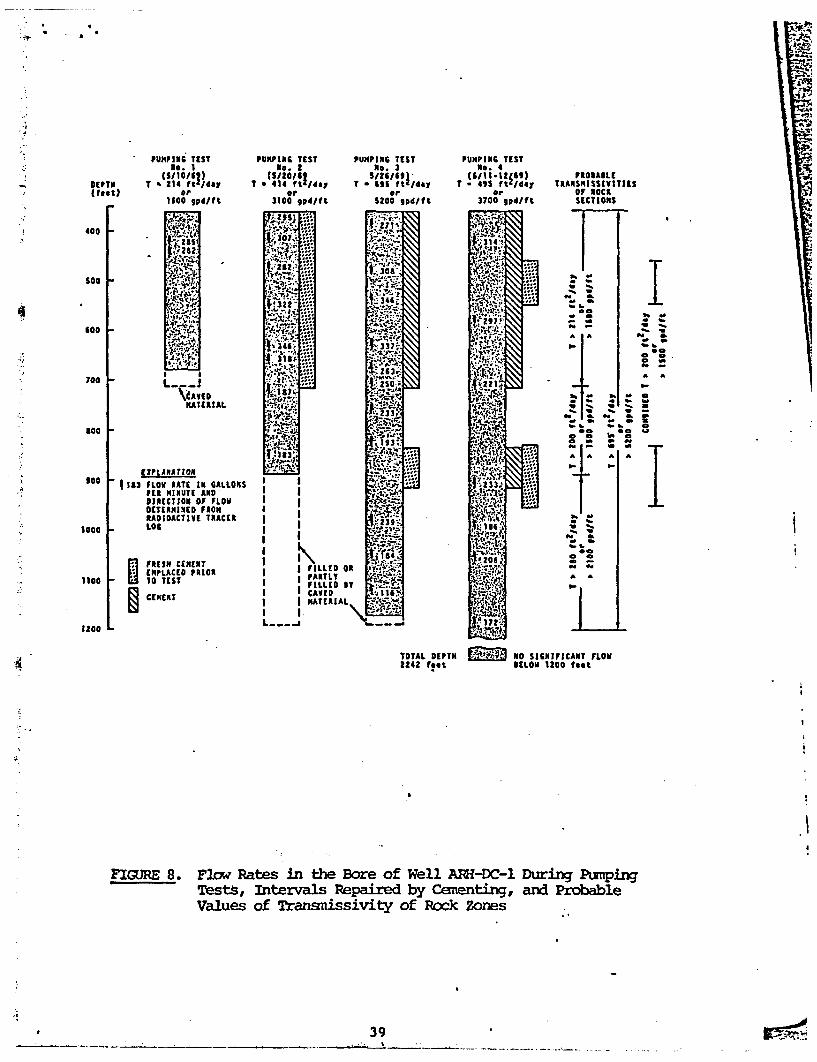
rized in figure 8. Because the flow rates measured in the tracer-ejector sur-
veys are not precise, only large percentage differences in flow are significant.
The zones that were repaired by cementing are also shown, and it is obvious from
the data that cementing did not entirely stop the flow of water from the perme-
able zones.
The transmissivity values obtained from the pumping tests apply mainly to
relatively permeable zones at depths of about 480-515, 596-700, 740-754, 830-936,
and 1,100-1,200 feet. Logarithmic plots of water level during. pumping versus
time of pumping most closely match type curves developed for leaky artesian con-
ditions, as described by Hantush (1956). As an example, the determination of
transmissivity for pumping test 4 by a graphical method given by Walton (1962)
and based on Hantush's solution (1956) is shown in figure 9. Data of a lesser
quality are available for pumping tests 1, 2, and 3. The curve fits obtained
may be fortuitous. As is recommended later in the report, more closely con-
trolled pumping tests using two or more observation wells would be necessary
to evaluate the hydraulic conditions of the aquifers in this rock section. The
estimated values of transmissivity from the pumping-test data are summarized
below and also are given in figure 8.
EstimatedPumping test Depth of well transmissivity
number (feet) (gpd/ft)
1 1 712 1,6002 1,190 3,1003 1,190 5,2004 2,242 3,700
1/ Hole filled by caving material from 890-1,190.
38
{COULD NOT BE CONVERTED TO SEARCHABLE TEXT}

{COULD NOT BE CONVERTED TO SEARCHABLE TEXT}

It can be seen from figure 8 that the permeable zones centering at 500
and 900 feet were recemented between the running of pumping tests 3 and 4.
This recementing caused a decline of 1,500 gpd/ft (gallons per day per foot)
in transmissivity for the nearly identical sections to which the transmissivity
values apply. It should be noted from the trace ejector survey that during
pumping test 4 the section of the well below 1,200 feet contributed little
water to the discharge from the well. By appropriately summing or subtract-
ing the transmissivity values determined from the pumping tests, the trans-
missivities of different zones of rock open to the well can be determined, as
is shown in figure 8.
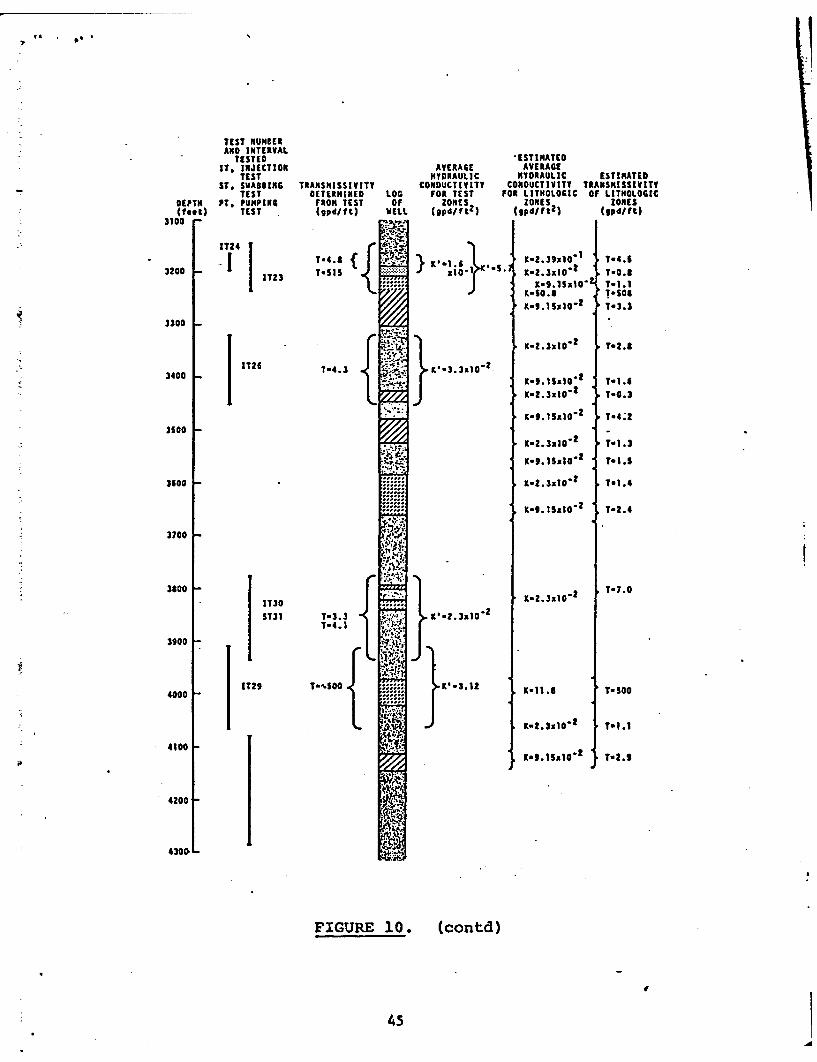
Hydraulic Conductivity of the Rock Units
The values of transmissivity determined from injection tests on isolated
zones and from pumping tests were used to estimate the average values of hy-
draulic conductivity of the rocks in the units identified in the lithologic
log of figure 3. The estimated values of hydraulic conductivity are shown in
figure 10 for the rocks to a depth of 4,280 feet, for which hydraulic tests
and geophysical logs are available.
The analysis by which the hydraulic conductivity values were estimated is
based on the following considerations. For at section of rock composed of multi-
ple units, the transmissivity can be defined as
where
are the hydraulic conductivity values of
the rock units,
are the thicknesses corresponding to
T is the transmissivity.
41

FIGURE 10.{COULD NOT BE CONVERTED TO SEARCHABLE TEXT}
Values of Transmissivity and Hydraulic Conductivityof Lithologic Zones in Well ARH-DC-1

{COULD NOT BE CONVERTED TO SEARCHABLE TEXT}

{COULD NOT BE CONVERTED TO SEARCHABLE TEXT}
{COULD NOT BE CONVERTED TO SEARCHABLE TEXT}

In the equation stated above, the terms K ml, K2 m K m each refer to
a discrete unit of rock. If in a well, geophysical logs and core samples allow
classification of the individual rock units into lithologic types having simi-
lar permeabilities, class terms can be substituted for Kjml, K2m2,
In well ARH-DC-1 the following classes of rock could be identified:
Dense basalt
Basalt having healed fractures and joints
Vesicular basalt
Flow breccia
Basalt with open fractures
Gravel
Sedimentary interbeds
For each hydraulic test, an equation could be written in the form of the
equation above but containing class terms. As multiple tests were performed,
a family of simultaneous equations results, which can be solved for the values
of hydraulic conductivity of the commonly occurring individual rock units.
Data were insufficient for computing the hydraulic conductivity of each rock
unit. Where the hydraulic conductivity could not be computed, it was estimated
by comparing the geophysical logging characteristics of that unit with the char-
acteristics of units for which the hydraulic conductivity values were computed.
In using the values of hydraulic conductivity in figure 10, it should be re-
called that all these values are based on interpretive relationships developed
between the geophysical logging characteristics of the rocks and the transmis-
sivity values determined in hydraulic tests. When more information is obtained
on the geophysical properties and transmissivity of the rocks, the hydraulic
conductivity values given in figure 10 will probably be changed through reinter-
pretation.
46
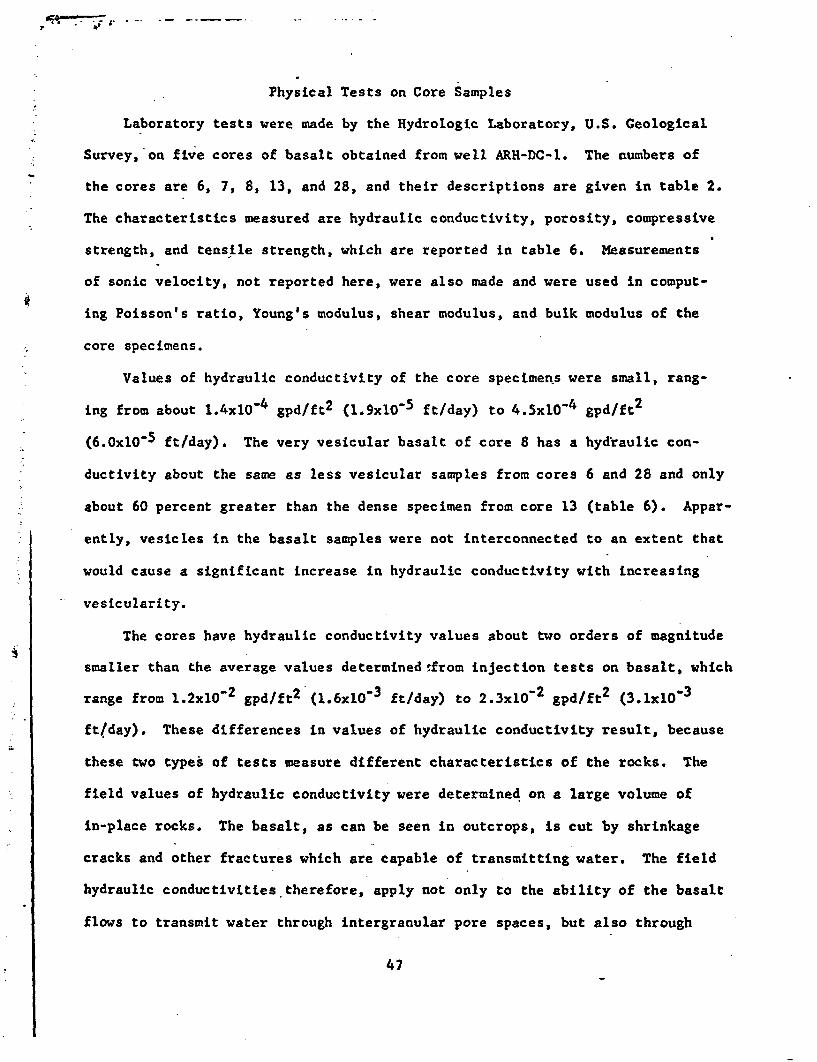
Physical Tests on Core Samples
Laboratory tests were made by the Hydrologic Laboratory, U.S. Geological
Survey, on five cores of basalt obtained from well ARH-DC-1. The numbers of
the cores are 6, 7, 8, 13, and 28, and their descriptions are given in table 2.
The characteristics measured are hydraulic conductivity, porosity, compressive
strength, and tensile strength, which are reported in table 6. Measurements
of sonic velocity, not reported here, were also made and were used in comput-
ing Poisson's ratio, Young's modulus, shear modulus, and bulk modulus of the
core specimens.
Values of hydraulic conductivity of the core specimens were small, rang-
ing from about 1.4xlO 4 gpd/ft2 (1.9x10⁻⁵ ft/day) to 4.5x10⁻⁴ gpd/ft2
(6.OxlO-5 ft/day). The very vesicular basalt of core 8 has a hydraulic con-
ductivity about the same as less vesicular samples from cores 6 and 28 and only
about 60 percent greater than the dense specimen from core 13 (table 6). Appar-
ently, vesicles in the basalt samples were not interconnected to an extent that
would cause a significant increase in hydraulic conductivity with increasing
vesicularity.
The cores have hydraulic conductivity values about two orders of magnitude
smaller than the average values determined -from injection tests on basalt, which
range from 1.2xlO 2 gpd/ft2 (1.6xl0 3 ft/day) to 2.3xlO 2 gpd/ft2 (3.lxlO 3
ft/day). These differences in values of hydraulic conductivity result, because
these two types of tests measure different characteristics of the rocks. The
field values of hydraulic conductivity were determined on a large volume of
in-place rocks. The basalt, as can be seen in outcrops, is cut by shrinkage
cracks and other fractures which are capable of transmitting water. The field
hydraulic conductivities therefore, apply not only to the ability of the basalt
flows to transmit water through intergranular pore spaces, but also through
47

{COULD NOT BE CONVERTED TO SEARCHABLE TEXT}

fractures. The laboratory tests were made on small cylinders of rock that
were selected to be free of open fractures and, therefore, indicate the hy-
draulic conductivity dependent on movement through intergranular pore spaces.
The results of the tests indicate that the hydraulic conductivity of basalt
flows results mainly from fractures.
Chemical and Isotopic Characteristics of the Ground Water
Ground-water samples were collected from well ARH-DC-l both by pumping
from the entire well bore using a submersible pump and by swabbing from se-
lected isolated zones. The samples were analyzed for dissolved chemical con-
stituents, tritium content, deuterium-hydrogen ratio, and oxygen-18-oxygen-16
ratio. A carbon-14 age determination was also made on one sample. The data
obtained from analyses are given in table 7. The interpretations of the ana-
lytical results given in the following sections were made mainly by
F. J. Pearson, U.S. Geological Survey.
Reliability of Samples
Tritium is useful in this investigation as an indicator of the quantity
of drilling water present in a sample. Meteoric and surface waters are high
in tritium. The Columbia River, for instance, during 1969 had a tritium con-
tent that generally ranged from 300 to 600 TU: (tritium units; 1 TU - 10 18
tritium atoms per hydrogen atom). Ground water of recent origin is also high
in tritium. However, as ground-water movement generally is very slow and
tritium decays rapidly, having a half-life of about 12.3 years, and there are
no natural sources of tritium underground, ground water is ordinarily low in
tritium. Considering these facts, the ground-water samples obtained from well
ARH-DC-1 were analyzed for tritium to determine if they were representative of
the formation water.
49

{COULD NOT BE CONVERTED TO SEARCHABLE TEXT}
The water used to make up the drilling fluid was obtained from the Reser-
vation water supply, the source of which is the Columbia River. One analysis
made on the drilling fluid showed a tritium content of 418 TU. The analyses
for the ground-water samples from the intervals 362-890, 362-1,190, 1,090-
1,280, and 3,146-3,236 indicate that normally the tritium content of the
ground water is at no more than about the level of detection, 1 TU. The trit-
ium determinations, therefore, indicate the extent of contamination of the
samples with drilling fluid left in the well when drilling was stopped. In
general, based on a mass balance, the samples contain 0.25 to 1 percent drill-
ing fluid. Those samples that are high in tritium were collected (1) presum-
ably before the test zone was swabbed sufficiently, as with the samples from
362-416 feet, 450-530 feet, and 3,206-3,246 feet; or (2) during a test when
leakage is suspected to have occurred around the packer tool, as inferred from
hydraulic data or pressure records, as with the samples from 980-1,120,
1,330-1,520, and 2,600-2,780 feet. The samples from 1,330-1,520, and
2,600-2,780 feet are grossly contaminated with nonformation water and should
not be used for geochemical interpretations. The chemical constituents in the
sample from 2,600-2,780 feet indicate that the zone probably was invaded by
water moving through the well from shallow depth. This zone has a lower hy-
draulic head than the zone at shallow depth.
Detergents, which were added to the drilling fluid in large concentra-
tions, are useful in determining the extent of contamination of the samples
with drilling fluid, but to a lesser extent than tritium. The amount of deter-
gent added to the fluid varied, and the detergent analysis is less sensitive
than that for tritium.
The portland cement used in emplacing the casing and repairing the well
is another possible source for contaminating the ground-water samples.
51

Hydrolysis of portland cement produces a solution with a high pH and a high
carbonate content, and the ground-water samples do exhibit both of these chemi-
cal characteristics. A possibility is that all water samples from the well
are contaminated with the hydrolysis products of portland cement. However,
this is unlikely because the cement was in place only above depths of 1,000
feet in the well during the periods of sample collection and the waters were
sampled from tubing that was isolated from the upper parts of the well by a
packer. A summary of cement repairs to the well is shown in figure 8 and the
dates of sample collection are given in table 7. Cement was also emplaced
around the casing, whose bottom is at 362 feet, prior to the collection of
any samples. The pH and carbonate content of the samples generally increased
with depth. Furthermore, the samples collected below 2,200 feet in depth
were from rocks not yet penetrated by the well when the last of the cement was
emplaced.
Source of the Water
Stable isotope variations are reported in delta units (a), defined as
follows: if Rsm is the isotopic ratio (D/H, 0-18/0-16, C-13/C-12, etc.) in a
sample and Rstd is the ratio in some standard material, then
The values are expressed in parts per thousand, or per mil (o/oo). The
standard used for hydrogen and oxygen in natural waters is a standard mean
ocean water, SMOW (Craig, 1961a). The carbon standard is a Cretaceous belem-
nite, PDB, with isotopic composition close to that of normal marine limestone
(Craig, 1953). Samples with the same isotopic compositions as the standard
have values of 0; those depleted in the heavier isotope have negative 6 val-
ues. The analyses reported here were made in the U.S. Geological Survey.
52

Chemical and Carbon Isotope Characteristics
Ground wasters from basalt typically are characterized by (1) high ratios
of calcium to sodium and of magnesium to calcium, (2) relatively high silica
content, and (X3) relatively low fluoride content (White, Hem, and Waring, 1963)..
The samples from well ARH-DC-1 are abnormal for ground water from basalt in
that they are characterized by low ratios of calcium to sodium and of magnesium
to calcium, anad high fluoride. The deeper waters from the well are also high
in carbonate annd chloride.
The ground water is of the sodium bicarbonate type at shallow depth and
of the sodium-bicarbocate chloride type below 980 feet. The samples from the
zones of 636 and 720-810 feet are the result of simple mixing between the
upper sodium water and the lower sodium-bicarbonate-chloride water.
This is demonstrated mass balances based on the change in chloride and the
C-13/C-12 raticos through these zones to determine the mixing ratios. Both
balances give about the same mixing ratios; the zone 636-726 feet contains
10-15 percent and the zone 720-810 feet contains 30-40 percent of the sodium-
bicarbonate-chloride water.
Waters from the zones between 980 and 1,280 feet are different from the
deeper waters of the scodium-bicarbonate-chloride type in some characteristics.
Mainly, they are highly enriched in C-13 but also have a lower total carbonate
content (about 70 perce ant of the deeper water) and a slightly higher chloride
content.
The data from the chemical analyses were analyzed by means of a computer
program being developed by Blair F. Jones and A. Truesdell of the U.S. Geological
Survey. This program the activity products of the ions in solution
with the equilibrium cononstants of rock-forming minerals in order to investigate
the mineralogic controls of the water chemistry. Conclusions drawn from theresults of this analysis is are included in the discussion which follows.
54

Silica.--The silica content indicates near equilibrium with a silica
phase having properties similar to those of chalcedony or cristobalite. If
only uncontaminated samples are considered, the silica content can be seen to
increase with depth. This increase is an effect of the increasing temperature
of the rock with depth. (See Fenix and Scisson, 1969, for temperature logs.)
The silica probably comes into solution from feldspars and other silicate min-
erals but at a concentration higher than that which would be in equilibrium
with quartz. Because the silica goes out of solution slowly and forms, at
first, chalcedony rather than quartz, the solution appears to be in equilibrium
with this phase. Chalcedony is present in some of the core samples (table 2).
Cations.--Sodium is the predominant cation in the samples and presumably
is derived from the solution of sodic feldspars in the basalt. Aluminum is
present in low concentrations only but is significant from the standpoint of
determining chemical equilibrium between the water and feldspars. It is, how-
ever, an extremely difficult constituent to measure in low concentrations.
The accuracy of the measurements is not sufficient to determine the equilibrium
involving aluminum in the upper part of the well. In the three samples from
3,146-3,246 feet the water appears to be in equilibrium with a feldspar of
about equal calcium and sodium content. However, despite the abundance of
calcium feldspar in the basalt, the calcium in solution is low, and roughly
what it should be when in equilibrium with the mineral calcite. This doubtless
occurs because the high bicarbonate content of the water drives calcite out of
solution and lowers the calcium content of the water.
The potassium content is somewhat higher than expected for equilibrium
with a potassium feldspar or potassium mica. Magnesium is low or absent,
though magnesium is present in the dark minerals of the basalt. The concen-
trations of potassium and magnesium may, as supposed for calcium, be affected
by their relative solubilities in the presence of bicarbonate and carbonate.
55

Chloride.--The uppermost ground water contains chloride in the concen-
trations generally present in meteoric waters. The ground water in the zones
from 980-1,280 feet contains 120 mg/1 (milligrams per liter) and below this to
3,-246 feet the water contains less than 100 mg/l. These chloride concentra-
tions are rather high for a basaltic terrane. No explanation can be offered
at this time either as to a source or a possible mechanism for concentrating
the chloride.
Fluoride.--Fluoride increases in concentration in the ground water with
depth in the hole from about 1 mg/l to 20 mg/1 in the 1,090-1,280-foot zone
and then is more or less constant to 3,246 feet. These fluoride concentra-
tions are high for ground water and particularly so for waters from basaltic
rock. The source of the fluoride is unknown. The samples are undersaturated
in fluoride with respect to the mineral fluorite, so that if a considerable
amount of fluorite is present in the rocks it would be actively dissolving.
Sulfate.--Sulfate occurs in low concentrations in the samples. Its con-
centration generally is less than 13 mg/l, but shows a tendency to increase
with depth. The sample from the zone at 4,080-4,283 feet is not entirely rep-
resentative of water from that zone because of invasion by water that moved
down the hole from shallower zones. However, the relatively high concentra-
tion of 21 mg/l in that sample indicates that the zone contains water of higher
sulfate concentration than the upper zones.
In the interval between 540 and 1,120 feet, sulfate is extremely low or
absent. Hydrogen sulfide gas was present when these samples were collected.
The lack of sulfate probably is explained by the reduction of sulfate to pro-
duce hydrogen sulfide. Reducing conditions less severe than needed to reduce
sulfate commonly give rise to relatively high dissolved iron concentrations,
such as were measured in the samples from 636-810 feet.
56

Carbonate.--Bicarbonate and carbonate occur in unusually high concentra-
tions for waters from basaltic rocks. The occurrence of these two species are
dependent on pH. The proportion of carbonate to bicarbonate increases as the
pH increases, until at a pH of about 10, essentially only carbonate is present.
The pH of these waters is also exceptionally high, so that much carbonate is
present. In the sample from the zone at 1,090-1,280 feet, the pH is 10.2 and
carbonate is present to the exclusion of bicarbonate.
C-13 values for carbonate in ground waters are commonly in the range of
-7 to -15 per mil, because dissolved carbonate tends to be roughly 1:1 mix-
ture of plant-derived carbon from the soil zone (6C-13 T -25 o/oo) and of min-
eral carbonate (6C-13 0 o/oo) from the aquifer (Pearson and Hanshaw, 1970).
The samples from the well show that the ground water to a depth of 620
feet has 6C-13 of about -14 o/oo, about normal for ground water. The lower-
most zones contain water with a less negative C-13 of about -7 . However,
the zones from 980 to 1,280 feet contain water with the extraordinary 6C-13
value of about +15 o/oo.
The C-13 enrichment in the zones from 980-1,280 is not explained ade-
quately. Methane production under reducing conditions can, in some circum-
stances, selectively remove C-12 and in effect concentrate C-13 as bicarbonate
ions are reduced to methane. As the waters in the zones 980-1,280 are other-
wise chemically similar to deeper waters in the well, it may be assumed that
they originally had 6C-13 of about -7 o/oo. Then, if C-13 were concentrated
through methane production, about 25 to 30 percent of their carbonate would
have been lost. The zone from 980-1,120 is lower in total carbonate than
deeper zones by 25 to 30 percent. However, for methane production to proceed,
sulfate must first be entirely reduced. Sulfate has concentrations of 10 mg/l
in the sample from 1,090-1,280 feet and 2.0 mg/1 from 980-1,120 feet. Methane
57
production and concentration of the C-13 could have taken place outside these
zones and the water later migrated into them, picking up sulfate on the way.
This is not consistent with the general character of the water in the well.
Where reducing conditions exist from 540-726 feet, the 6C-13 values are nega-
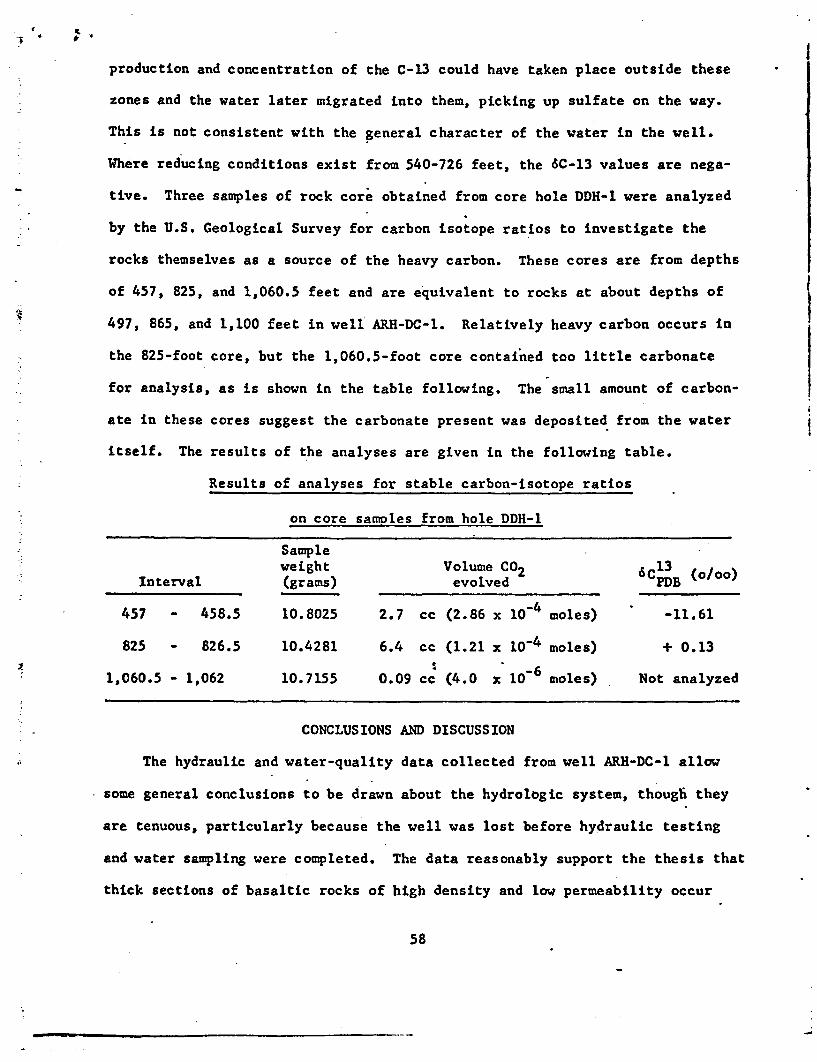
tive. Three samples of rock core obtained from core hole DDH-l were analyzed
by the U.S. Geological Survey for carbon isotope ratios to investigate the
rocks themselves as a source of the heavy carbon. These cores are from depths
of 457, 825, and 1,060.5 feet and are equivalent to rocks at about depths of
497, 865, and 1,100 feet in well ARH-DC-1. Relatively heavy carbon occurs in
the 825-foot core, but the 1,060.5-foot core contained too little carbonate
for analysis, as is shown in the table following. The small amount of carbon-
ate in these cores suggest the carbonate present was deposited from the water
itself. The results of the analyses are given in the following table.
Results of analyses for stable carbon-isotope ratios{COULD NOT BE CONVERTED TO SEARCHABLE TEXT}

at depths below the zone of active ground-water circulation; that is, the
zone, including the glacial deposits, through which ground water moves compara-
tively rapidly and directly toward the Columbia River. Values of hydraulic
conductivity of the rock section are small below about 1,200 feet in depth,
except for fracture or interbed zones at about 1,500, 2,050, 2,600, 3,200, and
4,000 feet. The hydraulic conductivity of the rocks below 4,280 feet was not
determined. The data on hydraulic heads indicate that there is little or no
significant upward movement of water toward the permeable section above 1,200
feet. The heads measured at depths of 2,730-2,910 feet, 3,146-3,236 feet, and
3,166-3,196 feet are somewhat higher, by less than 5 feet, than the heads mea-
sured in shallower zones. However, these zones are interspersed with other
zones in the section from 2,800-3,450 feet having apparent lower heads. Re-
testing of the heads in these zones and the installation of piezometers in two
zones in this section probably could have shown if these data are valid. The
lower head in the zones between 2,800 and 3,450 feet may be spurious, and the
higher heads may prevail generally through this interval. If so, ground-water
flow may have an upward component in this interval. Any upward component of
flow could be expected to be extremely small, however, because of the thick
sections of dense basalt that occur between the permeable rocks above 1,200
feet and the permeable zone at 3,200 feet. The chemical and isotopic charac-
teristics of the ground water show a strong horizontal zonation of the deeper
water in the well, the water from 980 to 1,280 feet, and the shallower water.
This zonation indicates that little, if any, vertical movement of water has
occurred at the site of the well.
The carbon-14 age of the water in the zone from 540 to 620 feet is about
13,000 years. The relationship of the stable hydrogen and oxygen ratios in
this and other samples from greater depth suggest the water may have entered
59

the ground under relatively cool climatic conditions. These data suggest that
the deeper ground-water samples in the well may have entered the ground at
least no later than the close of the last glaciation. Presumably, these rocks
have continued to receive ground-water recharge and the water is moving towards
points of discharge. The location and characteristics of the recharge and dis-
charge areas for ground water in the basaltic rocks of the Hanford Reservation
can only be surmised. The nature of the flow system in the basaltic rocks is
not known from work done on the Reservation. If the flow system is in approxi-
mate balance, recharge and discharge being equal as classical hydrologic theory
assumes, then the water in the basaltic rocks possibly moves from where it
enters the rocks on the ridges and plateaus fringing the Pasco Basin to the
Columbia River or the low ground south of the Reservation near Wallula Gap,
where structural features of the rock may assist its discharge. Even the low-
est ground-water head measured in well ARH-DC-l (365 feet above mean sea level
in the zone 4,000 feet deep) is above the stage of the Columbia River, suggest-
ing that the ground water is part of a hydrologic system discharging to the
river. However, in view of the meagerness of the data, the possibility exists
that the head relationship with the river is fortuitous.
The actual rate of water-particle movement through the rocks depends on
the hydraulic conductivity and the effective porosity of the rocks and the
hydraulic gradient. These are related by an expression which is a form of
Darcy's Law
wherev is the average velocity of ground-water flow,
is the hydraulic conductivity of the rock,
is the effective porosity of the rock,
dh is the hydraulic gradient.
60

{COULD NOT BE CONVERTED TO SEARCHABLE TEXT}

hydrologic standpoint for those radionuclides that decay to innocuous levels
in 600 to 1,000 years. However, the feasibility can ultimately be determined
only if it can be shown with a high level of confidence that no possibility
exists for the wastes to reach man's environment by movement through the hydro-
logic system in this period of time.
In order to assess the possible movement of wastes, hydrologic investiga-
tions should provide enough information such that (1) the hydraulic conductivi-
ties, ground-water flow patterns, and rates of flow are known within reasonable
limits in the geologic framework of the Pasco Basin; and (2) the geochemistry
of the ground-water system is known so that interactions among the rocks,
water, and radioactive waste can be predicted with some confidence.
To obtain this information, the following studies should be conducted:
1. Study the regional ground-water system, mainly using available data from
Federal and State agencies, to attempt to identify the discharge areas
of deeply circulating ground water and to anticipate the direction in
which wastes escaping from storage could move.
2. Drill and test additional deep wells. Sites should be chosen with regard
to determining the geologic controls on hydraulic conductivity and to
obtaining head measurements to define hydraulic gradients. Ground-water
samples and any contained gas should be collected to define the age of
the ground water and the geochemical environment. Wells should be com-
pleted with piezometers open to several different depths.
3. Recover well ARH-DC-1 and complete with one or more piezometers. In its
present condition, the well probably is an avenue of vertical circula-
tion. This is undesirable, because the circulation will disturb the
natural head relationship which must be determined and because it pro-
vides a means by which wastes may accidentally enter the ground-water
system.63

4. Drill test wells to the permeable interbeds above 1,200 feet and conduct
pumping tests. The tests using well ARH-DC-1 indicate that leaky arte-
sian conditions prevail in these rocks. Therefore, two or more observa-
tion wells should be used for each test in order to assess leakage fac-
tors and the possibility of vertical movement through these beds in
areas where wastes might be stored in subsurface chambers.
ACKNOWLEDGMENTS
Several of the authors' colleagues in the U.S. Geological Survey made
notable contributions. Paul C. Benedict, Regional Research Hydrologist of the
Pacific Coast Region, supervised the study. Robert Schneider, Chief of the
Office of Radiohydrology, provided valuable guidance and coordinated the study
with the Geological Survey's overall research program for the AEC in the field
of waste management. Donald A. Morris began the study while on a temporary
assignment to the AEC Richland Operations Office. He took part in planning
both the drilling of well ARH-DC-1 and the hydrologic data collection.
Richard K. Blankennagel gave some crucial advice on hydraulic testing and geo-
physical logging techniques early in the project. His advice was the basis
for making injection tests on the well, which provided the best field informa-
tion on hydraulic conductivity of the rocks. F. J. Pearson set up procedures
for collection and field treatment of water samples for chemical analysis.
He was instrumental in seeing that analyses were made and provided an interpre-
tation of the geochemical data collected from the well. Alfred Clebsch, Jr.,
and Charles V. Theis gave the authors valuable advice on the conduct of the study.
For facilitating their efforts in a variety of ways, the authors wish to
thank Oscar J. Elgert, Director, Production Programs Division, AEC Richland
Operations Office, and his staff, Edward B. Jackson, William S. Bryan, and
W. Wade Ballard.
64

Of special help to the authors in collecting field data and processing
water samples were Raymond E. Isaacson, Project Manager, Donald J. Brown, and
Rodney K. Ledgerwood all of the Atlantic Richfield Hanford Company. Randall E.
Brown and David D. Tillson of Battelle Memorial Institute provided geologic and
hydrologic information collected during their studies on the Reservation.

REFERENCES
Bierschenk, W. H. 1959, Aquifer characteristics and ground-water movement at
Hanford: U.S. Atomic Energy Comm. Rept. HW-60601, UC-70, Radioactive
Waste (TID-4500, 14th ed.).
Bingham, J. W., and Grolier, M. J., 1966, The Yakima Basalt and Ellensburg
Formation of south-central Washington: U.S. Geol. Survey Bull. 1224-G,
Blankennagel, R. K., 1967, Hydraulic testing techniques of deep drill holes
at Pahute Mesa, Nevada Test Site: Interagency Report: Spec. Studies I-1,
U.S. Geol. Survey open-file rept.
Brown, R. E., 1968, A study of reported faulting in the Pasco Basin: U.S.
Atomic Energy Comm. Research and Devel. Rept. BNWL-662, 55 p.
Cooper, H. H., Jr., Bredehoeft, J. D., and Papadopulos, I. S., 1967, Response
of a finite-diameter well to an instantaneous charge of water: Water
Resources Research, v. 3, no. 1, p. 263-269.
Craig, Harmon, 1953, The geochemistry of the stable carbon isotopes: Geochim.
et Cosmochim. Acta, v. 3, p. 53-92.
1961a, Standard for reporting concentrations of deuterium and oxygen-18
in natural waters: Sci., v. 133, p. 1833-1834.
1961b, Isotopic variations in meteoric waters: Sci., v. 133, p. 1702-
1703.
Fenix and Scisson, Inc., 1969, Completion report, exploratory hole ARH-DC-1:
Tulsa, Okla.
Ferris, J. G., Knowles, D. B., Brown, R. H., and Stallman, R. W., 1962, Theory
of aquifer tests: U.S. Geol. Survey Water-Supply Paper 1536-E, p. 69-174.

Friedman, Irving, Redfield, Alfred C., Schoen, Beatrice, and Harris, Joseph,
1964, The variation of the deuterium content of natural waters in the
hydrologic cycle: Rev. of Geophysics, v. 2, p. 177-224.
Hantush, M. S., 1956, Analysis of data from pumping tests in leaky aquifers:
Am. Geophys. Union Trans., v. 37, no. 6.
Isaacson, R. E., 1969, The Hanford exploratory deep well: Atlantic Richfield
Hanford Company, U.S. Atomic Energy Comm. Contract AT(45-1)-2130, Doc.
ARH-SA-47.
Mackin, J. H., 1961, A stratigraphic section in the Yakima Basalt and the
Ellensburg Formation in south-central Washington: Washington Div. Mines
and Geology Rept. of Inv. no. 19, 45 p.
Newcomb, R. C., 1970, Tectonic structure of the main part of the basalt of the
Columbia River Group in Washington, Oregon, and Idaho: U.S. Geol. Survey
Misc. Geol. Inv. Map I-587.
Pearson, F. J., Jr., and Hanshaw, B. B., 1970, Sources of dissolved carbonate
species in ground water and their effects on carbon-14 dating: Symposium
on Use of Isotopes in Hydrology, Internat. Atomic Energy Agency, Vienna,
1970, Proc.
Raymond, J. R., and Tillson, D. C., 1968, EValuation of a thick basalt sequence
in south-central Washington: U.S. Atomic Energy Comm., Pacific Northwest
Lab., Battelle Memorial Inst. BNWL-76, 128 p.
Schmincke, Hans-Ulrich, 1967, Stratigraphy and petrography of four upper Yakima
Basalt flows in south-central Washington: Geol. Soc. America Bull.,
v. 78, p. 1385-1422.
Walton, W. C., 1962, Selected analytical methods for well and aquifer evalua-
tion: Illinois State Water Survey Bull. 49, 81 p.
67

White, D. E., Hem, J. D., and Waring, G. A., 1963, Chemical composition of
sub-surface waters: U.S. Geol. Survey Prof. Paper 440-F, 67 p.
Winograd, I. J., 1970, Noninstrumental factors affecting measurement of static
water levels in deeply buried aquifers and aquitards, Nevada Test Site:
Ground Water, v. 8, no. 2, p. 19-28.

(Figure III-7). Chapter I and the section entitled Future Studies in
this chapter give an outline of ongoing efforts to gain additional head
measurements within the Grande Ronde Basalt. Outside of the Hanford
Site, no other wells are known to penetrate the Grande Ronde Basalt in
the Pasco Basin from which head data may be obtained.
Borehole RSH-1. In June 1967, Cook Testing Company completed DST
tests and head measurements in RSH-1. The results were documented by
Raymond and Tillson (1968). Table III-24 lists the heads recorded along
with the investigator's comments on the validity of each test. Head
measurement accuracy is considered ± 20 feet under excellent test
conditions. These data are plotted on Figure 111-25. Question marks are
adjacent to those points considered of poor quality by Raymond and
Tillson (1968). RSH-1 had been open to groundwater cross-flow within the
borehole for 10 years following its completion in 1958; this most likely
created non-static heads in some test intervals which were later
reflected, to some extent, during the short testing period.
Figure III-25 shows a steep, downward hydraulic gradient of 0.6
percent over the 2,600- to 4,200-foot depth. This depth extends through
most of the lower Grande Ronde Basalt. The highest pressure of 1,954
feet was recorded at a depth of 2,614 to 2,690 feet which lies within the
Umtanum unit. Between 4,200 and 4,900 feet, the head increases 42,feet
to +999 feet before again decreasing 144 feet upon reaching a depth of
6,000 feet; however, these head differences are most likely within the
error of measurement, since the borehole was open to groundwater cross
flow for several years and the shut-in period for the tool was only a few
hours per measurement. Thus, the head data available between the depths
of 4,100 and 6,000 feet are perhaps best interpreted as having little or
no head change. This rock zone would characterize an interval of
essentially horizontal groundwater movement. The only measurement below
6,000 feet is one highly questionable head measurement of -4,691 feet
recorded between the depths of 8,275 and 8,351 feet. No hydrologic
significance can be assigned to this value.

RHO-BWI-ST-5
TABLE 111-24. Hydraulic Heads within BasaltsPenetrated by Borehole RSH-1.
{COULD NOT BE CONVERTED TO SEARCHABLE TEXT}

FIGURE III-25. Hydraulic Heads within the Basalts Penetrated by
Borehole RSH-1.{COULD NOT BE CONVERTED TO SEARCHABLE TEXT}

RHO-BWI-ST-5
It is important to note that each of the heads within the Grande
Ronde Basalt of RSH-1 is 500 to 1,600 feet higher than those in DC-1,
DC-2, and DC-6 located 20 to 25 miles to the east (heads in these
boreholes are addressed in the following text). For example, the head in
the interflow of the Umtanum RSH-1 is at an elevation 1,954
feet. This compares 395 to 460 et for the same horizon in DC-1,
DC-2, and DC-6. The difference may be accounted for by either: (a) a
uniformly steep hydraulic gradient (20 to 80 feet per mile) separating
RSH-1 and the other boreholes; or (b) a major interruption in the
regional hydraulic gradient created by the Rattlesnake Hills anticline
and associated faulting. The second interpretation is believed to be the
most plausible.
Borehole DC-1. Table III-25 lists those heads reported by LaSala and
Doty (1971) across the Grande Ronde Basalt in borehole DC-1. The
straddled intervals varied between about 30 and 200 feet although most
packers were separated by 90 or 180 feet. Because of these long
spacings, more than one interflow was normally straddled during each
measurement. As previously mentioned, these
permeability testing and groundwater samplin LaSala and Doty
acknowledged that these activities disturbed
reported values must be used cautiously; however, the general hydraulic
gradient is probably realistic. Head measurements were made using
down-hole
Two features are revealed by plotting Table III-25 data onto FigureIII-26. These are:
a. The highest heads (402 to 411 feet) are recorded above the depth of3,451 feet--This suggests an interval of essentially verticalequipotential
b. Below the Umtanum unit, head decreases reaching a low of 366 feet ata depth of 4,000 feet--This suggests a zone of apparent downwardhydrologic gradient.
Thus, the DC-1 head measurements in the Grande Ronde Basalt by LaSala
and Doty (1971) suggest horizontal groundwater movement above a depth of
3,450 feet and downward movement below this depth.
III-109

RHO-B WI-ST-5
TABLE III-25. Hydraulic Heads within theGrande Ronde Basalt of Borehole DC-1.
{COULD NOT BE CONVERTED TO SEARCHABLE TEXT}

{COULD NOT BE CONVERTED TO SEARCHABLE TEXT}
FIGURE III-26. Hydraulic Heads within the Grande Ronde Basaltof Borehole DC-1.

RHO-BWI-ST-5
History of the DC-1 Piezometers. Rotary drilling of exploratory well
DC-1 was completed at 5,661 feet in September 1969. Three years later in
April 1972, 5 piezometer tubes were installed (Figure III-27).
Piezometers 1 through 4 had 2-1/16-inch outside diameters and were
positioned across specific interflows in the Grande Ronde Basalt.
Piezometer 5 is 2-7/8 inches in outside diameter and was left open to
about 825 feet of Wanapum Basalt plus the upper 100 feet of Grande Ronde
Basalt. Piezometers 1 through 4 were set in sand and gravel packs
separated by cement plugs. Each tube was completed using 10-foot-long,
2-inch-diameter Johnson well screens reinforced with 1.9-inch-diameter
stainless steel, perforated pipe. Pipe perforations were 3/8 inch in
diameter, 4 per round, 1 round per vertical inch. Piezometer 5 has no
well screen and is an open-ended pipe.
Hydraulic heads have been monitored in these piezometers since June
1972. Figure III-28 shows hydrographs of the piezometers over the
monitoring period. All head measurements taken in each piezometer since
June 1972 are given in Table III-26.
From 1972 to the summer of 1977, the DC-1 site remained undisturbed
except for three periods of groundwater development and sampling in each
piezometer. These occurred in April 1972 (following piezometer
installation), September 1973, and the spring of 1974. Any head
disturbance this development may have had on individual piezometers or
between piezometers was apparently not recorded, since no water levels
were collected in the spring of 1972, 1973, or most of 1974.
Since installation, piezometers 1, 2, and 3 have responded in unison
to head changes. Hydraulic heads have varied no more than about 2 feet
from each other with the highest head in piezometer 1 and progressively
lower readings in piezometers 2 and 3. This difference has reduced to
approximately 1 foot since late 1976. At the same time, piezometers 4
and 5 have behaved independently from the lower 3 piezometers. For the 3
years following installation, the water levels in piezometer 4 were as
much as 20 feet higher than piezometer 5, as piezometer 4 equilibrated.
By April 1975, the piezometer 4 water level dropped below that in
piezometer 5 and this separation continued to increase until 1977.
III-112

RHO-BWI -ST-5
PIEZOMETERS{COULD NOT BE CONVERTED TO SEARCHABLE TEXT}
FIGURE III-27. Piezometer Placements in Borehole DC-1.

FIGURE III-28{COULD NOT BE CONVERTED TO SEARCHABLE TEXT}
Hydrograph of the Water Levels in the DC- Piezometers from 1972 through 1979.
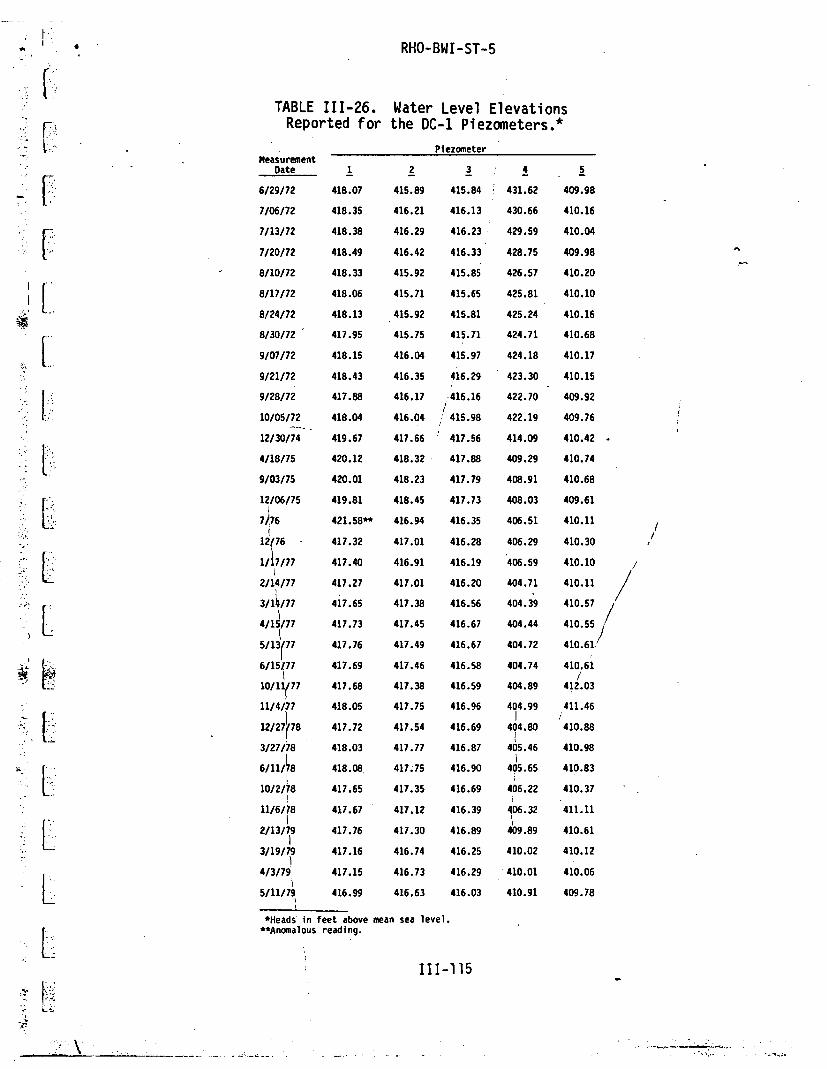
RHO-BWI-ST-5
TABLE III-26. Water Level ElevationsReported for the DC-1 Piezometers.*
{COULD NOT BE CONVERTED TO SEARCHABLE TEXT}

RHO-BWI-ST-5
It is important to note that between May and September 1977 borehole
DC-2 was cored into the basalt about 60 feet to the southwest of DC-1.
Since the completion of DC-2,the borehole has remained open (uncased)
from approximately 2,200 to 3, 00 feet below ground level. This uncased
hole crosses the open intervals of piezometers 3 and 4 and is within 100
feet of piezometer 5.
1977, the head in piezometer 4 has been
equilibrating to that in piezometer 5 (Figure III-28). In October 1977,
7 feet separated the 2 water levels. Since March 1979, the water levels
in both piezometers have remained about 0.10 foot or less apart. The
reasons for this equilibration is unknown. During fiscal year 1980,
tests are scheduled at the DC-1 and DC-2 site to address possiblecross-hole interference. Other explanations may include structural
deterioration of the DC-1 piezometers or natural cyclic down-hole
pressure changes.
At present, piezometers 1, 2, and 3 indicate a slight upward
hydraulic gradient of 0.001, or about 1 foot per thousand feet. The
average head elevation for these 3 piezometers is about 417 feet. Thus,
the head in piezometer 3 compares favorably with the 403 to 409
(+ 20)-foot head reported by LaSala and Doty (1971) along the same
interval of Grande Ronde Basalt. However, LaSala and Doty (1971)
reported a 366-foot head for the interval now monitored by piezometer 2.
This large difference in head cannot be reconciled at this time and must
await future testing. LaSala and Doty did not record head measurements
near the 4,760 to 4, 849-foot depth of piezometer 1.The head elevation of about 410 feet in piezometers 4 and 5 compare
well with the heads of,402 to 411 (± 20) feet for the same zone reported.
by LaSala and Doty (1971).
The possibility exists that piezometers 1, 2, and 3 are hydraulically
interconnected within DC-1. Water leakage could result from incomplete
or deteriorated cement seals along the cement/borehole wall and/or thread
leakage. The evidence for such leakage is two-fold. First, as noted
earlier, these three piezometers have responded in unison since
installation and their heads are close, although their stratigraphic
separation spans 1,600 feet. Secondly, and most important, water-level
III-116

s were noted in piezometers 1, 2, and 3 during swabbing of the DC-2
of 3,243 to 3,273 feet during groundwater sampling by Apps and
(1979). This interval is immediately beneath the piezometer 3
setting. During swabbing, water levels were lowered several feet in
piezometer 3 and a few inches in piezometers 1 and 2. Thus, the
representativeness of water levels within each of the DC-1 piezometers is
in question. It is not yet resolved whether the uncertainty lies within
the structural integrity of the DC-1 borehole or was created by the
emplacement of DC-2, or a combination of both. Future hydrologic testing
will address these questions.
Borehole DC-2. Table III-27 lists the hydraulic heads recorded by
Apps and Others (1979) and Science Applications Inc. (1978) taken across
selected intervals of Grande Ronde Basalt in DC-2. These data are
plotted on Figure III-29. Packer spacing varied between 30 and 54 feet,
although most were 30 feet apart. These short straddles made it possible
to isolate single, low-density interflows for head measurements.
Measurement accuracy was given at ± 2.5 feet by Apps and Others (1979).
The same accuracy is assumed to apply to the Science Applications Inc.
data; however, based upon testing results by Science Applications Inc.
and Rockwell Hanford Operations during 1979 and early 1980, the
measurement is probably about ± 5 feet.
Since DC-2 was open opposite the Grande Ronde Basalt for about 9
months preceding testing, the heads listed for high-density zones (zones
having the lowest permeabilities) did not have sufficient time to
establish a static value during the test period. Therefore, only those
,heads taken from low-density irterflows were plotted in Figure III-29 for
comparison of head values. It is assumed that testing time was
sufficiently long for these low-density zones to reasonably establish a
static head.
From Table III-27, it is noted that 2 separate heads of 419 and 395
feet were recorded across the Umtanum interflow lying between the depths
of 2,945 and 3,000 feet. The first value was reported by Science
Applications Inc. (1978) and the second by Apps and Others (1979). At
present, it is uncertain as to which is representative of the true static
III-117

RHO-BWI-ST-5
TABLE III-27. Hydraulic Heads Reported for theGrande Ronde Basalt in Borehole DC-2.
Test Interval Heade(feet below Rock (feet above
ground level)C Densityd mean sea level)
a2,269 - 2,299 High 470
2,340 - 2,370 Low 443
2,625 - 2,655 Low 438
2,795 - 2,825 Low 421
2,960 - 2,990 Low 395
3,160 - 3,190 Low 377
3,243 - 3,273 Low 362
2,344 - 2,376 Low 444
2,376 - 2,409 High 423
2,955 - 3,007 Low 4193,019 - 3,071 High 421
3,069 - 3,122 High 446
3,116 - 3,170 High 423
aApps and Others (1979)bData from Science Applications Inc. (1978).Ground level elevation 572 feet.
dLow density--Test straddled at least one zone of low-density(62.4-2.6 grams/cubic centimeter) basalt. High Density--Teststraddled only high-density (=2.7-2.8 grams/cubic centimeter)basalt. Densities were determined by geophysical loginterpretation.
eHead accuracy of f 2.5 feet reported by Apps and Others (1979).

RHO-BWI-ST-5{COULD NOT BE CONVERTED TO SEARCHABLE TEXT}
FIGURE III-29. Hydraulic Heads for the Grande Ronde Basalt in DC-2Plotted as a Function of Depth.
III-119

RHO-BWI-ST-5
head. Piezometer 4 of DC-1 is also open within this interval and its
static head is 411 feet, closely approximating the larger of the 2 head
values.
Comparison of Hydraulic Heads in Boreholes DC-1 and DC-2. Figure
III-30 is a complete diagram of the Saddle Mountains, Wanapum, and Grande
Ronde Basalt heads for DC-1 and DC-2 reported by LaSala and Doty(1971),
Science Applications Inc. (1978), Apps and Others (1979), and the DC-1
piezometers. These boreholes are located at the same site about 60 feet
apart. As can be seen, there is general disagreement between the heads
indicated in the DC-1 piezometer tubes versus both those reported
previously for DC-1 and those determined in DC-2. These differences may
result from:
a. Non-static heads reported by LaSala and Doty (1971)--This possiblitywas noted in the LaSala and Doty report because head determinationswere made during permeability testing and groundwater sampling;
b. Non-representative heads within the 5 piezometer tubes of DC-1--Asnoted earlier, it appears that tubes 1 through 3 are hydraulicallyinterconnected within the DC-1 borehole because of inadequate zoneisolation perhaps resulting from a separation of the borehole cementand the rock wall bond; this problem would also have influenced theheads later measured in DC-2 because of the proximity of the2boreholes; and,
c. A composite or average head becoming established in DC-2 during the9 months separating borehole completion and head measurements--Theborehole remained hydraulically open to any groundwater cross flow;those interflows contributing water would be recorded with anartificially low head, while those accepting water would haveabnormally high heads.
Based upon available information, it is the authors' opinion that, of
the 3 head distributions given in Figure III-30, the DC-1 values given by
LaSala and Doty should be used, for the time being, as representing site
conditions (although none are ideal). This choice is based upon the
rationale that:
a. DC-1 heads within the Saddle Mountain Basalt are in general agreementwith the head distribution known for the area from other DB wells;
b. Water levels in piezometer tubes 4 and 5 of DC-1 are in closeagreement with the heads recorded 10 years earlier by LaSala and Doty;
III-120

{COULD NOT BE CONVERTED TO SEARCHABLE TEXT}
FIGURE 111-30.DC-1 and DC-2.
Comparison of Hydraulic Heads Reported for Boreholes

RHO-BWI-ST-5
c. DC-1 was not open to groundwater cross flow for any length of timebetween hole drilling and head measurement; and,
d. The hydraulic head record in DC-1 is the most extensive encompassingthe Saddle Mountains, Wanapum, and Grande Ronde Basalts; thus, it isthe most complete of the 3 data sources.
Borehole DC-6. In August 1978, Apps and Others (1979) began head
measurements within the Grande Ronde Basalt of DC-6. A standard 30-foot
packer spacing was used to straddle selected, low-density interflows
between the depths of 2,240 and 3,722 feet. Testing was completed using
a single packer set at 4 locations between depths of 3,341 and 3,802
feet. Thus, these last measurements recorded a composite head for the
rock interval between the packer and the total depth of 4,331 feet for
the borehole. Head measurement accuracy was reported as + 2.5 feet.
The heads reported are given in Table III-28. Figure III-31 is a
plot of the same data. An average depth was used in plotting the last 4
heads. The largest head of 460 feet was recorded at a depth of 3,025 to
3,055 feet. This is within the Umtanum interflow. Three hundred feet
above the Umtanum unit, the head reaches a low of 423 feet above mean sea
level; thereafter, it rises to between 447 and 456 feet. The uppermost 3
measurement points on Figure III-31 suggest that static head condition
(indicating horizontal groundwater flow) are established above the depth
of 2,500 feet. Such conditions may extend to atop the Umtanum unit if
the 423-foot head elevation reported at the depth of 2,708 to 2,738 feet
is too low. (In relation to the surrounding data points, this head
measurement of 423 is anomalous and subject to question.) This would
result in essentially vertical equipotentials in the Grande Ronde Basalt
above the Umtanum unit as suggested by the LaSala and Doty (1971) data
for DC-1. Below the Umtanum unit, the head decreases to a 421-foot
minimum at the depth of 3,620 to 3,650 feet. Farther down the hole, the
heads vary between 426 and 437 feet, except for a final measurement of
466 feet. As noted in Table III-28, this last measurement is a composite
head over a 534-foot section of open hole. This indicates that some
interval below the 3,802-foot depth has a head elevation of at least 466
feet.
III-122

RHO-BWI-ST-5
TABLE III-28. Hydraulic Heads Reported for the
Grande Ronde Basalt in Borehole DC-6.a
Test Interval(feet below
ground level)b
*2,240 - 2,270
2,400 - 2,430
2,454 - 2,484
2,708 - 2,738
2,896 - 2,936
3,025 - 3,055
3,343 - 3,373
3,620 - 3,650
3,650 - 3,680
3,683 - 3,713
3,692 - 3,722
3,341 - 4,336
3,477 - 4,336
3,601 - 4,336
3,802 - 4,336
RockDensityC
Low
Low
Low
Low
Low
Low
Low
Low
Low
Low
Low
Several high and low
Several high and low
Several high and low
Several high and low
Headd(feet above
mean sea level)
450
447
456
423
454
460
443
421
432
429
432
426
437
434
466
aApps and Others (1979).bGround level elevation 402 feet.CLow density--Test interval includes at least one zone oflow-density basalt which normally corresponds to an interflowzone. High density--Test interval inhigh-density basalt which normally corresponds to a section ofcolumnar basalt.
dHead accuracy ± 2.5 feet as reported by Apps and Others (1979)Head elevations are above ground level. Artesian flow is

{COULD NOT BE CONVERTED TO SEARCHABLE TEXT}
RHO-BWI-ST-5
FIGURE III-31. Hydraulic Heads for the Grande RondeBasalt in DC-6 Plotted as a Function of Depth.

RHO-BWI-ST-5
Summary. Figure III-32 shows a comparison of hydraulic heads for
boreholes DC-1, DC-6, and DC-8. Data from these 3 sites represent the
majority of the head information available for the Wanapum and Grande
Ronde Basalts. This figure is a composite of the information previously
given (Table III-21 and Figures III-23, III-24, III-26, and III-31) and
is centered upon a single stratigraphic horizon, the Umtanum unit. This
permits easier correlations between comparable stratigraphic units
without the limiting influences of intervening geologic structures and
differences in land surface elevations. The data points represent the
mid-point of a straddled interflow zone. As previously noted, the DC-1
heads were chosen as most representative of the DC-1/DC-2 site.
The scarcity of available data limits the conclusions that can be
drawn about the distribution of heads in the deep basalts beneath the
Hanford Site. However the following trends are suggested:
a. Hydraulic equilibrium apparently exists across the entire WanapumBasalt in DC-1 and in the upper Wanapum Basalt in DC-8. A zone ofsligthly lower head occurs in DC-8 along the Roza-Frenchman Springscontact, but the areal extent and significance of this must awaitfurther study.
b. Hydraulic heads within the Wanapum Basalt of DC-8 appear to beseveral feet higher than those in DC-1. This does not implynorthward groundwater flow between the 2 sites, since the overallpotentiometric surface of the Wanapum Basalt is not known. However,the outline of this surface (at least in the upper Wanapum Basalt) isexpected to approximate that shown in Figure III-22 for the SaddleMountains Basalt.
c. With the exception of one low head elevation in DC-6, a hydraulicequilibrium appears to exist in the Grande Ronde Basalt above theUmtanum unit. Below the Umtanum unit in both DC-6 and DC-1, there isgenerally a head decrease of perhaps 40 feet, reaching its lowestvalue 500 to 1,000 feet below the Umtanum flow top.
d. Generally higher hydraulic heads are apparent in the Grande RondeBasalt in DC-6 compared to DC-1. A possible explanation for this isthat the Umtanum-Gable Mountain anticline separating the two sites isforming a structural impediment to groundwater flow from the north.This barrier might result from tight basalt folding, faulting, or acombination of both. This anticline may interrupt groundwater flowmoving southward from Sentinel Gap and the Saddle Mountains, perhapsdiverting it to the southeast away from the Cold Creek syncline. Ifthis does occur, then the Umtanum-Gable Mountain anticline would havea significant effect on the deep basalt hydrology beneath the HanfordSite.

{C
OU
LDNO
T
B
E
CONV
ERTE
D
TOSEARCHA
BLE
TEX
T
}
FIGURE III-32. Comparison of Hydraulic Heads inDC-6, and DC-8.