preliminary discussion of environmental health issues in springfield - final
TRANSCRIPT
0
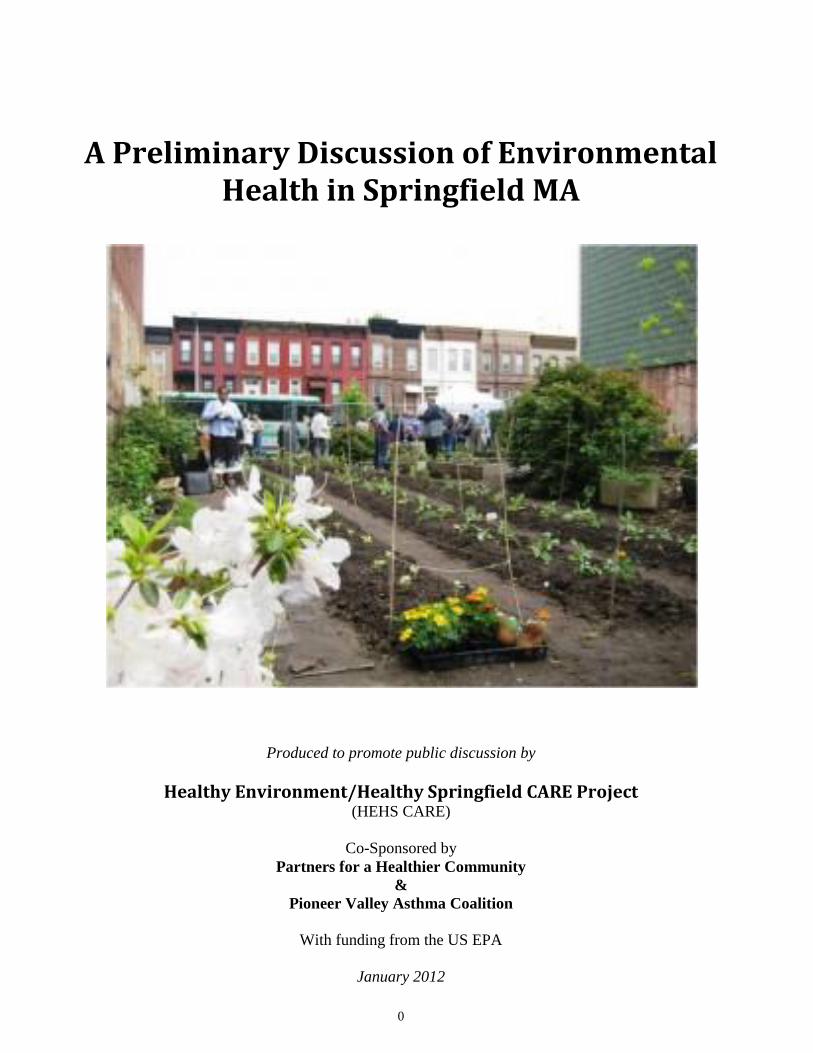
A Preliminary Discussion of Environmental Health in Springfield MA
Produced to promote public discussion by
Healthy Environment/Healthy Springfield CARE Project (HEHS CARE)
Co-Sponsored by
Partners for a Healthier Community
&
Pioneer Valley Asthma Coalition
With funding from the US EPA
January 2012

1
2
Table of Contents
Introduction ................................................................................................................................................. 3
Assessing Conditions in Springfield ......................................................................................................... 4
Assessment Challenges and Continuing Research .................................................................................... 4
Environmental Justice: Springfield‟s CARE Project ................................................................................ 5
Socio-Economics, Racism and Environmental Justice in Springfield ...................................................... 5
Environmental/Health Disparities ............................................................................................................. 6
Understanding Springfield‟s Environmental Problems............................................................................. 7
The Precautionary Principle and Environmental Stewardship .................................................................. 7
Prioritizing Environmental Issues ............................................................................................................. 7
Assessing Environmental Risk .................................................................................................................. 8
Community Prioritization ........................................................................................................................ 10
Factsheet Overview ................................................................................................................................... 11
Brownfields/Oil & Hazardous Waste/Oil Sites ....................................................................................... 12
Risk Assessment for Brownfield/Oil & Hazardous Waste/oil Sites ..................................................... 13
Trash, Litter and Illegal Dumping ........................................................................................................... 14
Risk Ranking for Trash, Litter, and Illegal Dumping .......................................................................... 15
Chemicals and Pesticides in Soil ............................................................................................................. 16
Risk Ranking for Pesticides/Chemicals in Soil .................................................................................... 17
Air Pollution from Diesel Exhaust .......................................................................................................... 18
Risk Ranking of Diesel Exhaust in Springfield .................................................................................... 19
Air Pollution from Vehicle Exhaust ........................................................................................................ 20
Risk Ranking for Vehicle Exhaust ....................................................................................................... 21
Lead in Housing ...................................................................................................................................... 22
Risk Ranking for Lead in Springfield Houses ...................................................................................... 23
Mold in Indoor Spaces ............................................................................................................................ 24
Risk Ranking for Mold ......................................................................................................................... 25
Secondhand Smoke ................................................................................................................................. 26
Risk Ranking for Environmental Tobacco Smoke ............................................................................... 27
Pests and Pesticides in Homes ................................................................................................................ 28
Risk Ranking for Pests and Pesticides ................................................................................................. 29
Carbon Monoxide Indoors ...................................................................................................................... 30
Risk Ranking For Carbon Monoxide Indoors ..................................................................................... 31
Appendices ................................................................................................................................................. 32
Scoring of Quantitative Community Concerns ....................................................................................... 33
Feedback Form ........................................................................................................................................ 34
Glossary of Terms ................................................................................................................................... 36
3
Introduction This document is intended to begin a conversation on the environment and public health in
Springfield MA. It will be presented at two Stakeholder meetings, January 10 and 24, Springfield
Technical Community College (STCC) Scibelli Hall, 7th
floor, from 6-8pm (see back cover for details)
and to promote solution-based dialogue in the community. We will overview some of the issues identified
through community outreach and provide sufficient information for informed deliberations.
Our purpose is to provide the public a general understanding of environmental conditions in
Springfield, sufficient to encourage community discussion and decision-making. Each document – and
successive document - will reflect community decisions made following draft publication. This document
will review some of these issues in the summary and factsheets that follow.
This document is not intended as the „final word‟ on environmental health conditions in
Springfield. Rather, a beginning place to pursue solutions to improve life in Springfield. Many
environmental concerns have not been represented here and some are so significant and complex, they
will require additional resources to fully assess. Since this is the beginning of the conversation, we have
deferred talking about solutions and feasibility at this stage. We feel that discussion needs to include the
community and must first follow a review of environmental concerns, building off community priorities as
they are developed.
Because this document simply identifies problems and concerns, it may project a „negative‟ tone to
some. This is not our perception of Springfield, nor should the reader despair. There is a great deal of
good work being done and Springfield has many wonderful assets. Only a few things can be mentioned
here:
o Robust public health networks and clinical health services
o Strong community identity and coalitions
o 50% of homes are owned by their occupants
o Excellent libraries
o Growing local colleges
o Emerging community gardening movement.
o Many public parks within walking distance of residents
o Affordable, architecturally-significant communities
o New economic development, including new Baystate Hospital and solar power farm
o Broad-based economic development planning processes
o Springfield recognized as 4th greenest city in the US
Since discussions about solutions and feasibility are inherently political and economic matters –
one person‟s „impossible task‟ may be another‟s „no brainer‟ – the public needs to be a part of that
conversation. This is why we simply identified problems and concerns. Together with residents,
municipal and community leaders, we will map a way forward to solve them.
Healthy Environment/Healthy Springfield CARE Project The Healthy Environment/Healthy Springfield CARE Project (HEHS CARE) is an emerging
coalition of health, municipal, community and academic organizations committed to developing a healthy
environment in Springfield. Our long-term effort is to establish a working coalition of organizations,
residents, businesses and government agencies to address environmental health issues and improve the
quality of life for all.
The Healthy Environment/Healthy Springfield CARE Project (HEHS CARE) was funded and charged
by the US EPA to:
o Assess environmental conditions in Springfield
o Seek input from residents and stakeholders on environmental issues
o Build community capacity to address problems identified
o Develop action plan to address community-identified priorities and concerns

4
We will produce three documents on Springfield to further these goals:
o Preliminary Discussion of Environmental Health Issues in Springfield
o Report on Environmental Health in Springfield
o Action Plan to Improve Environmental Health in Springfield
The CARE Project is co-sponsored by Partners for a Healthier Community and the Pioneer Valley
Asthma Coalition. The University of Massachusetts Amherst, Arise for Social Justice, Springfield City
Department of Parks, Buildings and Recreational Management also serve on this project‟s management
team and developed this document for public use.
Along with these organizations, others have taken a leadership role in this project, including:
Pioneer Valley Planning Commission HAP (Hampden Hampshire Housing Partnership)
Universal Community Voices Springfield Dept of Planning
Springfield Renaissance School Gardening the Community
Springfield Green Team Springfield Area Sustainable Energy Association
Springfield Partners American Lung Association
McKnight Neighborhood Council
The US EPA has charged HEHS CARE to assess, prioritize and develop a plan of action to address
environmental risks in Springfield and build the coalition to carry it out. These issues include:
Air pollution Soil pollution
Water pollution Built environment
Indoor environmental conditions Youth and the environment
In addition, the CARE Project was asked by the US EPA to review damage caused by recent
extreme weather events (tornado, snow storm, etc.) and include those impacts in its assessments.
The task for this two year project is to assess environmental health conditions, build community
capacity to address those issues it identifies, engage the community in prioritization/problem-solving and
develop an action plan to address community prioritized concerns. The greater goal of this project is to
create a Springfield-based environmental health coalition of residents and organization, sufficient to
address the environmental issues that negatively impact the health well-being of the people of Springfield.
Assessing Conditions in Springfield As will be evident in the pages to come, the environmental health issues in Springfield are serious
and complex. The issues we – or the community – have identified far outstrips our capacity to fully
investigate with this modest grant. Our assessment work is on-going and will be more fully addressed in
our Report on Environmental Health in Springfield.
That said, we need to start a conversation on these issues, while we continue the process of
investigating environmental conditions in Springfield. Unlike many of the CARE projects in the United
States (over a 100 at this point), Springfield had no dedicated environmental organization to address this
work. Unlike many CARE communities, Springfield is also an Environmental Justice community. That
means it‟s environmental and health disparities are more extreme and the socio-economic conditions of its
citizenry limits their ability to fully participate in the decisions that affect their lives.
Assessment Challenges and Continuing Research Some of the most significant environmental issues Springfield faces are not represented in this
document. These include:
Built Environment Industrial Air Pollution
Schools and Public Buildings Extreme Weather Events
Water Pollen/Allergies
Youth and the Environment
5
In some cases, we are in the middle of assessing the available data on these issues. In other cases
we are wrestling with gaps in the available data and in other cases we are awaiting promised data or
hunting that data down. These issues will be more fully addressed in our upcoming Report on
Environmental Health in Springfield.
But the depth and complexity of some of these issues – most notably, 985 oil & hazardous waste
sites, industrial and biological pollution in all ponds and waterways, industrial air pollution and other
identified issues – will require on-going assessment and research. Some of this will require citizen
participation to achieve. Others will require research investment. We hope those who see these issues as
important will become CARE Project stakeholders and join the effort to resolve them.
Environmental Justice: Springfield’s CARE Project Attending to these issues is important because of Springfield‟s designation as an Environmental
Justice Community by the US EPA. Environmental Justice is defined by the EPA as “the fair treatment
and meaningful involvement of all people regardless of race, color, national origin, or income with respect
to the development, implementation, and enforcement of environmental laws, regulations, and policies.”
The goal is to ensure that everyone enjoys the same degree of protection from environmental and health
hazards and equal access to the decision-making process to have a healthy environment in which to live,
learn, and work. In Massachusetts, Environmental justice communities are defined by any of 4 criteria:
o Households earn 65% or less of the statewide household median income; or
o 25% or more of the residents are minority; or
o 25% or more of the residents are foreign-born; or
o 25% or more of the residents are lacking English language proficiency
Springfield qualifies as an environmental justice community based on 3 out of 4 criteria:
o Median Household income: 64% of statewide median. Springfield $39,611.
Massachusetts: $62,072. National: $49,445
o General Demographics: 38% Latino (any race), 22% African American, 2% Asian and
38% non-Latino white
o Foreign born: Only 6% of Springfield residents were born outside the US.
o Language: Approximately 30% of Springfield residents speak a language other than
English in the home.
Socio-Economics, Racism and Environmental Justice in Springfield The single greatest indicator for predicting human health is socio-economics. Similarly, economic
and environmental conditions go hand in hand. For over 200 years, the foundation of the city‟s economy
was wrapped around its manufacturing work. This economic activity, combined with its location as an
intersection for trade, turned Springfield from a farming hamlet into vibrant city. But it is also the source
of many of its environmental problems. The disappearance of these factories left enormous environmental
and economic problems in their wake. The cost of redevelopment – including cleaning up past problems -
has also created challenges for 21st century development. The loss of factory work decimated Springfield‟s
job markets and a decade of municipal budget cuts have further cost residents living wage jobs, municipal
services and challenged the city‟s capacity to maintain its schools, buildings, roads and infrastructure.
While there has been significant investment in Springfield recently, the challenges remain daunting.
When the economy crashed in 2008, Springfield‟s residents bore the brunt of the pain. Its
neighborhoods continue to reel from high foreclosure rates, closed businesses and high unemployment
rates. Foreclosures have wreaked havoc on communities. One out of twelve (8%) housing units in
Springfield remain empty or abandoned. High unemployment rates among youth in the summer seem to
coincide with an increase in youth violence during those months.
The cost of living in Springfield Massachusetts is 20% higher than the national average, while
Springfield‟s household income is 20% less than the national average. Per-capita (per person) income for

6
Springfield is only 54% of the state-wide average (Springfield: 18,105; Massachusetts; $33,460). This
means that the economic stresses on residents – particularly families - are more severe than other
statistical measures might indicate.
23% of Springfield households are without cars, making them dependent on mass transit. For those
residents, access is limited to bus routes. Those without cars are access-limited to opportunity and
resources provided by intercity transportation. Currently, intercity public transportation does not yet allow
for full, free and easy movement of city residents to out-of-town work, shopping or other opportunities.
Adding to these economic and infrastructural challenges are the problems of racism in Western
Massachusetts. Hampden County is very racially segregated. According to the 2010 census, 79% of
African Americans and 61% of Latinos live in Springfield. This segregation becomes starker when
Holyoke is included. 81% of African Americans and 85% of Latinos live in these two cities, while much
of the work and economic opportunity lies outside these towns.
Limited access to opportunity further exacerbates and exposes other structural racism issues,
including education, justice, policing, etc. Over the course of the past few decades, this institutional
racism has become a dynamic force, magnifying toxic conditions in center-city and low income
neighborhoods. It also accounts for increasing health disparities for poor people and people of color.
These issues negatively impact the city economy as a whole, reducing personal and municipal
revenue, giving meaning and value to Springfield‟s designation as an Environmental Justice community.
They also combine to allow a disproportionate number of environmental health hazards to be located in
Springfield, diminish the city‟s capacity to regenerate the economy and environment, while undermining
city residents‟ capacity to participate in the decisions that affect their lives.
Some other significant socio-economic issues to consider:
o Unemployment: Official rate (U-3) 8.1% (Nov. 2011), Census 2010 (18.5%). Including
discouraged workers and underemployed, estimated at 20% or more.
o Foreclosures: 1,312 Springfield homes in foreclosure, July-Sept. 2011, the second highest
foreclosure rate in New England.
o Poverty: 34% of residents. 48.3% of children under 18. (125% of US poverty threshold).
o Vulnerable Populations by Age: 31% under 20. 11% over 65. These populations are at
greater health risk than the general population.
Environmental/Health Disparities The state of the environment has a direct bearing on health disparities. The combination of
increasing economic disparities, existing health issues and disproportionate exposure to environmental
hazards, can create further health disparities experienced by Springfield residents. The sum of health,
socio-economic and environmental disparities led the University of Wisconsin‟s Population Health
Institute to rank Hampden County worst in MA for health outcomes and factors in 2011.
Here are some health disparities – where the environment is a factor - at a glance:
Health Disparities with Environmental Component Springfield Massachusetts
Asthma among public school children 21% 10.85%
Asthma ER visits for children 0-14 (Age-adjusted to 2000 US standard pop.) 1839 808
Infant Mortality Rate (per 1000 live births) 10.6 5.1
African American Infant Mortality Rate (per 1000 live births) 15.4 11.3
Lung Cancer Mortality Rate 65.5 52.4
Female Breast Cancer Mortality Rate 25.9 23.0
Obesity Rate (Age-adjusted to 2000 US standard pop.) 66 56
Diabetes Hospital Discharge Rate (age adjusted per 100,000) 274.2 132.4
Diabetes Death Rate (age adjusted per 100,000) 27.1 18.4
Hypertension Hospital Discharge Rate (age adjusted per 100,000) 75.7 38.7
Premature Death Rate (per 100,000 persons under 75, age-adjusted to 2000 US
standard pop. under 75 years) 466 317
7
The state of the environment has a direct bearing on health disparities. Poor indoor and outdoor air
quality increases the likelihood of asthma episodes. Some conditions can produce asthma in a child that
might otherwise never develop that chronic condition. Safety concerns limit resident use of outdoor spaces
for exercise. When combined with pollutants present in the environment, this increases risk of heart
conditions, obesity, diabetes and certain forms of cancer. Large sections of Springfield have been
designated as „food deserts‟, due to the lack of quality fresh fruit, vegetables, fish and meat. This means
the population is more dependent on fast and processed food and is at further risk for diabetes, obesity
rates and other nutrition-related health problems.
Understanding Springfield’s Environmental Problems Springfield was built over several centuries around heavy industry and commerce, mixing housing
with industry in the same neighborhoods. As the factories went out of business or moved away, it affected
other businesses; gas stations, dry cleaners and other forms of commerce. Over time, the landscape
became littered with empty and abandoned buildings and lots. While the factories may have closed, the
buildings and the materials they used remain, polluting the soil and challenging future development. A
factory may have closed a century ago, but the pollution they added to the soil – arsenic, mercury, lead,
cyanide, gasoline – may remain for centuries, if not addressed. Pollutants in the soil migrate to water
bodies and a century-old storm drain system mixes sewage with storm runoff, pouring both into
Springfield‟s ponds and lakes.
The remaining heavy industry combines with several major highways and a significant number of
truck, train and bus depots to add pollution to the air. Cars remain the most important means of
transportation in Springfield. Those without cars are at a major disadvantage when it comes to jobs or
access to services, shops, etc. These, too, play a major part in Springfield‟s air pollution. Mixed
residential and industrial neighborhoods mean that truck traffic is a factor in air pollution in local
neighborhoods as well as the city as a whole.
As if these challenges were not enough, a tornado tore through town June 3, 2011. It caused
widespread damage in 7 neighborhoods and devastated three (Old Town, Six Corners and South End).
This extreme weather event was followed by several others (including Hurricane Irene), capped off by an
October snowstorm that left many in the city without heat or electricity for up to 8 days.
The Precautionary Principle and Environmental Stewardship The CARE Project adopted the ‘precautionary principle’ at the outset of its investigations. Risk
assessment in the US assumes an action, policy or product (with some exceptions) is safe until proven
otherwise. For example, cigarettes were „safe‟ until science had exhaustively proven their dangers and
industry had lost all recourse in avoiding responsibility.
The precautionary principle – on the other hand - argues that if an action, policy or product is
suspected to cause risk of harm to the public or to the environment – even if scientific assessment has not
reached consensus on its dangers - the burden of proof falls to those taking the action, to prove their
activity is not harmful.
This project has also adopted ‘Environmental Stewardship’ as a model for addressing problems
going forward. This idea embraces the concept of responsible use and protection of the natural
environment through conservation and sustainable practices. As we move from identifying problems to
developing solutions, the CARE project will use the concept of environmental stewardship as a guiding
principle in addressing Springfield‟s many environmental problems.
Prioritizing Environmental Issues Following this executive summary, we have included 11 factsheets on various issues identified by
the public in our outreach and those that were well-known at the time we began our work. Our outreach
consisted of presentation/discussion to local groups, tabling at public events, community forums on a
variety of topics and the collection of feedback forms. This work remains ongoing and will continue to be
a part of our efforts.

8
The issues presented in these factsheets do not reflect the sum of all environmental issues in
Springfield, but rather the beginning of the assessment. One of the challenges we faced in our assessment
is the number, depth and complexity of some of Springfield‟s problems and – in many places – the
absence of data to explain the issues. We will be reporting on these matters in greater detail in our
upcoming Report on the Environment in Springfield. But some are so profound, additional resources will
be needed to understand them fully. For now, this document must suffice to begin this conversation.
Assessing Environmental Risk One requirement of the US EPA‟s CARE Project is the development of an Environmental Risk
Ranking process to assess the impact of environmental issues on Springfield and to include community
priorities in that process. The goal is to create a transparent process, using standardized criteria and
community input to determine which environmental issues are affecting Springfield the most.
In the first phase of this project, Umass faculty and graduate students investigated known
environmental issues, based on available data. A feedback form was developed (see Appendices) that
included quantitative (pre-determined check-list) and qualitative (open-ended, write your own answer)
questions to assess community concerns. These were collected at community forums, roundtable
discussions and tabling at community events. In addition, community members were invited to offer
verbal responses at these events. 270 feedback forms were collected. This process is still on-going.
As community members raised issues, these were passed on to Umass faculty and graduate
students, along with investigation by CARE Project staff and are – at least partially – reflected in this
document. This work is on-going and will be more fully reflected in the report to come.
Umass faculty and graduate students developed a spreadsheet model for assessing environmental
health risks Umass faculty and graduate students developed a spreadsheet model for assessing
environmental health risks. Quantitative and qualitative answers and other forms of feedback were not
integrated at this time, except to guide research and to highlight the potential top issues. A scoring process
was used in which each environmental issue was assigned a number that described its impact on
Springfield‟s residents and environment in the following areas:
o Exposure- how many people are exposed including percentage of people at risk and likelihood
of exposure. Special attention was given here to „vulnerable populations‟ (seniors/children).
o Health Impact- how harmful it is to people‟s health including symptoms experienced, health
problems caused by issue, severity of symptoms and health problem, number of ER visits
o Economic Impact - how costly it is to the Springfield economy including estimated current
cost, healthcare costs and loss of productivity
o Ecologic Impact - how harmful it is to the Springfield environment including buildings,
vegetation, water, soil and animals
The issues were ranked – each category treated equally in the math – generating the topics for
inclusion, in the factsheets that follow. The one, high-scoring issue not represented in these factsheets is
Pollen – a natural biological pollutant. Research is ongoing for this topic and will be included in the report
to come. Here are the overall scores for the quantitative component of the feedback forms:
Outdoor Air Pollutants - Individual pollutants
Ozone
Nitrogen
Dioxide NO2
Sulfur
dioxide
SO2
Small Particulate
Matter
PM2.5
Carbon Monoxide
CO
Exposure 2.94 2.78 2.61 2.94 2.61
Health Impact 3.71 2.00 2.00 4.14 2.43
Economic Impact 4.00 3.00 2.33 4.00 2.00
Ecological Impact 2.00 2.40 3.20 2.40 1.20
Average 3.16 2.54 2.54 3.37 2.06
Community Concern 2.68 -- -- 2.65 --
9
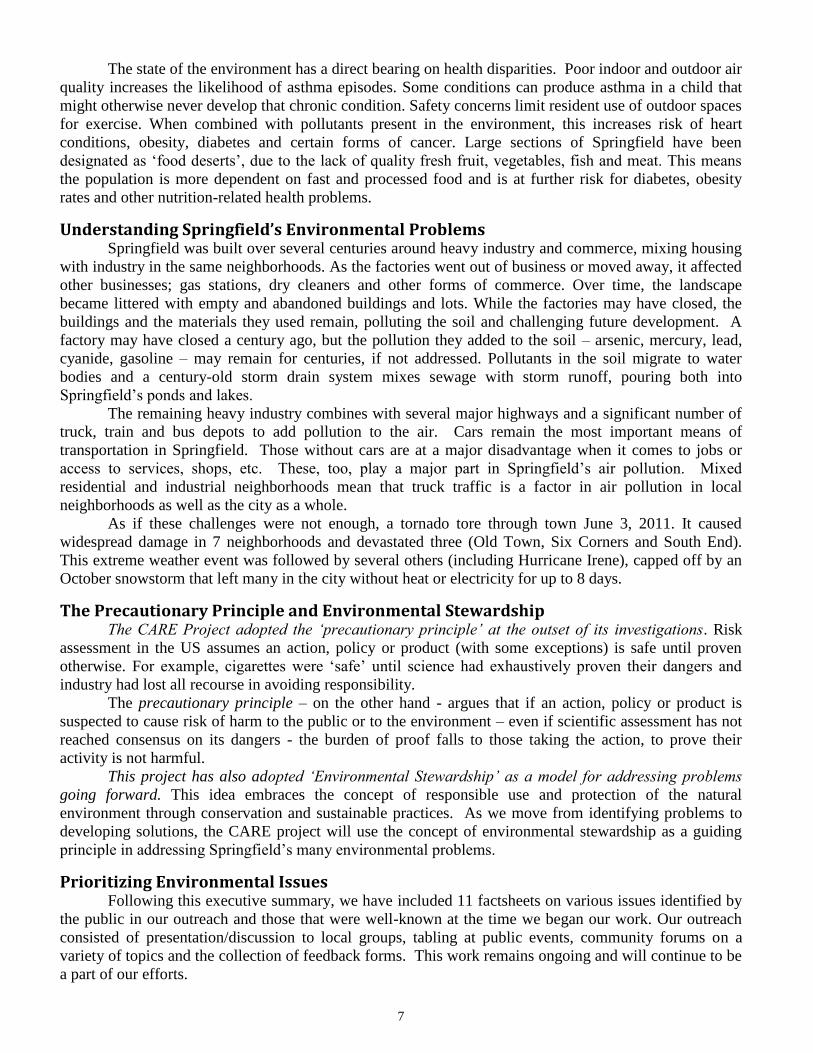
Air Pollution Sources
Vehicle Exhaust Diesel Exhaust Industrial air pollution Pollen and Mold
Exposure 3.28 2.94 3.11 2.94
Health Impact 3.86 4.00 3.86 2.86
Economic Impact 3.67 3.67 3.67 2.67
Ecological Impact 2.40 2.80 2.60 1.20
Average 3.30 3.35 3.31 2.42
Community Concern 3.00 3.00 2.83 3.01
Indoor Air Pollutants Mold Lead Paint Second-hand Smoke Pests Radon
Exposure 3.50 3.00 3.44 3.22 2.94
Health Impact 2.57 3.14 4.29 2.57 3.71
Economic Impact 4.33 3.33 4.33 3.33 3.00
Ecological Impact 1.80 2.20 1.80 2.60 1.40
Average 3.05 2.92 3.47 2.93 2.76
Community Concern 2.49 2.22 2.17 2.30 1.65
Indoor Environmental Pollutants
Carbon
Monoxide Odors from Chemicals Asbestos Chemicals/ Pesticides
Exposure 2.28 3.44 2.22 3.33
Health Impact 3.71 3.00 3.29 3.43
Economic Impact 2.33 2.33 3.33 2.67
Ecological Impact 1.40 1.00 1.20 2.80
Average 2.43 2.44 2.51 3.06
Community Concern 1.78 1.98 2.37 2.22
Water Pollutants
Chemicals,
Disinfection By
products
Bacteria in
drinking
water
Prescription
Drugs Heavy Metals
Fish
Consumption
Exposure 3.56 2.39 1.78 2.06 2.06
Health Impact 2.43 2.86 1.57 2.86 1.29
Economic Impact 2.00 2.33 1.33 2.00 1.00
Ecological Impact 1.80 2.20 2.00 2.00 1.40
Average 2.45 2.44 1.67 2.23 1.44
Community Concern 2.19 2.12 2.35 -- --
Soil Pollutants
Chemicals/ Pesticides
in soil
Brownfields
Abandoned
buildings Trash/Debris Illegal Dumping
Exposure 3.27 3.07 3.47 3.27
Health Impact 3.43 2.00 1.57 1.57
Economic Impact 2.00 2.67 1.33 1.33
Ecological Impact 3.40 3.20 3.40 3.60
Average 3.02 2.73 2.44 2.44
Community Concern 2.70 3.09 3.03 2.95

10
The community responses to the quantitative questions (ranking their priorities from 0-4, with an
additional option for „don‟t know‟) were entered as a separate category in the risk-ranking matrix for
comparison.
At the second Stakeholder meeting – January 24, 2012 – the community will be asked to weigh the
importance of each impact category – ecologic, economic, heath, exposure, & community concern –
giving each category more or less weight in the final analysis. At this meeting, we will also consider the
issues raised in the open-ended (qualitative) questions of the feedback form and integrate them into the
overall risk-ranking process, to arrive at prioritized solutions. Since these questions invited people to
identify issues in their own words, their answers varied widely. Here are their most frequent responses:
Most Frequently Mentioned Environmental & Health Concerns (Open-ended qualitative question responses)
Top Environmental Issues Top Health Issues
Outdoor Air Pollution Asthma & other Respiratory Issues
Trash/Litter/Dumping Obesity
Pollution (general) Diabetes
Indoor Air Quality Hypertension/Heart Disease
Built Environment/Soil/Brownfields Nutrition/Food Access Issues
Violence/Safety Violence/Safety
Water Cancer
Smoking/Second-Hand Smoke Smoking/Second-Hand Smoke
Food Access Issues
Biking/Walking/Trails (no other issue received more than 6 responses)
Community Prioritization This document will serve as a discussion paper for deliberation at our stakeholder meetings
January 10 and January 24. The decisions made at these two meetings will determine this project‟s
priorities going forward. At the first meeting, we will discuss some of our findings, deliberate on why
Springfield was designated as an „Environmental Justice‟ community and begin the process of considering
our options. At the second meeting, we will prioritize issues and the various impact categories (health,
economic, quality of life, environment, etc.).
Feedback given and priorities made at these meetings will drive our Report on Environmental
Health in Springfield. This document will address the broader environmental issues, include an inventory
of community assets and resources, propose solutions and make recommendations. It will be published in
late spring 2012 and presented to the Stakeholder community for deliberation and feedback.
Out of this deliberation and decision-making process, we will produce an Action Plan for
improving environmental health in Springfield. As with all previous documents produced by this project,
it will be presented to the community for deliberation and decision-making. This will form the basis for
building a sustainable environmental health coalition and doing the hard work of improving those
conditions in Springfield.
We want you to be a part of this process. Those who sign up as stakeholders will be entitled to
vote on priorities, included in all future Stakeholder Meetings, and invited to participate in the decisions
and actions of the greater coalition. We invite and encourage your participation in this process.

11
Factsheet Overview
Each subject factsheet is followed by a second page that explains how it was ranked according the
various impacts described previously (exposure, health, economic, environmental). As previously noted,
these issues reflect on-going engagement with environmental issues and represent only those issues we are
ready to report on now.
Other issues, such as industrial air pollution, the built environment, water, extreme weather events,
schools and public buildings, pollen and youth environment will be presented when our assessment of the
issues is more complete. These have been presented in the following order:
Earth
Brownfields
Trash, Litter & Illegal Dumping
Soil
Outdoor Air
Diesel
Cars
Indoor Environment
Lead
Mold
Second Hand Smoke
Pest & Pesticides
Carbon Monoxide
12
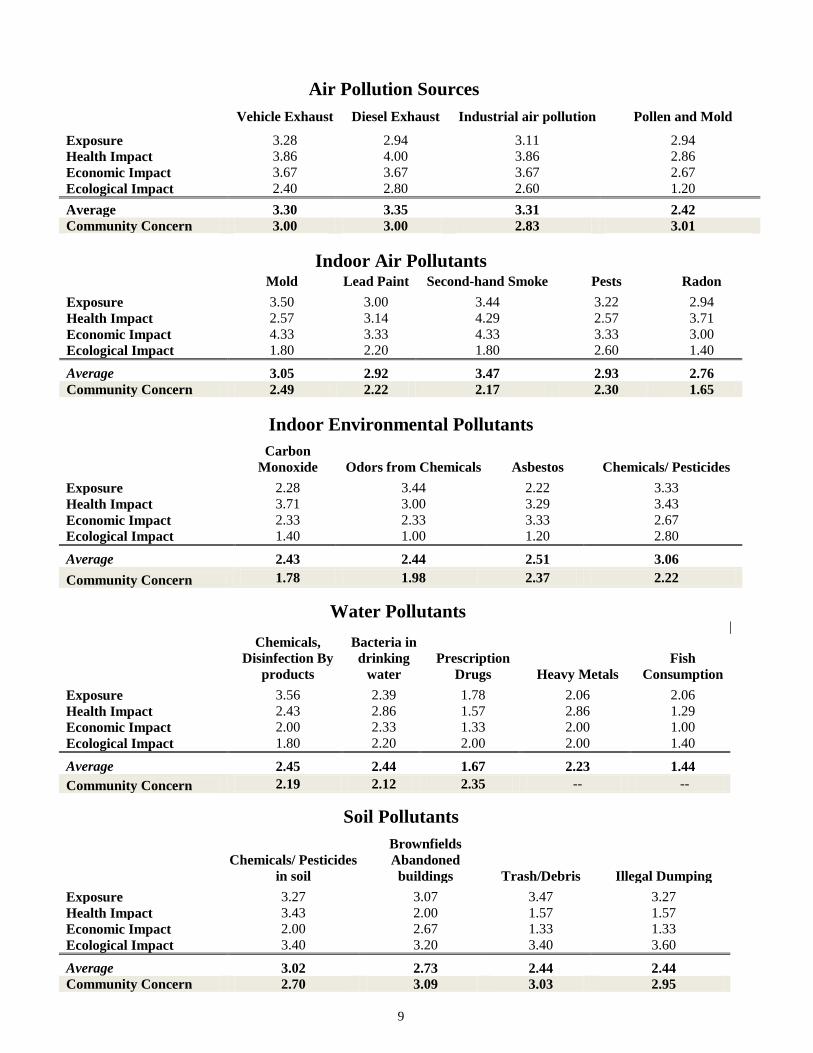
Brownfields/Oil & Hazardous Waste Sites
The term „Brownfield‟ describes abandoned or inactive property or land with known or suspected
pollutants. It includes closed factories, vacant lots, abandoned homes or buildings, auto repair shops, gas
stations, or dry cleaners. A „hazardous waste site‟ is a more specific legal term that describes a site with
documented pollutants in its soil. In Massachusetts, those pollutants can include oil/petroleum products.
Due to economic problems over the years, many Springfield homes and factories have been
abandoned. Many of these sites are suspected or known to have pollutants. Some chemical manufacturing
plants still in business are known oil & hazardous waste sites. Cleaning up pollutants in hazardous waste
sites and brownfields can be expensive and may require corporate, state and federal funding.
The impact of brownfields and hazardous waste sites on the health and safety of the surrounding
neighborhood depend on a number of factors. These include how close the site is to people, drinking
water and wildlife habitat; the presence, type, and amount of pollution and the present and future use of
the site. As these sites are near densely populated residential areas, they have attracted gangs, illegal
dumping, and other crimes.
What are the significant issues?
985 oil & hazardous waste sites have been documented in Springfield since the state started tracking
hazardous waste sites in the mid-1980’s. Over time, these sites have had various levels of pollution.
Many have been cleaned-up or addressed to varying degrees, some are in the process of being
addressed, and a few have only recently been identified.
The highest number of hazardous waste sites is in East Springfield and Indian Orchard.
Springfield has at least 150 additional brownfields sites. They range in size from ½ acre to over 10
acres, covering more than 70 acres of Springfield land.
The hazardous materials commonly found in brownfields and hazardous waste sites depending on the
particular site, include:
Heavy metals such as lead, cadmium and arsenic, and other toxic materials such as PCB‟s,
asbestos, petroleum products and chlorinated solvents.
Abandoned houses are common in many neighborhoods.
1 out of 12 (8%) housing units in Springfield are empty (4954 vacancies). Many of these are
abandoned buildings depress property values and can be hazardous.
The June 2011 tornado made the brownfield problem worse.
Of the seven neighborhoods affected, three (South End, Six Corners, Old Hill) were
devastated, creating more brownfields in these areas.
Health Risks
Some pollutants in Springfield‟s brownfields and hazardous waste sites could cause heart and lung
disease, cancers, birth defects, nervous system damage and other health conditions if people are
exposed to high levels.
The health risk for some contaminants, such as lead, are greater for children and pregnant women.
Contaminants may travel in windblown dust and get into the soil of vegetable gardens of neighboring
properties. Gardeners need to take extra care when planting food crops.
13
Risk Assessment for Brownfields/Oil & Hazardous Waste Sites
Exposure = 3.07 (1 = low risk, 5 = high risk)
Because of the wide array of contaminants that could be found in a brownfield site, there could be three
routes of exposure: ingestion, inhalation, and contact with the skin. Because there are at least 175 sites in
Springfield that have not been cleaned up, exposure is likely for a large percentage of the population.
However, duration of exposure is likely to be low, because most people will not be spending long periods
of time in these sites.
Health Impact = 2.00 (1 = low impact, 5 = high impact)
The large variety of potential contaminants in brownfield sites means that there could be a wide array of
health effects. Physical injury, cardiovascular disease, and cancer are some examples of potential health
effects, which range from moderate to severe. However, because most brownfield sites are not confirmed
to have toxicity, the health effects are less likely to be experienced. The likeliest health impact is physical
injury, which is only likely when people are in the brownfield itself.
Economic Impact = 2.67 (1 = low impact, 5 = high impact)
The current costs to the city from brownfields are very high. Every abandoned building represents lost
productivity, because that building is contributing nothing to the city. In addition, brownfields will lower
property values around themselves, which has an impact on the entire neighborhood. However, because
brownfields are only suspected toxic sites, many are likely not harmful. Thus, the health impact and loss
of resident productivity is low.
Ecological Impact = 3.20 (1 = low impact, 5 = high impact)
Brownfields can have a moderate ecological impact on the city of Springfield. The contaminants that can
potentially be contained in these sites can leach into soil and water and cause an accumulation of oil and
hazardous waste. They can also cause health effects in animals, such as pets and wildlife. Brownfields
can also detract from building aesthetics simply because abandoned buildings are often poorly kept, and
they detract from the appearance of other buildings around them.
Overall Score = 2.73 (1 = low impact, 5 = high impact)
Although exposure to brownfields is likely, most people are not exposed for a long period of time.
Furthermore, although the health effects can potentially be very serious, it is unlikely that people will
experience the most severe symptoms. Brownfields have a very high cost to the city in the form of lost
property value and lack of productivity from the site, but medical costs and loss of citizen productivity are
low. Brownfields also affect the aesthetics of buildings, soil, and waterways, and the potentially toxic
materials can have a negative impact on soil, water, and animals.
Community Concern = 3.09 (0 = no concern, 4 = great concern)

14
Trash, Litter and Illegal Dumping
Springfield community surveys show that many residents are concerned about trash, litter and
illegal dumping. As landfills have closed down in Massachusetts and costs of collection have increased,
many residents and contractors are not properly disposing of trash. This is partially dealt with by re-use
and recycling programs, but has also led to increased illegal dumping. The problem of illegal dumping
may have become even worse after the City started a $90 annual trash fee in 2008 to cover some of its
costs.
Most litter is produced by garbage that escapes from trashcans and commercial dumpsters, loading
docks, construction and demolition sites. It also comes from items tossed by pedestrians and motorists in
the streets.
Illegal dumping can be from residents, businesses, or from contractors. It is a threat to the
environment, public health and safety. Pollutants can leak from dumped materials into the air, soil and
groundwater (See Brownfields/Oil & Hazardous Waste Sites Factsheet). Rotting food and household
items attract rats, mice, cockroaches and other pests. Illegal dumping along roadways may also create
hazards for pedestrians and drivers.
What are the concerns about trash, litter and illegal dumping?
Many items dumped contain harmful chemicals that pollute the environment:
Building products - These can include paint, strippers, oils, pressure treated wood that contain toxins
like methylene chloride, PCB‟s, arsenic and asbestos.
Electronic products – Computers, cell phones, and televisions. They contain highly toxic metals and
chemicals, like mercury, cadmium, and flame-retardants.
Household products - Some mercury containing items include: florescent light bulbs, old
thermometers, pre-1990 batteries, light switches, old thermostats. Household pesticides, and many
cleaning and maintenance products are also toxic.
Abandoned cars – They have leaking oil, gasoline, anti-freeze and rusting metals.
Abandoned tires – They pollute soil and provide an ideal place for mosquitoes to grow. Mosquitoes
can spread diseases, including West Nile fever and encephalitis.
Medical waste – Hazardous items include syringes, old thermometers, medications, and fabrics
contaminated human body fluids and waste.
Water-related environmental risks of illegal dumping include…
Contamination of ground water, ponds, streams and wetlands.
Flooding and blocked streams, storm drains and drainage basins.
Litter, illegal dumpsites and uncollected trash cause property values and quality of life to go down. They
also increase costs to taxpayers for removal and clean-up.
Other Health Risks
Children are at special risk due to illegal dumping.
Vacant lots and dumpsites become playgrounds for children. Exposure to many safety and health
risks, including injury, tetanus, disease and bedbugs is likely.
Discarded furniture spreads bedbugs and disease
Soft household goods – mattresses, couches, chairs, carpets – may have bedbugs, fleas, and disease-
causing germs. People taking household furniture that has been left on the side of the road or at
dumping sites bring these problems into their home.
15
Risk Ranking for Trash, Litter, and Illegal Dumping
Exposure = 3.47 (1 = low risk, 5 = high risk)
There is a large amount of litter and debris around the city of Springfield, and thus there is a high
percentage of people exposed and their likelihood of being exposed is high. However, because people
spend less time outside than inside, their duration of exposure to these contaminants is low.
Health Impact = 1.57 (1 = low impact, 5 = high impact)
The main health effect of trash and litter is physical injury. People can become injured by tripping or
coming into contact with trash or debris, but there are relatively few health effects apart from this. The
likelihood of these effects are the same in both sensitive and general populations.
Economic Impact = 1.33 (1 = low impact, 5 = high impact)
The economic impact of trash and litter is low. It is unlikely to create high medical costs, because the
health impacts are fairly small. The current costs to the city are also low, as dealing with trash and illegal
dumping does not have a high cost.
Ecological Impact = 3.40 (1 = low impact, 5 = low impact)
Trash and illegal dumping can have a large impact on building and waterway aesthetics, because the sight
of trash makes these areas look worse. Animals can be harmed by the trash in the environment, either by
eating it or getting caught up in it and choking.
Overall Score = 2.44 (1 = low impact, 5 = high impact)
The health and economic impact of litter and illegal dumping is relatively low. With the main symptom
being physical injury, the severity is low and thus the medical costs will be low as well. Exposure to litter
and illegal dumping is high, because there is a lot of it throughout the city and most people will eventually
be exposed. It can also mar the aesthetics of buildings, water, and other areas, and can cause damage to
animals.
Community Concern = 3.07 (0 = no concern, 4 = great concern)
16
Chemicals and Pesticides in Soil
Keeping pollutants out of the soil is important to protect the health of people and animals, as well
as plant and water resources. Pollutants can get into soil from the air, rain, water run-off, and building
materials. Soil pollution can also happen due to accidental spills, illegal dumping of hazardous materials,
and chemical use. One of the biggest uses of chemical products is for lawn and garden care. Pesticides are
used to kill certain types of bugs. Herbicides are used to kill weeds. Chemicals are also used to fertilize
the soil to make plants grow. Chemicals can get into the body by breathing them in, or absorbing them
through skin during lawn care, garden activities, or play. They can also be absorbed into the plants we eat
for food. Many of these chemicals are known to cause cancer, affect our nervous systems, or have other
serious health effects.
Places in the community where pollutants can get into the soil include: homes, golf-courses,
landfills, gas stations, auto repair shops, dry-cleaners, and industries. About 1400 accidental spills of
chemicals in Massachusetts are reported each year.
Significant Issues
Some pollutants do not break down easily and stay in the environment for a long time
PCB‟s are often present in caulking and sealants used in buildings. They were banned in 1979.
They will also be present in the soil around these buildings.
Lead is still present in soil from exhaust from vehicles using leaded gasoline before 1996. Lead in
soil also comes from peeling, chipping, scraping and sanding of lead-based paint on homes before
it was banned in 1978.
Arsenic, copper, and chromium can get into soil from pressure treated wood used in yards,
decking, and playgrounds. Regulations were passed in 2003 limiting its use for homes and
playgrounds.
Cadmium levels in soil have been increasing due to the use of recycled materials containing heavy
metals being used to make fertilizer.
There is widespread use of pesticides and herbicides
85% of US households use pesticides.
Pesticides and their containers are often thrown out in regular trash or illegal dumping sites and
pollute the environment.
There are frequent spills of petroleum products
Gasoline and oil is accidentally released at gas stations, auto repair shops, industry, and homes.
Undetected leaks are a problem with underground storage tanks.
Fuel spills occur during vehicle accidents and fueling of vehicles and buildings.
In 1999, there were more than 4200 spills in the US of over 15 million gallons of oil.
Health Effects
Children are particularly vulnerable to petroleum products and lead in soil which affects their
developing brains and organs.
Heavy metals such as arsenic and chromium can cause cancer.
Pesticides can cause a wide range of health effects including: headaches, nausea, dizziness, eye and
lung irritation, skin reactions, allergies, asthma, chemical sensitivity, infertility and birth defects,
autism, learning disabilities, cancer, diabetes, Parkinson‟s and Alzheimer‟s disease.

17
Risk Ranking for Pesticides/Chemicals in Soil
Exposure = 3.27 (1 = low risk, 5 = high risk)
Because pesticides and chemicals are so widely used, the likelihood of exposure from soil is high. People
spend a relatively small amount of time outdoors every day, and thus their duration of exposure will be
low. However, soil containing pesticides can be tracked into the home, which will increase the likelihood
of exposure. Overall, the amount of these chemicals will be slowly decreasing over time, since many
chemicals, such as PCBs, have been banned.
Health Impact = 3.43 (1 = low impact, 5 = high impact)
Chemicals/pesticides can have a wide variety of symptoms, including cancer and an increased risk of
mortality. Although the symptoms will affect sensitive populations, such as children and the elderly, more
greatly, the general population is also at risk from these substances. However, although the health effects
are severe, they are not acute and thus not as likely to result in emergency visits.
Economic Impact = 2.00 (1 = low impact, 5 = high impact)
The cost to the city from chemicals/pesticides is relatively low. There are not many clean-up efforts for
these substances, and because the health effects are more long-term, there will be fewer high hospital bills
from emergency room visits. For the same reason, the loss of productivity will be smaller as well.
Ecological Impact = 3.40 (1 = low impact, 5 = high impact)
Chemicals/pesticides have an insignificant effect on building aesthetics, but they can cause damage to
many other ecological aspects. They can accumulate in water and soil, which causes them to accumulate
in the animals and insects, and this can cause damage to these living things. Also, because pesticides are
designed for the purpose of killing pests, they can cause damage to plants and animals that are not the
target of the chemicals.
Overall Score = 3.02 (1 = low impact, 5 = high impact)
Chemicals/pesticides can have some significant health and ecological impacts, but although the health
impacts are severe, the likelihood of experiencing these health impacts is relatively low. Duration of
exposure is low because of the small amount of time most people spend outdoors, but chance for exposure
is high because soil containing chemicals/pesticides can be tracked indoors.
Community Concern = 2.66 (0 = no concern, 4 = great concern)

18
Air Pollution from Diesel Exhaust
The burning of diesel fuel creates diesel exhaust. Diesel fuel is used in trucks, trains, buses, and
construction vehicles. Like exhaust from gasoline vehicles, diesel exhaust is a mixture of gases and small
particles (PM2.5 or “soot”). It includes more than 40 harmful air pollutants. Diesel exhaust has different
chemicals and more particles than regular car exhaust. This is because diesel fuel is less refined (or
processed) than gasoline and is burned differently. Sulfur is a pollutant found in diesel. Recent
government regulations reduced the amount of sulfur in diesel fuel. Lowering sulfur levels reduced the
smell of the exhaust. It also reduced the amount of acid rain and the harmful effects of diesel pollution on
the environment. However, the particles in diesel exhaust are still a major factor in polluting the air and
are a serious concern for human health.
When people breathe air containing diesel exhaust, the small particles are deposited in the deepest
part of the lungs. This causes inflammation (or irritation and swelling). This inflammation can make it
hard to breathe and worsen lung disease. Also, the inflammation can spread to other parts of the body such
as the heart and cause heart attacks. Allergens from pollen and mold can attach to diesel particles and
become stronger allergy triggers. This can make allergies and asthma more severe.
What are the major concerns of diesel exhaust?
There are days with unhealthy air quality
The government has standards for the amount of pollutants in the air. Above these levels the air
is unhealthy for sensitive individuals and maybe other individuals too (see Health Issues
Section below for sensitive individuals).
Average daily levels of small particles (PM2.5) in Springfield go over the government‟s
standard about once a year. The air is unhealthy for sensitive individuals on these days.
People in certain communities in Springfield are exposed to higher levels of diesel exhaust
Communities with bus and truck depots, where trains idle, or next to major highways or roads
are likely to have higher levels of diesel pollution. Examples are the North End, East
Springfield and Indian Orchard.
Diesel pollution can harm the environment
Diesel exhaust contributes to haze, smog, and global climate change.
Diesel exhaust can soil and discolor buildings.
Health Issues Some people are more sensitive to health effects from diesel emissions, such as…
People with asthma, emphysema, chronic lung disease or heart disease.
People with weaker immune systems, children, babies, and older adults.
Springfield has a large portion of the population that is vulnerable
Springfield has high rates of asthma. 21% of school children have asthma.
Short-term health effects: Eye, throat, bronchial irritation, lightheadedness, nausea, heart attack,
respiratory symptoms (cough, wheezing), increased allergic responses and asthma-like symptoms to
known allergens.
Long-Term Health Effects: Long term exposure to diesel exhaust is also linked to lung cancer and
heart disease.

19
Risk Ranking of Diesel Exhaust in Springfield
Exposure = 2.94 (1 = low risk, 5 = high risk)
A large portion of the population is exposed to outdoor air, and because diesel exhaust is an outdoor air
pollutant, there is high likelihood that many people will be exposed. However, for many people, time
spent outdoors is relatively low compared with time spent indoors, reducing the risk of exposure. The
trends show that diesel emissions in Springfield are slightly decreasing over time, but there are many days
at or near the EPA standards.
Health Impact = 4.00 (1 = low impact, 5 = high impact) Diesel exhaust has a number of significant health effects, including respiratory symptoms, asthma
symptoms, and increased risk of cardiovascular disease. In Springfield, there are 33,711 children under
the age of 14 and 16,760 adults over age 65. These are sensitive populations, for whom exposure to diesel
exhaust could have a larger negative impact. In addition, as of 2007 14% of children in Springfield have
been diagnosed with asthma, which makes them more sensitive to diesel exhaust.
Economic Impact = 3.67 (1 = low impact, 5 = high impact)
In 2008, Springfield had 2,728 emergency room visits for asthma alone, which is a considerable cost to
the city. As well, diesel exhaust can increase risk for cardiovascular disease, which is another disease that
can require an expensive hospital stay. In addition, the hours of productivity lost to the city due to asthma
and other respiratory illnesses associated with diesel exhaust is large economic impact.
Ecological Impact = 2.80 (1 = low impact, 5 = high impact)
Diesel exhaust can accumulate on buildings, which mars their aesthetic appeal. The ozone generated from
NO2 in diesel exhaust can have negative impacts on plant life, and animals can inhale the small particles in
diesel exhaust and suffer from negative health effects.
Overall Score = 3.35 (1 = low impact, 5 = high impact)
Diesel exhaust can have many negative health impacts on the people of Springfield, particularly in
sensitive populations, such as children, elderly, and asthmatics. Because of this, it can have a large
economic impact on the city. However, overall exposure is likely low, due to the fact that most people
spend a large portion of the day inside. The ecological impact is relatively minor as well.
Community Concern = 3.35 (0 = no concern, 4 = great concern)
20
Air Pollution from Vehicle Exhaust
Car and truck exhaust is a major source of air pollution in cities. This exhaust is similar to exhaust
from fuel burned in homes and businesses. Exhaust has a gray color and is a mixture of particles and
gasses. Particles are described according to size. Exhaust particles are very small and can remain in the
air for a long time and travel great distances. These particles are about 1/30th
the size of a human hair and
are called PM2.5 (smaller than 2.5 micrometers). When a person breathes them in, they can reach the
deeper parts of a person‟s lungs. Depending on the types of chemicals they are made of, they can cause
irritation and swelling of the airways leading to the lungs.
Another part of vehicle exhaust is nitrogen dioxide. It is a reddish-brown, sharp smelling, toxic
gas associated with smog. It is also created from other sources such as industrial burning of fuels and
burning of wood. It causes irritation to eyes, nose, throat, and lungs, and can worsen symptoms for people
with asthma.
On summer days when nitrogen dioxide levels are high and there is bright sunshine, the sun‟s
energy changes nitrogen dioxide and oxygen from the air into ozone. Ozone can damage lung tissue when
inhaled. It is normally present high up in the air, high above the clouds, and protects us from harmful
sunlight called ultra-violet (UV) light. However, when it is present at a level near the ground where we
can breathe it in, it can be very harmful. Ozone is not released directly from any pollution source. It is
created on sunny days when there is nitrogen dioxide. Therefore, it is common in the summertime
wherever there is a large amount of nitrogen dioxide from exhaust.
Significant Issues
Springfield residents mainly drive to work
86% of individuals drive a vehicle to work and only 6% take public transportation.
Several major roadways and two highways (I-91, 291) run through the city
This increases exposure to vehicle exhaust for residents in nearby neighborhoods.
There are days with unhealthy air quality
The government has standards for the amount of pollutants in the air. Above these levels the air is
unhealthy for sensitive individuals and maybe other individuals too.
Average daily levels of small particles (PM2.5) in Springfield go over the government standard
about once a year. On these days, the air is unhealthy for sensitive individuals. See Health Effects
section below.
Average daily levels of ozone come close to, and occasionally go over, EPA‟s standard each
summer. The air is unhealthy for sensitive individuals on these days.
Health Effects
Exposure to these pollutants in vehicle exhaust can:
Cause irritation and swelling in the airways leading to your lungs
Aggravate asthma symptoms in people with asthma
Increase emergency room visits for respiratory symptoms
Cause heart disease, including hardening of the arteries leading to the heart
Can cause cancer
Children and the elderly are two sensitive groups that are most at risk of developing health related
issues from repeated or high level exposures

21
Risk Ranking for Vehicle Exhaust
Exposure = 3.28 (1 = low risk, 5 = high risk)
Likelihood of exposure to vehicle exhaust is very high, because almost everyone goes outside at some
point, and there are many vehicles in Springfield. However, the duration of exposure is likely very low,
because most people only spend small amounts of time outdoors. The trends show that the amount of
pollution in the air from vehicles is decreasing over the past few years.
Health Impact = 3.86 (1 = low impact, 5 = high impact)
Vehicle exhaust has a number of health effects, which includes respiratory symptoms, asthma symptoms,
and increased risk of cardiovascular disease. In Springfield, there are 33,711 children under the age of 14
and 16,760 adults over age 65. These are sensitive populations, for whom exposure to diesel exhaust
could have a larger negative impact. In addition, as of 2007 14% of children in Springfield have been
diagnosed with asthma, which makes them more sensitive to vehicle exhaust. Vehicle exhaust can trigger
asthma symptoms, which can result in an increased number of emergency room visits.
Economic Impact = 3.67 (1 = low impact, 5 = high impact)
In 2008, Springfield had 2,728 emergency room visits for asthma alone, which is a considerable cost to
the city. Vehicle exhaust can also increase risk for cardiovascular disease, which is another disease that
can require an expensive hospital stay. In addition, the hours of productivity lost to the city due to asthma
and other respiratory illnesses associated with vehicle exhaust can be considered a large economic impact.
Ecological Impact = 2.40 (1 = low impact, 5 = high impact)
Vehicle exhaust can accumulate on buildings, which can damage their aesthetic appeal. In addition, the
ozone generated from NO2 in vehicle exhaust can have negative impacts on vegetation. Finally, animals
can inhale the small particles in the vehicle exhaust and suffer from negative health effects.
Overall Score = 3.30 (1 = low impact, 5 = low impact)
Vehicle exhaust has a number negative health impacts on the people of Springfield, which are particularly
severe in sensitive populations, such as children, elderly, and asthmatics. Because of this, it can have a
large economic impact on the city due to the high medical costs incurred from these health effects.
However, even though most people will be exposed during their day, overall exposure is likely low, due to
the fact that most people spend a large portion of the day inside. The ecological impact is relatively minor
as well.
Community Concern = 3.00 (0= no concern, 4 = great concern)

22
Lead in Housing
Lead is a toxic (or poisonous) metal that was an ingredient in paint many years ago. It can be
found on the inside and outside of many homes in Springfield built before 1978. The federal government
banned the use of lead in paint in 1978. One of the main ways that people become exposed to lead is
through chipping, peeling and stripping of lead paint in buildings that have not had their lead paint
removed. Home renovation projects where lead-based paint is sanded or scraped produces the highest
exposures. The law now requires that renovation companies be trained and certified in the EPA‟s Lead-
Safe Renovation, Repair, and Painting program. Workers must use lead-safe work practices.
You can get lead in your body by breathing or swallowing lead dust, or by eating soil or paint
chips containing lead. Besides lead paint, other current sources of lead are soldering on drinking water
pipes. Children are the most at risk for health problems due to lead exposure.
What are the major concerns of lead?
Much of the housing in Springfield contains lead paint
90% of houses in Springfield were built before 1979 and likely have lead paint.
Houses in disrepair are more likely to have paint chips and cracks, which can result in high levels
of lead in house dust.
The 2011 tornado caused a lot of damage to buildings and houses creating water leaks leading to
cracking paint and chips.
Lead dust from paint on houses and buildings can also make its way into the soil and gardens.
Lead from outdoor soil can be carried indoors on shoes and clothing.
Another source of lead exposure is in drinking water
Some drinking water pipes in home and buildings may contain lead solder, which dissolves into
the water. School are required by the Massachusetts Department of Public Health to test for lead
and other pollutants in drinking water.
Health Issues
Children are most at-risk for health problems because of lead exposure
Children are the most at risk of exposure because they spend more time on the floor or the ground
and are more likely to put things in their mouths, such as lead paint chips or their hands that have
lead dust on them.
Lead affects children‟s developing brains, particularly under age 6. Lead can cause learning
problems, decreased intelligence, hyperactivity, headaches, seizures and even death.
Springfield children are at higher risk of lead poisoning.
Springfield is one of the top 10 cities in Massachusetts at highest risk for childhood lead poisoning.
In 2010, 14,771 children under 6 years of age were screened for lead in their blood and 21 children
had higher than recommended levels.
Adults can have high blood pressure, nerve problems, difficulty concentrating, and muscle and joint
problems.

23
Risk Ranking for Lead in Springfield Houses
Exposure = 3.00 (1 = low risk, 5 = high risk)
Because lead in paint was banned in 1978, any home built after this year cannot contain lead paint. Thus,
the amount of lead paint in buildings should be overall decreasing. However, over 90% of the buildings in
Springfield were built before 1978. Thus, many buildings exist that still contain lead paint, and so there is
a risk of exposure through the ingestion and inhalation of dust containing lead paint. In 2010, 14,771
children under the age of 72 months were screened for lead poisoning, with only 21 positive cases.
Health Impact = 3.14 (1 = low impact, 5 = high impact)
Children are the population most at risk for negative health outcomes due to exposure to lead. Many of
the health consequences are to the brain, and can cause learning problems, hyperactivity, slowed growth,
and hearing problems. There are 20,830 children under 6 years of age in Springfield, and these are the
children that are most at risk for negative health outcomes due to lead poisoning. Lead can also cause
high blood pressure, nerve problems, concentration problems, and muscle and joint problems in adults.
Economic Impact = 3.33 (1 = low impact, 5 = high impact)
Because there are so many homes in Springfield that were built before 1978, there is a high likelihood that
many houses still need to have their lead paint removed. The cost for lead removal is high, and so the cost
to the city, homeowners and landlords for lead in the indoor environment is fairly expensive. The
healthcare costs associated with lead poisoning are reasonably high, because when a person goes to the
hospital with lead poisoning, it is often an emergency situation requiring medical therapy to bring the lead
levels down to normal.
Ecological Impact = 2.20 (1 = low impact, 5 = high impact)
The impact of lead on the buildings and plants is low, as it does not cause any physical damage. It can
become an issue in the water because some pipes may contain lead solder, which can increase the
exposure to lead and contaminate the environment. Lead dust can also make its way into the soil, which
can cause problems for wildlife.
Overall Impact = 2.92 (1 = low impact, 5 = high impact)
Lead is a moderate risk for the city of Springfield. It can have significant health impacts on children and
some more minor effects in adults, but the relative abundance of lead in homes is decreasing due to the
fact that lead was banned in paints in 1978. The major cost of lead is from the remediation of homes built
before 1978 that still have lead-based paint, and to a lesser extent from the medications and
hospitalizations that can occur from lead poisoning. The ecological impact is low, with only the soil being
majorly impacted.
Community Concern = 2.22 (0 = no concern, 4 = great concern)
24
Mold in Indoor Spaces
Mold, or mildew, normally grow outdoors on living or dead plants or animals. Mold can be many
colors, such as white, green, orange, yellow, pink, blue, brown, or black. It usually grows in a circular
shape, has a fuzzy or slimy texture, and can smell musty or sometimes sweet or fruity. Mold releases very
small seed-like substances into the air called spores. Spores can travel long distances and can be inhaled
deep into a person‟s lungs.
Since many building materials are made from plants, many materials inside a building may grow
mold (if wet for over 48 hours). Materials such as wood, fabric, paper, leather, and dirt-covered surfaces
are some of the more common materials that can become moldy when damp. Mold spores are present on
all surfaces. They only need water to grow, which can come from: steam in bathrooms; leaks in
plumbing, roofs, windows or basements; flooding; or condensation on pipes and windows. These
conditions are found more often in older or poorly maintained buildings.
What are the concerns about mold?
Mold can grow wherever there is moisture.
Areas with a lot of mold can also remain hidden behind walls & ceilings, under floors, behind
wallpaper, in crawlspaces, etc.
Cleaning mold is often done incorrectly, adding new health risks.
People should not generally use chemical products, such as bleach, to kill mold. These chemicals
can cause their own health effects.
Chemicals, may kill the mold, but dead mold can still cause allergic reactions.
Residents often try to clean-up areas of mold larger than 10 square feet (3 ft. by 3 ft. patch) rather
than getting professional help.
32% of homes were built before 1940, and 80% were built before 1979.
The 2011 tornado caused damage to buildings, resulting in water leaks and mold.
Mold in Schools
The average age of Springfield school buildings is over 55 years old, increasing the possibility of
mold problems in these buildings.
Health Issues:
Indoor mold can cause:
Wheezing and chest tightness in people with asthma
Lung problems in otherwise healthy children
Allergies including sneezing, runny nose, red eyes and skin rash (dermatitis) in otherwise healthy
people
Infections in people with weakened immune systems or lung disease
Mold and dampness in homes can increase the chance of getting asthma, having cough, or other
breathing problems, by 30-50%.
25
Risk Ranking for Mold
Exposure = 3.50 (1 = low risk, 5 = high risk)
Because people spend a majority of their time indoors every day, their risk of exposure is high because
they are potentially exposed for a very long period of time. People can also be exposed to mold through
inhalation, ingestion, and contact with the skin, which increases the likelihood that mold exposure will
occur. Mold is most likely to grow in older and poorly maintained buildings. Because 80% of the homes
in Springfield were built before 1979, with 32% built before 1940, there are many people who could be
exposed to mold.
Health Impact = 2.57 (1 = low impact, 5 = high impact)
Mold exposure can cause a variety of health impacts, including infections and respiratory problems.
Sensitive individuals, such as children, asthmatics, and the elderly are most at risk from exposure to mold.
Mold is a common asthma trigger, and exposure can cause asthma symptoms and allergic reactions in both
sensitive and non-sensitive individuals. However, non-sensitive populations are much less likely to
experience health problems due to mold exposure.
Economic Impact = 4.33 (1 = low impact, 5 = high impact)
The economic impact of mold is on the high end of the scale. To remediate a mold-infested home can be
expensive, especially if the mold has compromised the structure of the building and the materials need to
be replaced. Also, because mold triggers asthma symptoms and allergic reactions, there is a high cost due
to the medications that these issues need. In extreme cases, an asthma attack could result in an emergency
room visit, which is another high cost. Because many people can become sick from mold, the potential
for lost productivity is also very high.
Ecological Impact = 1.80 (1 = low impact, 5 = high impact)
Mold has a relatively low ecological impact. It can cause problems with building aesthetics and structure,
but it does not have serious adverse effects on vegetation or waterways. Mold also has only minor
impacts on soil quality and the lives of animals.
Overall Score = 3.05 (1 = low impact, 5 = high impact)
Mold poses a moderate risk to the city of Springfield. The health effects can be significant in sensitive
populations, and because there are over 50,000 children and elderly in the city, one third of the city is at
increased risk from mold. However, the health effects are generally mild to moderate in severity, with a
relatively smaller number of serious issues. People are likely to be exposed to mold due to the age of the
city and the fact that most people spend a large portion of their time indoors. The economic impact is
high, but the ecological impacts are low.
Community Concern = 2.49 (0= no concern, 4 = great concern)
26
Secondhand Smoke
Secondhand smoke (also known as Environmental Tobacco Smoke or ETS) is a serious
environmental issue that affects the health of many children and adults in Springfield. It is the smoke that
comes off the end of cigarettes, pipes and cigars. It is also the smoke that is exhaled by smokers. This
smoke contains over 7,000 chemicals with hundreds being harmful and about 70 causing cancer. This
smoke mixes with the air in the room and is breathed in by others exposing them to these harmful
chemicals. In 2004, Massachusetts passed a law banning indoor smoking in workplaces, bars and
restaurants. The most common places in Massachusetts where people are exposed to secondhand smoke
are homes and personal vehicles. There is no safe level of exposure to secondhand smoke. Any exposure
is harmful.
What are the major concerns of secondhand smoke?
Children are most at-risk for health problems due to second-hand smoke
Major health problems in children due to second-hand smoke include asthma, Sudden Infant Death
Syndrome (SIDS), pneumonia, and ear infections.
Each year in the U.S., there are 7,500 to 15,000 infants hospitalized due to secondhand smoke.
Each year in the U.S., there are 150,000 to 300,000 new cases of pneumonia and other lung
infections in infants due to secondhand smoke.
Parents are responsible for 90% of children‟s exposure to secondhand smoke.
Adults can develop serious health problems because of second-hand smoke
Breathing in secondhand smoke leads to 3,000 lung cancer deaths in non-smokers in the U.S. each
year.
Secondhand smoke causes 46,000 heart disease deaths in the U.S. each year.
People in Springfield are more at risk for exposure to secondhand smoke
24% of people in Springfield smoke compared to 16% statewide (and 21% nationwide).
The rate of smoking among pregnant women in Springfield is double the rate statewide (14% vs.
7%).
Health Effects Caused by Secondhand smoke
Children‟s Health Effects
Ear infections
Coughing, sneezing, wheezing
Pneumonia,
Bronchitis
Development of asthma, and triggering asthma symptoms
SIDS (Sudden Infant Death Syndrome)
Adult Health Effects
Lung cancer
Heart disease
Asthma symptoms

27
Risk Ranking for Environmental Tobacco Smoke
Exposure = 3.44 (1 = low risk, 5 = high risk)
Because 24% of people are smokers, the chance of exposure to secondhand smoke is high, especially for
the family members of smokers. ETS can remain in the air for a long time, and those people who smoke
in their homes are exposing their families to ETS for a high duration. However, the trend shows that the
rate of smoking is slightly decreasing in the past few years.
Health Impact = 4.29 (1 = low impact, 5 = high impact)
ETS has a number of symptoms, ranging from relatively mild to severe. It can cause respiratory
symptoms in all individuals, with a greater risk posed to the sensitive populations. ETS can also trigger
asthma symptoms. On the more severe end, ETS can cause cancer and cardiovascular disease, in both
sensitive and general populations. The symptoms can be very severe, and can cause increased emergency
room visits in both general and sensitive populations.
Economic Impact = 4.33 (1 = low impact, 5 = high impact)
Due to the range of health effects, the healthcare costs of ETS are extremely high. Medication and
hospitalizations for asthma, as well as high costs from heart disease and lung cancer can have a large
impact to the city. In addition, the loss of productivity from asthma, heart disease, and lung cancer creates
a large economic impact.
Ecological Impact = 1.80 (1 = low impact, 5 = high impact)
ETS has a relatively minor impact on the environment. It can have an impact on building aesthetics by
staining the walls of smokers‟ homes with nicotine. ETS can also cause health effects to animals, such as
house pets.
Overall Score = 3.47 (1 = low impact, 5 = high impact)
The health and economic impacts of ETS are significant. Because of the wide range of health effects as
well as the costs from those health effects, ETS has serious impact in these areas. The exposure can also
be high due to the high percentage of smokers in the city, and the fact that their families could be exposed
at home. The ecological impact of ETS is minor, only affecting building aesthetics and pets.
Community Concern = 2.17 (0 = no concern, 4 = great concern)
28
Pests and Pesticides in Homes
Pests include bugs, birds and animals. City environments, like Springfield, often have high
numbers of pests in homes. They thrive in human environments where there is water, food, shelter and
few competitors. Some people become allergic to pests such as mice, rats, and cockroaches. These pests
can also carry germs. Other pests like ants and termites are bad for buildings, but are not really a threat to
human health. Bed bugs are becoming more of a problem in homes, apartments, and hotels.
People often use pesticides to kill pests, but may not realize that pesticides are also toxic and very
harmful, to humans. Pesticides can cause different health effects, depending on the type used, and amount
a person is exposed to. Pesticides come in many forms, including: sprays, baits, and “bombs”. Natural
pesticides can be just as harmful as the chemical products.
Pesticides can enter the body by breathing in sprays or mist, putting dirty hands in one‟s mouth,
and eating food with pesticides in or on it. They can also be absorbed into the body through the skin.
During use, chemicals can spread throughout the house and build up in house dust. This dust can be later
kicked up and breathed in. Homes often have more pesticides in floor dust than would be expected from
recent pesticide use. Pesticides used outdoors can be tracked inside onto floors and carpets.
Significant Issues
There is widespread use of pesticides
85% of U.S. households use pesticides and 80% of our pesticide exposure is indoors.
There are 300 different chemicals used in over 20,000 different products. Selecting the proper
pesticide and amount to use is often better left to professionals.
Pesticides are often used and disposed of improperly leading to increased exposure
Without reading the label on safe use, people often use pesticides in larger amounts than
recommended, and without using goggles, gloves, or masks.
Pesticides are used without changing the conditions that attracted the pests in the first place,
leading to the re-use of pesticides when pests come back.
Pesticides and their containers are often thrown in the trash or are illegally dumped.
Health Effects
Allergy and asthma are the major health effects associated with pests
Cockroaches and mice can trigger asthma symptoms in people with asthma.
Springfield has high asthma rates. 21% of school children have asthma.
Children are particularly vulnerable to the health effects of pesticides
Children play on the floor and have a higher exposure to pesticides in floor dust.
Accidental pesticide poisoning of children under 5 years old is common. Pesticides poisonings are
the 12th highest reported poisoning of children under age 6, and 8th highest for adults.
Pesticides can cause a wide range of health effects including: headaches, nausea, dizziness, eye and
lung irritation, skin reactions, allergies, asthma, chemical sensitivity, infertility and birth defects,
autism, and learning disabilities, cancer, diabetes, and may increase risk of Parkinson‟s and
Alzheimer‟s disease.
29
Risk Ranking for Pests and Pesticides
Exposure = 3.33 (1 = low risk, 5 = high risk)
Pests are more likely to inhabit homes that are in poor condition, because this allows them to get inside to
find food. Older housing has a higher chance of being in disrepair, and in Springfield, 80% of the homes
were built before 1979. Also, if a building has pests, the inhabitants are much more likely to use
pesticides to get rid of them. Because of the amount of time spent indoors, most people have a high
duration of exposure to these pests, as well as the pesticides being used to get rid of the pests.
Health Impact = 3.43 (1 = low impact, 5 = high impact)
Pests in the home can cause allergies, infections, and asthma symptoms. These impacts are more likely,
and more severe, in sensitive populations such as children and the elderly. In general populations, the
symptoms are less likely to occur, and they are less severe when they do occur. Pesticides can have a
number of very significant effects, such as cancer and an increased risk of mortality, but these effects are
long term and also not as likely to occur as the less severe symptoms.
Economic Impact = 2.67 (1 = low impact, 5 = high impact)
The cost of dealing with pests in the city is high. With the large percentage of buildings constructed
before 1979, there is a high likelihood of disrepair that will let pests in. Therefore, it is more likely that
exterminators will be hired to deal with pests, in addition to the money spent on over the counter
pesticides. There are also medical costs associated with the health effects, and because pests can cause
allergic reactions and asthma symptoms, there is a cost from the lost productivity.
Ecological Impact = 2.80 (1 = low impact, 5 = high impact)
Pests can have a large impact on buildings, causing structural damage as well as marring building
aesthetics. Pests can also have serious impacts on animals; for example, ticks can get onto pets and causes
diseases. Their impact on soil, waterways, and vegetation, on the other hand, is minimal. Pesticides also
have a minimal impact on waterways and vegetation, but they can accumulate in soil and also cause
damage to pets or other animals.
Overall Score = 3.06 (1 = high impact, 5 = low impact)
Pests and pesticides pose a moderate risk to the city of Springfield. The risk of exposure is relatively high,
due to the large number of buildings from before 1979, as well as the fact that people spend much of their
day indoors. The health impacts range from mild to severe, but the most severe symptoms are long-term
and less likely than the milder symptoms. The economic impact is moderate, because although the current
costs are low, the healthcare costs can be high on account of the asthma and allergy symptoms. The
ecological impacts of pests are mainly from damage to buildings and animals, while the impact from
pesticides are mainly to soil and animals.
Community Concern = 2.22 (0 = no concern, 4 = great concern)

30
Carbon Monoxide Indoors
Carbon monoxide is a gas that cannot be seen or smelled. It can build up indoors when fuel, such
as oil or gas, is burned without proper air supply. This build up can cause serious health effects. Breathing
in carbon monoxide allows it to enter the bloodstream. It replaces oxygen in the blood. The lack of
oxygen can harm tissues and vital organs such as the heart and brain. Exposure to low levels of carbon
monoxide can cause headaches, fatigue, and difficulty concentrating. High levels of the gas can cause
coma and death.
The major source of carbon monoxide indoors is from fires in buildings. A fire burning indoors
uses up the oxygen in the area and begins to make carbon monoxide. Also any devices that burn fuel
indoors may be a source of carbon monoxide if they are not working properly or do not have enough air
supply. These include gas, oil, or coal burning furnaces, gas hot water heaters, and kerosene or propane
space heaters. Also included are lanterns, gas cooking stoves, wood and gas fireplaces, and pellet heating
stoves. Cars left idling in garages that are attached to a home can also leak carbon monoxide indoors.
Outdoor power generators used indoors also cause many carbon monoxide problems. In 2006,
Massachusetts made it the law that carbon monoxide monitors be present on every level of a home. They
also must be present within 10 feet of sleeping areas.
What are the major concerns of carbon monoxide exposure?
Carbon monoxide levels in Springfield homes
The Springfield Fire Department responded to 1,426 carbon monoxide incidents from 2001-2010.
95% occurred in residences.
Springfield averaged 117 carbon monoxide incidents each year from 2006-2011. Trends show the
number has increased during this time.
Carbon monoxide problems may be more common in low-income neighborhoods where furnaces
may not be well-maintained.
In 2011, major power outages occurred due to the tornados, Hurricane Irene, and a snowstorm.
Many people incorrectly used gas-powered generators or BBQ grills indoors. Dangerous levels of
carbon monoxide resulted. This led to several emergency hospitalizations and a few deaths.
Health Effects Caused Carbon Monoxide
Carbon monoxide can affect everyone who is exposed.
Individuals more vulnerable to carbon monoxide are infants, the elderly, people with anemia, or
people with a history of heart or respiratory disease.
Low levels of carbon monoxide (>70 parts per million (ppm)) can cause headaches, dizziness and
fatigue.
Moderate levels of carbon monoxide (>400 ppm) can cause severe headaches, dizziness, mental
confusion, faintness and nausea.
Very high levels (>2,000 ppm) can cause death within minutes.

31
Risk Ranking For Carbon Monoxide Indoors
Exposure = 2.28 (1 = low risk, 5 = high risk)
Data has shown that 95% of all CO incidents occur in residences. In order to have significant exposure to
CO in a building, there needs to be an unvented source of combustion inside that building or residence.
CO levels are generally low unless there is some kind of problem in the building, such as a fire or a
malfunctioning heating system. Over the past 5 years, Springfield has averaged 117 CO incidents per
year, although the trends show that CO incidents have been increasing. In general, CO incidents are more
common in the colder months, and most frequently occur between 4:00-10:00 pm.
Health Impact = 3.71 (1 = low impact, 5 = high impact)
At low levels of exposure, carbon monoxide can cause headaches, tiredness and nausea within a few
hours. As the amount of exposure increases, the health impacts become greater as well as coming on
more quickly. People can suffer from serious headaches, and dizziness, and as the level of CO increases,
unconsciousness and death.
Economic Impact = 2.33 (1 = low impact, 5 = high impact)
The current costs of CO to the city of Springfield are fairly low. Although everyone is required to have a
monitor in their home, this is a fairly low expense. Because a case of CO poisoning will generally result
in an emergency room visit, the highest costs to the city are from healthcare. However, because these
incidents are uncommon, the costs associated with them are not particularly high.
Ecological Impact = 1.40 (1 = low impact, 5 = high impact)
Carbon monoxide is colorless and odorless, and thus leaves no impact on building aesthetics and will
cause no physical damage to buildings, plants, or water. Its main ecological impact will be on pets in the
home. If there are high levels of CO in a home, the animals living in that home will be subjected to many
of the same health effects that the people will.
Overall Impact = 2.43 (1 = low impact, 5 = high impact)
Although the health impacts related to CO are significant, the likelihood of exposure is low. In addition to
this, there are relatively few incidents related to CO exposure. When people suffer from CO poisoning,
the health effects are significant, but the number of cases is low. The ecological impacts are insignificant,
and the economic impacts are also low.
Community Concern = 1.78 (0 = no concern, 4 = great concern)

32
Appendices
Scoring of Quantitative Community Concerns
Feedback Form
Glossary of Terms
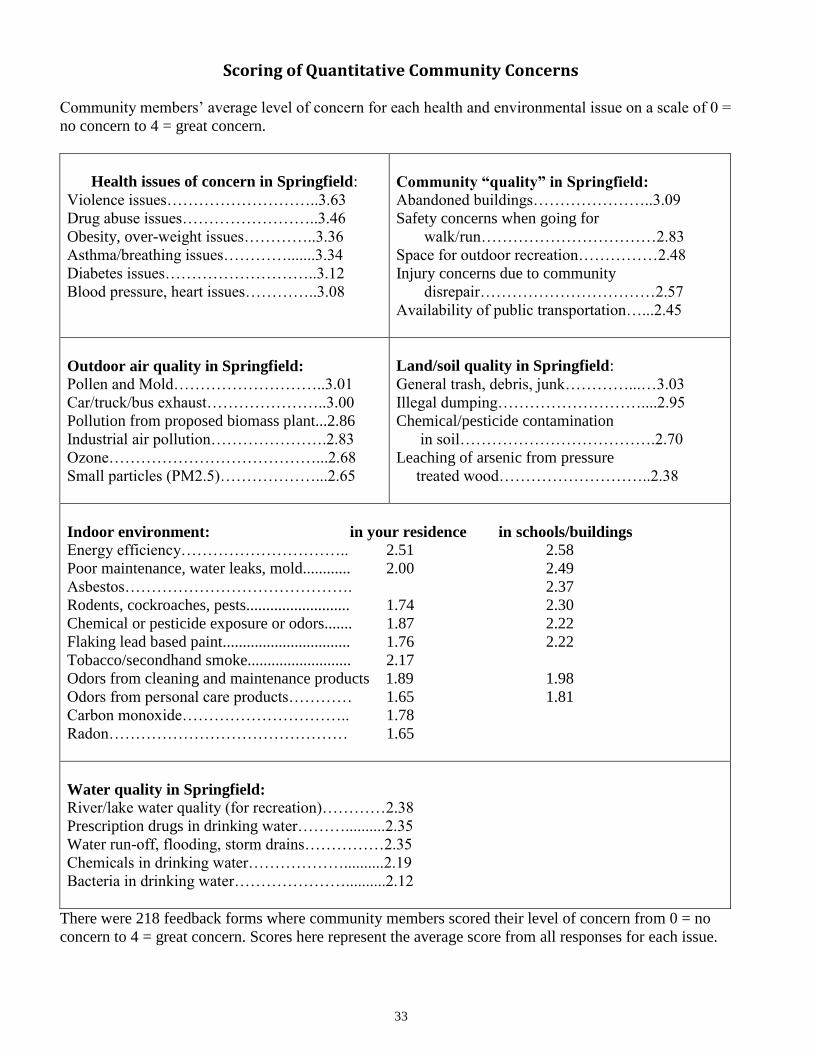
33
Scoring of Quantitative Community Concerns
Community members‟ average level of concern for each health and environmental issue on a scale of 0 =
no concern to 4 = great concern.
Health issues of concern in Springfield:
Violence issues………………………..3.63
Drug abuse issues……………………..3.46
Obesity, over-weight issues…………..3.36
Asthma/breathing issues………….......3.34
Diabetes issues………………………..3.12
Blood pressure, heart issues…………..3.08
Community “quality” in Springfield:
Abandoned buildings…………………..3.09
Safety concerns when going for
walk/run……………………………2.83
Space for outdoor recreation……………2.48
Injury concerns due to community
disrepair……………………………2.57
Availability of public transportation…...2.45
Outdoor air quality in Springfield: Pollen and Mold………………………..3.01
Car/truck/bus exhaust…………………..3.00
Pollution from proposed biomass plant...2.86
Industrial air pollution………………….2.83
Ozone…………………………………...2.68
Small particles (PM2.5)………………...2.65
Land/soil quality in Springfield:
General trash, debris, junk…………...…3.03
Illegal dumping………………………....2.95
Chemical/pesticide contamination
in soil……………………………….2.70
Leaching of arsenic from pressure
treated wood………………………..2.38
Indoor environment: in your residence in schools/buildings Energy efficiency………………………….. 2.51 2.58
Poor maintenance, water leaks, mold............ 2.00 2.49
Asbestos……………………………………. 2.37
Rodents, cockroaches, pests.......................... 1.74 2.30
Chemical or pesticide exposure or odors....... 1.87 2.22
Flaking lead based paint................................ 1.76 2.22
Tobacco/secondhand smoke.......................... 2.17
Odors from cleaning and maintenance products 1.89 1.98
Odors from personal care products………… 1.65 1.81
Carbon monoxide………………………….. 1.78
Radon……………………………………… 1.65
Water quality in Springfield: River/lake water quality (for recreation)…………2.38
Prescription drugs in drinking water………..........2.35
Water run-off, flooding, storm drains……………2.35
Chemicals in drinking water………………..........2.19
Bacteria in drinking water…………………..........2.12
There were 218 feedback forms where community members scored their level of concern from 0 = no
concern to 4 = great concern. Scores here represent the average score from all responses for each issue.

34
Final Feedback Form Healthy Environment, Healthy Springfield
EPA Care Project Feedback Form
What environmental issues do you see as a problem in Springfield? ______________________________
_______________________________________________________________
What health issues do you see as a problem in Springfield? _____________________________________
_______________________________________________________________
Please rate the following environmental and health factors:
check a number between 0-4 or check “Don’t Know” → 0 = no concern; 4 = greatest concern
Don’t Know 0 1 2 3 4 1. Health issues of concern in Springfield:
1a. Asthma/breathing issues............................... ○ ○ ○ ○ ○ ○
1b. Diabetes issues............................................. ○ ○ ○ ○ ○ ○
1c. Blood pressure, heart issues......................... ○ ○ ○ ○ ○ ○
1d. Obesity, over-weight issues......................... ○ ○ ○ ○ ○ ○
1e. Violence issues............................................ ○ ○ ○ ○ ○ ○
1f. Drug abuse issues......................................... ○ ○ ○ ○ ○ ○
1g. Other issues (write-in:________________)
2. Outdoor air quality in Springfield: 2a. Industrial air pollution……………………... ○ ○ ○ ○ ○ ○
2b. Car/truck/bus exhaust……………………… ○ ○ ○ ○ ○ ○
2c. Ozone............................................................. ○ ○ ○ ○ ○ ○
2d. Small particles (PM 2.5)…………………… ○ ○ ○ ○ ○ ○
2e. Pollution from proposed biomass plant……. ○ ○ ○ ○ ○ ○
2f. Pollen and mold.............................................. ○ ○ ○ ○ ○ ○
3. Indoor environment: in your residence 3a. Rodents, cockroaches, pests.......................... ○ ○ ○ ○ ○ ○
3b. Poor maintenance, water leaks, mold............ ○ ○ ○ ○ ○ ○
3c. Flaking lead based paint................................ ○ ○ ○ ○ ○ ○
3d. Tobacco/secondhand smoke.......................... ○ ○ ○ ○ ○ ○
3e. Chemical or pesticide exposure or odors....... ○ ○ ○ ○ ○ ○
3f. Radon……………………………………… ○ ○ ○ ○ ○ ○
3g. Carbon monoxide………………………….. ○ ○ ○ ○ ○ ○
3h. Odors from personal care products………… ○ ○ ○ ○ ○ ○
3i. Odors from cleaning and maintenance products… ○ ○ ○ ○ ○ ○
3j. Energy efficiency………………………….. ○ ○ ○ ○ ○ ○
4. Indoor environment: schools/public buildings: 4a. Rodents, cockroaches, pests.......................... ○ ○ ○ ○ ○ ○
4b. Poor maintenance, water leaks, mold…….... ○ ○ ○ ○ ○ ○
4c. Flaking lead-based paint…………………… ○ ○ ○ ○ ○ ○
4d. Odors from personal care products................ ○ ○ ○ ○ ○ ○
4e. Odors from cleaning and maintenance products… ○ ○ ○ ○ ○ ○
4f. Asbestos……………………………………. ○ ○ ○ ○ ○ ○
4g. Chemical or pesticide exposure or odors....... ○ ○ ○ ○ ○ ○
4h. Energy efficiency…………………………... ○ ○ ○ ○ ○ ○
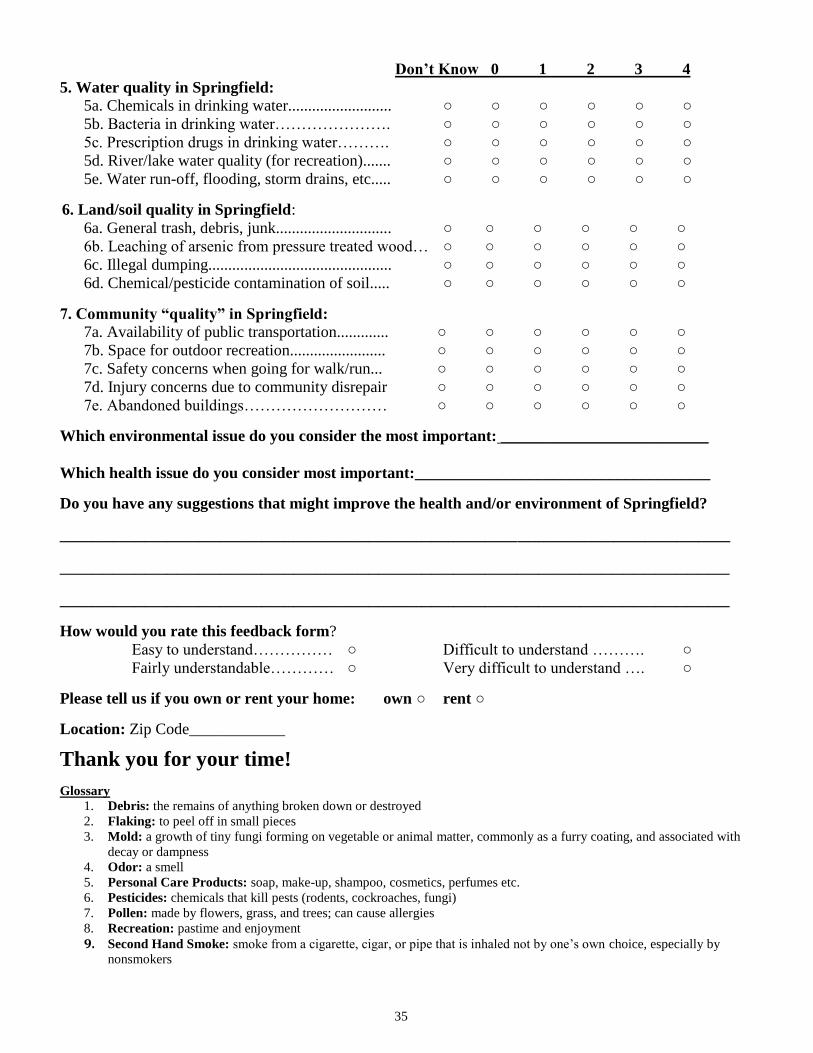
35
Don’t Know 0 1 2 3 4
5. Water quality in Springfield: 5a. Chemicals in drinking water.......................... ○ ○ ○ ○ ○ ○
5b. Bacteria in drinking water…………………. ○ ○ ○ ○ ○ ○
5c. Prescription drugs in drinking water………. ○ ○ ○ ○ ○ ○
5d. River/lake water quality (for recreation)....... ○ ○ ○ ○ ○ ○
5e. Water run-off, flooding, storm drains, etc..... ○ ○ ○ ○ ○ ○
6. Land/soil quality in Springfield:
6a. General trash, debris, junk............................. ○ ○ ○ ○ ○ ○
6b. Leaching of arsenic from pressure treated wood… ○ ○ ○ ○ ○ ○
6c. Illegal dumping.............................................. ○ ○ ○ ○ ○ ○
6d. Chemical/pesticide contamination of soil..... ○ ○ ○ ○ ○ ○
7. Community “quality” in Springfield:
7a. Availability of public transportation............. ○ ○ ○ ○ ○ ○
7b. Space for outdoor recreation........................ ○ ○ ○ ○ ○ ○
7c. Safety concerns when going for walk/run... ○ ○ ○ ○ ○ ○
7d. Injury concerns due to community disrepair ○ ○ ○ ○ ○ ○
7e. Abandoned buildings……………………… ○ ○ ○ ○ ○ ○
Which environmental issue do you consider the most important: __________________________
Which health issue do you consider most important:_____________________________________
Do you have any suggestions that might improve the health and/or environment of Springfield?
_______________________________________________________________
_______________________________________________________________
_______________________________________________________________
How would you rate this feedback form?
Easy to understand…………… ○ Difficult to understand ………. ○
Fairly understandable………… ○ Very difficult to understand …. ○
Please tell us if you own or rent your home: own ○ rent ○
Location: Zip Code____________
Thank you for your time!
Glossary
1. Debris: the remains of anything broken down or destroyed
2. Flaking: to peel off in small pieces
3. Mold: a growth of tiny fungi forming on vegetable or animal matter, commonly as a furry coating, and associated with
decay or dampness
4. Odor: a smell
5. Personal Care Products: soap, make-up, shampoo, cosmetics, perfumes etc.
6. Pesticides: chemicals that kill pests (rodents, cockroaches, fungi)
7. Pollen: made by flowers, grass, and trees; can cause allergies
8. Recreation: pastime and enjoyment
9. Second Hand Smoke: smoke from a cigarette, cigar, or pipe that is inhaled not by one‟s own choice, especially by
nonsmokers

36
Glossary of Terms
Asthma – A disease of the airways leading to the lungs; asthma triggers, such as mold spores or cat dander,
cause the airways to swell, and muscles around the airways to tighten, making breathing very difficult.
Arsenic – A toxic metal sometimes used in herbicides, pesticides, and other products; arsenic can cause
cancer.
Bronchitis – Irritation and swelling of the air-ways leading to the lungs.
Brownfield – Abandoned or inactive land, home, factory, or other building that contains known or suspected
pollutants.
Cadmium – A toxic metal that can cause cancer.
Carbon dioxide – CO2; a naturally occurring chemical compound, also produced by industrial activity, cars,
trucks, etc. It is also a significant greenhouse gas.
Carbon monoxide – CO; a highly toxic gas when encountered in higher concentrations. It is produced in
nature - volcanoes, forest fires - as well as by cars, trucks, fossil-fuel power plants, home furnaces,
generators and diesel-powered heaters. At extremely high levels, CO can cause death.
ETS or environmental tobacco smoke – see Secondhand Smoke, below.
Fungi – A group of organisms that get their food by growing on, around, or in, plants or animals; mushrooms
are fungi as is the dark fuzzy growth seen on wet window-frames.
Hazardous waste site – A location where toxins, poisonous wastes, and/or other chemicals are not contained
or under control; human or environmental harm is likely unless clean-up is done.
Nitrogen dioxide – NO2, A toxic gas found in vehicle exhaust and formed from burning petroleum fuels; it is
part of smog.
Ozone – A gas that can harm the lungs and other tissues; formed from nitrogen dioxide.
Petroleum products – Materials such as gasoline, oil, diesel fuel, asphalt, and many others, that are made
from naturally occurring deposits of “hydro-carbons” (crude oil, natural gas, and so on).
PCBs – Polychlorinated biphenyls – toxic chemicals used as lubricants and insulators; often where flexibility
is desired
Pesticide – A toxic chemical or chemicals for killing insects or other pests; the pesticide is harmful to humans
and the environment when improperly used or discarded.
PM 2.5 – a very small airborne particle; about 100 times smaller than the width of a human hair.
Pollutant – A chemical or other material not normally in the environment that can harm humans, plants,
animals, or the environment.
Pneumonia – A lung disease usually caused by a virus or bacterium; symptoms include fever, coughing, and
difficulty breathing
Quantitative data – Information measured or identified on a numerical scale. Quantitative data can be
analyzed using statistical methods, and results can be displayed using tables, charts and graphs.
Qualitative data – Information that cannot easily be reduced to numerical or statistical measures. Often
described in opposition to quantitative data, qualitative data may be categorical, historical, subjective or
descriptive.
Secondhand smoke – Smoke coming off the end of a lit cigarette, cigar, or other tobacco product; or the
smoke exhaled by a smoker; contains many toxic substances.
Standard, or exposure standard – An amount of a chemical or other toxic material that when exceeded
might result in illness or environmental harm; standards are usually set by the government or other
scientific agency.
Sulfur dioxide – SO2; Sulfur dioxide is a poisonous gas that is released by volcanoes and industrial activity,
particularly power plants. SO2 combines with other gases in the atmosphere to produce acid rain.
Respiratory system – The lungs and the air-ways leading from the mouth and nose to the lungs
Tetanus – A disease caused by a bacterium (germ) that typically enters the body through a wound or puncture;
severe muscle spasms are typical and death can result.
Toxin – A poison; a substance that can cause illness or death

37
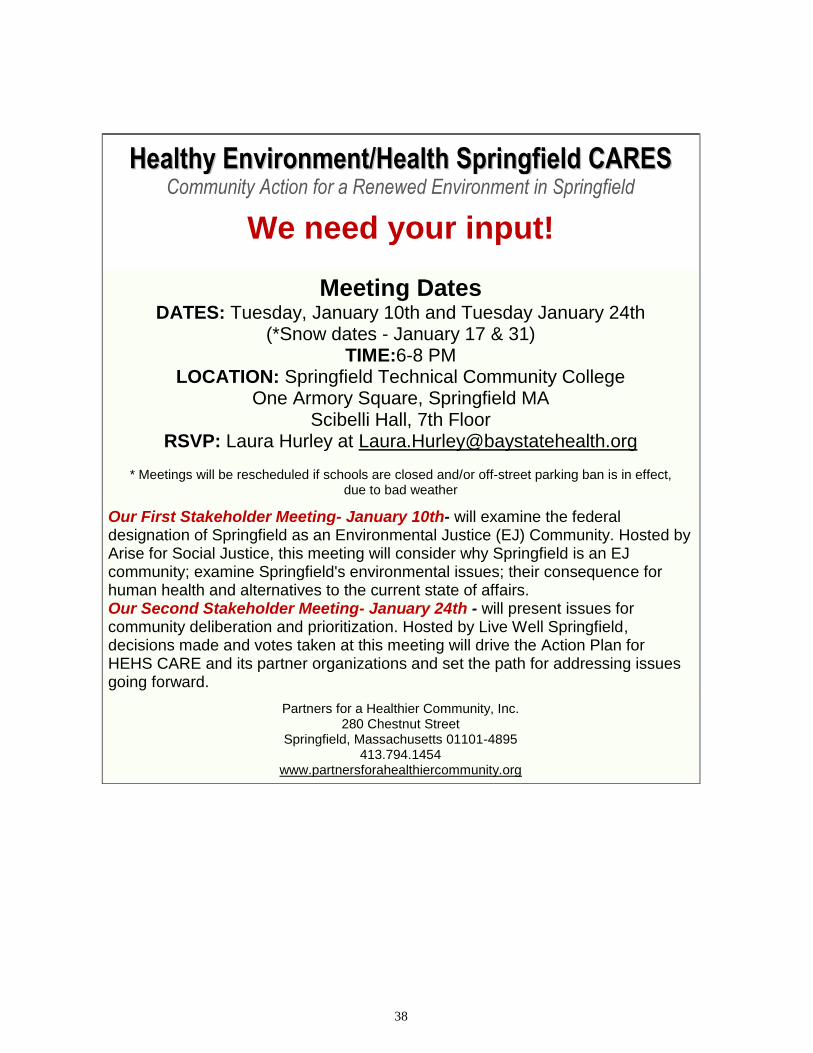
38
HHeeaalltthhyy EEnnvviirroonnmmeenntt//HHeeaalltthh SSpprriinnggffiieelldd CCAARREESS
Community Action for a Renewed Environment in Springfield
We need your input!
Meeting Dates
DATES: Tuesday, January 10th and Tuesday January 24th
(*Snow dates - January 17 & 31) TIME:6-8 PM
LOCATION: Springfield Technical Community College
One Armory Square, Springfield MA
Scibelli Hall, 7th Floor
RSVP: Laura Hurley at [email protected]
* Meetings will be rescheduled if schools are closed and/or off-street parking ban is in effect, due to bad weather
Our First Stakeholder Meeting- January 10th- will examine the federal designation of Springfield as an Environmental Justice (EJ) Community. Hosted by Arise for Social Justice, this meeting will consider why Springfield is an EJ community; examine Springfield's environmental issues; their consequence for human health and alternatives to the current state of affairs. Our Second Stakeholder Meeting- January 24th - will present issues for community deliberation and prioritization. Hosted by Live Well Springfield, decisions made and votes taken at this meeting will drive the Action Plan for HEHS CARE and its partner organizations and set the path for addressing issues going forward.
Partners for a Healthier Community, Inc. 280 Chestnut Street
Springfield, Massachusetts 01101-4895 413.794.1454
www.partnersforahealthiercommunity.org