preliminary communication nutritional and sensory
TRANSCRIPT
Croatian Journal of Food Technology, Biotechnology and Nutrition vol.15 (1-2), 202054
CROATIAN JOURNAL OF FOOD TECHNOLOGY, BIOTECHNOLOGY AND NUTRITION
Awofadeju, O.F.J. et al.: 54-64
Nutritional and sensory evaluation of wheat-maize cookies enriched with African walnut (Tetracarpidium conophorum) seed protein isolate
1*Awofadeju Oluwayemisi Foluke Jonathan, 1Olapade Adekunle Abiodun1Department of Food Technology, University of Ibadan, Ibadan, Nigeria
*Corresponding author: [email protected]
Abstract
The study examined the nutritional composition and sensory attributes of cookie. In this study, blends of commercial wheat (CWF), yellow maize flours (YMF) and African walnut protein isolate (AWPI) were optimized for cookie production. The cookies were studied in a completely randomized design and assessment of the proximate composition was conducted. The best cookie samples with high protein and fiber, low fat and highest rating in sensory attributes were selected for the determination of vitamins and mineral composition. The result revealed that the control cookie was highest in moisture, fat and carbohydrate but lower in protein, ash and fibre. Enriched cookie 36.69g CWF, 39.57g YMF, 23.74g AWPI and 42.86g CWF, 42.86g YMF, 14.29g AWPI were highest in protein and fibre, respectively while 55.56g CWF, 33.33g YMF, 11.11g AWPI was low in fat. Overall acceptability was highest in control cookie followed by enriched cookie 55.56g CWF, 33.33g YMF, 11.11g AWPI. The vitamin composition of the selected enriched samples show that sample 42.86g CWF, 42.86g YMF, 14.29g AWPI had the highest value of 2.53 mg/100 g in ascorbic acid; sample 55.56g CWF, 33.33g YMF, 11.11g AWPI scored the highest value of 0.14, 0.07 and 1.33 mg /100 g in thiamine, riboflavin and niacin respectively, while sample 36.69g CWF, 39.57g YMF, 23.74g AWPI scored highest in vitamin A (276.67 mg/100g). The cookie sample 36.69g CWF, 39.57g YMF, 23.74g AWPI shows the highest values of 130.00, 0.043, 9.77, 333.33 and 85.00 for calcium, manganese, iron, sodium and phosphorus, respectively. The study recommends the use of flour proportion in sample 55.56g CWF, 33.33g YMF, 11.11g AWPI as an improvement of the nutritional and sensory attributes of enriched cookie.
Keywords: African walnut, cookies, nutritional composition, protein isolate, whole yellow maize, commercial wheat flour
PRELIMINARY COMMUNICATION
Introduction
Global intake of natural foods helps to supply adequate nutrients needed for a healthy lifestyle. Some of these natural foods cannot be taken raw but have to be processed in order to enhance their palatability, safety, meet immediate needs of consumers and to be available year-round in affordable prices (Guo et al., 2014). Cookies are baked products containing three major ingredients namely flour, fat and sweetener all of which are mostly sugars. They are known to have low moisture content than other confectionery products such as bread with long shelf life (Wade, 1988). The nutritional value of cookies varies with types of cereal used in the preparation (Ayo et al., 2010). Cereals generally are limiting in sulphur-containing amino acids such as lysine and tryptophan. Based on this fact, enhancing the nutritional composition of cookie is required (Hooda and Jood, 2005). Several studies have been conducted on the production of cookies from various blends such as wheat and fonio grain that were rated high in terms of general acceptability (Mcwatters et al., 2003), millet and pigeon pea (Eneche, 2003), wheat and plantain (Mepba et al., 2007), wheat and African walnut flour (Awofadeju et al., 2015) and maize and pigeon pea (Echendu et al., 2004). Wheat is relatively low in total protein, lysine, tryptophan and beta-carotene which could be supplemented by the use of crops such as yellow maize and African walnut. Among major types of maize (yellow, white and red), yellow maize is mostly consumed owing to the nutrients especially beta-carotene (pro-vitamin A), evidence of their roles in improving vision in kids and grown-up as well as xanthophylls (Enyisi et al., 2014a). Similarly, African walnut (Tetracarpidium conophorum) [(Mull Arg), Hutch and Dalziel)] is highly rich in protein, minerals, vitamins and amino acid profiling (Awofadeju et al., 2015; Awofadeju, 2020). Irrespective of its nutrients, it is a neglected and underutilized crop that is gaining attention among scientists in Africa. This growing interest in
the seed is necessitated by the persistent menace of malnutrition which has been earmarked as one of the major challenges facing developing nations (IFPRI, 2002). The Nutrition Society of Nigeria rates Nigeria to be among the top 20 countries with the highest burden of malnutrition (Ogbebo, 2014). It further claims that most people are malnourished not because of lack of food but as a result of ignorance on how to utilize the available local food resources such as nuts, fruits and vegetables, and maximize their nutritional components. However, African walnut seed is deficient in methionine which could be found in yellow maize and wheat flour. The blends of wheat, yellow maize flours and African walnut protein isolate would bring about balancing of amino acids, a process called protein complementation (Potter and Hotchkiss, 2006), essential in the fight against protein-energy malnutrition and serve as better food than the cereal alone.Nevertheless, the aim of this research was to investigate the nutritional composition and overall acceptability of cookie from blends of wheat and yellow maize flours complemented with African walnut protein isolate.
Materials and methods
Materials
Yellow maize and African walnut kernels were obtained from a local market in Ibadan. Commercial wheat flour (Golden Penny, Flour mills of Nigeria Limited), and other ingredients such as granulated sugar and salt (Dangote, Nigeria), powdered milk (Dano), margarine (EVITA, Indonesia), and preservatives were purchased at Shoprite supermarket in Ibadan, Oyo State, Nigeria.
Croatian Journal of Food Technology, Biotechnology and Nutrition vol.15 (1-2), 2020 55
CROATIAN JOURNAL OF FOOD TECHNOLOGY, BIOTECHNOLOGY AND NUTRITION
Awofadeju, O.F.J. et al.: 54-64
Processing of maize into flour
The maize grains were separated from plant debris, stones and other foreign materials then washed in water to remove dust and tiny particles present and later air-dried for 5 days. The dried grains were milled to flour with the use of commercial grinder (Heavy-duty electric Grinder, Model MG182/00) and sieved through a 40 mesh screen. The flour was packaged in high-density polyethylene bags (0.77 mm thickness) and heat-sealed.
Preparation of African Walnut Protein Isolate (AWPI)
Walnut kernel was washed thoroughly to remove any adhering contaminants, cooked for 15 min for easy removal of shell and to reduce toxic constituent, cooled, de-shelled, and cut into smaller sizes (3 mm) to increase the surface area and oven dried at 55 oC for 24 hr. The dried nut was grinded into flour using a Qlink grinder (Model No. QBL – 1861A; Turinar Corp. No 1682, Fu-Yong Ave, Nan-Tun County, Shang-Hai, China). The flour (100 g) was defatted with 400 ml hexane and dried in a fume hood at room temperature for 24 hr. The defatted walnut was grinded to pass through 150 meshes, packaged in an airtight polythene bag and stored in a pasteurized covered bottle till further use. The protein isolate derived from walnut seed was prepared by the use of an alkaline extraction followed by acid precipitation according to the method (Wagner et al., 2000) Defatted walnut flour (DFWF) was suspended with up to 10 fold (w/v) deionized water coupled with 1mol/L-1 NaOH which was added to reach pH 8.5. Protein was extracted by incubating the suspension for 2 hr at room temperature. The dispersion obtained was centrifuged at 4800 g for 20 min. The supernatant was harvested and protein was precipitated by adding 2mol/L-1 HCL until a pH value of 4.8 was reached. After centrifuging at 4800 g for 20 min at 4 oC, the precipitate was washed with de-ionized water and dialyzed 3 times at 4 oC against 0.2 mol/L-1 phosphate buffer, pH 8. The protein content of walnut protein isolate was determined by micro-Kjeldahl method (N x 6.25).
Experimental design
An Optimal mixture design of Response Surface Methodology (RSM) (Design Expert 8.0.3.1., Stat-Ease Inc., Minneapolis, USA trial version) was adopted of which the variables were wheat flour (30-50%), yellow maize flour (20-30%) and African walnut protein isolate (10-20%); it generated 20 experimental runs.
Formulation and cookie preparation from the blends
Cookies were made with the recipe according to (Abayomi et al., 2013). The blends were used for the experiment. Sugar (12 g) was creamed with butter (15 g) and mix until light and fluffy, while consistency was achieved using Kenwood chef blender (Model HM400). With the addition of eggs (5 g), flour (100 g), powdered milk (2.5 g), also baking powder (1g), plus salt (0.5 g), and sodium carbonate (0.5 g), all added into the mixer for thorough distribution at low speed for a total time of 5 min mixed until a stiff paste is achieved. The dough was flattened on a flat surface using a rolling pin until a thickness of 0.2-0.3 cm is achieved. The flattened dough was shaped using 6.00 cm cutter and lined on a greased tray, baked at 150 °C for 20 minutes. Cookies made was cooled and put in cellophane bag until further used.
Proximate composition of cookies
The crude protein, fat, moisture, fiber, ash and carbohydrate were determined according to AOAC (2010) methods on triplicate samples. Carbohydrate was determined by differences.
Sensory evaluation of cookies
Sensory evaluation of the cookies prepared from blends including parameters like taste, appearance, crunchiness, mouth feel, aroma and overall acceptability were assessed by 25 untrained panelists who were selected from the Community of Forestry Research Institute of Nigeria (FRIN). They were selected to assess the cookie using 9-hedonic scale; the scale ranges from 1- dislike to 9-like extremely.
Cookie selection
The selection was done on 20 composite cookies and three cookie samples (4, 10 and 16) with superior qualities as assessed by protein, fat, fiber and sensory evaluation were selected and used for further analysis; vitamins and minerals.
Determination of vitamins of selected cookies
Determination of ascorbic acid
Titration method of AOAC (2010) was adopted. Two grams of sample was grinded in 50 ml distilled water. Equal volume of extraction solution (containing 15 g of phosphoric acid, 40 ml acetic acid, and up to 500 ml with distilled water) was added into it. Few drops of indicator (0.1 g thymol blue was dissolved in 10.75 ml of 0.02N sodium hydroxide solution and diluted to 250 ml water) were added to aliquot. Resultant solution was titrated with Indophenol standard solution obtaining a rosy pink solution. Standard solution was prepared by dissolving 0.05 g ascorbic acid in 45 ml in the extraction solution and making up to 50 ml and titrated with indicator.
Determination of thiamin (B1)
Thiamin was determined using AOAC (2010) procedure. A 75 ml of 0.2 N HCl was added to 2 g of sample and the mixture boiled over a water bath. After cooling, 5ml of phosphatase enzyme solution was added and the mixture incubated at 37 oC overnight. The solution was placed in 100 ml volumetric flask and the volume made up with distilled H2O. The solution was filtered and the filtrate purified by passing through silicate column. To 25 ml of the filtrate in a conical flask was added 5ml acidic KCl eluate, 3 ml of alkaline ferricyanide solution, and 15 ml isobutanol, and shaken for 2 min. The solution was allowed to separate and the alcohol layer was taken. About 3 g of anhydrous sodium sulphate was added to the alcohol layer. A 5 ml of thiamine solution was accurately measured into another 50 ml flask. The oxidation and extraction of thiochrome was carried out with the sample and was repeated using thiamin solution. A 3 ml of 15% NaOH was added to the blank instead of alkaline ferricyanide. The blank sample solution was poured into fluorescence reading tube and reading taken at the expression:
Where:W = weight of sample, X = reading of sample – reading of blank, Y = reading of thiamin standard – reading of blank standard, V = volume of solution used for test on the column.
Croatian Journal of Food Technology, Biotechnology and Nutrition vol.15 (1-2), 202056
CROATIAN JOURNAL OF FOOD TECHNOLOGY, BIOTECHNOLOGY AND NUTRITION
Determination of riboflavin (B2)
The standard method AOAC (2010) was used. Two gram of prepared samples was measured; 50 ml 0.2 N hydrochloric acid was added. Solution was boiled for 1 hour, and allows cooling. Then, NaOH was added adjusting the pH solution to 6.0. A 1 N hydrochloric acid was mixed to solution lowering pH to 4.5. Mixture was filtered into 100 ml volumetric flask and made up to volume with distilled water. Interference substance from the solution was removed by adding 10 ml of water into two different test tubes as well as 10 ml of filtrate plus 1 ml of standard riboflavin. Next, 1 ml of glacial acetic acid was added to each tube and thoroughly mixed. Afterward, 0.5 ml 3% KMnO4 solution was added to tubes and allows standing for 2 min. Thereafter, 0.5 ml 3% H2SO4 was added and solution was thoroughly mixed. Flourimeter was modified to excitation at 470 nm and emission wavelengths of 525 nm. Flourimeter was also modified to zero deflection against 0.1 N H2SO4 plus 100 against the second tube (standard). The fluorescence of tube 1 was added to both tubes and was measured within 10 sec. Riboflavin, calculated as
Where:W = weight of sample, X = reading of sample – blank reading, Y = reading of sample + standard (tube 2) - reading of sample - standard blank.
Determination of ß-carotene
ß-carotene was analyzed following the procedure developed by (Chaturvedi and Nagar, 2001). The cookie sample (10 g) was blended with mortar and pestle using adequate acetone, and filtered into 100 mL volumetric flask. The acetone was used in washing the mortar, funnel and remaining remnants were poured into the flask. The residue was poured into the mortar to macerate, and re- filter with another considerate fresh quantity of acetone. The method was repeated about three times to ensure that the residue was colourless. Thereafter, about 25 ml of petroleum ether was poured into a separator funnel while the acetone extract was added. Also, a considerable amount of distilled water was used to separate the two different phases thereby removing the aqueous-acetone phase. Three different phases of washing was done all over again to evacuate any form of residue. The petroleum ether phase which was collected and dried by the use of sodium sulphate was later transferred to another flask for drying and evaporates in the evaporator. Thereafter the residue was dissolved in a ml of petroleum ether while chromatogram column was added to the solution. The result was eluted with petroleum ether and the β-carotene which was taken in a flask goes through a column as a yellow pigment. The total volume was measured and the absorbance was read at 440 nm by Spectrophotometer. The value of β-carotene was calculated by using the equation:
Where molar extinction coefficient (∑) = 15 x 104,Specific extinction efficient = ∑ x molar mass of β-carotene,Molar mass of β-carotene = 536.88 g/mol and Path length of cell = 1 cm
Determination of mineral composition of selected cookies
Content of the above samples were determined through dry ashing plus extraction method. About two grams of sample were ashed in a muffle furnace of almost 550 oC for the next three hours. The result was later dissolved in 10 ml of IM HCl and diluted to 100 ml in volumetric flask with the use of distilled water. Digest resultant was used for determination of minerals (AOAC 2010) as shown below.Determination of sodiumWeight of 0.2542g of NaCl was dissolved in 1 litre of distilled water to give 100 ppm Na. This working standard solution was diluted to produce a range containing 0 – 10 ppm sodium and made up to 100 ml mark and 2 ml sample aliquot (sample stock solution) was read using a JENWAY PFP7 flame photometer. Concentration of test mineral in sample was designed with reference to graph (standard curve) and obtained as follows:
Where:W = Weight of the sample analyzed, X = Concentration of Na obtained from the standard curve,VF = Total volume of digest/extract (100ml), Va = Volume of extract used and D = Dilution factor
Awofadeju, O.F.J. et al.: 54-64

Croatian Journal of Food Technology, Biotechnology and Nutrition vol.15 (1-2), 2020 57
CROATIAN JOURNAL OF FOOD TECHNOLOGY, BIOTECHNOLOGY AND NUTRITION
Awofadeju, O.F.J. et al.: 54-64
Determination of iron
Standard solution containing 100 mg/ml of Fe3+ ions was prepared from 1g pure iron wire. The wire was dissolved in 20 ml concentrated HNO3, boiled in water bath and diluted to 1000 ml with distilled water. Standard solutions with concentrations 0, 0.5, 1.0, 2.0 and 4.0 ppm was prepared. Two milliliter of sample aliquot was diluted to 100ml and was used to determine the absorbance of the sample using an AGILENT (Model 5805, Agilent Spec England) atomic absorption spectrophotometer at 510 nm. The standard and samples absorbance were noted and concentration of iron in the sample was determined from standard curve.
Determination of calcium
Calcium was determined using the atomic absorption spectrophotometer. Calcium carbonate (2.495g) was dissolved and diluted to 100 ml with de-ionized water. This solution contains 1000mg of Ca2+ ions and from this stock solution, calcium standard of the following concentration levels 0.0, 3.0, 6.0, 9.0 were prepared. The absorbance of both the sample and the standard working aliquot were determined in the AGILENT (Model 5805, Agilent Spec England) atomic absorption spectrophotometer at 239.9 nm. The concentration of the test mineral in sample was calculated with reference to graph (standard curve) and obtained as follows:
Where:W = Weight of the sample analyzed, X = Concentration of Ca obtained from the standard curve, Vf = Total volume of extract, Va = Volume of extract used and D = Dilution factor
Determination of phosphorus
Phosphorus was analyzed with the use of a spectrophotometer and its sample was taken by the molybdate method with the use of hydroquinone being the reducing agent. Sodium sulphate (1.0ml), 1.0ml of ammonium molybdate and 1ml of hydroquinone were added to 1ml of the sample digest. Mixture was agitated and made to stay (30 minutes) for blue colour development. Absorbance of sample was determined using the spectrophotometer at 600 nm. Phosphorus standard was prepared by dissolving 1.1g of monobasic potassium phosphorus (KA2PO4) into a 500ml volumetric flask containing 500 ml distilled water. Later in order to eradicate the microbial activity, about five drops of toluene was added. About twenty millilitres of the Standard stock was collected and made up to 100ml which has 100ppm. Standard stock (0.1ml) = 0.2ppm. Zero to one millilitre of 100ppm phosphorus stock solution was poured into 100ml volumetric flask separately and treated the same way as sample. Reading of the standard was taken at 600 nm in an AGILENT (Model 5805, Agilent Spec England) spectrophotometer and a standard curve was plotted.
Where:W = Weight of sample analyzed, AU = Absorbance of test sample, AS = Absorbance of standard phosphorus solution, C=Concentration (in mg/ml) of sample, VF = Total volume of extract, Va = Volume of extract analyzed
Determination of manganese
Through the wet method, the manganese was determined via Atomic Absorption Spectrophotometer (Model: Thermo Scientific S series; Thermo Electron Corporation, USA). One gram of sample was weighed into a 125 ml Erlenmeyer flask, 20 ml of acid mixture containing 325 ml concentrated nitric acid, 40 ml perchloric acid, and 10 ml of sulfuric acid was added. Solution was mixed and digested in a digester (Buchi Digestion unit K-424) with an average level of heat under a fume hood was used and heating process was sustained until dense white fume appeared. It was allowed to cool and 50 ml of distilled water was added. This was filtered into a 100 ml volumetric flask and made up to mark with distilled water. Resultant solutions were read on the Atomic Absorption Spectrophotometer. The instrument has its regular standards which are (Mn: 2, 5 and 10 ppm), even though sample was analyzed at corresponding wavelength. Required hollow cathode lamp corresponding to required mineral and holders in lamp compartment was installed to determine concentration of the mineral. Dilution factor for magnesium was 10,000.
Statistical analysis
The data were analyzed with the use of a one-way analysis of variance (ANOVA). Also, the mean separation was done by Duncan’s multiple range tests using the Statistical Package for the Social Sciences (SPSS) 16.0 (SPSS Inc., Chicago, IL, USA). Significance difference was established at p<0.05.
Results and discussion
Proximate composition of enriched cookies
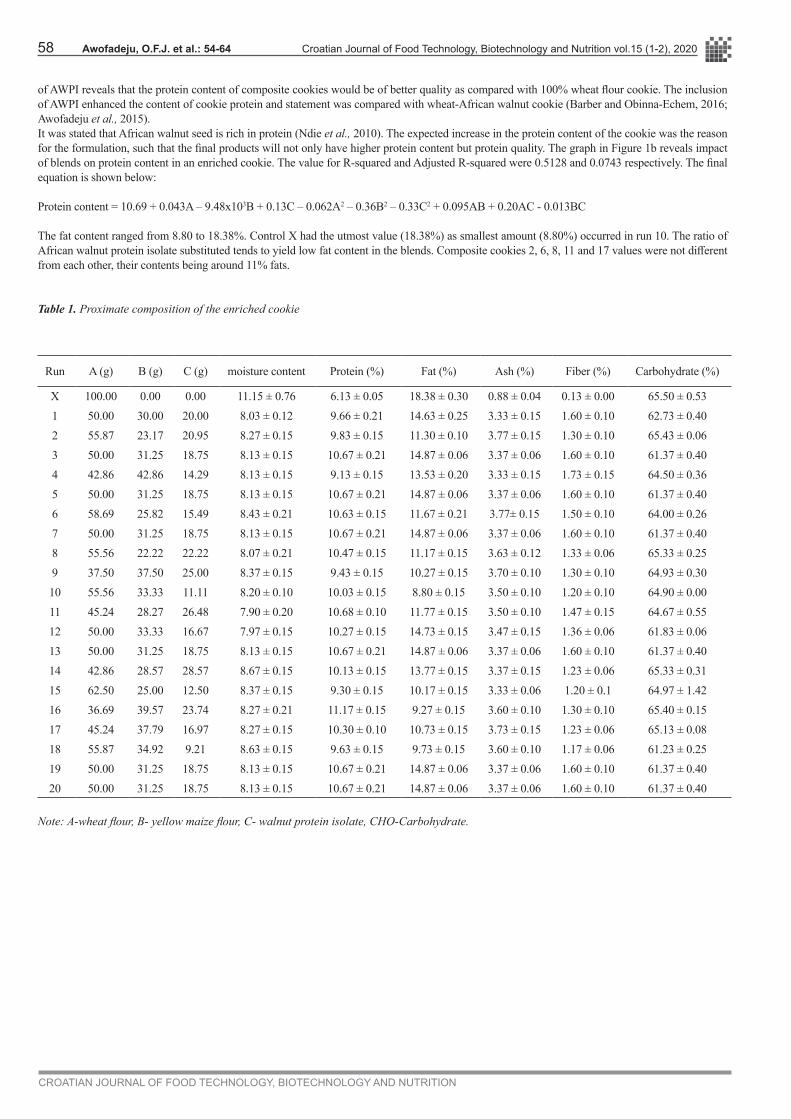
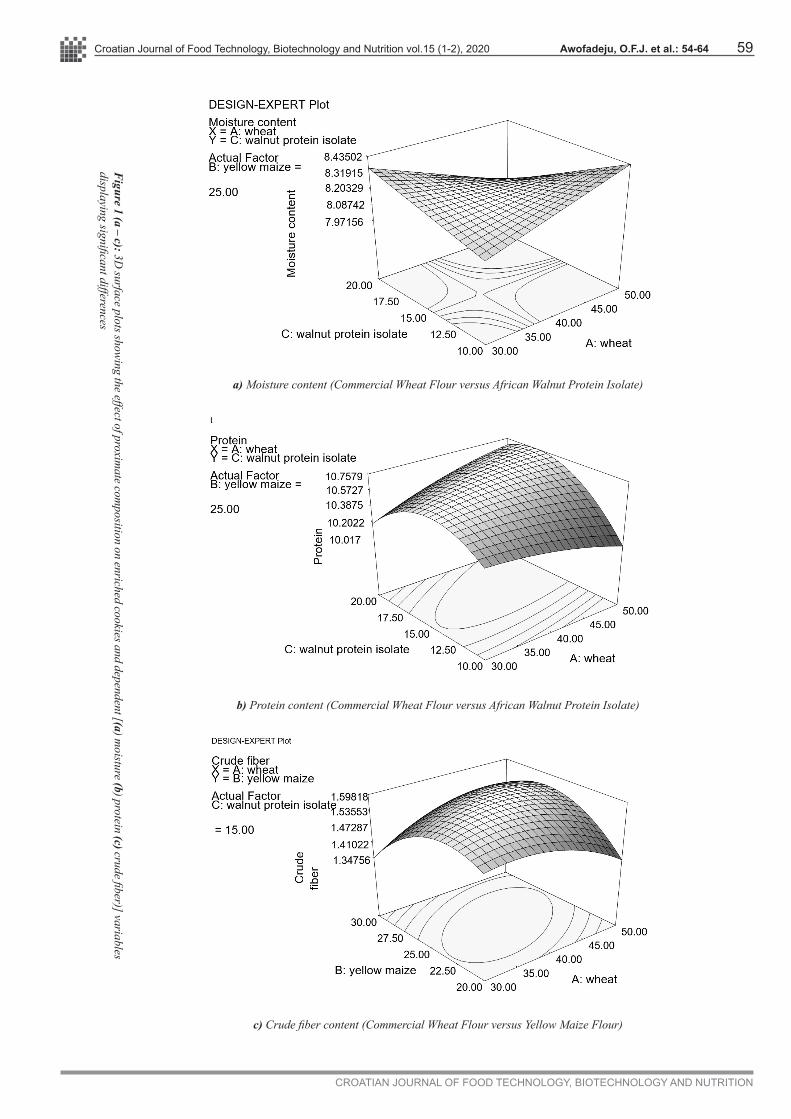
Table 1 shows the proximate composition of commercial wheat, yellow maize flours enriched with African walnut protein isolate cookie. The moisture, protein, fat, ash, crude fiber, and carbohydrate values ranged from 7.90 - 8.67, 9.13 - 11.17, 8.80 - 14.87, 3.33 - 3.77, 1.17 - 1.73 and 61.37 - 65.43%, respectively. The moisture content of the remaining composite cookies varies between 7.97 and 8.67% while control X had the highest 11.15% value. The moisture content of the composite cookies was lower compared to 100% wheat cookie. The values obtained for composite cookies were within the range of (5 – 10%) set by the Protein Advisory Group (PAG) (Sanni et al., 2006), reported as not having an adverse effect on the quality attributes of the product. Barber and Obinna (2016) concurred with the values recorded with 7.1 - 7.8%. A similar trend of decrease in moisture content was observed by Igbabul et al. (2014) who reported a decrease in moisture of products from composite flours of cereals and legumes. Figure 1a shows the decrease in moisture content as the walnut protein isolate and wheat flour substitution increase. The R-squared and Adjusted R-squared values were 0.5197 and 0.0874 respectively. The final equation is shown below.
Moisture content = 8.13 – 0.015A – 0.026B – 0.055C + 0.061A2 + 0.033B2 + 0.031C2 – 8.75x10³AB – 0.18AC – 0.041BC
The highest protein content occurred in run 16 while run 4 scored lowest values. Other runs had their values being around 9 to 10 %. The protein content in the composite cookie was significantly higher than control cookie. The highest value of protein content recorded in the study signified low proportion in CWF with appropriate ratio of YMF and AWPI substituted in the blends. High protein content is a desirable quality feature in novel food. In addition, low protein intake in control X is reported to be a cause of under-nutrition by Bain et al. (2013) and these are common in the market. This in turn, leads to malnutrition. The protein enhancement in cookie shows how African walnut-protein-isolate exceedingly improves the nutrient so that the enriched cookies can solve malnutrition problems like kwashiorkor. More so, inclusion
Croatian Journal of Food Technology, Biotechnology and Nutrition vol.15 (1-2), 202058
CROATIAN JOURNAL OF FOOD TECHNOLOGY, BIOTECHNOLOGY AND NUTRITION
of AWPI reveals that the protein content of composite cookies would be of better quality as compared with 100% wheat flour cookie. The inclusion of AWPI enhanced the content of cookie protein and statement was compared with wheat-African walnut cookie (Barber and Obinna-Echem, 2016; Awofadeju et al., 2015). It was stated that African walnut seed is rich in protein (Ndie et al., 2010). The expected increase in the protein content of the cookie was the reason for the formulation, such that the final products will not only have higher protein content but protein quality. The graph in Figure 1b reveals impact of blends on protein content in an enriched cookie. The value for R-squared and Adjusted R-squared were 0.5128 and 0.0743 respectively. The final equation is shown below:
Protein content = 10.69 + 0.043A – 9.48x10³B + 0.13C – 0.062A2 – 0.36B2 – 0.33C2 + 0.095AB + 0.20AC - 0.013BC
The fat content ranged from 8.80 to 18.38%. Control X had the utmost value (18.38%) as smallest amount (8.80%) occurred in run 10. The ratio of African walnut protein isolate substituted tends to yield low fat content in the blends. Composite cookies 2, 6, 8, 11 and 17 values were not different from each other, their contents being around 11% fats.
Table 1. Proximate composition of the enriched cookie
Run A (g) B (g) C (g) moisture content Protein (%) Fat (%) Ash (%) Fiber (%) Carbohydrate (%)
X 100.00 0.00 0.00 11.15 ± 0.76 6.13 ± 0.05 18.38 ± 0.30 0.88 ± 0.04 0.13 ± 0.00 65.50 ± 0.531 50.00 30.00 20.00 8.03 ± 0.12 9.66 ± 0.21 14.63 ± 0.25 3.33 ± 0.15 1.60 ± 0.10 62.73 ± 0.402 55.87 23.17 20.95 8.27 ± 0.15 9.83 ± 0.15 11.30 ± 0.10 3.77 ± 0.15 1.30 ± 0.10 65.43 ± 0.063 50.00 31.25 18.75 8.13 ± 0.15 10.67 ± 0.21 14.87 ± 0.06 3.37 ± 0.06 1.60 ± 0.10 61.37 ± 0.404 42.86 42.86 14.29 8.13 ± 0.15 9.13 ± 0.15 13.53 ± 0.20 3.33 ± 0.15 1.73 ± 0.15 64.50 ± 0.36 5 50.00 31.25 18.75 8.13 ± 0.15 10.67 ± 0.21 14.87 ± 0.06 3.37 ± 0.06 1.60 ± 0.10 61.37 ± 0.406 58.69 25.82 15.49 8.43 ± 0.21 10.63 ± 0.15 11.67 ± 0.21 3.77± 0.15 1.50 ± 0.10 64.00 ± 0.267 50.00 31.25 18.75 8.13 ± 0.15 10.67 ± 0.21 14.87 ± 0.06 3.37 ± 0.06 1.60 ± 0.10 61.37 ± 0.408 55.56 22.22 22.22 8.07 ± 0.21 10.47 ± 0.15 11.17 ± 0.15 3.63 ± 0.12 1.33 ± 0.06 65.33 ± 0.259 37.50 37.50 25.00 8.37 ± 0.15 9.43 ± 0.15 10.27 ± 0.15 3.70 ± 0.10 1.30 ± 0.10 64.93 ± 0.3010 55.56 33.33 11.11 8.20 ± 0.10 10.03 ± 0.15 8.80 ± 0.15 3.50 ± 0.10 1.20 ± 0.10 64.90 ± 0.0011 45.24 28.27 26.48 7.90 ± 0.20 10.68 ± 0.10 11.77 ± 0.15 3.50 ± 0.10 1.47 ± 0.15 64.67 ± 0.5512 50.00 33.33 16.67 7.97 ± 0.15 10.27 ± 0.15 14.73 ± 0.15 3.47 ± 0.15 1.36 ± 0.06 61.83 ± 0.0613 50.00 31.25 18.75 8.13 ± 0.15 10.67 ± 0.21 14.87 ± 0.06 3.37 ± 0.06 1.60 ± 0.10 61.37 ± 0.4014 42.86 28.57 28.57 8.67 ± 0.15 10.13 ± 0.15 13.77 ± 0.15 3.37 ± 0.15 1.23 ± 0.06 65.33 ± 0.3115 62.50 25.00 12.50 8.37 ± 0.15 9.30 ± 0.15 10.17 ± 0.15 3.33 ± 0.06 1.20 ± 0.1 64.97 ± 1.4216 36.69 39.57 23.74 8.27 ± 0.21 11.17 ± 0.15 9.27 ± 0.15 3.60 ± 0.10 1.30 ± 0.10 65.40 ± 0.1517 45.24 37.79 16.97 8.27 ± 0.15 10.30 ± 0.10 10.73 ± 0.15 3.73 ± 0.15 1.23 ± 0.06 65.13 ± 0.0818 55.87 34.92 9.21 8.63 ± 0.15 9.63 ± 0.15 9.73 ± 0.15 3.60 ± 0.10 1.17 ± 0.06 61.23 ± 0.2519 50.00 31.25 18.75 8.13 ± 0.15 10.67 ± 0.21 14.87 ± 0.06 3.37 ± 0.06 1.60 ± 0.10 61.37 ± 0.4020 50.00 31.25 18.75 8.13 ± 0.15 10.67 ± 0.21 14.87 ± 0.06 3.37 ± 0.06 1.60 ± 0.10 61.37 ± 0.40
Note: A-wheat flour, B- yellow maize flour, C- walnut protein isolate, CHO-Carbohydrate.
Awofadeju, O.F.J. et al.: 54-64
Croatian Journal of Food Technology, Biotechnology and Nutrition vol.15 (1-2), 2020 59
CROATIAN JOURNAL OF FOOD TECHNOLOGY, BIOTECHNOLOGY AND NUTRITION
Awofadeju, O.F.J. et al.: 54-64
a) Moisture content (Commercial Wheat Flour versus African Walnut Protein Isolate)
b) Protein content (Commercial Wheat Flour versus African Walnut Protein Isolate)
c) Crude fiber content (Commercial Wheat Flour versus Yellow Maize Flour)
Figure 1 (a – c): 3D
surface plots showing the effect of proxim
ate composition on enriched cookies and dependent [(a) m
oisture (b) protein (c) crude fiber)] variables displaying significant differences

Croatian Journal of Food Technology, Biotechnology and Nutrition vol.15 (1-2), 202060
CROATIAN JOURNAL OF FOOD TECHNOLOGY, BIOTECHNOLOGY AND NUTRITION
The fat contents of cookies 1, 3, 5, 7, 12, 13, 14, 19 and 20 were around 14% while cookies 10, 16 and 18 had values around 9%. The value of control cookie was higher than the composite cookies. This means that the substitution of African walnut-protein-isolate and yellow maize flour decreased the fat content of the composite cookies. This was so because AWPI had been defatted and undergone extraction processes. The values in this work are supported by Eugene et al. (2015) with similar findings recorded for Wheat-African walnut cookies by (Barber and Obinna-Echem, 2016). It ranged from 14 – 22%. The results obtained were similar to 11.98% recorded by (Chugh et al., 2016). The amount of fat obtained was comparable with values ranged from 8.45 to 9.41% (Adeyeye et al., 1994). The ash content increased from 0.88 to values 3.33 and 3.77% with control X having smallest amount while run 2 and 6 both had maximum point (3.77%), with the same value in common. The increase in ash content of composite cookie is to verify that YMF had a maximum content of ash (Awofadeju, 2020), also a good source of minerals (Enyisi et al., 2014a). Inclusion of African walnut-protein-isolate and yellow maize into wheat flours yields high ash content in the composite cookies compared to wheat cookie (control). Adeyeye et al. (1994), recorded 2.87 to 3.81% ash for maize flour-soy protein isolate cookies; Awofadeju et al., (2015) developed wheat-African walnut cookie and reported a range of 4.1 - 4.2% for the composite cookies. Therefore, by referring to these values, they were within common values. The crude fiber content varied between 0.13 and 1.73%. Control X had the lowest content (0.13%) while composite cookie 4 had the highest value. Moreover, control X was significantly lower than all the composite cookies which ranged from 1.17 to 1.73% for run 18 and 4, respectively. The proportion of African walnut-protein isolate in the blends keeps the fiber content of the composite cookie (run 18) low but high amount of yellow maize flour increases it (run 4). More so, substitution of YMF equally brought about increase in crude fiber from control 0.13% to enriched cookies 1.73% in run 4 with 42.86 g YMF.The differences in values obtained between control and enriched cookies might be due to the fact that YMF added in the mixture of cookie preparation were rich sources of dietary fiber which therefore influenced the content of cookie. It agrees with the report of (Omoba et al., 2013). However, they were within the 1.5 – 2.0 recommended by Nigerian Raw Materials Research and Development Council (RMRDC, 2004). Yellow maize and wheat flours contribute to the increase of crude fiber in composite cookies better than African walnut protein isolate because crude fiber was not detected in AWPI as reported by (Awofadeju, 2020).
The values achieved in this course falls within the range of 1.69 to 2.63% (Adeyeye et al., 1994). The 3D plot graph in Figure 1c describes an increase in crude fiber as addition of wheat flour and African walnut protein isolate decreased and later increased as YMF increases. The R2 and Adjusted R-squared were 0.8803 and 0.7726 respectively. The equation is shown belowCrude fiber = 1.60 + 3.395 x 10³A – 0.011B + 0.035C – 0.059A2 – 0.11B2 – 0.087C2 + 0.071AB + 0.14AC + 0.089BC The carbohydrate content of control cookie was recorded to be highest having 65.50% value. The contents of enriched cookies ranged between 61.23 and 65.43%. Inclusion of African walnut protein isolate to the blends yields low carbohydrate content of the enriched cookies. This is because AWPI typically contains no carbohydrate contents while YMF and CWF contain more (Awofadeju, 2020). A related finding was experimental by (Awofadeju et al., 2015). Their wheat cookies had 52.36% carbohydrate while, composite cookies made of wheat and African walnut flour recorded between 47.1 and 48.6%. Also, Barber and Obinna-Echem (2016) reported a range of 53.6 to 58.2% and 60.9% for wheat cookies which served as control. Consequently, African walnut protein isolate supplementation into other flours reduces carbohydrate content of the resulting cookies.
Sensory evaluation of cookies
The best rated cookie in taste occurred in control sample followed by run 10 (Table 2). The highest mean score in the treated cookie was based on the proportion of African walnut protein isolate (11.11 g). The statement was justified by previous studies in the literature that substitution level of 5 to 15 % African walnut to wheat flours in cookie preparation is accepted (Barber and Obinna-Echem, 2016; Awofadeju et al., 2015). Based on the observation from the panelists, no bitterness was felt on the best treated cookie (run 10) after drinking water. The appearance of control cookie is more acceptable followed by run 10 among the treated cookie apparently because in the other treatments, the inclusion of African walnut protein isolate was above recommended ratio (Barber and Obinna-Echem, 2016) which affected the appearance, aroma and crunchiness. Appearance judged how well the cookies were baked and equally provides information about the formulation product quality (Hussain et al., 2006).
Table 2. Mean sensory scores of cookies
Runs Taste Appearance Crunchiness Mouth feel Aroma Overall acceptabilityX 9.00a 9.00a 9.00a 9.00a 9.00a 9.00a
1 6.27bcd 5.53def 6.40bc 6.27bc 6.33bcde 6.67bcd
2 5.73cdef 5.80cde 5.87cd 6.13bcd 5.80cde 6.13cdef
3 4.20g 4.80ef 4.20f 4.27e 4.47f 4.27g
4 6.27bcd 6.13cd 6.67c 6.33bc 6.20bcde 6.67bcd
5 4.20g 4.80ef 4.20f 4.27e 4.47f 4.27g
6 5.60cdef 4.47g 5.47cd 5.20cde 5.00ef 5.77cdef
7 4.20g 4.80ef 4.20f 4.27e 4.47f 4.27g
8 5.80cdef 4.47g 5.87cd 5.53cde 6.00bcde 5.80cdef
9 4.67fg 4.40g 4.93de 4.87de 5.27def 5.13fg
10 7.47b 7.27b 7.20b 7.00b 7.27b 7.67b
11 4.52fg 4.67ef 4.53ef 4.75de 4.47f 4.90fg
12 5.20defg 5.40def 5.73cd 5.00cde 5.00ef 5.33efg
13 4.20g 4.80ef 4.20f 4.27e 4.47f 4.27g
14 4.13g 4.39g 4.13f 4.37f 4.43g 4.33fg
15 5.13defg 5.33def 6.20bc 5.33cde 6.20bcde 5.87cdef
16 6.80bc 6.87bc 6.68c 6.20bcd 7.07bc 6.93bc
17 5.73cdef 6.13cd 6.33bc 5.87bcd 6.13bcde 6.13cdef
18 6.27bcd 6.13cd 6.20bc 6.20bcd 6.53bcde 6.47bcde
19 4.20g 4.80ef 4.20f 4.27e 4.47f 4.27g
20 4.20g 4.80ef 4.20f 4.27e 4.47f 4.27g
Mean values in a column with the same superscript are not significantly (p<0.05) different. Note X serves as control (100% wheat flour)
Awofadeju, O.F.J. et al.: 54-64
Croatian Journal of Food Technology, Biotechnology and Nutrition vol.15 (1-2), 2020 61
CROATIAN JOURNAL OF FOOD TECHNOLOGY, BIOTECHNOLOGY AND NUTRITION
Awofadeju, O.F.J. et al.: 54-64
The preference mean scores of crunchiness and aroma in enriched cookies were placed on run 10 after control sample. Furthermore, the overall acceptability of untreated cookie (X) was rated highest. Treated cookies that were rated above 6 point hedonic scale are arranged in sequential order (10, 16, 1, 4, 18, 2 and 17). The proportion of flours in run 10 apparently gave a peculiar taste, aroma and appearance that were appealing. The blending of the flours was appropriate which rated run 10 (55.56 g WF; 33.33 g YMF; 11.11 g WPI), and perhaps the reason for the high overall acceptability above other treated cookies. The possibility of overall acceptability levels in run 16 and 10 could be attributed to their closeness in the aroma but run 10 was highly accepted irrespective of high percentage of protein in run 16. However, the value of blending flours was earlier reported by an earlier study on plantain-brewers spent grain in cookie preparation resulted in better overall acceptability (Omoba et al., 2013). Considering the results of high protein (11.17%), low fat (8.80%), high fiber (1.73%) and response from sensory evaluation (sample 10 and 16), the best three composite cookies 4 (42.86 g of WF, 42.86 g of YMF and 14.29 g of WPI); 10 (55.56 g of WF, 33.33 g of YMF and 11.11 g of WPI); and 16 (36.69 g of WF, 39.57 g of YMF and 23.74 g of WPI) with control sample were selected and used for further analysis of vitamins and minerals composition.
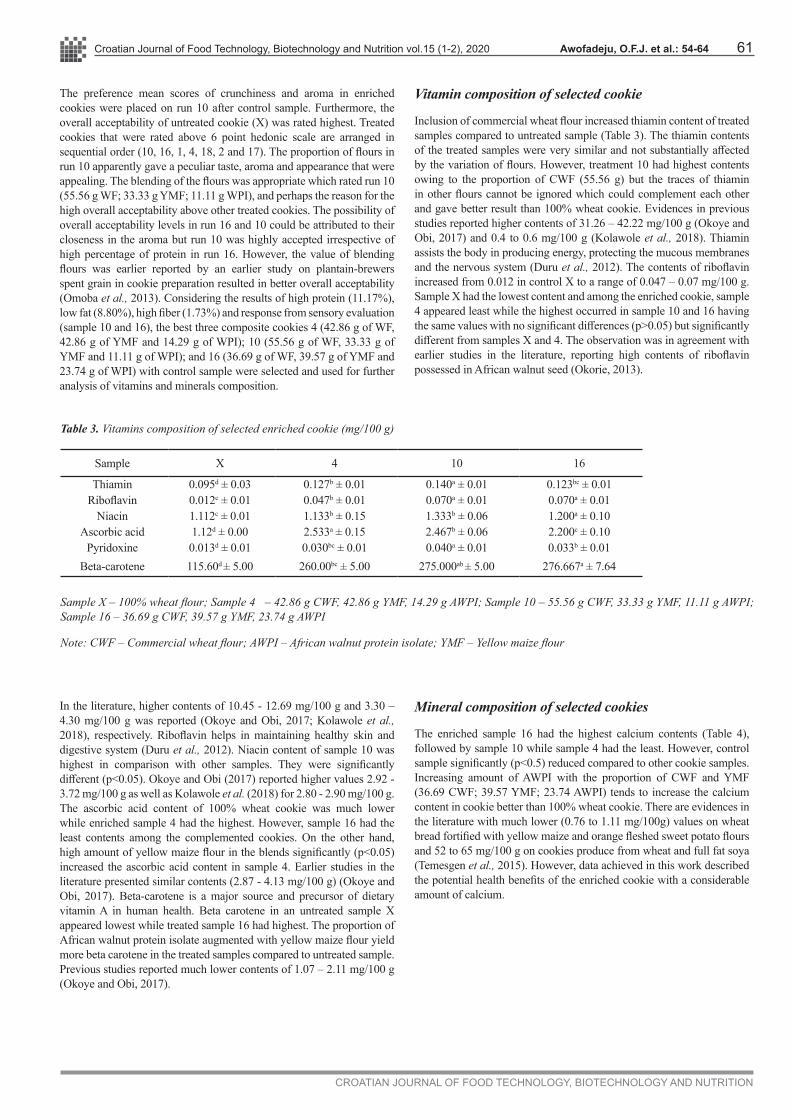
Vitamin composition of selected cookie
Inclusion of commercial wheat flour increased thiamin content of treated samples compared to untreated sample (Table 3). The thiamin contents of the treated samples were very similar and not substantially affected by the variation of flours. However, treatment 10 had highest contents owing to the proportion of CWF (55.56 g) but the traces of thiamin in other flours cannot be ignored which could complement each other and gave better result than 100% wheat cookie. Evidences in previous studies reported higher contents of 31.26 – 42.22 mg/100 g (Okoye and Obi, 2017) and 0.4 to 0.6 mg/100 g (Kolawole et al., 2018). Thiamin assists the body in producing energy, protecting the mucous membranes and the nervous system (Duru et al., 2012). The contents of riboflavin increased from 0.012 in control X to a range of 0.047 – 0.07 mg/100 g. Sample X had the lowest content and among the enriched cookie, sample 4 appeared least while the highest occurred in sample 10 and 16 having the same values with no significant differences (p>0.05) but significantly different from samples X and 4. The observation was in agreement with earlier studies in the literature, reporting high contents of riboflavin possessed in African walnut seed (Okorie, 2013).
Table 3. Vitamins composition of selected enriched cookie (mg/100 g)
Sample X 4 10 16
Thiamin 0.095d ± 0.03 0.127b ± 0.01 0.140a ± 0.01 0.123bc ± 0.01Riboflavin 0.012c ± 0.01 0.047b ± 0.01 0.070a ± 0.01 0.070a ± 0.01
Niacin 1.112c ± 0.01 1.133b ± 0.15 1.333b ± 0.06 1.200a ± 0.10Ascorbic acid 1.12d ± 0.00 2.533a ± 0.15 2.467b ± 0.06 2.200c ± 0.10
Pyridoxine 0.013d ± 0.01 0.030bc ± 0.01 0.040a ± 0.01 0.033b ± 0.01Beta-carotene 115.60d ± 5.00 260.00bc ± 5.00 275.000ab ± 5.00 276.667a ± 7.64
Sample X – 100% wheat flour; Sample 4 – 42.86 g CWF, 42.86 g YMF, 14.29 g AWPI; Sample 10 – 55.56 g CWF, 33.33 g YMF, 11.11 g AWPI; Sample 16 – 36.69 g CWF, 39.57 g YMF, 23.74 g AWPI
Note: CWF – Commercial wheat flour; AWPI – African walnut protein isolate; YMF – Yellow maize flour
In the literature, higher contents of 10.45 - 12.69 mg/100 g and 3.30 – 4.30 mg/100 g was reported (Okoye and Obi, 2017; Kolawole et al., 2018), respectively. Riboflavin helps in maintaining healthy skin and digestive system (Duru et al., 2012). Niacin content of sample 10 was highest in comparison with other samples. They were significantly different (p<0.05). Okoye and Obi (2017) reported higher values 2.92 - 3.72 mg/100 g as well as Kolawole et al. (2018) for 2.80 - 2.90 mg/100 g. The ascorbic acid content of 100% wheat cookie was much lower while enriched sample 4 had the highest. However, sample 16 had the least contents among the complemented cookies. On the other hand, high amount of yellow maize flour in the blends significantly (p<0.05) increased the ascorbic acid content in sample 4. Earlier studies in the literature presented similar contents (2.87 - 4.13 mg/100 g) (Okoye and Obi, 2017). Beta-carotene is a major source and precursor of dietary vitamin A in human health. Beta carotene in an untreated sample X appeared lowest while treated sample 16 had highest. The proportion of African walnut protein isolate augmented with yellow maize flour yield more beta carotene in the treated samples compared to untreated sample. Previous studies reported much lower contents of 1.07 – 2.11 mg/100 g (Okoye and Obi, 2017).
Mineral composition of selected cookies
The enriched sample 16 had the highest calcium contents (Table 4), followed by sample 10 while sample 4 had the least. However, control sample significantly (p<0.5) reduced compared to other cookie samples. Increasing amount of AWPI with the proportion of CWF and YMF (36.69 CWF; 39.57 YMF; 23.74 AWPI) tends to increase the calcium content in cookie better than 100% wheat cookie. There are evidences in the literature with much lower (0.76 to 1.11 mg/100g) values on wheat bread fortified with yellow maize and orange fleshed sweet potato flours and 52 to 65 mg/100 g on cookies produce from wheat and full fat soya (Temesgen et al., 2015). However, data achieved in this work described the potential health benefits of the enriched cookie with a considerable amount of calcium.

Croatian Journal of Food Technology, Biotechnology and Nutrition vol.15 (1-2), 202062
CROATIAN JOURNAL OF FOOD TECHNOLOGY, BIOTECHNOLOGY AND NUTRITION
Table 4. Mineral composition of selected enriched cookies (mg/100 g)
Sample Calcium Manganese Iron Sodium Phosphorus
X 90.10d ± 0.10 0.015d ± 0.00 1.68c ± 0.03 62.68d ± 0.11 12.45c ± 0.04
4 123.33c ± 2.89 0.027bc ± 0.01 9.43b ± 0.21 323.33b ± 7.64 83.33ab ± 2.89
10 128.33ab ± 7.64 0.033b ± 0.01 9.70ab ± 0.10 315.00c ± 5.00 78.33b ± 2.89
16 130.00a ± 5.00 0.043a ± 0.02 9.77a ± 0.06 333.33a ± 2.89 85.00a ± 5.00
Sample X – 100% wheat flour; Sample 4 – 42.86 g CWF, 42.86 g YMF, 14.29 g AWPI; Sample 10 – 55.56 g CWF, 33.33 g YMF, 11.11 g AWPI; Sample 16 – 36.69 g CWF, 39.57 g YMF, 23.74 g AWPI
Note: CWF – Commercial wheat flour; AWPI – African walnut protein isolate; YMF – Yellow maize flour
Manganese contents varied from 0.015 in sample X between a range of 0.027 and 0.043%. Composite cookie 4 had the lowest content of 0.027 while sample 16 had the highest (0.043). They were significantly different (p<0.05) from each other but not significantly different (p>0.05) from composite cookie 10 with the content of 0.033 which is close to sample 4. High amount of African walnut protein isolate and yellow maize flour increased the manganese in the composite cookie. According to Shaista et al. (2017), it is found that the high value of yellow maize (21.48%) compared to white maize indicates that yellow maize is rich in manganese. Therefore, the substitution of yellow maize flour with the addition of AWPI into the blends is advantageous because it contributes nutritional importance to the cookies. The amount of manganese determined on walnut shows that the plant can be used to protect bone disease (James, 2009). The contents of iron in this study increased from 1.68 to a range of 9.43 and 9.77% with control having the least value. The lowest content in an enriched cookie was observed in sample 4 (9.43%) while sample 16 had the highest (9.77%). They were significantly different (p<0.05) from each other. Cookie sample 16 had the highest percentage of African walnut protein isolate substitution which reflects the increase of iron content. Earlier studies reported lower iron content (2.55 – 3.19 mg/100 g) for wheat-soya cookies (Ndie et al., 2010). However, much higher iron contents have been previously reported (7.23 – 20.96 mg/100 g) (Gamal et al., 2012). More so, all enriched cookie samples analyzed contain adequate proportion of iron when compared with RDA of 7, 8 and 9 mg. Thus, dietary of iron is best supplied by consumption of wheat-walnut enriched cookies than 100% wheat flour cookie. Iron is the most common micronutrient deficiency in the world. It is an essential nutrient for growing children and women of childbearing age. They are the highest-risk group because children that lack iron might develop a condition called iron deficiency (anemia). This also applies to women that experienced a loss of blood either through menstruation or pregnancy and lactating mothers (Onabanjo and Oguntona, 2003). Sodium contents varied from 62.68 to a range of 315.00 and 333.33. Among the enriched cookie, sample 10 had the lowest while sample 16 scored highest. The control sample had the least score of 62.68 among the cookies. The sodium contents of the enriched cookie significantly (p<0.05) increased with increasing amount of African walnut protein isolate. However, much lower contents have been earlier reported 6.90 and 8.56 mg/100 g for wheat-soya cookies (Ndie et al., 2010). However, the results recorded in this work indicate that cookies produced from wheat and yellow maize enriched with African walnut protein isolate is safe for consumption when considering sodium intake. The phosphorus contents of the cookie increased from 12.45 to a range of 78.33 to 85.00%. The lowest value occurred in the control sample while sample 16 scored highest. Among the enriched cookie, sample 10 had the lowest
value. Contents of phosphorus in sample 16 significantly (p<0.05) increased with increasing amount of African walnut protein isolates but opposite in sample 4 (11.11%).
Conclusions
Inclusion of African walnut protein isolate and yellow maize flour into wheat flour increased the nutritional and sensory attributes of cookies. However, treated samples possessed essential nutrients better than untreated sample which can be used to alleviate protein-energy malnutrition. Nevertheless, study showed that proportion of flours in sample 36.69g CWF, 39.57g YMF, 23.74g AWPI scored highest in proximate composition. The overall acceptability on selected cookie samples was placed on sample 55.56g WF, 33.33g YMF, 11.11g AWPI irrespective of highest protein content recorded in sample 36.69g CWF, 39.57g YMF, 23.74g AWPI. This is due to the sensory attributes such as crunchiness, appearance, good taste and aroma. Also, no bitterness was felt after drinking water. Therefore, the studies recommend the use of flour proportion in sample 55.56g CWF, 33.33g YMF, 11.11g AWPI as an improvement of the nutritional and sensory attributes of enriched cookie. However, further research should be done on the protein fraction and molecular structure of protein isolate from African walnut seed and novel product.
Significance statement
This study discover the optimization condition for the production of high-value cookies using blends of commercial wheat, yellow maize flours and protein isolate from African walnut seed. It also provides alternative use to African walnut seed in cookie production. The study also reveals improvement in the nutritional value of cookies through the use of African walnut protein isolate. The enriched cookie can be beneficial for those suffering from malnutrition especially growing and school children. This study will help the researcher to uncover the underutilized crops rich in protein, minerals and vitamins that populace was not familiar with thereby incorporating it into their diet. Thus, improvement on this research may be done.
Conflict of interest: no conflict of interest
Awofadeju, O.F.J. et al.: 54-64

Croatian Journal of Food Technology, Biotechnology and Nutrition vol.15 (1-2), 2020 63
CROATIAN JOURNAL OF FOOD TECHNOLOGY, BIOTECHNOLOGY AND NUTRITION
Awofadeju, O.F.J. et al.: 54-64
References
Abayomi H. T., Oresanya T. O., Opeifa A. O., Rasheed T. R. (2013) Quality evaluation of cookies produced from blends of sweet potato and fermented soybean flour, World Academy of Science, Engineering and Technology. International Journal of Biological, Food, Veterinary and Agricultural Engineering 7(7) 350 - 355.Adeyeye E. I., Oshodi A. A., Ipinmoro, K. O. (1994) Functional properties of some varieties of African Yam bean (Sphenostylis steriocarpa) flour. International Journal of Food Science and Nutrition 45 115 - 126.AOAC (2010) Official Methods of Analysis, 18th Ed. Association of Official Analytical Chemists, Washington D.C, USA.Awofadeju O. F. J. (2020) Evaluation of Protein Quality in Blends Prepared from Commercial Wheat (Triticum aestivum) and Yellow Maize Flours (Zea mays) and African Walnut (Tetracarpidium conophorum) Protein Isolate. European Modern Studies Journal 4(1) 113-129 ISSN 2522-9400Awofadeju O. F., Awe A. B., Adewumi O. J., Amadi B.O., Oluwatoke F. O. (2015) Nutritional and organoleptic evaluation of cookie produced from wheat flour and African walnut (Tetracarpidium conophora) flour blends. Elixir Food Science 86 34898 - 32900.Ayo J. A., Ikuomola D.S., Sanni T.A., Esson Y.O., Ayo V.A., Ajayi A. (2010) Evaluation of the nutritional quality of soy-acha composite biscuits. Nigerian Food Journal. 2 (2) 371-385.Bain L. E., Awah P. K., Ngia G., Kindong N. P., Sigal Y., Nsah B., Tamjeko A. T. (2013) Malnutrition in Sub-Saharan Africa: burden, causes, and prospects. Pan African Medical Journal. Barber I. C., Obinna-Echem, P. C. (2016) Nutrient Composition, Physical and Sensory Properties of wheat-African walnut cookies. Sky Journal of Food Science 5(4) 24-30. http://www.skyjournals.org/SJFSChugh B., Singh G., Kumbhar, B. K. (2016) Optimization of ingredients for the development of low-fat biscuits using response surface methodology. Journal of Food and Industrial Microbiology 2 110.Duru A. M., Adindu E., Amadi B., Agomuo E. (2012). Chemical profile of an anti-malaria concortion. Journal Emerging Trends in Engineering and Applied Science 3 444 - 447.Echendu C. A., Onimawo I. A., Somtochi, A. (2004) Production and Evaluation of Doughnuts and Biscuits from Maize- Pigeon pea Flour Blends. Nigerian Food Journal 22 147-153.Eneche E. H. (2003) Biscuit making potentials of millet/pigeon pea flour blends. Plant Foods Human Nutrition 54 21-27.Enyisi I. S., Umoh V., Whong C., Abdullahi I., Alabi, O. (2014a) Chemical and nutritional value of maize and maize products obtained from selected markets in Kaduna State, Nigeria. African Journal Food Science and Technology 5(4) 100-104. DOI: http:/dx.doi.org/10.14303/ajfst.2014.029Eugene N. Onyeike, Ernest A. Anyalogbu, Michael O. Monanu (2015) Effect of Heat Processing on the Proximate Composition and Energy Values of African Walnut (Plukenetia conophora) and African Elemi (Canarium schweinfurthii) Consumed as Masticatories in Nigeria. International Journal of Scientific and Technology Research 4(8) 295-301.Gamal A. El-Sharnouby, Salah M. Aleid, Mutlaq, M. Al-Otaibi (2012) Nutritional Quality of Biscuit Supplemented with Wheat Bran and Date Palm Fruits (Phoenix dactylifera L.). Food and Nutrition Sciences 3 322-328. Guo Z., Zhang L., Wu Z., Chen Y., Wang F., Chen, G. (2014) In-vivo Direct Reprogramming of reactive Glial Cells into Functional Neurons after Brain Injury and in Alzheimer’s Disease Model. 1-15.Hooda S., Jood, S. (2005) Organoleptic and nutritional evaluation of wheat biscuits supplemented with untreated and treated fenugreek flour. Food Chemistry 90 427-35.Hussain S., Anjum F. M., Butt M. S., Khan M. I., Ashaghar A. (2006) Physical and sensory attributes of flaxseed flour supplemented cookies. Journal of Biology 30 87-89IFPRI-International Food Policy Research Institute (2002) Sustainable Food Security for all by 2020. In: Proceedings of an International Conference, September 4-6, 2001. Bonn Germany. Pp. 16-34.Igbabul B., Num G., Amove, J. (2014) Quality Evaluation of Composite Bread Produced from Wheat, Maize and Orange Fleshed Sweet Potato Flours. American Journal of Food Science and Technology 2(4) 109-115. Doi:10.12691/ajfst-2-4-1.James N. R. (2009) Volatile compounds of green walnut husk. Journal Agriculture chemistry 48 (7) 2858-2861. Kolawole F. L., Akinwande B. A., Ade-Omowaye, B. I. O. (2018) Physicochemical properties of novel cookies produced from orange-fleshed sweet potato cookies enriched with sclerotium of edible mushroom (Pleurotus tuberregium). Journal of the Saudi Society of Agricultural Sciences 9 (1) 1-5. https://doi.org/10.1016/j.jssas.2018.09.001McWatters K. H., Ouedraogo J. B., Resurreccion A.V. A., Hung Y., Phillips, R. D. (2003) Physical and sensory characteristics of sugar cookies containing mixtures of wheat, fonio (Digitariaexilis) and cowpea (Vignaun guiculata) flours. International Journal of Food Science and Technology 38 403-410.Mepba H. D, Eboh L., Nwaojigwa, S. U. (2007) Chemical composition, Functional and Baking Properties of Wheat- Plantain Composite Flours. African Journal of Food Agriculture, Nutrition and. Development 7(1) 1-22.Ndie E. C., Nnamani C. V., Oselebe, H. O. (2010) Some physicochemical characteristics of defatted flours derived from African walnut (Tetracarpidium conophorum): An underutilized legume. Pakistan Journal of Nutrition 9 (9) 909–911.Nigerian Raw Materials Research and Development Council RMRDC Workshop on cassava (2004) In: Report on Survey of selected Agricultural Raw Materials in Nigeria. Raw Materials Research and Development Council (RMRDC), Abuja, Nigeria; 2004.Ogbebo W. (2014) Nigeria leads 20 countries with malnutrition burden. Leadership, pp 2-3.Ohizua E. R., Adeola A. A., Idowu M. A., Sobukola O. P., Afolabi A. T., Ishola R. O., Ayansina S. O., Oyekale T. O., Falomo, A. (2017) Nutrient composition, functional, and pasting properties of unripe cooking banana, pigeon pea, and sweet potato flour blends. Food Science and Nutrition 5 750-762. Doi: 10.1002/fsn3.455Okorie, S. U. (2013) Chemical composition of bread fruit (Artocarpus communis) seed flour as affected by processing (boiling and roasting). Pakistan Journal of Nutrition 9 (5) 419 – 421.Okoye J. I., Obi, C. D. (2017) Nutrient composition and sensory properties of wheat-African bread fruit composite flour cookies. Sky Journal of Food Science 6 (3) 027-032.Omoba O. S., Awolu O. O., Olagunju A. I., Akomolafe, A. O. (2013) Optimization of plantain-brewers spent grain biscuit using response surface methodology. Journal Science Resource Repository 2 665–681, Article no: JSRR.2013.015.Onabanjo O. O., Oguntona, C. R. B. (2003) Iron, zinc, copper and phytates content of standardized Nigerian dishes. Journal of Food Composition

Croatian Journal of Food Technology, Biotechnology and Nutrition vol.15 (1-2), 202064
CROATIAN JOURNAL OF FOOD TECHNOLOGY, BIOTECHNOLOGY AND NUTRITION
Awofadeju, O.F.J. et al.: 54-64
and Analysis 16 669-676.Onwuka G. I. (2005) Food Analysis and Instrumentation. Naphtali Prints Lagos, 29-73.Potter N., Hotchkiss J. (2006) Food Science. 5th Ed. CBS Publishers and Distributors 376 Danyangaji, New Delhi, India.Sanni O. L., Adebowale A. A., Filani T. A., Oyewole O. B., Westby A. (2006) Quality of flash and rotary dryer dried fufu flour. Journal Food Agriculture Environment 4 74–78.Shaista Q., Muhammad A., Fahrulzaman H., Muhammad A. J. (2017) Comparative study for the determination of nutritional composition in commercial and non-commercial yellow maize flours. Pakistan Journal of Botany 49 (2) 519-523. Temesgen L., Abebe Haile, Tigist Fekadu (2015) Production and Quality Evaluation of Cookies Enriched with β-Carotene by Blending Orange-Fleshed Sweet Potato and Wheat flours for Alleviation of Nutritional Insecurity. International Journal of Food Science and Nutrition Engineering 5(5) 209-217.Wade P. (1988) Biscuits, Cookies and Crackers: the principles of craft. 1 1-4.Wagner J. R., Sorgentini D. A., Anon, M. C. (2000) Relationship between solubility and surface hydrophobicity as an indicator of modification during preparation processes of commercial and laboratory prepared soy-protein isolates. Journal of Agricultural and Food Chemistry 48 3159-3165.World Intellectual Property Organization (2005) Finger millet bread formulation and a process for preparing the same. World Intellectual Property Organization Documentation, Ref No: 063026.