preliminary comments welcome - indiana university...
TRANSCRIPT

PreliminaryComments Welcome
The Impact of Malaria on African Development over the Longue Durée
David N. Weil
Brown University and NBER
October 2010
Abstract
I use data on the prevalence of the mutation that causes sickle cell disease to measure the impactof malaria in Africa during the period before European contact. My estimate is that in the moreafflicted regions, malaria lowered the probability of surviving to adulthood by about tenpercentage points. The reduction in the rate of malaria mortality over the last 500 years has beenof approximately the same magnitude as, although perhaps a bit smaller than, the reduction inmortality from other causes. I then ask whether the estimated burden of malaria had an effect oneconomic development in the period before European contact. Examining both mortality andmorbidity, I do not find evidence that the impact of malaria would have been very significant. Itis also notable that some of the areas of highest development prior to European contact, such asWest Africa and the Niger Bend, had environments that were especially supportive of malariatransmission.
I am grateful to Ronald D. Lee, Andrew Mason, and Gordon McCord for sharing data, to EmilioDepetris Chauvin, Federico Droller, and Scott Weiner for research assistance, and to QuamrulAshraf for helpful comments.
1

An extensive literature examines the impact of disease generally, and malaria in particular, oneconomic development in the world today. Malaria is especially a focus in Africa because of thehigh prevalence of the disease. There are some 300 million malaria cases annually on thecontinent, and it is the leading cause of under-five mortality. A widely quoted estimate is thatmalaria reduces growth of GDP per capita by 1.3% per year in the African countries mostafflicted. Africa is also the historical home of malaria, and the region with a physicalenvironment most supportive of the disease.
In this paper I ask how malaria influenced economic development in Africa in the period beforeEuropean contact. In particular, I ask whether malaria played a role in holding back Africandevelopment. Knowing the role of malaria is part of the much larger project of understandingthe determinants for Africa's early development in comparison to other parts of the world andalso understanding heterogeneity within the continent itself.
Answering the question I pose requires overcoming a number of very serious obstacles. The firstis the the absence of data. How prevalent was malaria in Africa? Was it more or less important,in either absolute terms or relative to other diseases, than it is today? Our understanding of therole played by malaria in the contemporary world relies on data generated by governmentstatistical agencies and NGOs as well as on field surveys by trained professionals. Even moderndoctors cannot accurately differentiate malarial illness from numerous other tropical maladieswithout using microscopes or rapid diagnostic tests. No statistical compilations exist from theperiod before Europeans started coming to Africa, and what textual sources there are do notprovide sufficient information to make a serious quantitative analysis.
Much of the contribution of this paper lies in trying to overcome this first obstacle, that is, tomeasure the extent of malaria in the pre-European period. Although there are no paper records,the malaria left a lasting imprint in human genes that can be interpreted in order to gauge theextent of the disease. Specifically, I look at the prevalence of the gene that causes sickle celldisease. Individuals who carried one copy of this gene were afforded a significant measure ofprotection against malaria, but those who carried two copies died before reaching reproductiveage. The equilibrium prevalence of the gene therefore depended on how severe the selectivepressure of malaria was -- more concretely, on the fraction of children who didn't carry the genewho died from malaria before adulthood. One can thus infer the severity of malaria from theprevalence of the sickle cell gene in modern populations. In this paper, I carry out suchcalculations, and construct estimates of the severity of malaria in Africa in the period beforeEuropean contact. I compare these estimates to the burden of malaria today and discuss howmalaria compares to other determinants of premature mortality, both in Africa and elsewhere.
Even with an estimate of malaria's health impact in the pre-contact period, establishing howmalaria affected African economic development is no easy matter. As will be seen below,economists do not agree on how malaria affects economic growth today, despite far superiorknowledge on the extent of the disease, data on the productivity of workers who are ill orhealthy, and concrete information on the functioning of the economy. Thus an assessment of
2

how malaria affected African economic development 500 years ago is necessarily highlyspeculative. I use simple economic models and modern data to explore two channels throughwhich malaria might have affected growth: through loss of life (mortality) and through its effecton the productivity of workers and the learning ability of children (morbidity).
1. African Economic Growth over the Longue Duree
Economists interested in the process of development over long historical eras have put togethervarious quantitative indicators of comparative development that can be used (cautiously) toassess Africa's standing prior to interaction with Europeans. Figures 1 through 3 show examplesof three such indicators, all aimed at measuring the state of the world in the year 1500. In allcases, the data have been mapped to the borders of current countries, most of which did not existat the time. The maps divide the countries with available data into four groups of equal size. Theunderlying data are presented in the Appendix Table.
Figure 1 shows a measure of population density. Population density can be used, within reason,as a measure of technological development of societies that are living close to subsistence, whichis a fair characterization of pretty much the entire world at that time. According to a simpleMalthusian model (see discussion below), countries with more advanced agriculturaltechnologies will not have better fed people, just more of them. Within a given country, changesin population density over time are a good measure of technological change. Unfortunately,when comparing countries, differences in geography and land quality, having nothing to do withtechnology, mean that population density is a noisy indicator of the state of development.Further, as can be seen from the Appendix Table, the African data on population density areestimates that apply to extremely broad country groups.
Figure 1 shows that the highest levels of population density were in the parts of Eurasia generallyviewed as the most developed: Europe and Turkey, South Asia, China, Japan, and Indonesia.The second densest group of countries includes the middle east, the Aztec, Maya, and Incaempires, and Egypt. Within sub-Saharan Africa the countries that fall within this group include alarge swathe of West Africa, and East Africa from Ethiopia and Sudan to Tanzania. CentralAfrica makes up most of the third most dense group, while the fourth most dense group iscomposed of the Americas (with the exceptions of the areas mentioned above), Australia, thecountries of the Sahara, and the southern part of the African continent.
Figure 2 presents data on an index of "state antiquity" from Chanda and Putterman (2007). Theindex is an attempt to measure the degree of a country's political development. For every 50 yearperiod between the years 1 and 1500 AD, a country is awarded a score based on three factors: theexistence of a government at a supra-tribal level, the proportion of the current territory of thecountry that the government controlled, and whether the government was indigenous orexternally imposed. These half-century scores were then aggregated for the full 1500 yearperiod.
3

The highest group for this measure includes a broad arc in Asia from Japan and China throughIran, Turkey, Western Europe with the exception of Spain and Ireland, Bolivia, Peru, and, on theAfrican continent, Egypt, Morocco, Tunisia, and Ethiopia. The second group includes much ofSoutheast Asia and Scandinavia, Mexico, Nigeria, Cameroon, Ghana, Botswana and severalstates in the Sahara. The third group includes most of the rest of West Africa, while the lowestgroup in terms of state development includes America north of Mexico, the Amazon basin,Southern Africa, Australia, and New Zealand. It is also important to note that there are goodnumber of countries for which there is no information at all for this index, although presumablythere is a bias toward these being countries with relatively undeveloped states which left behindfew records.
Figure 3 shows an index of technology adoption created by Comin, Easterly, and Gong (2010).The index is an aggregate of five sub-indices in the areas of communications, agriculture,military, industry, and transportation. For example, in the agriculture sub-index, a country gets ascore of four if the primary form of subsistence is plow cultivation, three if it is hand cultivation,two if it is pastoralism, and one if it is hunting and gathering.1 In the transportation sub-index,points are awarded for possession of the wheel, horse powered vehicles, the magnetic compass,and ships capable of crossing the Indian, Atlantic, and Pacific oceans.
The highest values in the technology index are in Japan, China, Turkey, and almost all ofEurope. The second highest group includes South and Southeast Asia, the Middle East andNorth Africa, Ethiopia, Nigeria, Mali, and Burkina Faso. Most of the rest of Africa is in the thirdhighest technology group, along with Mexico, Nepal, and Mongolia. The rest of the Americas,Australia, New Zealand, New Guinea, Botswana, and Namibia make up the lowest group.
An additional indicator of the extent of development over long historical periods is urbanization.The presence of large cities is taken as a measure of the existence of a significant agriculturalsurplus, a developed transportation infrastructure, and/or an effective ruling entity. Cities servedas loci for development in industry and knowledge. Finally, by their nature, cities are relativelywell observed by contemporary travelers and historians. Bairoch (1988) lists 10 cities in sub-Saharan Africa with populations of greater than twenty thousand around the year 1500. Thesewere Mbanza in the Congo (40-60 thousand), Benin City (60-70 thousand), GrandZimbabwe, Gao (eastern Mali), Gober (Niger), Djenne (Mali), Kano (Nigeria), Ngazargamu(Nigeria), Timbuktu (Mali) and Zaria (Nigeria). At roughly the same time, Europe had 90 citieswith populations of over 20 thousand (and four with populations over 100,000), while in theNorthern Andes there were 20 cities with populations over 20,000 and in Mexico there were 10such cities. According to Chandler (1987), the ten most populous cities in 1500 were Beijing(672 thousand), Vijayanagar, India (500), Cairo (400), Hangzhou (250), Tabriz (250), Istanbul(200), Gaur, India (200), Paris (185), Guangzhou (150), and Nanjing (147).
1. However Hopkins (1973) argues that environmental conditions made West Africa unsuitableto animal powered plow agriculture. Thus the non-use of plows is not necessarily a measure ofavailable technology.
4

The overall picture painted by these data shows, first, a great deal of heterogeneity ofdevelopment within Africa. Ignoring North Africa, which was generally part of theMediterranean world, the highest levels of development by many indices are found in Ethiopia(also relatively isolated geographically and culturally from much of the rest of the continent) andin the broad swathe of West African countries running from Cameroon and Nigeria eastwardalong the coast and the Niger river. In this latter region, the available measures show a level ofdevelopment just below or sometimes equal to that in the belt of Eurasia running from Japan andChina, through South Asia and the Middle East, into Europe. Depending on the index used,West Africa was above or below the level of development in the Northern Andes and Mexico.Much of the rest of Africa was at a significantly lower level of development, although still moreadvanced than the bulk of the Americas or Australia.
Several theories have been proposed to explain Africa's level of development on the eve of themodern era. Many of these have focused on sources of low agricultural productivity, which inturn prevented the accumulation of surpluses that could support urbanization, specialization, andtechnological advance. Diamond (1997) stresses the availability of plants and animals thatcould be easily domesticated (for example, sub-Saharan Africa had only 4 large seeded grassesthat could be developed for cultivation compared to 39 in Eurasia), and also the absence ofAfrica of a single large agro-climactic zone over which food production technologies could beshared. Other authors stress the impediments to agricultural productivity in tropical zones,including periods of torrential rain, leading to erosion of cultivated soil, and the absence of atemperate zone pattern of seasonal sunlight, which encourages development of easily storedseeds. Masters and McMillan (2001) point out that absence of frost, called "nature's greatexecutioner" for its role in suppressing agricultural pests. Webb (2006) describes West Africaas being characterized by poor soils and low caloric yields from the principal grain crops.Looking beyond agricultrual productivity, Gallup, Sachs, and Mellinger (1999) argue thatAfrican development was held back by lack of ocean-navigable rivers penetrating the continentand the location of population centers away from coastal lowlands, both of which impeded thedevelopment of water-borne trade.
Among the theories that have been proposed to explain Africa's relatively low level ofdevelopment, several authors have pointed to the continent's severe disease environment. As thehistorical cradle of humanity, African organisms that found humans to be congenial hosts had asignificant head start over those in other parts of the world. Humans who migrated out of Africaleft many of their parasites behind. In particular, two of the most significant tropical diseases,malaria and yellow fever, did not make the jump from Africa to the Americas until Europeansstarted sailing between the two areas (McNeill, 1977). Gallup, Sachs, and Mellinger (1999) findthat beyond the expected effect of tropical location in predicting disease intensity, there is afurther effect particular to sub-Saharan Africa. Discussions of the role of disease in shapingAfrican development generally focus on two diseases in particular: malaria and trypanosomiasis(sleeping sickness). Webb (2006) describes these as the two "most significant of themicroparasitic infections that influenced human settlement patterns and culture."
As discussed in Akyeampong (2006), much of our knowledge of health in Africa comes fromaccounts of travelers. The Arab chronicler Al-Bakri, who wrote in the eleventh century,
5

described a large town in northern Ghana as an area "where the inhabitants have yellowcomplexions because they suffer from fever and splenetis. There is hardly one who does notcomplain of one or the another." An enlarged spleen is a symptom of chronic malaria. Webb(2008) describes the interaction of settled communities on the perimeter of the rain forest withthe hunter gatherers of the forest. He says that in the settled communities, where malaria wasendemic, populations were relatively healthy, presumably due to acquired immunity. Bycontrast, hunter gatherers who came into only occasional contact with these population sufferedsevere morbidity and mortality.
However, the theory that the health environment in Africa was particularly bad is not universallyaccepted. Pre-modern society was not healthy in any part of the world. People living intemperate zones, through freed from tropical parasites, faced many other health challengesbrought on by climate, including nutritional deficiencies, diseases spread by being indoors, anddiseases which made the jump from livestock with whom people were forced to share livingquarters. Mabogunje and Richards (1985) point out that Europeans travelers who describedAfrica's harsh disease environment may have been overly influenced by the terrible toll diseasetook on their own cohorts (who had none of the immunity acquired by Africans as children) aswell as by the effects of new pathogens introduced by Europeans themselves. They concludethat "The grounds for supposing tropical Africa was any more badly affected by epidemicdiseases in the past than, say, western Europe or North America are yet to be established."
2. Malaria
2.1 The Impact of Malaria Today
In the WHO Afro region, which roughly corresponds to Africa south of the Sahara, in 2004 theannual death rate from malaria for children under five was 0.59% per year, implying that roughly3% of children would die of malaria before their fifth birthday. Malaria accounted for 15.8% ofthe total mortality burden in this age group. Malaria deaths are highly concentrated among theyoung. After age five, people who live in malaria endemic areas have developed partialimmunity to the disease (the exception is pregnant women, particularly women in their firstpregnancy, who lose their immunity.) Among people aged 15-29, for example, the death ratefrom malaria was just .006% per year, and only 1.2% of deaths were due to malaria (WHOGlobal Burden of Disease, 2004).
Beyond its effect on mortality, malaria also exacts a cost in terms of ill health and lowproductivity among those who survive. Table 1 shows data on the incidence, prevalence, andaverage duration of malaria in sub Saharan Africa. Incidence is the number of cases per year,while prevalence is the fraction of the population that has the condition at any point in time. Inthe 0-4 age group, there is an average of more than one case per child per year. Among adults,however, only 17.5% of individuals are afflicted each year, and because of the short duration ofepisodes, less than a quarter of one percent of individuals are ill at the average point in time.
Table 2 shows similar data for the neurological sequelae of childhood malaria. A small fractionof children who recover from cerebral malaria suffer from lifelong brain damage, including
6

epilepsy, spasticity, and learning disabilities. Because the condition lasts a lifetime, theprevalence of these symptoms among the adult population is actually higher than the prevalenceof episodic malaria.
Economic effects resulting from malaria may follow many channels. The direct effect is thatadults are unable to work during episodes of the disease, and may be significantly weakened fora period afterward. Repeated infection with malaria is associated with anaemia in children andadults. There are also effects on the human capital accumulation of children. Beyond theobvious effects in cases of neurological sequelae, children who suffer from malaria have reducedcognitive functioning and increased absenteeism from school. High childhood mortality fromthe disease may also induce parents to plan for extra births, and consequently invest fewerresources in each surviving child. Malaria may also affect the seasonal and spatial pattern ofeconomic activity. Gallup and Sachs (2001) give examples of regions in Europe that were largelyuninhabited prior to the eradication of malaria, and became productive agricultural regionsafterwards. The need to shift the harvest cycle away from seasons in which malaria is mostprevalent may alter the distribution of crops that farmers plant away from those that wouldotherwise be the most profitable. Malaria also occasions direct use of resources. In someheavily burdened countries up to 40% of public health expenditures, 30-50% of inpatient hospitaladmissions, and 60% of outpatient health clinic visits are attributable to malaria (World MalariaReport, 2010).
The overall magnitude of these economic effects of malaria is the subject of contentious debate.Most famously, the Abuja declaration of 2005, signed by fifty three African heads of stateclaimed that “malaria has slowed economic growth in African countries by 1.3% per year as aresult of which GDP for African countries is now 37% lower than it would have been in theabsence of malaria." This conclusion is based largely on cross-country regression studies,particularly Gallup and Sachs (2001). Ashraf, Lester, and Weil (2008) argue that this sort ofregression suffers from severe identification problems. Instead, they use a simulation modelwith key parameters based on well identified microeconomic studies. Their conclusion is thateliminating malaria in sub-Saharan Africa would increase income per capita by a total of only2%, with that benefit taking more than half a century to arrive.2
2.2 Malaria and Sickle Cell Disease
Malaria is caused by the plasmodium parasite, which is transmitted to humans through the bite ofa female anopheles mosquito. Within the human body, the parasite follows a complex life cycle.In part of that cycle, plasmodium merozoites invade and multiply within the body's red bloodcells, which eventually burst and release merozoites to infect new cells. Early symptoms ofmalaria include fever, chills, severe headache, and vomiting. In severe cases these are followedby respiratory distress, severe anemia, or cerebral malaria. Infants are protected from thedisease in the first few months of life by a combination of material antibodies and characteristicsof the structure of fetal hemoglobin. In malaria endemic areas, most children have developedsubstantial immunity by the age of five.
2. See Weil, 2010, for a more extensive discussion of this literature.
7

There are four types of malaria that infect humans, of which the two most common arePlasmodium falciparum and Plasmodium vivax. P. falciparum is the most deadly. Africaaccounts for 85% of world malaria cases and 90% of world malaria deaths. The geographicalpattern of malaria's severity is largely determined by the climactic conditions that supportmosquito breeding as well as by the mix of mosquito species present. There are significantdifferences in the vectorial capacity among the approximately 20 species of anopheles thattransmit malaria, based on factors such as the mosquito's preferred targets, biting frequency, andlifespan. The most effective vector, Anopheles gambiae, is the principal vector in Africa.
The current geographic distribution of malaria impact may not accurately represent the historicalburden of the disease. Packard (2007) gives numerous examples of how human activity haschanged the intensity of malaria. Clearing forests and introducing irrigation often produces themarshy environment needed for breeding of Anopheles mosquitoes. When large tracts of landare consolidated and controlled by a small number of landowners, people living on these landsare often deprived of the tools for properly tending to it and for avoiding malaria infection. Thisproblem is exacerbated when seasonal labor is used, as migrants may come from non-malariouszones and lack immunity, then return to these zones carrying malaria with them. As for Africa,he notes that “while climate and the presence of highly efficient vectors contributed to thepersistence of malaria, conditions of production played an equal if not greater role." Webb(2008) similarly describes how the introduction of agriculutre led to malaria endemicity inlowlands throughout the Eurasian landmass. Population density is also important to the nature ofmalaria burden. Packard argues that in the African contexts, low population densities associatedwith mobile hunter-gatherer populations would have been unable to support the P. Falciparuminfection because of the speed with which the disease exits or kills the human host. Theemergence of Anopheles gambiae is also believed to closely associated with the development ofagriculture. For all these reasons, the current distribution of malaria in Africa today ispotentially a poor proxy for the historical distribution.
Kisezewski et al. (2004) construct an index of "malaria ecology" that takes into account bothclimactic factors and the dominant vector species to give an overall measure of how congenialthe environment is to the spread of malaria. The index does not take into account public healthinterventions such as swamp-draining or differences among countries in economic developmentor health care infrastructure. In other words, it represents the component of malaria variationamong countries that is exogenous to human intervention. The index is calculated for gridsquares of one half degree longitude by one half degree latitude. Figure 4 show data for thewhole world, and Figure 5 shows a close-up of Africa. Country values (averaged over all thegrid squares in a country, weighted by grid square population) are given in the Appendix Table.With the exception of New Guinea and some areas of southeast Asian, Africa is the only part ofthe world in which the index reaches it highest levels. Areas in which malaria played asignificant role historically but has now been eradicated, such as Greece, Southern Italy, and theAmerican South, are all seen to have relatively low values for the malaria ecology index. Evenwithin Africa, there is substantial variation in the index, with peak values appearing in WestAfrica as well as Chad and Sudan.
8

Several mutations have arisen in human populations that provide resistance to malaria. Theseinclude the mutation causing thalassemia, which is present in Mediterranean, Arab, and Asianpopulations; the absence of the Duffy blood group in west Africa (which specifically blocks P.Vivax ); hemoglobin E in Southeast Asia; and hemoglobin C in West Africa (Allison, 2002;Nelson and Williams, 2006). The most important such mutation is the one that causes sickle celldisease.
Sickle cell trait is a mutation in the gene the produces hemoglobin, the oxygen-carryingcomponent in red blood cells. Individuals carry two copies of this gene, one received from eachparent. Individuals who carry one normal copy of the gene (referred to as A type) and one copywith the sickle cell mutation (S type) are carriers of the disease. In individuals of the ASphenotype, a fraction of the hemoglobin in their red blood cells with have an abnormal structure.In individuals who have two copies of the sickle cell gene (SS phenotype), almost allhemoglobin molecules are of the abnormal type.
In conditions of inadequate oxygen supply (hypoxia), hemoglobin produced by the S genebecomes rigid, leading to a characteristic sickle shape of red blood cells. Carriers of sickle celltrait generally do not suffer many adverse effects.3 However, there can be negativeconsequences from sickling in conditions of low oxygen such as unpressurized airplane flightsand extremely rigorous exercise (Motulsky, 1964). In individuals of the SS phenotype, suchsickling of red blood cells is far more common, leading to acute episodes of disease in whichabnormally shaped cells restrict blood flow to organs, severe damage to the spleen, and anemia.In 1994, life expectancy for SS children in the United States was 42 years for males and 48 yearsfor females. In the absence of modern medical care, individuals of the SS phenotype are not ableto survive to adulthood.
The sickle cell mutation is relevant to malaria because infection of a red blood cell with themalaria parasite leads to hypoxia. In individuals of the AS phenotype such blood cells sickle andare then eliminated by the body's immune system, lessening the burden of infection. Carriers ofthe sickle cell trait are particularly resistant to severe malarial episodes; they are less resistant tomild cases. The mechanism by which AS carriers are protected from malaria is different than theacquired immunity that both AA and AS individuals achieve following repeated exposure to thedisease.
The benefit that possessing a single copy of the sickle cell gene conveys counterbalances thebiological cost incurred when homozygous SS children are stricken with sickle cell disease. Anindividual of the AS phenotype is more likely to reach adulthood than is an individual of the AAphenotype, but the former is also more likely to see his/her child die of sickle cell disease. Thisis known as a heterozygote advantage or balanced polymorphism. As shown more formallybelow, the stronger is the pressure of malaria on survival, the more advantaged are individualswho carry the S gene, and in equilibrium, the higher the percentage of the population who will be
3. Williams, Mwangi, Wambua, Alexander, Kortok, Sonow, and Marsh (2005, Journal ofInfection Diseases) show the absence of any significant effect of carrier status on a wide range ofchildhood diseases.
9

carriers. Indeed, it was the correlation of high prevalence of the sickle cell gene and the presenceof malaria that first led scientists to understand the protective role of the sickle cell mutation.
Figure 6 shows data on the prevalence of the sickle cell gene among modern Africanpopulations. The correlation of sickle cell prevalence with malaria ecology is quite striking.According to Nelson and Williams (2006), the prevalence of AS hemoglobin in tropical Africaranges from 16-29% in adults. Prevalence rates of up to 40% have been found in particularpopulations, for example in Western Uganda and Tanzania south of Lake Victoria (Allison,2002).
It is of interest to compare malaria ecology and sickle cell prevalence, on the one hand, to theindicators of early development discussed in Section 1, on the other. Notably, one of the regionswith the highest level of early development, West Africa and the Niger Bend, also had one of thehighest burdens of malaria, although this is not true of Ethiopia, which was the other locus ofearly development. The lack of a correlation between malaria burden and early developmentmight be taken to suggest that malaria was not important. However, such correlations must beinterpreted cautiously, since many other factors that influence development are omitted.
3. Measuring the Historical Burden of Malaria Using Data on the Sickle Cell Trait
3.1 Simple Model
My goal is to examine what the prevalence of the sickle cell trait among African populations tellsus about the impact of malaria historically. As described above, every adult carries two alleles.These can be either sickle cell (S) or normal (A). A person with the SS phenotype will developsickle cell disease and not survive to adulthood. A person who carries the sickle cell trait (AS)will have a survival advantage against malaria in comparison to someone who doesn’t (AA).
I consider a simple model in which deaths occur due to either malaria (M) or to other causes,denoted P. The deaths that I am concerned with are those between birth and adulthood, which istaken to be the age at which children are produced. The number of adults from a cohort ofnewborns will be given by
(1)
Throughout the analysis, I will assume that the probability of dying from non-malaria causes, P,is the same for individuals with the AS and AA phenotypes.4 The probability of dying fromnon-malaria causes is equal to one for the SS phenotype. The probabilities of dying frommalaria, differ between AA and AS phenotypes. I designate these probabilities and. It is also useful to designate the relative survival rates of these two phenotypes, which I call :
4. Strictly speaking, P is the probability of dying of some non malaria cause conditional on notdying of malaria.
10

(2)
is the probability of a non-carrier living into adulthood relative to the probability of a carrierliving into adulthood. The smaller is , the larger is the advantage of the AS phenotype. A valueof =1 would indicate that there is no advantage to carrying the sickle cell gene.
The values for and , and thus for , will depend on both the disease environmentand the state of medical technology. For example, in a place where there are no malariamosquitoes, and will both be equal to zero, and will be equal to one. Clearly, theavailability of modern medical care should mean that both and are lower today thanthey were in the past. However, it is not clear a priori which mortality rate would be reduced bymore.
Relative Survival in Modern Populations
Although my interest is in asking what role malaria played historically, it is of interest to seewhat information is available about relative survival today. Nelson and Williams (2006) reportthat the prevalence of the the sickle cell trait in West Africa rises from 20-24% in newborns to26-29% in adults. This is evidence for differential survival. We can convert this into a measureof relative survival, , as follows: Taking the midpoint of each range (22% newborns and 27.5%of adults) and ignoring people who are SS, the data from Nelson and Williams imply that theratio of AS to AA in newborns is 22/78 and in adults is 27.5/72.5. The equation relating thenumbers of newborns and adults who are AA and AS is
(3)
Rearranging this equation:
(4)
The implied value for from the Nelson and Williams data is =.74.
Another study that can be used to examine relative survival, reported in Motulsky (1964, table2) examined the relative survival of over 15,000 children in the Congo in the 1950s, a time andplace where modern treatments for malaria would have been relatively scarce. The studycompared families where one parent was AS and one AA, on the one hand, to families in which
11
both parents were AA, on the other. Since half of the children in the former group were carriers,compared to none in the latter, one can back out the relative survival of AS vs. AA children. Thestudy found mortality from all causes of 24.0% among AS children vs. 27.4% among AA. Theimplied value of is .955. Part of the explanation for the different estimates in the Congo vs.West Africa may be a difference in the severity of malaria. In the Congo, the malaria ecologyindex is 12.1; in West Africa it is generally in the neighborhood of 20.
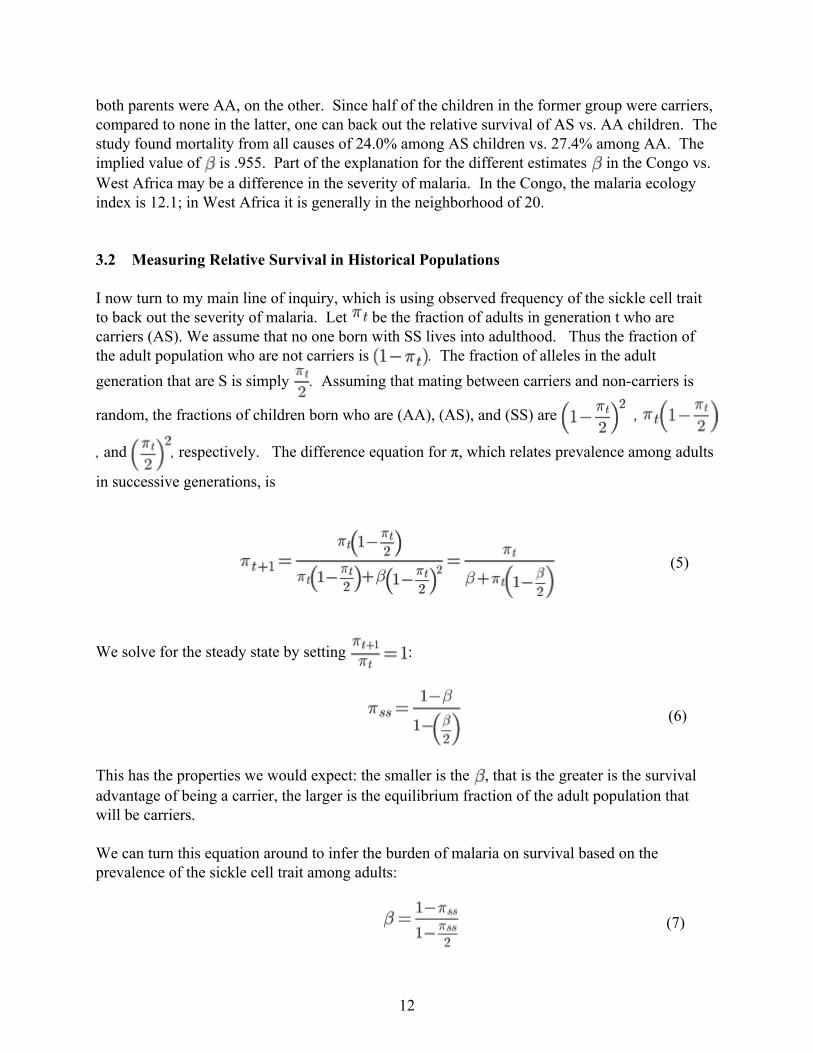
3.2 Measuring Relative Survival in Historical Populations
I now turn to my main line of inquiry, which is using observed frequency of the sickle cell traitto back out the severity of malaria. Let be the fraction of adults in generation t who arecarriers (AS). We assume that no one born with SS lives into adulthood. Thus the fraction ofthe adult population who are not carriers is . The fraction of alleles in the adultgeneration that are S is simply . Assuming that mating between carriers and non-carriers is
random, the fractions of children born who are (AA), (AS), and (SS) are ,
, and , respectively. The difference equation for π, which relates prevalence among adults
in successive generations, is
(5)
We solve for the steady state by setting :
(6)
This has the properties we would expect: the smaller is the , that is the greater is the survivaladvantage of being a carrier, the larger is the equilibrium fraction of the adult population thatwill be carriers.
We can turn this equation around to infer the burden of malaria on survival based on theprevalence of the sickle cell trait among adults:
(7)
12

This equation says that if 20% of the adult population are carriers in a steady state, then, in other words that people with the AA were only 89% as likely to live to adulthood
as those with AS.
Current vs. Historical Prevalence
The analysis above considers a population that is in equilibrium in terms of the selective impactof malaria and the prevalence of the sickle cell trait. Such a steady state presumably existed inAfrica in the period before European contact. However, the only data on sickle cell prevalenceavailable comes from observations over the last 60 years.5 One might worry that modernprevalence rates are not the same as those that held historically, because the health environmenthas been changing over time. To address this question, it is straightforward to use equation (5)to look at how prevalence changes in response to a change in relative survival (β).
As an example, I consider the case where there is initially a steady state of , andcorrespondingly . In generation 1, the value of is set to one, corresponding to thecomplete eradication of malaria, or the removal of the population to a place where the disease isnot present. Table 3 shows the fraction of the population that will be carriers of the sickle celltrait after a set number of generations.
The table shows that the initial decline is very rapid, but that there is long tailing off once theprevalence gets sufficiently low. In principle, one could use this setup to “backcast” prevalenceof the sickle cell trait by looking at populations that were removed from malarial areas at knowntimes. Of course a precise backcast would rely crucially on knowing exactly how manygenerations removed a population was removed from a malarious region, which would bepractically impossible. However such an exercise can serve as a good check on the generalreasonableness of estimates. For example, 8% of African Americans are carriers of the sicklecell trait. Suppose we take as a rough estimate that the average ancestor of today's Africanancestor of today's African Americans left Africa around 1750 -- a span of roughly 10generations. One also has to deal with the issue of admixture with other populations. Puttermanand Weil (2010, Appendix B) summarize literature on the fraction of African American heritagethat is due to non-Africans, reporting 20% as a rough consensus figure. That admixture tookplace at unknown points in time over the last three centuries, but assuming that it all took placeat the end, the prevalence of the sickle cell trait in non-admixed blood would be 10%, and thiswould be consistent with the prevalence in the source population being 20% or a bit more.Given the origins of most slaves in the United States on Africa's west coast, this is a reasonablematch with the prevalence data. Putterman and Weil give the largest source countries as Angola(15.4%), Ghana (12.0%), Senegal (10.7%), Nigeria (7.1%), Gabon (7.1%), Sierra Leone (6.8%),Guinea-Bissau (6.4%), Cameroon (5.4%), Congo (4.7%), and Gambia (4.3%).
5. Testing predates modern technology for genetic analysis. Carriers of the sickle cell gene canbe reliably diagnosed by taking a drop of blood and mixing in an agent that induces hypoxia,then examining the cells under a microscope.
13

In practice, it is not clear that this analysis of the dynamics of prevalence matters much, sincethere is little reason to believe that contact with Europeans did anything to reduce the impact ofmalaria in Africa until the second half of the twentieth century.
3.3 Measuring the Overall Burden of Malaria
The above analysis does not tell us the overall effect of malaria, for three reasons. First, theparameter only tells us the relative survival of carriers and non carriers. For example, a valueof =.80 could be consistent with =20% and =0, but it could also be consistent with
=60% and =50%. The second reason that alone does not tell us the overall burdenof malaria is that we must take into account the cost of sickle-cell disease itself. Finally, to learnabout the total burden of malaria, it is necessary to have information on probabilities of deathfrom causes other than malaria or sickle cell disease. Recall that the malaria mortality measures,
and , are the probabilities of dying of malaria if one does not die of something else.The higher is the probability of dying of something else, the lower, by necessity, is theprobability of dying of malaria.
Of these three issues, the second (the direct burden to sickle cell disease) is easily addressed bylooking at the fraction of adults who are carriers, which is the same data used to estimate .Knowing this, it is easy to figure out the fraction of children who will suffer from sickle celldisease. Assessing the other two issues requires bringing to bear additional data.
As noted above, tells us the relative survival of AS and AA children, but not the absolute ratesof survival. To get an estimate of the burden of malaria, one needs an additional piece ofinformation on , , or their ratio. One can look at modern populations for someinformation, with the caveat that modern data on survival is not necessarily informative aboutsurvival in Africa prior to European contact, where both the disease environment and the level ofmedical care differed from today. Allison (2002, Table 2) reports results from an examination of104 child malaria deaths from different countries in Africa, in which the weighted averageprevalence of the sickle cell trait was 21%. Only one child examined had the sickle cell trait,which would suggest that the trait is almost completely protective against malaria death.However, a different set of investigations (Allison 2002, Table 1) that looked at severe P.falciparum infections rather than deaths found a relative incidence of infections in AS that was46% as high that for AA. Both sets of studies just described were conducted in the 1950s or veryearly 1960s. A larger and more recent study (Hill et al., 1991) examined children in TheGambia. Children who were severely ill with malaria were compared to a control group. Theseverely ill children had cerebral malaria or severe malarial anemia. Without treatment, most ofthe children in this group would have died. Among the severe malaria group, the frequency ofthe AS phenotype was 1.2%, while among the control group it was 12.9%. This implies that therelative risk of developing severe symptoms (and presumably dying without medical care) in ASas compared to AA is 0.08.6 These two studies suggest that reasonable bounds on are
zero on the low end, and to assume that on the upper end.7
14

With estimates of and , we are in a position to look at the overall costs of malaria.There are three components to this cost: deaths from malaria among children who are carriers ofthe sickle cell trait, death from malaria among children who are not carriers, and deaths fromsickle cell disease. Table 4 shows the fractions of births that fall into each category, the deathrate for each group, and the total fraction of child deaths (from malaria or sickle cell disease) thatare due to each category. The overall fraction of children who die due to malaria and sickle celldisease is simply the sum of the three terms in the right hand column.
Table 5 does a more extensive analysis, considering different values of , the prevalence of thesickle cell trait among the adult population. I consider values ranging from zero to 40%, whichis the highest level observed among specific populations. For each row, the second columncalculates the implied value of , assuming that the prevalence represents a steady state(equation 7). The third column shows the fraction of newborn children who will die of sicklecell disease. The fourth and fifth columns show the value of , the malaria death rate fornon-carriers, under the two different assumptions about the death rate for carriers discussed
above, specifically that and that . The sixth and seventh columns show
the overall burden of mortality from both malaria and sickle cell disease, once again for the twoassumption about the death rate for carriers discussed above.
The table shows that, at least within the range of the two estimates I have available, theassumption regarding the degree of protection afforded to carriers of the sickle cell mutation isnot very important.
The fraction of the overall burden that takes the form of sickle cell disease rises with prevalence.For example, when , roughly one-tenth of the overall burden is in the form of deathsfrom sickle cell disease, with the other nine tenths due to malaria cases. When , sicklecell deaths account for roughly 20% of the burden. It is also of interest to calculate the netbenefit of the sickle cell mutation, that is, the level of mortality in the presence of the mutationrelative to the case where it is absent. The level of mortality absent the mutation can simply beread from the fourth or fifth column of the table since in this case everyone would have themortality rate of non-carriers. For example, in the case of 20% prevalence of the sickle cell trait,
6. Another study (Greenwood, Marsh, and Snow, 1991) examined children in Kenya, finding thatthe sickle cell trait was present in only 1.8% of children with severe malaria anemia but 3.9% ofchildren with uncomplicated malaria. This finding confirms that the trait is more protectiveagainst severe malaria than against mild cases. However, because no data are given on theprevalence of the trait in the overall population, one cannot back out the relative risk of AA vs.AS.7. Given a ratio of malaria mortality in the two groups, along with the equation for beta, we can
solve the for the group rates of malaria mortality. These are and
, where X is the ratio of to .
15

overall mortality due to malaria and sickle cell disease is 10%, but overall mortality due tomalaria would be 11.1% if there were no sickle cell mutation. In areas of high malaria pressure,the value of the sickle cell mutation was higher. In the worst afflicted areas, the sickle cell traitreduced malaria related mortality by 20%.
Mortality from Non-Malaria Causes
As mentioned previously, the above calculation is incomplete in that it only describes theprobability of dying of malaria conditional on not dying of something else. To know theabsolute burden of malaria, one must know the death rate from other conditions, or alternativelythe total death rate.
Systematic data on life expectancy in Africa is widely available only starting in the 1950s. Forthe period 1950-55, the United Nations estimate of life expectancy at birth in sub-SaharanAfrica is 37.8 years (United Nations, 2009). Acemoglu and Johnson (2007) date the beginningof the "international epidemiological transition," driven by more effective public healthmeasures, the discovery of new chemicals and drugs, and international interventions to 1940.Although the transition came late to Africa, it is very likely that the 1950-55 figure represents animprovement relative to previous decades. Clearly after 1955 the pace of change was rapid. TheUN estimates that life expectancy in sub-Saharan Africa rose by two years in each of thesubsequent five year periods. Further evidence that health improvements were already underwayby 1950 comes from data on total population size. Africa's population grew at a rate of 1.0% peryear between 1900 and 1950, compared to a growth rate of 0.2% per year over the previouscentury (United Nations, 1999).
Data for the period prior to 1950 are very sparse. Acemoglu and Johnson (2007, Appendix C)pull together disparate sources to present a few estimates for the period before 1950. These are,Angola in 1940: 35 (both sexes); Mozambique in 1940: 45 (both sexes); Ghana in 1948: 38(both sexes); and Mauritius, 1942-46: 32.3 (male) and 33.8 (female). Riley (2005) estimates thatprior to the "health transition" (he uses a different definition than Acemoglu and Johnson) thatbegan in Africa in the 1920s, life expectancy at birth averaged 26.4 years (this is the mean of 12estimates, which range from 22.5 to 31.0.)8 In Asia, life expectancy prior to the healthtransition, which started there between 1870 and 1890, was 27.4. In Europe the transition startedin the 1770s, and prior to it life expectancy was 34.3.
Riley comments that available estimates of African mortality prior to the health transition allcome from European colonies in Africa. There is a reasonable basis for thinking that lifeexpectancy may have been higher prior to colonization, the arrival of Arabic speaking
8. Some represntative values are Angola: 27 years in 1940; Egypt: 30-33 years in the 1930s;Ghana: 28 years in 1921;Kenya: 23.9 years in the 1930s; South African black population:38.1-40 years in 1935-40; Tunisia: 28.8 in the 1920s; Uganda: 23.9 in the 1930s; Zimbabwe:26.4 in mid 1930s.
16

merchants, and the dislocations produced by the slave trade. Unfortunately, little information forthis period are available.
Steyn (2003) examines mortality in the pre-colonial period in northern South Africa thorugh anexamination of skeletal remains. She estimates life expectancy in the period 1000-1300 AD at23.2, with the probability of surviving to age 20 being 48%. Remains for the post-1830 periodshow a slight decline in life expectancy after the expansion of European influence.
In the UN Model Life Tables for developing countries (1982), life expectancy at birth of 35(general model, for females) implies that 61.4% of girls will survive to age 20 (and only 53.0%to age 30). The majority of premature deaths are concentrated at very low ages: 22.5% of girlswould not reach age 5. Unfortunately, the model life tables that are available, to the extent thatthey reflect African data at all, certainly do not reflect the pattern of age-dependent mortality thatexisted in the period before the modern health environment of both disease and treatment was inplace. It is likely that the pattern of mortality, and in particular the ratio of deaths at differentages, differed from what is observed today, but a priori there is no basis for guess the nature ofthis difference. Allowing for the fact that life expectancy at birth was almost certainly lowerthan 35 (the lowest value available in the UN model tables), and that "childbearing age" is not asingle number but a range, a reasonable estimate for a value to use in our model is that 50% ofbirths did not reach childbearing age.
To use the above number to calculate a burden of malaria, we have to pick a specific level ofmalaria prevalence. In the model laid out above, the level of malaria morality (M) is unrelated tothe level of non-malaria mortality (P). If this is correct, then areas with higher malaria burdenswould have had lower overall survival rates. No data exist to test this assumption. Forillustration, I will consider a case where prevalence of the sickle cell mutation is 20% andassume that total mortality before adulthood is 50%. From Table 5, the value of M is 10%(taking the second to last column, for mathematical simplicity, and also including both malariaand sickle cells deaths as part of M). Thus
.5 = (1-M)(1-P) (8)
and P=0.444. To get a count of the fraction of children dying of malaria we now have to dealwith an ambiguity in the model of survival with which I started. Specifically, the model impliesthat a fraction (1-M)(1-P) of children will survive both malaria and other conditions, but it is lessclear about what those who don't survive die of.9 If malaria mortality comes before that fromother conditions, then a fraction M will die of malaria and a fraction (1-M)P will die of othercauses; if other conditions come first, then a fraction P will die of other causes and (1-P)M willdie of malaria. The truth is obviously somewhere in the middle, although malaria mortality isprobably more weighted toward the earliest part of life than other causes. For lack of any firm
9. The fraction who die is M+P-MP. This can be rewritten as M(1-P)+P(1-M)+MP, where thefirst term is children who died of malaria but would not have died otherwise, the second term ischildren who died of something else but would not have died of malaria, and the third term ischildren who died of one but would have died of the other.
17

data, I simply assume that deaths due to malaria and "other" had equal time profiles.Specifically, of the fraction MP of children who don't survive either malaria or "other," I assumethat M/(M+P) die of malaria and P/(M+P) die of something else. The total fraction of childrenwho die of malaria is thus
(9)
For the values of M and P just given, this implies that 6.4% of children would have died frommalaria, and malaria would have contributed 12.8% to pre-adult mortality.
Table 6 conducts this same calculation for the range of values of sickle cell prevalence, ,considered above. Rather than assume a constant overall pre-adult mortality rate (which wouldhave the unlikely implication that non-malaria mortality fell one-for-one with rises in malariamortality), I hold the value of P constant at the value derived above (0.444) which is what wouldhold if the pre-adult death rate were 20% when sickle cell prevalence was equal to 20%. Thetable shows that, going from an area where malaria was absent ( ) to one of reasonably highprevalence ( ), the overall pre-adult death rate rises from 44% to 50%. In the worstafflicted areas ( ), the probability of pre-adult death was 56% and fully 25% of deaths wereattributable to malaria and sickle cell disease.
3.4 Comparison to Modern Malaria Mortality Rates
The death rate from malaria derived from the historical data can be compared to modern rates.As mentioned above, for the WHO AFRO region, the under-five death rate from malaria is0.59% per year. Table 7 gives the same rate for a selection of African countries listed in the2008 World Malaria Report as facing high malaria burdens (data for 2006). Multiplying thesenumbers by five gives an approximation to the probability of dying from malaria in the first fiveyears of life, which is very close to the probability of dying from malaria before reproductiveage. Although I cannot (at this point) assign values of sickle cell prevalence ( ) to particularcountries, it appears that the malaria death rate in the pre-European contact period was abouttwice as high.
A different and somewhat cleaner way to do the comparison of historical malaria mortality tomortality today is to focus on the variable M itself, that is, the probability of dying of malariaconditional on not dying of something else. This is the measure constructed from historical dataon prevalence, and although it is not generally reported, it can be constructed from modern dataas well. Consider the case of Nigeria, which is a very heavily afflicted country. Annual malariadeaths for children under five are estimated to be 8.8 per thousand, or 0.88%. This implies thatroughly 4.4% of children will die of malaria before their fifth birthday. The life table for Nigeriafor 2006 shows that the probability of woman surviving to age 25 is approximately 0.75. Thusmaking the same assumptions about the timing of deaths from malaria and other causes as Imade above, there are two equations:
.75 = (1-M)(1-P) (10)
18

(11)
Solving these yields M =.054. Measured this way -- as the probability of dying of malariaconditional on not dying of something else -- the burden of malaria is far lower in Nigeria todaythan it was in countries with a sickle cell prevalence of 20% in the historical period. The impliedvalue of P is 0.207. If we assume that Nigeria has a sickle cell prevalence of 20%, the impliedvalues of M and P for the historical period were .10 and .444, respectively. Thus the probabilityof death from other causes has fallen slightly more than the probability of death from malaria,although the magnitudes of the two declines are close. Certainly, given the uncertainty in somany aspects of measurement, one cannot reject the possibility that the percentage decline inmalaria mortality has been the same as the decline in other types of mortality.
4. Assessing the Importance of Malaria to Early African Development
Now that I have an estimate of how large a burden malaria imposed in terms of survival, I canturn to the question of whether malaria had a significant impact on African development. Idivide my discussion into two parts, looking first at the effects of malaria deaths (mortality) andthen at the effects of ill health among those who survive the disease (morbidity).
4.1 Direct Effect of Malaria Mortality
Current analyses of the burden of disease focus on measures such as years of life lost ordisability free life years lost. From this perspective, the death of a young child is particularlycostly because he or she had so many potential life years. The ethical considerations regardingthe allocation of scarce lifesaving resources, and implicitly the cost of death and diseaseexperienced at different ages, are quite complex (see Persad, Werthheimer, and Emanuael,2009). In assessing the role that disease played in affecting development historically, however, itseems reasonable to take a purely instrumental view of life and health, in which the primaryconsiderations are how much society has invested in an individual and that individual's potentialto produce services for society in the future. Under this sort of view, the most costly death is thatof a young adult, who has consumed a good deal of resources (food, childcare, education), andwho has many years of potentially productive labor. The death of an infant or small child, bycontrast, is far less costly, because fewer resources have been invested; and the death of an oldperson is similarly less costly because less productive potential is lost. Under this interpretation,malaria deaths are relatively low cost, with the exception of deaths of women in their firstpregnancies, who are near the peak of their value as assets to society in terms of the balancebetween resources invested in them and services they can deliver.
To formalize this idea, consider a simple model of production and consumption with individualsof different ages. Let be the consumption of an individual of age i, and similarly be laborincome. For now, I ignore income from non labor sources, and assume that there is no storage of
19

output between period. Let by the number of people in age group i. The social budgetconstraint is
where T is the maximum lifespan. I assume that consumption at each age is determined by twothings: a consumption level of individuals at some benchmark age (for example, prime ageadults), which I call , and some age-varying relative consumption coefficient .
The values of presumably reflect both changing biological needs for consumption over thecourse of the life cycle as well as the arrangements by which consumption is divided up amongdifferent groups in society. One would not necessarily expect the pattern of consumption to thesame in all societies at all times. However, as seen below, available data do not vary all thatmuch.
I assume that wages at each age group are determined in a similar fashion:
where is the return to some standard unit of labor. Again, the pattern of relative labor inputacross age groups reflects both biological differences and differences among societies in theeconomic value of different characterisics (for example, strength vs. wisdom vs. manualdexterity).
Combining the above equations, we can solve for the consumption level of the benchmark agegroup as a function of the age structure of the population as well as the relative wage andconsumption weights.
Consumption and Income profiles
A number of sources provide data on the life cycle profiles of consumption and labor input.Mueller (1976) synthesizes data from nine societies pracitcing what she calls "peasantagriculture," by which she means agricultural systems which use primarily traditional methods ofcultivation, small landholdings, and low capital inputs. South and Southeast Asia are primarily
20

what she has in mind. The profiles are shown in Figure 7. Note that Mueller's data on laborinput apply to production of output as it would appear in measured GDP but exclude homeproduction. Much of the latter is done by women, so in her data, productivity by prime agewomen is only 30% of the level of similarly aged males. Because I am interested in both sorts ofoutput, I focus on the male profiles. For consumption, Mueller provides two profiles in whichconsumption of people at each age (and of each gender) is compared to males aged 20-54. Forthe medium consumptio nprofile, children age 0-4 have a value of 0.32; for thelow consumptionprofile, the value is 0.12 (prime aged women get a value of 0.80). I use the medium profile.
Figure 8 shows data that are an average of four contemporary hunter-gatherer populations. Thevalues are constructed by Lee and Mason (2009), based on data from Kaplan (1994) and Howell(in press). The underlying data are in terms of calories collected and consumed. Finally, Figure9 shows data from Lee and Mason for the four poorest countries that are part of the NationalTransfer Account project: Kenya, Philippines, Indonesia, and India. Income in this case is laborincome, including unpaid family labor, and pertains to both men and women.
The three figures are relatively similar in the patterns they display, with the biggest differencebeing the decline in income of the elderly among the poor country group that is not present in theother two groups. Given the similarity of the figures, it seems reasonable to assume that the ageprofiles for the pre-industrial societies I want to consider had similar shape. In the calculationsthat follow, I use the profile from Mueller.
Population Age Structure
The other piece of data used in the equation above is , the number of people in each agegroup. In general, this will be a function of both the probability of survival to each age and thehistory of births or population growth. However, for the long historical periods that I amconsidering, population growth must have been very close to zero, which implies a constantnumber of births per year. We can thus approximate the age structure of the population ( )with the fraction of survivors at each age from the life table.
My approach to assessing the role of disease in affecting consumption possibilities is to startwith a baseline life table and then consider alternations that would result from eliminating oradding particular sources of mortality. To construct these alternative life tables, I useinformation on the age of death from different diseases. As my baseline, I use the UnitedNations (1982) model life table for a population with life expectancy at birth of 35 years (maleand female combined).
This model can be used to analyze the cost, in terms of consumption, of deaths at different ages.Consider an increase in age specific mortality of an amount x at age s, with no change in agespecific morality at other ages. I consider steady state population age distributions, so that thechange in mortality at age s will affect the number of survivors at all higher ages. The level ofconsumption in the new steady state will be
21
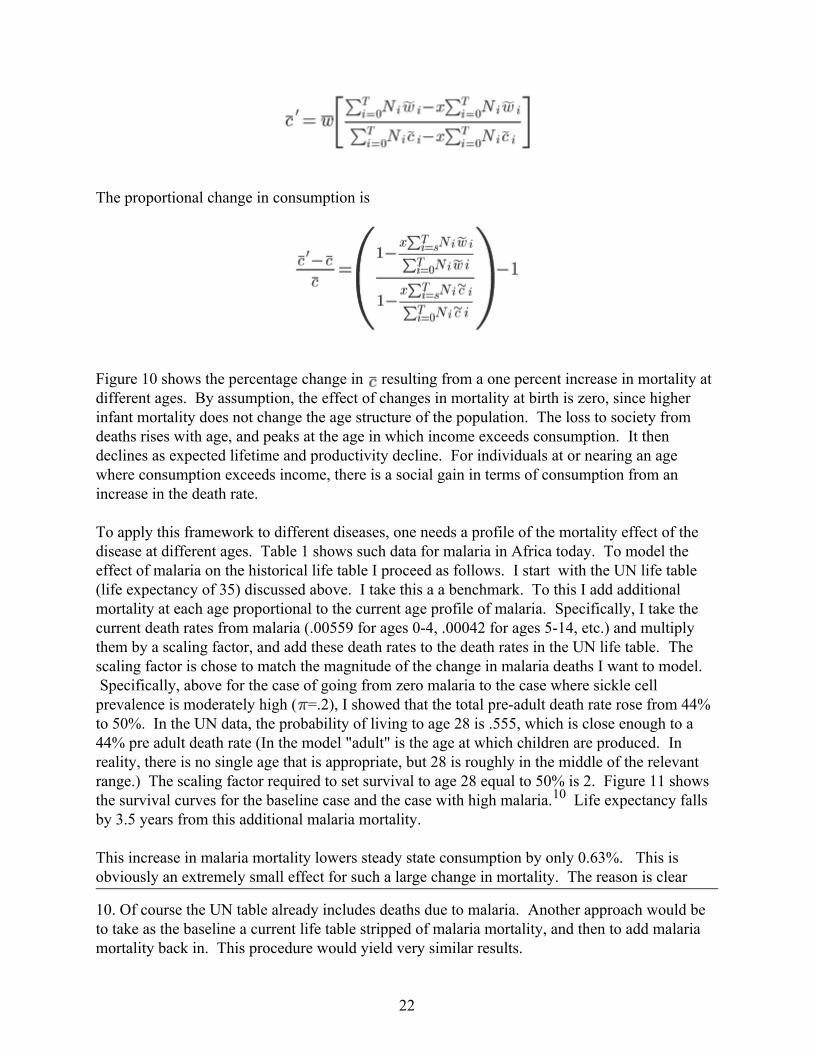
The proportional change in consumption is
Figure 10 shows the percentage change in resulting from a one percent increase in mortality atdifferent ages. By assumption, the effect of changes in mortality at birth is zero, since higherinfant mortality does not change the age structure of the population. The loss to society fromdeaths rises with age, and peaks at the age in which income exceeds consumption. It thendeclines as expected lifetime and productivity decline. For individuals at or nearing an agewhere consumption exceeds income, there is a social gain in terms of consumption from anincrease in the death rate.
To apply this framework to different diseases, one needs a profile of the mortality effect of thedisease at different ages. Table 1 shows such data for malaria in Africa today. To model theeffect of malaria on the historical life table I proceed as follows. I start with the UN life table(life expectancy of 35) discussed above. I take this a a benchmark. To this I add additionalmortality at each age proportional to the current age profile of malaria. Specifically, I take thecurrent death rates from malaria (.00559 for ages 0-4, .00042 for ages 5-14, etc.) and multiplythem by a scaling factor, and add these death rates to the death rates in the UN life table. Thescaling factor is chose to match the magnitude of the change in malaria deaths I want to model.Specifically, above for the case of going from zero malaria to the case where sickle cellprevalence is moderately high ( =.2), I showed that the total pre-adult death rate rose from 44%to 50%. In the UN data, the probability of living to age 28 is .555, which is close enough to a44% pre adult death rate (In the model "adult" is the age at which children are produced. Inreality, there is no single age that is appropriate, but 28 is roughly in the middle of the relevantrange.) The scaling factor required to set survival to age 28 equal to 50% is 2. Figure 11 showsthe survival curves for the baseline case and the case with high malaria.10 Life expectancy fallsby 3.5 years from this additional malaria mortality.
This increase in malaria mortality lowers steady state consumption by only 0.63%. This isobviously an extremely small effect for such a large change in mortality. The reason is clear
10. Of course the UN table already includes deaths due to malaria. Another approach would beto take as the baseline a current life table stripped of malaria mortality, and then to add malariamortality back in. This procedure would yield very similar results.
22

once one has seen Figure 10 and noted that malaria deaths are concentrated at very low ages. Inthis calculation, deaths beyond age five account for only 1/3 of the reduction in life expectancydue to malaria, but for 2/3 of the economic cost of the disease.
The procedure above can be applied to any disease or other cause of death. For a comparison tomalaria, I look at smallpox, another one of the most important diseases in shaping humandevelopment. Smallpox is a virus spread from person to person by direct contact, aeresoldroplets, or contact with infected objects.The case fatality rate for the disease in the absence of modern treatments is roughly 25-30%,with many survivors left scarred and some blinded.11 In areas of high population density thedisease was always present, so that cases were concentrated among the young, although eventhese locations (that is, big cities) were nonetheless subject to periodic epidemics. Areas oflower population desnsity, which could not support the disease in its endemic form, were moresusceptible to periodic epidemics in which a large population of individuals without anyimmunity were stricken.
Smallpox had appeared in China, India, and Egypt well before the birth of Christ, and wasdefinitely established in Europe by the end of the sixth century. Climate and low populationdensity in Africa were not as conducive to the spread of the disease. Smallpox was not endemicto Africa south of the Sahara (with the exception of Ethiopia) prior to the beginning of thesecond millennium. The disease was spread by Portuguese traders along the west coast of thecontinent in the sixteenth and seventeenth centuries, and by Arab traders on the East coast in the16th century (Hopkins, 2002).
Unlike malaria, there is no genetic fingerprint that one can look to in order to gauge the mortalitypressure of smallpox. Information from various sources makes it clear that the disease was animportant killer, however. In London and Geneva from 1580-1780, smallpox deaths averagedroughly 6% of total deaths (Hopkins, 2002, figure 5). According to the World HealthOrganization, in the 18th century smallpox killed every tenth child born in Sweden and Franceand every seventh child born in Russia.12Behbehani (1983 ) reports estimates that at the end ofthe 18th century, smallpox was killing 400,000 Europeans per year. Maddison (2006) gives thetotal population of Europe (Western and Eastern) plus European Russia as 241 million in 1820,slightly after the end of the 18th century. This implies a death rate of 0.17% of the populationevery year; with a life extancy of 40 years, this would imply a roughly 6.6% chance of dyingfrom smallpox on a lifetime basis.13
There is also useful information on the age of death of smallpox victims [to be added]
The above analysis shows that, at least in terms of the extra costs associated with raising children
11. This case fatality rate applies to variola major. The case fatality rate for variola minor isless than one percent. Infection with either form provides lifelong protection against both.12. http://www.who.int/mediacentre/factsheets/smallpox/en/13. However, it is not clear that the European figure also includes Russia. If it does note, thedeath rate would be higher.
23
who were subsequently going to die of malaria, the effect of the disease on the standard of livingin Africa should have been relatively low. However, it is possible that there are other channelsthrough which high malaria mortality may have mattered. Death from disease may impose anobstacle to economic development beyond the instrumental cost discussed here. Stone (1977)argues that in the face of high child mortality, pre-modern Europeans avoided forming emotionalbonds with their young children, even to the point of giving the same name to two livingchildren, expecting only one to survive. In such an environment, one might also expect to seeless investment of tangible resources in the human capital (both health and education) of theirchildren. Thus even if high child mortality from malaria were not important in the strict sense ofdraining resources from the economy, it might have contributed to reduced investment inchildren. Several recent theories of economic growth have stressed the importance of suchinvestments to long-term development.
The Malthusian Perspective
The analysis above takes the perspective that deaths are costly in social terms, since theyrepresent the loss of potential productive workers. An alternative view points to a flip side ofdeaths, which is that they decrease the size of population and thus lower pressure on fixedresources.
Consider a simple Malthusian model, as represented in the two panels of figure 12. In bothpanels, the horizontal axis measures the standard of living. In a modern economy, this would beGDP per capita, but the model should be applicable even in contexts where there are no marketsor prices with which to measure GDP. In the top panel, the vertical axis measures the size of thepopulation. The downward sloping line in the panel represents the effect of higher populationsize in reducing living standards through the crowding of fixed resources such as land. Thiscrowding could take the form of shorter fallow periods, higher pressure on grazing land, orincreased levels of animal disease, all of which would reduce per-capita yields.
The bottom panel shows the relationship between the growth rate of population and the standardof living. I assume that there is an upward sloping relationship between these. In the classicalMalthusian model, this positive relationship comes from either the "preventive check" (reduceddesired fertility) or the "positive check" (higher mortality or lower fecundity) when income islow. Another mechanism that will produce very similar dynamics is if higher population densityraises the mortality rate by facilitating the transmission of disease. In the panel, this upwardsloping line is drawn twice, at a higher level to represent a place where the health environment isgood, and at a lower level to represent a place where the health environment is bad. For a givenstandard of living, population growth will be higher in a healthier environment. In either case,the equilibrium of the system is reached at the level of population which implies a standard ofliving that in turn implies zero population growth.
One of the defining characteristics of the Malthusian model is that it produces a steady state inwhich, as long as the quantity of land is constant the the production technology is fixed, thegrowth rate of population is zero and the population size is constant (or, more realistically, the
24

population size and standard of living are mean reverting in response to stochastic shocks). Thenear constancy of human populations over long historical eras suggests that such a mechanismmust have been operating in most places for most of human history (Galor and Weil, 2000).Although there are clearly times when Malthusian constraints were lifted (such as the peoplingof the Americas in pre-historic times), a simple analysis of the effect of compounding shows thatmost of the time, average population growth rates must have been quite close to zero. Without ahomeostatic model of the Malthusian sort, it is vanishingly unlikely that such near constancy ofpopulation would obtain.
As the figure shows, a worse health environment leads to lower population and a higher standardof living in equilibrium. Thus malaria would have actually raised the standard of living inAfrica. While counterintuitive, this conclusion is in line with the arguments in several recentanalyses of growth. Voightlander and Voth (2009) argue that in Europe before the industrialrevolution, income rose as a result of increased mortality due to plague, urbanization, andwarfare, and that this rise in income was instrumental in knocking the continent onto the path ofindustrialization. Acemoglu and Johnson, in their analysis of the worldwide epidemiologicaltransition of the mid 20th century, find that countries that experienced greater increases in lifeexpectancy saw slower growth in income per capita -- a result that they attribute to theMalthusian effect of population growth. And Young (2005) claims that higher mortality andlower fertility due to HIV in South Africa will more than compensate for declines in workerproductivity due to the disease, so that income per capita will actually rise as a result of theepidemic. Ashraf, Lester, and Weil (2008) examine the Malthusian channel as part of a broaderanalysis of how health improvements affect growth. They find that higher survival indeedpushes income lower through the Malthusian channel (as well as through capital dilution),although this effect is more than compensated for in the long run by higher labor productivitydue to better health.
Whether this sort of Malthusian model applies to Africa in the period before European contact isunclear. Several authors stress that land shortage was not generally a problem in Africa. Forexample, Herbst (2000) argues that the abundant land was a persistent characteristic of Africaneconomies, as a result of which it was the control of people, rather than territory, that was ofprimary interest to rulers.
However, historians are often too quick to dismiss the Malthusian model without having anotherexplanation for the near constancy of population over time. It is conceivable that, rather thanland being the binding resource, the role of equilibrating population size was played by density-dependent disease. This would be consistent with the often-expressed view that labor, ratherthan land, was the binding constraint faced by African economies. If so, the pressure fromdisease must have been extraordinarily high indeed, however, since human capacity to reproduceis very high. The levels of malaria indicated by the prevalence of the sickle cell trait would notbe sufficient to hold down population growth in the absence of a land constraint, although it ispossible that malaria in combination with other diseases did so.
It is also possible that malaria did indeed raise the standard of living in the short run by reducingpopulation density, but at the same time low population density (due both to malaria and low
25

agricultural productivity) prevented the development of large agglomerations which in otherplaces were the locus of specialization, gains from trade, and technological advance.
4.2 Economic Effects of Malaria Morbidity
To pursue the question of how much malaria affects labor input of adults, I use data from theWorld Health Organization on Years Lost to Disability (YLDs) from particular diseases. Acountry’s YLD for a given disease is constructed as:
(12)
where I is the number of incident (newly-arising) cases in a period, DW is the disability weightattached to the disease, and L is the average duration of the disease until remission or death. Thecrucial parameter here is the disability weight, which is intended to be a cardinal measure of theseverity of different diseases or impairments, on a scale from 0, indicating perfect health, to 1,indicating death. Disability weights are constructed by panels of healthcare providers andmedical experts using a "person trade-off" protocol which establishes utility equivalencesbetween years of life lived in different states of health. One year lived with a disability providesthe same utility as (1-DW) years lived disability-free (Murray, 1996)). Disability weights aretherefore not primarily intended as a measure of labor supply. Nevertheless, these estimatesprovide at least some basis for comparing the effects of different diseases.14
To give an example of the interpretation of YLD: in the data below, the average YLD from allcauses for Africa is 0.12. This means that in the average year, the average man suffers diseaseepisodes that deprive him of the equivalent of 12% of a year's disability free life. This couldmean being fully disabled for 12% of the year, 50% disabled for 24% of the year, and so on. Itcould also mean suffering an incident that leaves him, say, 1% disabled for the next 12 years.
Table 8 shows the YLDs by disease type and age (for males) for the WHO's AFRO region.YLDs are counted at the age in which a disease incident occurs. Thus, for example, theneurological sequelae of malaria are counted as years lost to disability in the age 0-4 age group,even thought the actual years lost are spread through the individual's whole life. (Note that the"total" column is based on the distribution of the current population among age groups. Thusdisabilities affecting the elderly, who are a very small percentage of the current Africanpopulation, play a very minor role in determining the total figure.)
The table shows that overall, malaria accounts for only 5% of total years lost to disability.Further, almost all of these lost years were due to incidents in the first five years of life. Someof the years lost to disability in this case affected adults, through the neurological sequelae of thedisease, but much of the disability burden fell directly on children. Although disability (which in
14. Some examples of disability weights are blindness (0.600), deafness (0.216), HIV (0.136),AIDS (0.505), tuberculosis sero-negative for HIV (0.264), severe iron-deficiency anemia(0.093), malaria episodes (0.172) and neurological sequelae of malaria (0.473).
26

this case really just measures suffering) among children does not directly affect production, onecould argue that it might have affected their accumulation of skills or human capital. In anycase, however, the malaria burden is relatively small in comparison to that of other diseases.
As mentioned above, another potential channel through which malaria might have affectedeconomic economic development is through shifting population away from potentiallyproductive areas. Gallup and Sachs give examples of this occurring in Europe. In the context ofAfrica, I do not know of evidence that particular regions were not settled because of malaria, andthere is certainly evidence of people settling in areas of tremendously high malaria transmission.Given that malaria deaths were concentrated among the very young, and that mortality in thisgroup was very high from other causes in any case, it is hard to see how malaria would have hada great influence on settlement patterns.
Again, it is useful to compare the morbidity burden of malaria to other conditions. In the case ofsmallpox, the adult incidence of the disease was certainly lower than that of malaria, since after asingle case (most often contracted as a child) individuals were immune for life. However, thephysical damage done by smallpox could be severe. A commonly quoted estimate is that one-third of blindness in 18th century Europe was due to smallpox. If I had better data I couldconvert this into an actual estimate of the disability burden.
5. Conclusion
In this paper I set out to assess the role that malaria played in affecting African development inthe period before Africans and Europeans came into contact. The largest contribution of thepaper is in assessing the health burden that malaria placed on Africans some 500 years ago. Iused data on the modern prevalence of the sickle cell mutation to estimate the intensity ofmalaria historically. In areas of high malaria transmission, 20% of the population carry thesickle cell trait. My estimate is that this implies that historically between 10 and 11 percent ofchildren died from malaria or sickle cell disease before reaching adulthood. Such a death rate isroughly twice the current burden of malaria in such regions. Comparing the most affected toleast affected areas, malaria may have been responsible for a ten percentage point difference inthe proability of surviving to adulthood. In terms of its burden relative to other causes ofmortality, malaria appears to have been perhaps slightly less important historically than it istoday, although I certainly can't rule out the decline in malaria mortality has been proportional tothe decline in mortality from other diseases.
Thus, malaria imposed a heavy mortality burden. Did it hold back economic development? Asa starting point, it is worth noting that many of the areas with highest malaria ecology andhighest prevalence of the sickle cell trait, most notably coastal West Africa, also had the highestlevels of economic development by the various measures discussed in Section 1 of this paper.Obviously the lack of correlation between malaria and low development is not firm evidence fora lack of a causal link. Those parts of Africa could have been well developed for other reasons,and were it not for malaria might have been more developed still. Nonetheless, simply looking
27

at the locations of development and malaria suggests that malaria was not an insuperableobstacle to economic development within Africa.
My more detailed examination of the possible channels through which malaria might haveaffected economic outcomes also does not point to a strong role of the disease in holding backeconomic development. Malaria mortality occurs at very young ages, which implies a low socialcost. In a Malthusian model, higher child mortality could even raise the standard of living. Themorbidity burden of malaria on adults is low relative to other diseases. The fact that malariabulked so large in the view of foreigners may be attributable to their lack of immunity, whichAfricans acquired as children.
28
References
Acemoglu, Daron, and Simon Johnson, "Disease and Development: The Effect of LifeExpectancy on Economic Growth," Journal of Political Economy 115, pp. 925-985, December2007.
Akyeampong, Emmanuel Kwaku, "Disease in West African History" in Emmanuel KwakuAkyeampong, ed., Themes in West Africa's History, Athens, OH: Ohio University Press, 2006.
Ashraf, Quamrul, Ashley Lester, and David N. Weil, “When Does Improving Health RaiseGDP?” NBER Macroeconomics Annual 2008.
Bairoch, Paul, Cities and Economic Development from the Dawn of History to the PresentTranslated by Christopher Braider, Chicago: University of Chicago Press, 1988.
Behbehani, Abbas, "The Smallpox Story: Life and Death of an Old Disease," MicrobiologicalReviews Dec. 1983, p. 455-509 Vol. 47. No. 4
Chanda, Areendam, and Louis Putterman, “Early Starts, Reversals and Catch-up in the Processof Economic Development,” Scandinavian Journal of Economics 109 (2007), 387-413.
Chandler, Tertius, Four Thousand Years of Urban Growth: A historical Census Edward Mellen,1987.
Chenny, Shirley, Pascal St-Amour, and Desire Vencatachellum: “Slave prices fromsuccession and bankruptcy sales in Mauritius, 1825–1827” in Explorations in EconomicHistory 40 (2003) 419–442
Comin, Diego, William Easterly, and Erick Gong, “Was the Wealth of Nations determined in1000 BC?” American Economic Journal -- Macro (forthcoming 2010)
Diamond, Jared, Guns, Germs, and Steel: The Fates of Human Societies, New York: W. W.Norton and Co., 1997.
Gallup, John Luke, and Jeffrey D. Sachs, "The Economic Burden of Malaria," Amercian Journalof Tropical Medicine and Hygeine, 64 (1, supplement), pp. 85-96, 2001.
Gallup, John Luke, Jeffrey D. Sachs, and Andrew Mellinger, "Geography and EconomicDevelopment," International Regional Science Review 22 (2), 179-232 1999.
Galor, Oded, and David N. Weil, "Population, Technology, and Growth: From MalthusianStagnation to the Demographic Transition and Beyond," American Economic Review 90,
29

806-828 (September 2000).
Greenwood, B., K. Marsh, and R. Snow, "Why do some African children develop severemalaria?" Parasitology Today 1991 Oct; 7(10):277-81.
Hill, Adrian V.S. et al., "Common West Africa HLA antigens are associated with protectionfrom severe malaria," Nature volume 352, August, 1991, pp. 595-600.
Hopkins, A. G., An Economic History of West Africa New York: Columbia University Press,1973.
Hopkins, Donald R., The Greatest Killer: Smallpox in History, second edition, Chicago:University of Chicago Press, 2002.
Kiszewski, Anthony, Andrew Mellinger, Andrew Spielman, Pia Malaney, Jeffrey Sachs, andSonia Ehrlich Sachs, "A Global Index of the Stability of Malaria Transmission," AmericanJournal of Tropical Medicine and Hygiene, Vol. 70, No. 5, pp. 486-498, May 2004.
Lee, Ronald D. and Andrew Mason, "Generational Economics in a Changing World," mimeo, 2010.
Mabogunje, Akin L. and Paul Richards, "The land and peoples of West Africa" in Ajayi, J.F.A.and Michael Crowder, eds. History of West Africa, volume 1, 3rd edition, 1985.
Maddison, Angus, The World Economy: A Millennial Perspective OECD, 2006
Masters, William A., and Margaret McMillan, 2001, "Climate and Scale in Economic Growth,"Journal of Economic Growth 6(3), pages 167-86, September.
McNeill, William, Plagues and Peoples, New York: Anchor Books, 1977.
Motulsky, Arno, "Hereditary Red Cell Traits and Malaria," Am. J. Trop. Med. Hyg., 13 (Part 1),1964, pp. 147-158
Murray, Chrisopher J. D., and Alan D. Lopez, The Global Burden of Disease: A ComprehensiveAssessment of Mortality and Disability from Diseases, Injuries and Risk Factors in 1990 andProjected to 2020, Cambridge, MA: Harvard University Press, 1996.
Nelson, Kennard, and Carolyn M. Williams, Infectious Disease Epidemiology: Theory andPractice second edition, 2006, Jones & Bartlett Publishers.
Persad, Govind, Alan Wertheimer, and Ezekiel J. Emanuel, "Principles for allocation of scarcemedical intervetions," The Lancet 2009; 373: 423-31.
30

Putterman, Louis, and David N. Weil, "Post-1500 Population Flows and the Long RunDeterminants of Economic Growth and Inequality," Quarterly Journal of Economics,forthcoming 2010.
Riley, James C., "Estimates of Regional and Global Life Expectancy, 1800-2001," Populationand Development Review 31(3), September, 2005, 537-543.
Steyn, Maryna, "A Comparison between Pre- and Post-Colonial Health in the Northern Parts ofSouth Africa, a Preliminary Study," World Archaeology, Vol. 35:2, Archaeology of Epidemicand Infectious Disease (Oct., 2003), pp. 276-288
Stone, Lawrence, The Family, Sex and Marriage in England, 1500-1800, 1977.
United Nations, Department of Economic and Social Affairs, Population Division, WorldPopulation Prospects: The 2008 Revision, New York, 2009 (advanced Excel tables).
United Nations, Department of Economic and Social Affairs, Population Division, The World atSix Billion New York, 1999.
United Nations, Department of Economic and Social Affairs, Population Division, (1982). ModelLife Tables for Developing Countries
Voigtlander, Nicola, and Joachim Voth, "The Three Horsemen of Riches: Plague, War andUrbanization in Early Modern Europe," mimeo, UCLA, 2009.
Webb, James L. A., "Ecology and Culture in West Africa" in Emmanuel Kwaku Akyeampong,ed., Themes in West Africa's History, Athens, OH: Ohio University Press, 2006.
Webb, James L. A., Humanity's Burden: A Global History of Malaria Cambridge, UK:Cambridge University Press, 2008.
Weil, David N., “Endemic Diseases and African Economic Growth: Challenges and PolicyResponses,” Journal of African Economies forthcoming 2010.
World Health Organization, Global Burden of Disease 2004.
31

Appendix Table: Underlying Data on Development and Malaria Ecology
Key: S1500n5 = state antiquity index from Chanda and Putterman (2007) a3, c3, t3, mt3, andmw3 are the sub indices for agriculture, communications, transportation, military, and industry,from Comin, Easterly, and Gong (2010). tr3 is their composite index.
32

33

34

35

36

37

Table 1: Malaria Episodes
Age Incidence(per 100,000)
Prevalence(per 100,000)
Average Duration(years)
Death Rate(per 100,000)
0-4 120,000 1,644 0.01 5595-14 17,500 240 0.01 4215-44 17,500 240 0.01 3345-59 17,500 240 0.01 36
Table 2: Malaria -- Neurological Sequelae
Age Incidence(per 100,000)
Prevalence(per 100,000)
Average Duration(years)
Death Rate(per 100,000)
0-4 164 365 37.1 05-14 0 701 -- --15-44 0 617 -- --45-59 0 474 -- --
Source: Murray and Lopez (1996)
38

Table 3: Change Over Time in Fraction of the Adult Population who are Carriers
Generation Fraction Carriers0 .201 .1812 .1663 .1535 .13310 .10015 .08020 .06625 .05730 .050
39
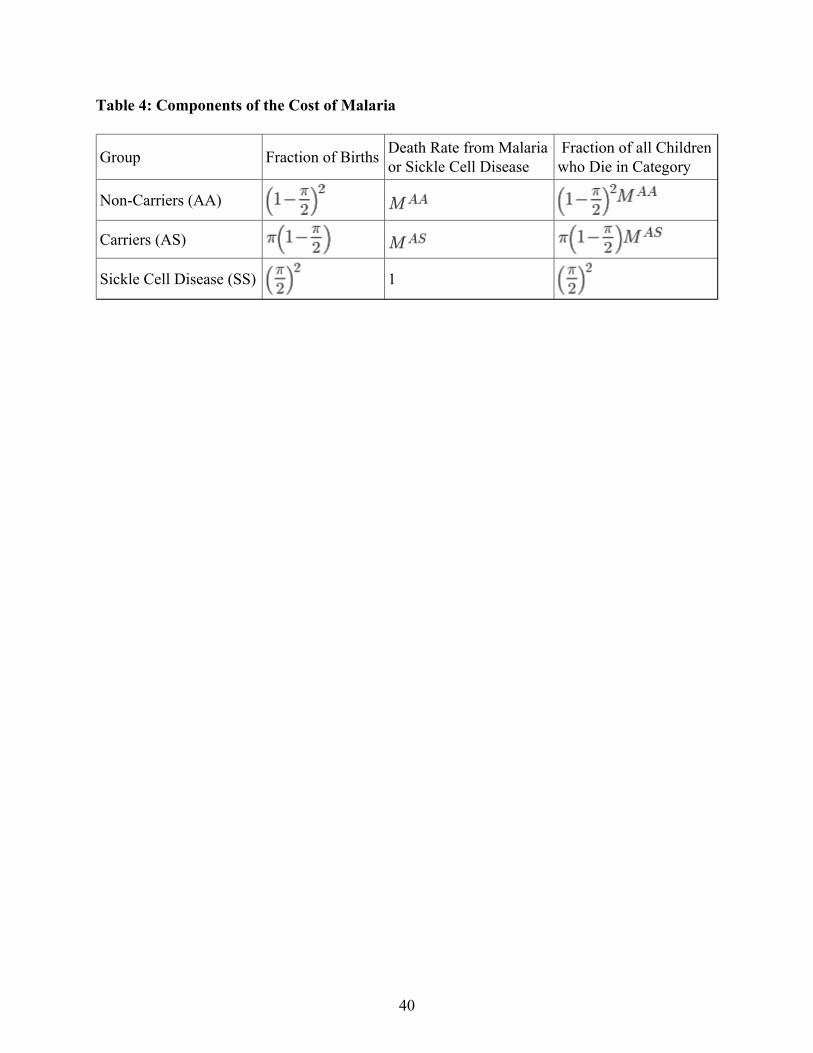
Table 4: Components of the Cost of Malaria
Group Fraction of Births Death Rate from Malariaor Sickle Cell Disease
Fraction of all Childrenwho Die in Category
Non-Carriers (AA)
Carriers (AS)
Sickle Cell Disease (SS) 1
40

Table 5: Implications of Varying Sickle Cell Prevalence for Total Malaria Burden
FractionDying ofSickle CellDisease
assumingthat
assumingthat
OverallMalaria andSC Burdenassuming
OverallMalaria andSC Burdenassuming
0 1 0 0 0 0 00.05 0.974359 0.000625 0.025641 0.027809 0.025 0.02720.1 0.947368 0.0025 0.052632 0.056948 0.05 0.0543
0.15 0.918919 0.005625 0.081081 0.087515 0.075 0.08150.2 0.888889 0.01 0.111111 0.119617 0.1 0.1086
0.25 0.857143 0.015625 0.142857 0.153374 0.125 0.13570.3 0.823529 0.0225 0.176471 0.188917 0.15 0.1628
0.35 0.787879 0.030625 0.212121 0.226391 0.175 0.18990.4 0.75 0.04 0.25 0.265957 0.2 0.2170
41

Table 6:
MProbability ofDying of Malariaor SC
Total DeathRate (pre-adult)
Malaria and SCDeaths asFraction of Total
0 1.000 0.000 0.000 0.444 0.0000.05 .974 0.025 0.014 0.458 0.0320.10 .947 0.050 0.030 0.472 0.0640.15 .919 0.075 0.047 0.486 0.0960.20 .889 0.100 0.064 0.500 0.1280.25 .857 0.125 0.082 0.514 0.1590.30 .824 0.150 0.100 0.527 0.1900.35 .788 0.175 0.119 0.541 0.2200.40 .750 0.200 0.139 0.555 0.250
42
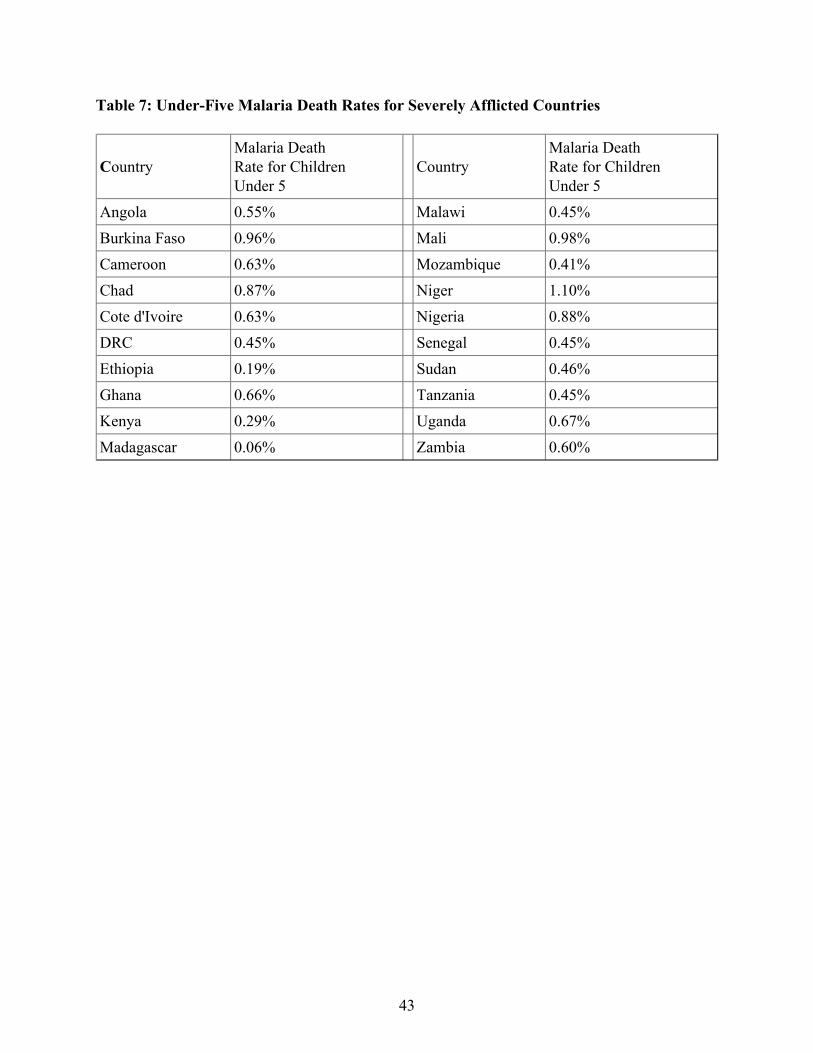
Table 7: Under-Five Malaria Death Rates for Severely Afflicted Countries
CountryMalaria DeathRate for ChildrenUnder 5
CountryMalaria DeathRate for ChildrenUnder 5
Angola 0.55% Malawi 0.45%Burkina Faso 0.96% Mali 0.98%Cameroon 0.63% Mozambique 0.41%Chad 0.87% Niger 1.10%Cote d'Ivoire 0.63% Nigeria 0.88%DRC 0.45% Senegal 0.45%Ethiopia 0.19% Sudan 0.46%Ghana 0.66% Tanzania 0.45%Kenya 0.29% Uganda 0.67%Madagascar 0.06% Zambia 0.60%
43
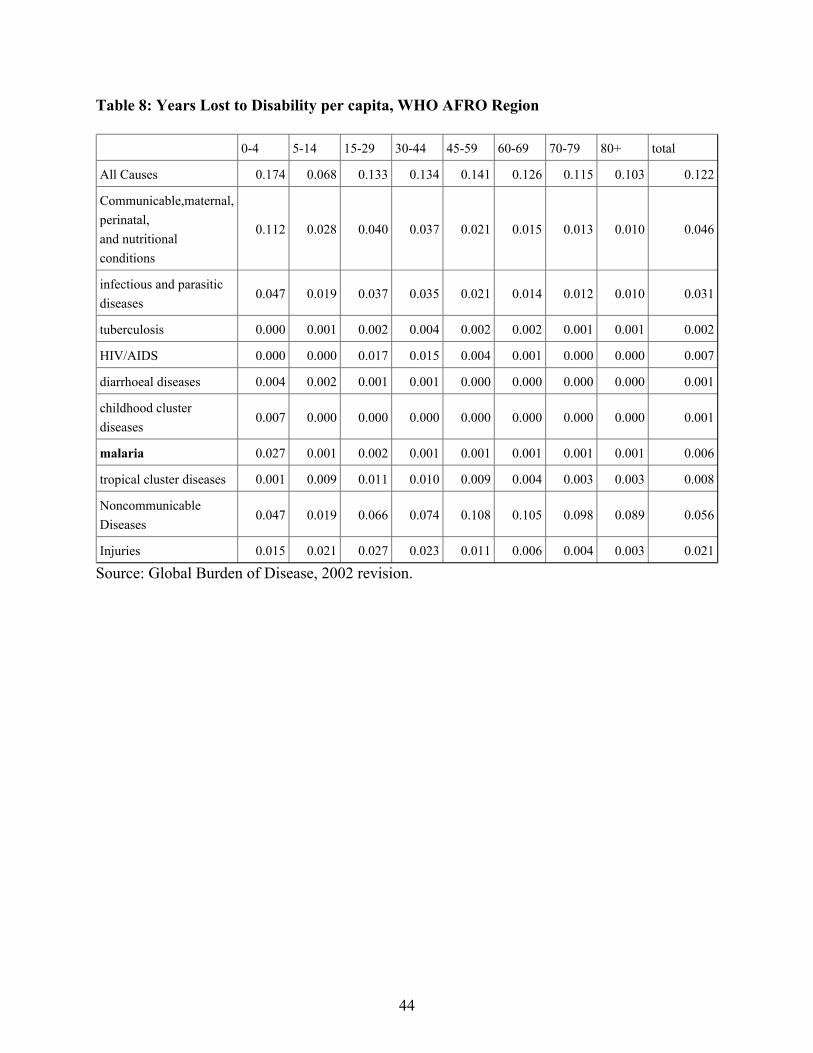
Table 8: Years Lost to Disability per capita, WHO AFRO Region
0-4 5-14 15-29 30-44 45-59 60-69 70-79 80+ total
All Causes 0.174 0.068 0.133 0.134 0.141 0.126 0.115 0.103 0.122
Communicable,maternal,perinatal,and nutritionalconditions
0.112 0.028 0.040 0.037 0.021 0.015 0.013 0.010 0.046
infectious and parasiticdiseases
0.047 0.019 0.037 0.035 0.021 0.014 0.012 0.010 0.031
tuberculosis 0.000 0.001 0.002 0.004 0.002 0.002 0.001 0.001 0.002
HIV/AIDS 0.000 0.000 0.017 0.015 0.004 0.001 0.000 0.000 0.007
diarrhoeal diseases 0.004 0.002 0.001 0.001 0.000 0.000 0.000 0.000 0.001
childhood clusterdiseases
0.007 0.000 0.000 0.000 0.000 0.000 0.000 0.000 0.001
malaria 0.027 0.001 0.002 0.001 0.001 0.001 0.001 0.001 0.006
tropical cluster diseases 0.001 0.009 0.011 0.010 0.009 0.004 0.003 0.003 0.008
NoncommunicableDiseases
0.047 0.019 0.066 0.074 0.108 0.105 0.098 0.089 0.056
Injuries 0.015 0.021 0.027 0.023 0.011 0.006 0.004 0.003 0.021
Source: Global Burden of Disease, 2002 revision.
44

45
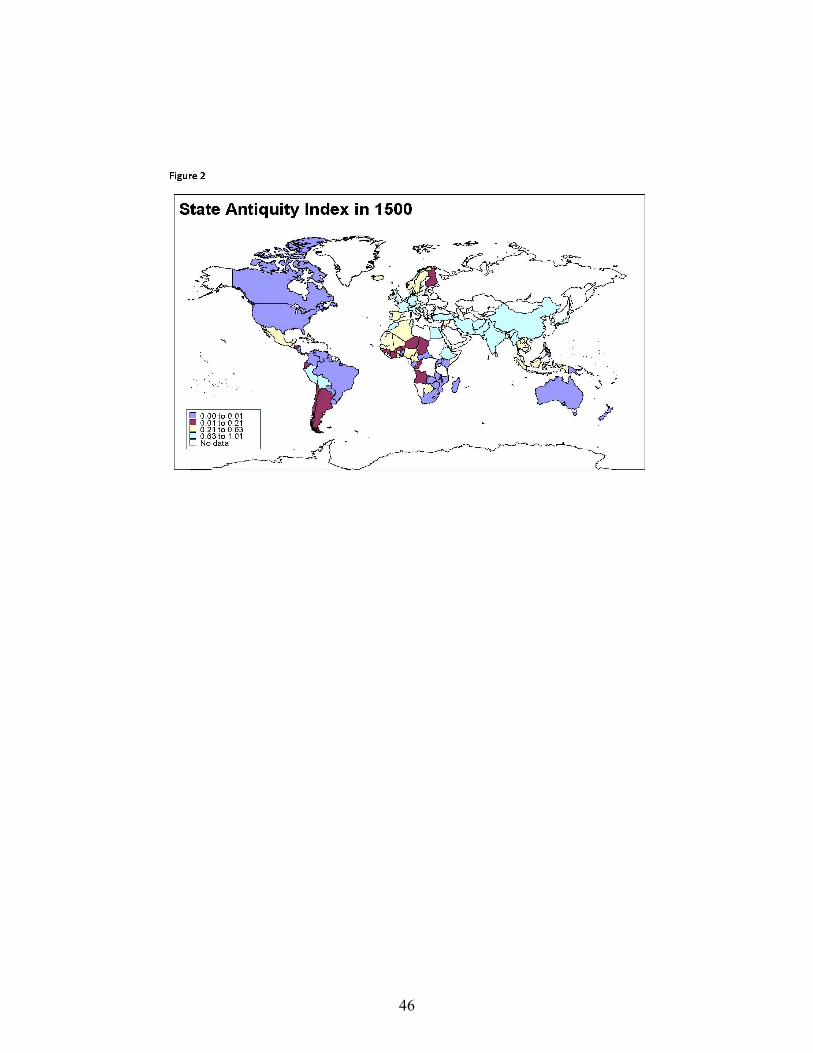
46

47

Figure 4: Malaria Ecology Worldwide
48
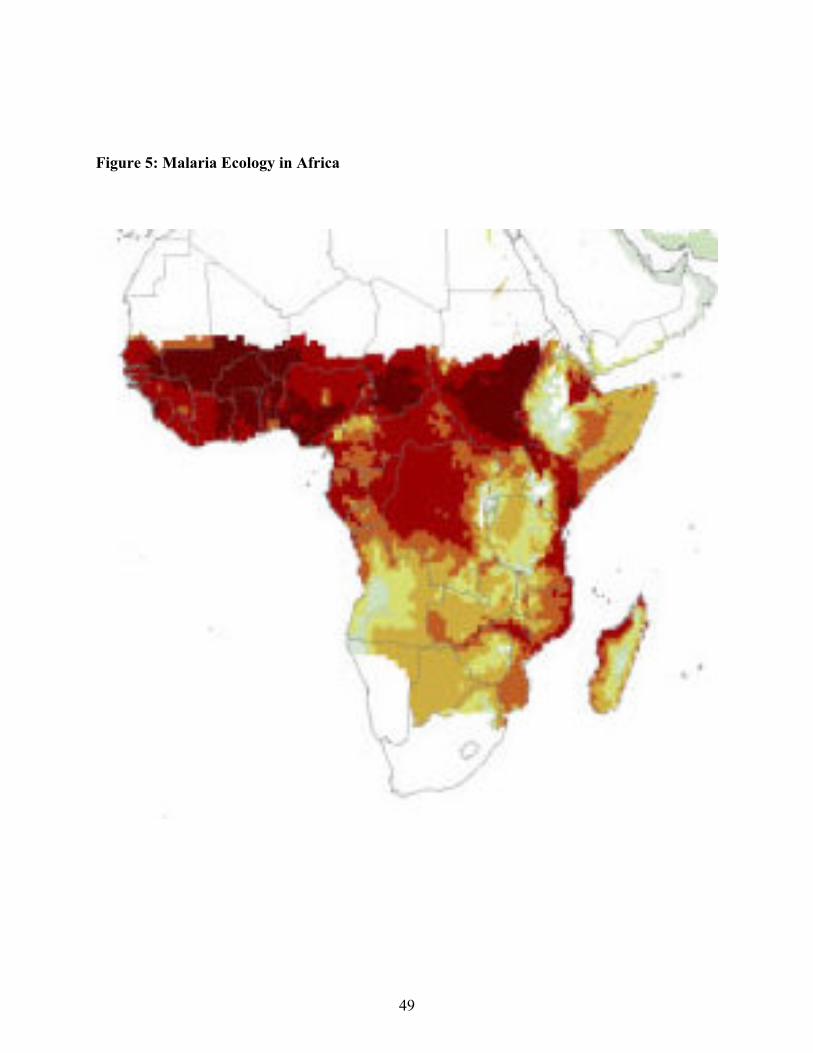
Figure 5: Malaria Ecology in Africa
49

Figure 6: Frequency of the AS Phenotype in Africa
Source: Allison (2002), Fig 2.
50
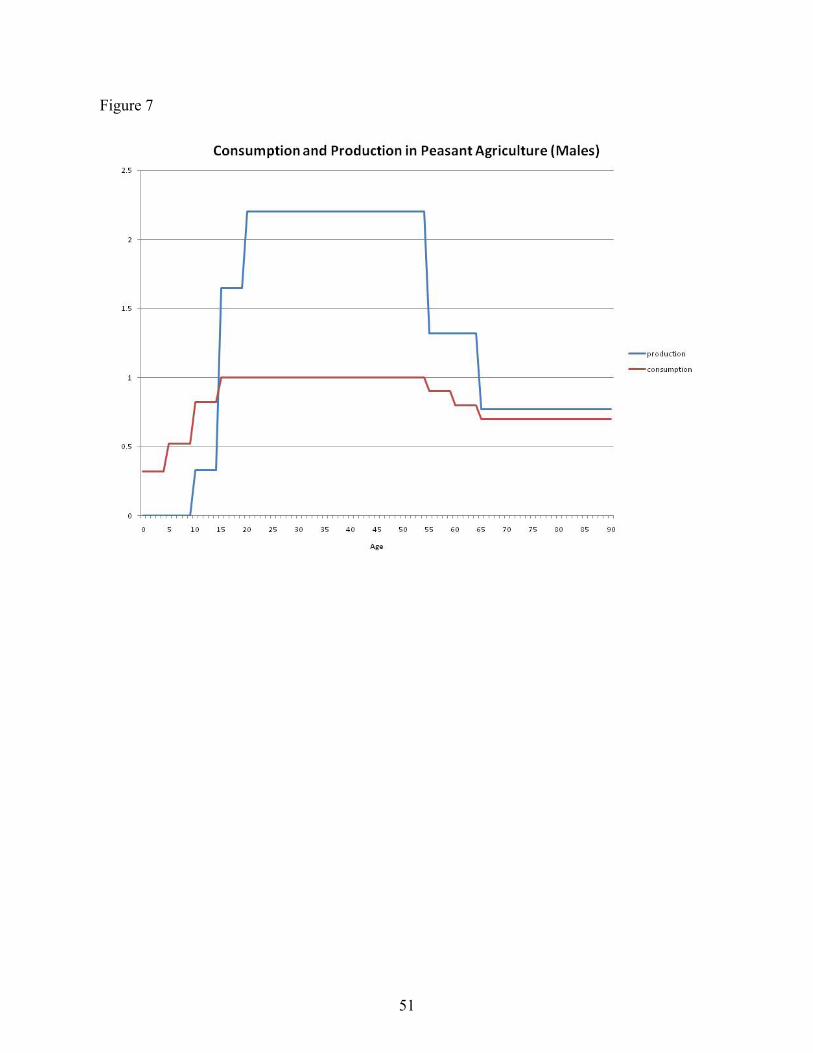
Figure 7
51

Figure 8
52
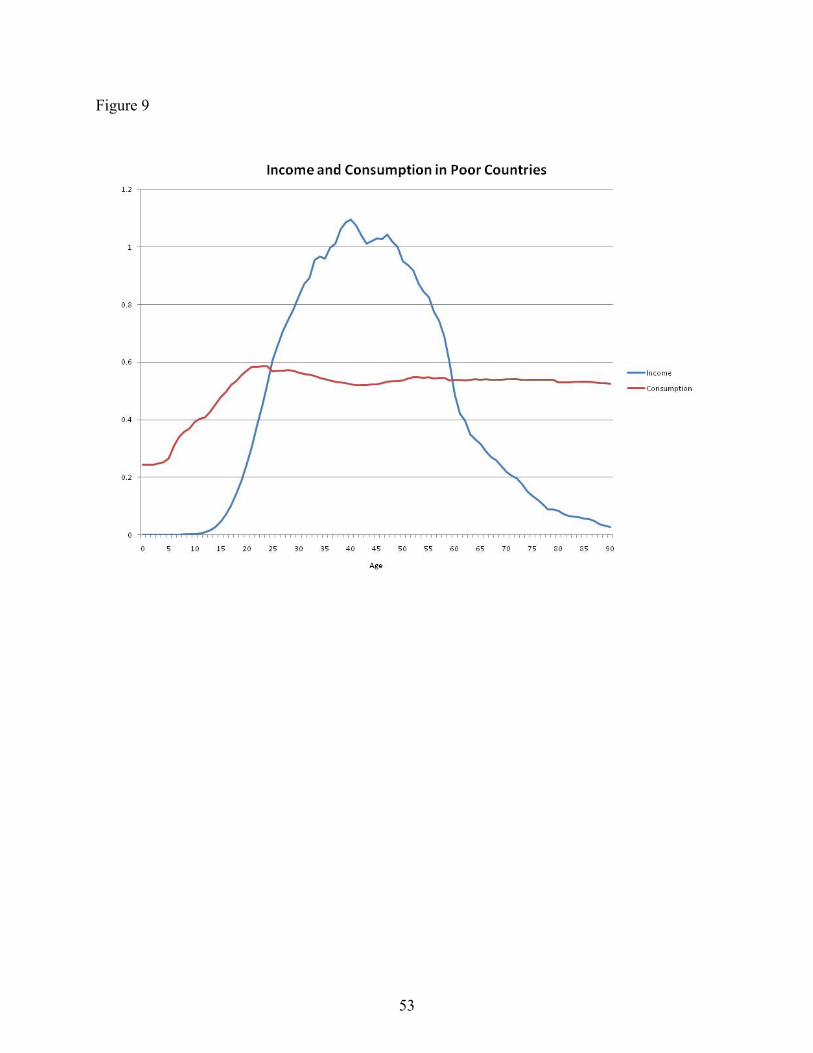
Figure 9
53

Figure 10
54

Figure 11
55

Figure 12: The Malthusian Model
56