preliminary analysis of demersal fish assemblages in
TRANSCRIPT

249
Preliminary Analysis of Demersal Fish Assemblages in Coastal Waters of the Gulf of Thailand
Narongsak Khongchai1, Somchai Vibunpant1, Monton Eiamsa-ard1 and Mala Supongpan2
1 Southern Marine Fisheries Research and Development CenterDepartment of Fisheries
79/1 Vichianchan Road, Amphoe MuangSongkla 9000, Thailand
2 Bangkok Marine Fisheries Development Center89/1 Soi Sapan Pla, YanawaBangkok 10120, Thailand
Khongchai N., S. Vibunpant, M. Eiamsa-ard and M. Supongpan. 2003. Preliminary analysis of demersal fish assemblages in coastal waters of the Gulf of Thailand, p. 249 - 262. In G. Silvestre, L. Garces, I. Stobutzki, M. Ahmed, R.A. Valmonte-Santos, C. Luna, L. Lachica-Aliño, P. Munro, V. Christensen and D. Pauly (eds.) Assessment, Management and Future Directions for Coastal Fisheries in Asian Countries. WorldFish Center Conference Proceedings 67, 1 120 p.
Abstract
The 1995 trawl data of the research vessels Pramong 2 and 9 in the Gulf of Thailand were analyzed using TWINSPAN and DCA. Four main station clusters were identified related to geographic location and depth. Two clusters are associated with shallow water areas and the other two clusters are found in deeper areas with water depths > 30 m. Temporal analysis indicates clustering of monthly data into wet and dry seasons. Examination of species abundance data indicates that the seasonality may not be very pronounced. However, this may be due to the degree of disaggregation used in sorting the trawl survey samples.
40 - 50%) in the catch. In addition, approximately 40 - 60% of the trash fish consists of young, eco-nomically-important food fish (Isara 1996; Supong-pan and Kongmuag 1981). The young economi-cally important food fish caught averaged total length from 3.5 to 4.5 cm (Isara 1996).
The fishing mortality index also showed a slight increase from 1961 to 1986, and increased tremen-dously from 1987 onwards (FAO 1996a). The number of registered trawlers in Thailand increased from 2 601 in 1970 to 12 639 in 1989 (Department of Fisheries 1995a). The excess fishing effort is estimated to be about 60% of the number of regis-tered trawlers (FAO 1996b). Since 1990, registered
Introduction
There is much evidence indicating over-exploita-tion of marine resources in the Gulf of Thailand. The evidence includes the results of trawl monitor-ing surveys using RV Pramong #2 and #9. A declin-ing trend in catch-per-unit effort (CPUE, kg·hr-1) has been observed: from 172 kg·hr-1 in 1966 to about 40kg·hr-1 in 1989 (Eiamsa-ard and Amorn-chairojkul 1997). The decline continues up to the present time. The same trend has been observed in the commercial trawl fisheries operating in the Gulf. The species and sizes captured reflect the very small cod-end mesh size used by trawlers, resulting in a high percentage of trash fish (about

250 WorldFish Center 251
trawlers have not exceed 10 000 units due to a policy of allowing no new entry and termination of registration of old units. However frequent requests to re-open registration for illegal trawlers have re-sulted in poor compliance with the policy. In addi-tion, trash fish requirements of fishmeal plants are about 1.75 million t annually. The Gulf supplies about 52% of this demand, with sardine catches and imported dried trash fish making up the rest (Department of Fisheries, 1995b). Trash fish demand is one of the main reasons for continu-ing over-exploitation of the Gulf.
This paper presents results of analyses of data from trawl surveys conducted in the Gulf of Thailand in 1995 using methods commonly used for commu-nity structure analysis. The study aims to determine the (1) composition of species assemblages; and (2) environmental parameters which help explain the assemblage patterns observed.
Materials and Methods
The Gulf of Thailand (Fig. 1) is situated from 6º N to 13º30’ N latitude and 99ºE to 104º E longitudes. It has a seabed area of 304 000 km2 and is rela-tively shallow, with a mean depth of 58 m and maximum depth of 85 m. Fishing activities occur throughout the area (Supongpan 1996). The Gulf is delineated into 9 statistical areas. Each area is divided into grids measuring 30 nm2. Sampling was set to 80 trawl hauls (each lasting 1 hr) in each area, or a total of 720 hauls for the 9 areas in one year. Routine surveys using this sampling scheme was started in 1963 and continued up to 1976. The abundance of commercially important demersal species in the Gulf of Thailand has been found to
be very low beyond 50 m depth while depths of less than 10 m yield very high quantities of trash fish (Isarankura 1971). The surveys therefore were carried out mainly within the 10 to 50 m depth range. Sampling was stratified by depth: 10 - 19 m, 20 - 30 m, 31 - 44 m and more than 44 m.
The R.V. Pramong 9 and R.V. Pramong 2 were used for monthly sampling from 1977. In a sampling month, the R.V. Pramong 2 was used in Areas I to IV while R.V. Pramong 9 was used in Areas V to IX. This deployment was reversed in the next sampling month. In 1977, depth stratification was discarded although the grid area was reduced to 15 x 15 nm2. Information on the catch, species caught, biological data and size distribution of important species were collected routinely. The number of hauls in each area has varied; currently the number of hauls is about 60 hauls per area, with a total of about 540 hauls per year for the 9 statistical areas.
R.V. Pramong 2 is a 320 HP wooden stern trawler of 79.13 gross tons (GT) and 24.5 m length overall. On the other hand, R.V. Pramong 9 is a 415 HP wooden stern trawler of 84.89 GT and 25.25 m length. Both research vessels use the same German trawl net with otter boards. The trawl net is made of nylon and has a total length of 47.7 m, wing width of 17 m, and a height of 3.5 m. The mesh sizes decrease from 16 cm stretched mesh at the wing to 4 cm at the cod-end. The ground rope and head rope is 48 and 39 m, respectively. The otter boards are made of hard wood covered with steel at their edges (Eiamsa-ard and Amornchairojkul 1997; Eiamsa-ard et al. 1977). Due to differences in size and power of the research vessels, the fish-ing efficiency of the two vessels was experimentally standardized in 1977 (Eiamsa-ard et al. 1977).

250 WorldFish Center 251
Fig. 1. Grid stations and depth contours in the Gulf of Thailand used in the study. Circled numbers indicate statistical areas.
30m40m
35m30m
75m
70m
65m
60m
55m
50m420
THAILAND
CAMBODIA
GULFOF
THAILAND
BANGKOK
CHOLBURI
RAYANGCHANTABURI
TRAD
PHETCHABURI
PRACHUAB
KIRIKHAN
CHUNPHON
SURATTANI
SONGKHLA
PATTANI466
447445
424
399
422
397
373
395
371
345 347
321
294
270268
245243
221
201
1 2 3
5 6 7
8 9 10
14 15 16 17 18 19 20 21
23 24 25 26 27 28 29 30 31 32
33 34 35 36 37 42 43 44
56 57 58
9
8
7
4
3
2
1
99 100 101 102 103 104 105LONGITUDE ºE
14
13
12
11
10
9
8
7
6
LATI
ITU
DE
ºN

252 WorldFish Center 253
Data collected by RV Pramong 2 and 9 in 1995 were used in this study. Data from a total of 59 fixed stations or grids numbered in Fig. 1 each measuring 225 nm2 (15 x15 nm) were used. Data for areas 5 and 6 were not available. CPUE data for 8 months (January, March, June, July, August, September, October and December) were available to estimate mean biomass for each month using the swept area method. The analysis steps undertaken during the course of this study are illustrated in Fig. 2. CPUE values by statistical grid were utilized to estimate biomass. Biomass was estimated using the swept area method (Sparre and Venema 1992) as follows:
CPUE
where A is the station or grid area (= (15 ·1.853 2)2 km2), a is swept area (= 0.090 29 km2), and X
1 is the proportion of fish in the path of the
gear retained in the net (= 0.5).
The swept area was estimated from the equation:
a = t · v · h · X2
where t is the time spent trawling (= 1 hr), v is velocity of trawling (= 2.5 knot), h is the length of head-rope (= 39 m), and X
2 is the ratio representing the effective
head-rope length (= 0.5).
The resulting swept area (a) is 0.090 29 km2.
CPUE (kg·hr-1) was recorded to species level when-ever possible. A total number of 175 species or groups were recorded across the grids covered by the study. After deleting species of less than 0.1% relative abundance, a total of 90 species or groups and 59 stations were used in the analyses. Mean biomass by grid or station was used in Two-Way INdicator SPecies ANalysis (TWINSPAN) (Hill, 1979) and Detrended Correspondence Analysis (DCA) using the CANOCO program (Ter Braak, 1988). Classification diagrams were drawn to show the species and sites assemblages. Outliers were deleted in the process of analyses.
An attempt to use the biomass data and environ-mental parameters in the southern part of the Gulf (areas 7, 8 and 9) in external analysis was made (by plotting the first DCA axis scores vs. environmental
parameters). Chemical and physical parameters were collected specific to the same time and grid. Environmental parameters assembled were depth, bottom type, temperature, salinity, pH, dissolved oxygen, total suspended solids, nitrates, nitrites, ammonia and phosphate during the months of July, September and October 1995. A summary of the bottom type data is illustrated in Fig. 3. Due to the limited spatial and temporal coverage of the environmental data, the external analysis was discontinued.
a · X1· AB=
Species
Classification
Ordination
Cut off outliers
Species
Station,Month
CPUEs
Station,Month
< 0.1% Cut off
Biomass
Assemblage
Repeat 2,3,4Assemblage/ clusters
Similarity matrix
1 2
3
4
5 6
78
Fig. 2. Graphical representation of the stages of analysis made in this study.

252 WorldFish Center 253
Fig. 3. Bottom types in the southern Gulf of Thailand, 1995.
LEGEND
Clay
Sand
Clay Sand
Sandy Clay
Silty Clay
Sand Silt Clay
420
THAILAND
CAMBODIA
GULFOF
THAILAND
BANGKOK
CHOLBURI
RAYANGCHANTABURI
TRAD
PHETCHABURI
PRACHUAB
KIRIKHAN
CHUNPHON
SURATTANI
SONGKHLA
PATTANI466
447445
424
399
422
397
373
395
371
345 347
321
294
270268
245243
221
201
1 2 3
5 6 7
8 9 10
14 15 16 17 18 19 20 21
23 24 25 26 27 28 29 30 31 32
33 34 35 36 37 42 43 44
56 57 58
9
8
7
4
3
2
1
99 100 101 102 103 104 105LONGITUDE ºE
14
13
12
11
10
9
8
7
6
LATI
ITU
DE
ºN
6
5

254 WorldFish Center 255
Results and DiscussionSpecies Composition
A total of 175 species/groups from the 59 trawl grids/stations were caught by RV Pramong 2 and 9 in 1995. Data for species/groups which formed less than 0.1% of the total biomass were deleted, resulting into 90 species/groups retained for the analysis (Table 1). The most abundant groups were Leiognathidae (slipmouths), squids, Synodontidae, Sphyraenidae, miscellaneous trash fish, all Nemip-teridae, Priacanthus spp., Mullidae, Carangidae and Siganus spp.. Leiognathids were dominant com-prising over 20% of catches, and this included Leiognathus elongatus, Leiognathus splendens, Leiog-nathus bindus and Leiognathus leniolatus. In 1995, Leiognathidae was classified as food fish compared to previous work which grouped them as trash
fish. Trash fish comprised about 40 - 50% of the total catch (Marine Fisheries Division 1997).
Two stations (016 and 033) were deleted because these were identified as outliers. Station 016 and 033 catches comprised 38 and 47 species/groups, respectively. The most abundant species/group in station 016 was Sphyraenidae (including Sphyraena obtusata), which accounted for about 84% of the biomass. At station 033, the most abundant group was miscellaneous trash fish which made up 82% of the biomass. One group heavily dominated these two outlier stations. The use of large categories (such as miscellaneous trash fish) gives the oppor-tunity to dump species that are difficult to identify into this category. This issue has been noted in other studies (Bianchi et al. 1996). This can lead to inconsistencies between different stations of a given survey.
Table 1. CPUE (kg·hr-1) and biomass (t) of 90 species/groups in the Gulf of Thailand, 1995.
Taxa CPUE (kg·hr-1) Biomass (t) Taxa CPUE (kg·hr-1) Biomass (t)
Leiognathidae 277.1 3 496 Bothidae 7.0 134
Squids 154. 6 2 550 Atule mate 8.0 131
Leiognathus elongatus 103.6 1 702 Serranidae 7.5 125
Leiognathus splendens 126.6 1 491 Alepes melanoptera 7.0 118
Miscellaneous trash 124.0 1 478 Charybdis ferriatus 6.5 108
Synodontidae 84.4 1 405 Scomberomorus commerson 6.0 101
Sphyraenidae 70.4 1 194 Leiognathus spp. 12.1 101
Sphyraena obtusata 62.9 1 075 Lutjanus vitta 5.1 93
Scolopsis spp. 59.8 1 013 Miscellaneous crabs 5.9 92
Scolopsis taeniopterus 59.7 1 013 Fistulariidae 6.2 91
Saurida undosquamis 45.9 770 Encrasicholina spp. 6.2 90
Mullidae 41.4 659 Sciaenidae 6.3 87
Carangidae 36.9 564 Sepia recurvirostris 5.1 84
Loligo duvauceli 33.4 556 Trichiuridae 4.3 71
Leiognathus bindus 31.9 538 Caranx malabaricus (Carangoides malabaricus*)
4.3 71
Siganidae 34.0 527 Rastrelliger kanagurta 4.0 65
Nemipteridae 30.1 505 Sepia lycidas 3.9 64

254 WorldFish Center 255
Taxa CPUE (kg·hr-1) Biomass (t) Taxa CPUE (kg·hr-1) Biomass (t)
Priacanthidae 28.6 482 Chirocentrus dorab 3.9 62
Secutor spp. 51.3 455 Megalaspis cordyla 3.9 62
Cuttlefishes 23.9 412 Sepia pharaonis 3.7 60
Lutjanus lutjanus 24.4 402 Muraenesocidae 3.5 59
Amusium pleuronectes 23.3 390 Lutjanidae 3.5 59
Crabs 23.2 380 Loligo chinensis 4.2 52
Saurida elongata 22.3 365 Pentaprion longimanus 3.1 52
Lutjanidae 18.4 318 Clupeidae 3.8 52
Priacanthus tayenus 18.8 315 Secutor ruconius 2.6 51
Crabs (trash) 19.8 296 Anodontostoma chacunda 3.1 50
Loligo sumatrensis 17.6 291 Dorosomatinae 3.1 50
Saurida isarankurai 15.3 254 Trichiurus lepturus 3.0 49
Nemipterus mesoprion 14.9 246 Selaroides leptolepis 3.4 48
Sepioteuthis lessoniana 12.7 209 Sphyraena jello 2.7 47
Nemipterus hexodon 12.3 208 Alepes kalla (A. djedaba*) 5.1 47
Apogonidae 11.3 184 Plectorhinchus pictus 2.8 46
Lutjanus johni (L. johnii*) 11.1 176 Pleuronectidae 2.9 46
Leiognathus lineolatus 10.3 173 Scomberomorus spp. 3.4 43
Tetraodontidae 11.0 171 Selar crumenopthalmus 2.5 42
Portunus pelagicus 10.2 168 Nemipterus peronii 2.3 38
Priacanthus macracanthus 9.9 166 Cynoglossidae 1.8 38
Platycephalidae 9.8 163 Pentapodidae 2.3 38
Scombridae 10.18 157 Sepia brevimana 2.3 37
Balistidae 12.0 157 Gazza minuta 2.1 34
Octopus spp. 9.6 150 Parastromateus niger 2. 34
Rastrelliger spp. 9.0 149 Rastrelliger brachysoma 1.8 33
Sepia aculeata 7.9 147 Secutor insidiator 1.9 32
Mantis shrimps 9.2 147 Rays 2.2 32
Note: * valid name in Fishbase.
Table 1. CPUE (kg·hr-1) and biomass (t) of 90 species/groups in the Gulf of Thailand, 1995. (continued)
256 WorldFish Center 257
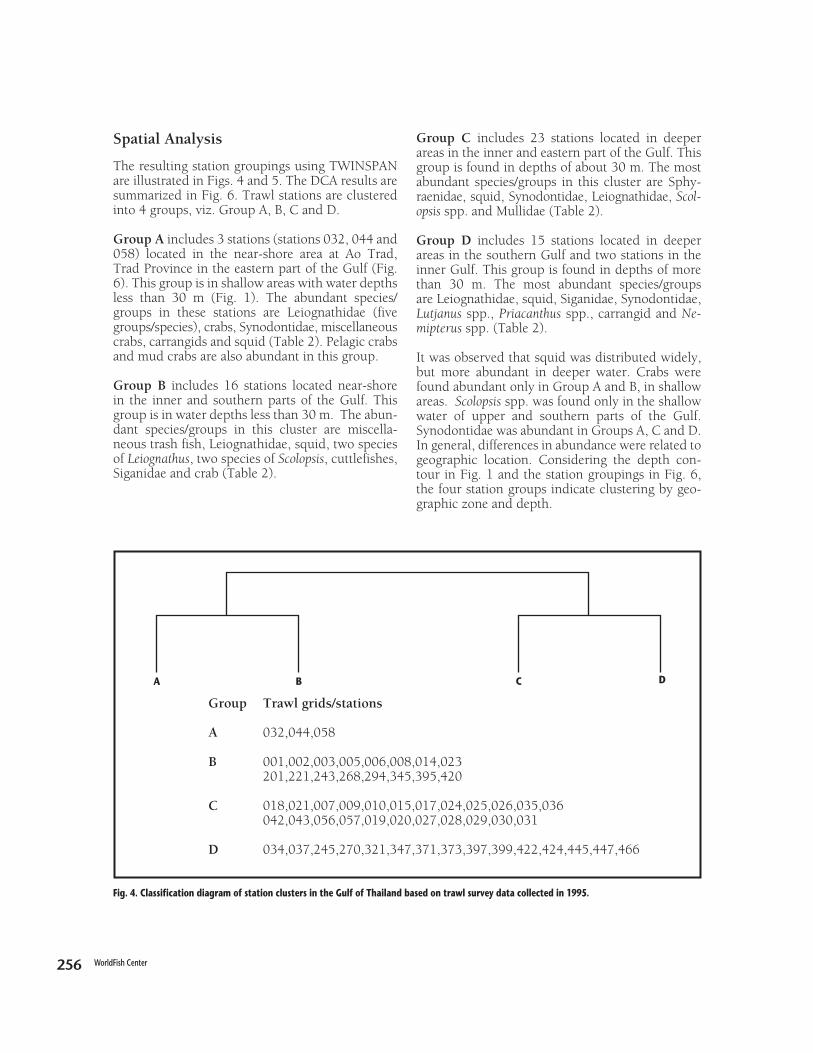
Spatial Analysis
The resulting station groupings using TWINSPAN are illustrated in Figs. 4 and 5. The DCA results are summarized in Fig. 6. Trawl stations are clustered into 4 groups, viz. Group A, B, C and D.
Group A includes 3 stations (stations 032, 044 and 058) located in the near-shore area at Ao Trad, Trad Province in the eastern part of the Gulf (Fig. 6). This group is in shallow areas with water depths less than 30 m (Fig. 1). The abundant species/groups in these stations are Leiognathidae (five groups/species), crabs, Synodontidae, miscellaneous crabs, carrangids and squid (Table 2). Pelagic crabs and mud crabs are also abundant in this group.
Group B includes 16 stations located near-shore in the inner and southern parts of the Gulf. This group is in water depths less than 30 m. The abun-dant species/groups in this cluster are miscella-neous trash fish, Leiognathidae, squid, two species of Leiognathus, two species of Scolopsis, cuttlefishes, Siganidae and crab (Table 2).
Group C includes 23 stations located in deeper areas in the inner and eastern part of the Gulf. This group is found in depths of about 30 m. The most abundant species/groups in this cluster are Sphy-raenidae, squid, Synodontidae, Leiognathidae, Scol-opsis spp. and Mullidae (Table 2).
Group D includes 15 stations located in deeper areas in the southern Gulf and two stations in the inner Gulf. This group is found in depths of more than 30 m. The most abundant species/groups are Leiognathidae, squid, Siganidae, Synodontidae, Lutjanus spp., Priacanthus spp., carrangid and Ne-mipterus spp. (Table 2).
It was observed that squid was distributed widely, but more abundant in deeper water. Crabs were found abundant only in Group A and B, in shallow areas. Scolopsis spp. was found only in the shallow water of upper and southern parts of the Gulf. Synodontidae was abundant in Groups A, C and D. In general, differences in abundance were related to geographic location. Considering the depth con-tour in Fig. 1 and the station groupings in Fig. 6, the four station groups indicate clustering by geo-graphic zone and depth.
Group Trawl grids/stations
A 032,044,058
B 001,002,003,005,006,008,014,023 201,221,243,268,294,345,395,420
C 018,021,007,009,010,015,017,024,025,026,035,036 042,043,056,057,019,020,027,028,029,030,031
D 034,037,245,270,321,347,371,373,397,399,422,424,445,447,466
Fig. 4. Classification diagram of station clusters in the Gulf of Thailand based on trawl survey data collected in 1995.
A B C D

256 WorldFish Center 257
Fig. 5. Trawl grid/station groupings in the Gulf of Thailand based on 1995 research survey data.
420
THAILAND
CAMBODIA
GULFOF
THAILAND
BANGKOK
CHOLBURI
RAYANGCHANTABURI
TRAD
PHETCHABURI
PRACHUAB
KIRIKHAN
CHUNPHON
SURATTANI
SONGKHLA
PATTANI466
447445
424
399
422
397
373
395
371
345 347
321
294
270268
245243
221
201
1 2 3
5 6 7
8 9 10
14 15 16 17 18 19 20 21
23 24 25 26 27 28 29 30 31 32
33 34 35 36 37 42 43 44
56 57 58
9
8
7
4
3
2
1
99 100 101 102 103 104 105LONGITUDE ºE
14
13
12
11
10
9
8
7
6
LATI
ITU
DE
ºN
LEGEND
Group A
Group B
Group C
Group D

258 WorldFish Center 259
-150 -100 -50 0 50 100
100
50
0
-50
-100
-150
Group A Group B Group C Group D
A
B
CD
FIRST DCA AXIS
SEC
ON
D D
CA
AX
IS
Table 2. Biomass (t) and relative abundance (%) of the top ten species/group in each station-cluster resulting from spatial analysis.
Figure 6. DCA plots showing the station assemblages.
Group A Group B
Species/Group Biomass (t) % Taxa Biomass (t) %
Leiognathidae 1 051.0 31.51 Miscellaneous trashfish 1 212.5 16.85
Leiognathus splendens 501.7 15.04 Leiognathidae 937.7 13.03
Secutor spp. 402.7 12.07 Squids 799.9 11.12
Balistidae 108.7 3.26 Leiognathus splendens 774.4 10.76
Leiognathus spp. 100.1 3.00 Leiognathus elongatus 620.2 8.62
Crabs 94.6 2.84 Scolopsis spp. 169.5 2.36
Synodontidae 88.8 2.66 Scolopsis taeniopterus 168.8 2.35
Miscellaneous crabs 87.3 2.62 Cuttlefishes 160.1 2.23
Carangidae 84.0 2.52 Siganidae 111.6 1.55
Squids 79.1 2.37 Crabs (trash) 103.9 1.44

258 WorldFish Center 259
Group C Group D
Species/Group Biomass (t) % Taxa Biomass (t) %
Sphyraenidae 1 137.9 8.95 Leiognathidae 761.6 10.31
Sphyraena obtusata 1 074.4 8.45 Squids 643.6 8.71
Squids 1 027.4 8.08 Leiognathus elongatus 389.2 5.27
Synodontidae 882.7 6.95 Siganidae 371.9 5.03
Leiognathidae 746.0 5.87 Synodontidae 347.9 4.71
Scolopsis spp. 658.2 5.18 Lutjanus lutjanus 335.5 4.54
Scolopsis taeniopterus 658.2 5.18 Priacanthidae 313.0 4.24
Leiognathus elongatus 652.1 5.13 Leiognathus bindus 289.9 3.92
Saurida undosquamis 583.1 4.59 Carangidae 264.7 3.58
Mullidae 489.7 3.85 Nemipteridae 250.1 3.39
Temporal Analysis
The average biomass by month was computed and used in the temporal analysis. Two temporal groups were identified: Group A comprising Sep-tember and October; and Group B comprising January, March, June, July, August and December. In September and October, rainfall in the Gulf of Thailand is high compared to other months. In 1995, very heavy rainfall (about 500 - 2 600 mm) occurred during October (Department of Meteorol-ogy, 1995). It appears that Group A is associated with the wet season, and Group B with the dry sea-son. The species appearing in both groups were almost the same but with different relative abun-dances (Table 3). The observed relative abundances are not very different however, suggesting that sea-sonal variability may not be pronounced. This may be due to the level of disaggregation used in sorting
the survey catch into species/groups. Demersal fish and trashfish were the major components accounting for 18.4% and 17.8% of the biomasses of group A and B respectively. Squid appeared in both groups (5 - 6% of the total biomass). Sphyrae-nidae and Sphyraena obtusata were the only ones, which showed large differences in biomass between wet and dry seasons. In Group A (September and October), Sphyraenidae and Sphyraena obtusataamounted to about 12% of biomass whereas they were very low in abundance in Group B. Trashfish and Leiognathus spendens were abundant in the dry season. Species occurring in Group B were com-mon throughout the year (Table 3). The DCA out-put is given in Fig. 7. It is suggested that further analysis should be completed with environmental data including biological information to explain these temporal differences in biomass estimates.
Table 2. Biomass (t) and relative abundance (%) of the top ten species/group in each station-cluster resulting from spatial analysis. (continued)

260 WorldFish Center 261
Table 3. Biomass (t) and relative abundance (%) of the top ten species/group in each station-cluster resulting from spatial analysis.
Group A Group B
Species/Group Biomass (t) % Taxa Biomass (t) %
Demersal fishes 273 18.39 Trash groups 345 17.82
Trash groups 128 8.61 Demersal fishes 222 11.45
Cephalopods 110 7.38 Leiognathidae 174 8.97
Sphyraenidae 90 6.04 Cephalopods 124 6.42
Sphyreana obtusata 88 5.93 Misc. trash 115 5.93
Squids 86 5.81 Leiognathus splendens 104 5.37
Leiognathidae 80 5.39 Squids 92 4.75
Leiognathus elongatus 60 4.01 Leiognathus elongatus 58 2.99
Scolopsis taeniopterus 41 2.75 Synodontidae 57 2.96
Synodontidae 37 2.51 Pelagic fishes 49 2.53
Pelagic fishes 33 2.22 Saurida undosquamis 31 1.62
Secutor spp. 31 2.10 Mullidae 29 1.51
Mullidae 23 1.55 Scolopsis taeniopterus 29 1.51
Siganidae 23 1.53 Leiognathus brevirostris 25 1.31
Saurida undosquamis 22 1.47 Loligo duvauceli 24 1.24
Leiognathus splendens 18 1.24 Carangidae 23 1.17
Loligo duvauceli 16 1.08 Lutjanus lutjanus 22 1.13
Shells 15 1.04 Priacanthidae 22 1.12
Amusium pleuronectes 15 1.01 Nemipteridae 20 1.01
Nemipteridae 15 0.98 Crabs 19 0.97
Carangidae 14 0.92 Crabs (trash) 17 0.85
Cuttlefish 13 0.85 Siganidae 16 0.80
Priacanthidae 12 0.79 Saurida elongata 16 0.79
Loligo sumatrensis 11 0.71 Cuttlefish 15 0.77
Lutjanidae 10 0.70 Priacanthus tayenus 15 0.77

260 WorldFish Center 261
Fig. 7. DCA plots showing temporal groupings of assemblages.
References
Bianchi, G., M. Badrudin and S. Budiharjo. 1996. Demersal Assemblages of the Java Sea: A study based on the trawl surveys of the R/V Mutiara 4, p. 55 - 61. In D. Pauly and P. Martosubroto, (eds.) Baseline studies of biodiversity : the Fish resources of Western Indonesia. ICLARM Studies and Reviews 23, p 312.
Department of Fisheries. 1995a. Thai fishing vessels statistics 1970 - 95. Fisheries Statistics and Information Technology, Fisheries Economics Division, Department of Fisheries, Thailand.
Department of Fisheries. 1995b. Statistics of Fisheries Factory 1970 - 95. Fisheries Statistics and Information Technology, Fisheries Economics Division, Department of Fisheries, Thailand.
Department of Meteorology. 1995. Monthly rainfall record of the year 1995. Department of Meteorology.
Eiamsa-ard, M. and S. Amornchairojkul. 1997. The Marine Fisheries of Thailand, with emphasis on the Gulf of Thailand trawl fishery, p. 85 - 95. In G. Silvestre and D. Pauly, eds. Status and management of tropical coastal fisheries in Asia. ICLARM Conferences Proceedings 53, p 280.
Eiamsa-ard, M., D. Dhamniyom and S. Pramokchutima. 1977. Catches Analysis of the otter board trawling in the Gulf of Thailand. Demersal Fish Section, Marine Fisheries Division, DOF, Thailand.
FAO. 1996a. Advisory report on the Demersal Trawl Fishery in the Gulf of Thailand. Third Thailand/FAO/DANIDA Workshop on Fishery Research Planning, Chiangrai, Thailand, 23 January to 3 February 1995. Report on Activity No.12 (Supplement 2).
FAO. 1996b. Scientific report on the Demersal Trawl Fishery in the Gulf of Thailand. Third Thailand/FAO/ DANIDA Workshop on Fishery Research Planning, Chiangrai, Thailand, 23 January to 3 February 1995. Report on Activity No.12 (Supplement 1).
Hill, M.O. 1979. TWINSPAN-a FORTRAN program for arranging multivariate data in an ordered two-way table by classification of the individuals and attributes. Section of Ecology and Systematics, Cornell University, Ithaca, New York.
Isara, P. 1996. The status of Commercial Trawl Fisheries in the Prachuab Kiri Khan, Chumphon and Surat Thani Provinces. Stock Assessment Section, Bangkok Marine Fisheries Development Center, Technical Paper No.6/1996.
-100 -50 0 50 100
100
50
0
-50
-100
Group A Group B
B
A
FIRST DCA AXIS
SEC
ON
D D
CA
AX
IS
262 WorldFish Center
Isarankura, A.P. 1971. Present status of trawl fisheries resources in the Gulf of Thailand and the management programme, p. 105 - 114 IPFC, Proceedings of the 14th session, 18 - 27 November 1970, Bangkok, Thailand, Section ii -Management of Common-use Resources and the Present Situation in IPFC Areas. IPFC Proceedings 14 (2), p. 160, Vol. 14 (11).
Marine Fisheries Division. 1997. Optimal mesh sizes for commercial demersal resource trawling. Technical Paper No.1/1997. Marine Fisheries Division.
Sparre, P. and S.C. Venema. 1992. Introduction to Tropical Fish Stock Assessment, part 1. Manual. FAO Fisheries Technical Paper 306/1. Rev 1. Danish International Development Agency (DANIDA), FAO, Rome.
Supongpan, M. 1996. Marine Capture Fisheries of Thailand. Thai Fisheries Gazette 49(2) : 154 - 162.
Supongpan, M. and K. Kongmuag. 1981. Catch and effort of marine resources caught by commercial trawlers in the Gulf of Thailand 1976 - 81. Technical Paper, Invertebrate Fisheries Sub-Division. Marine Fisheries Division.
Ter Braak, C.J. 1988. CANOCO-A FORTRAN program for canonical community ordination by partial detrended canonical correspondence analysis, principal components analysis and redundancy analysis (Version 2.1). Agricultural Mathematics Group, Wageningen, The Netherlands.