prek, policy, and prevention: how high quality prek can have a profound impact on the lives of...
TRANSCRIPT
Build knowledge. Gain expertise. Share best practices.SPEDCHAT WEBINAR SERIES
PreK, Policy, and Prevention: How High Quality PreK can Have a Profound Impact on Students With Disabilities

SPEDCHAT WEBINAR SERIES
Tweet about the webinar using #SpedChatWeband follow us on social to find out about
future webinars, events, news, and contests.
@AccelifyLLC
We’re Social!
facebook.com/Accelify linkedin.com/company/accelify-llc
SPEDCHAT WEBINAR SERIES
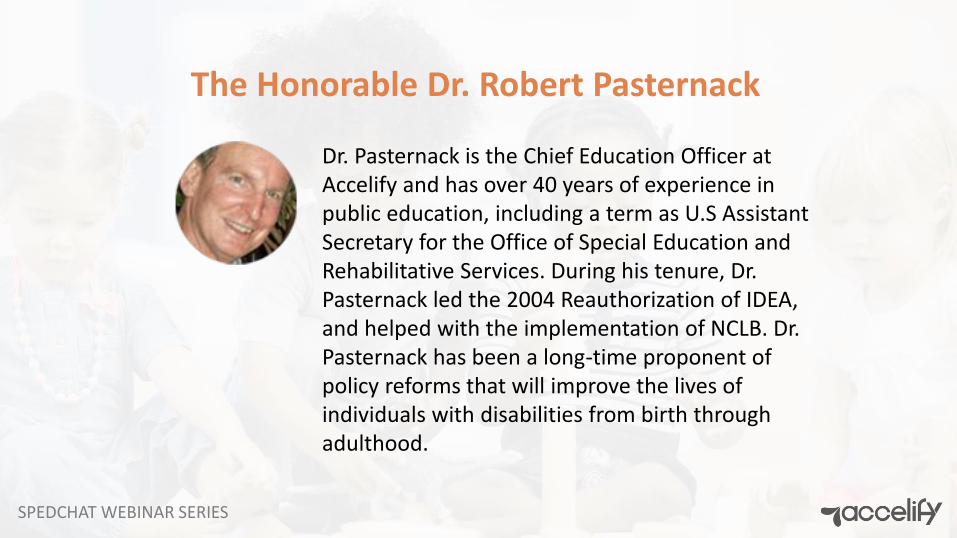
The Honorable Dr. Robert Pasternack
Dr. Pasternack is the Chief Education Officer at Accelify and has over 40 years of experience in public education, including a term as U.S Assistant Secretary for the Office of Special Education and Rehabilitative Services. During his tenure, Dr. Pasternack led the 2004 Reauthorization of IDEA, and helped with the implementation of NCLB. Dr. Pasternack has been a long-time proponent of policy reforms that will improve the lives of individuals with disabilities from birth through adulthood.

SPEDCHAT WEBINAR SERIES
History of IDEA

SPEDCHAT WEBINAR SERIES
HISTORY OF IDEA
1967 – Almost 200,000 individuals with significant disabilities were in state institutions, many of which provided only minimal food, clothing, and shelter.
1970 – U.S. schools educated only 1 in 5 of the nation’s children with disabilities, and many states had laws excluding those who were deaf, blind, emotionally disturbed or intellectually disabled.
November 1975 - Congress passes the Education for All Handicapped Children Act, P.L. 94-142.
1967 1970 1975

SPEDCHAT WEBINAR SERIES
HISTORY OF IDEA
Education for All Handicapped Children Act, P.L. 94-142
Four Purposes:
• To assure that all children with disabilities have available to them…a free and an appropriate education which emphasizes special education and related services designed to meet their unique needs;
• To assure that the rights of children with disabilities and their parents….are protected;• To assist States and localities to provide for the education of all children with disabilities;
• To assess and assure the effectiveness of efforts to educate all children with disabilities.

SPEDCHAT WEBINAR SERIES
HISTORY OF IDEA
Today
57 percent of students with disabilities are in general education classrooms for 80 percent or more of the day.
350,000 infants and toddlers receive early intervention.
6.7 million children and youth receive special education and related services.
Source: www.IDEAdata.org

SPEDCHAT WEBINAR SERIES
Percentage of students served under IDEA, Part B,
by disability category: SY 2011-12
Intellectual Disabilities
7.4%
Hearing Impairments
1.2%
Speech or Language Impairments
18.5%
Visual Impairments , 0.4%
Emotional Disturbance
, 6.4%Orthopedic
Impairments , 0.9%
Other Health Impairments
12.7%
Specific Learning Disabilities
40.7%
Deaf-Blindness 0.0%
Multiple Disabilities 2.2%
Autism 7.0%
Traumatic Brain Injury , 0.4%
Developmental Delay 2.0%

SPEDCHAT WEBINAR SERIES
POLICY

SPEDCHAT WEBINAR SERIES
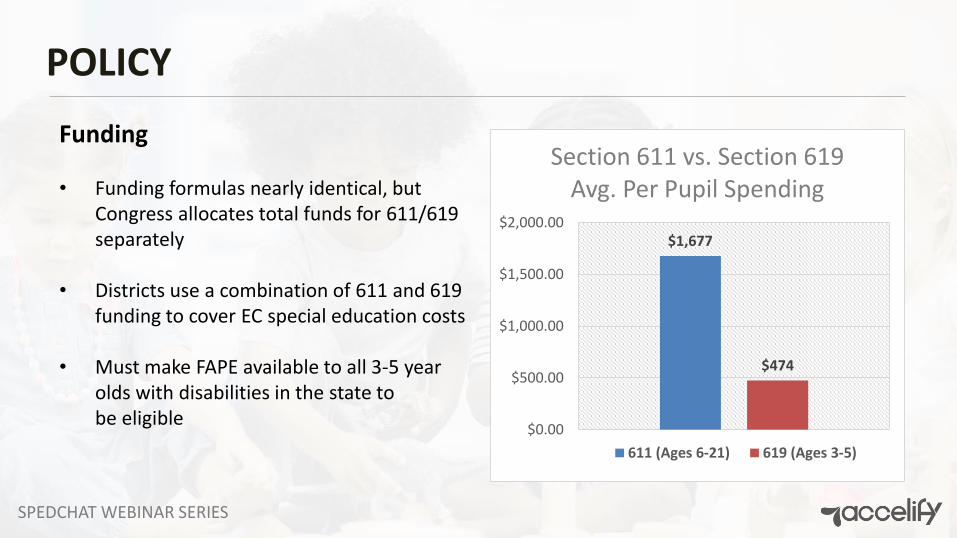
POLICYSection 619 of IDEA Part B
• Defines the preschool program for children with disabilities
• Authorizes grants to states for preschool children with special needs, ages 3-5 (Sec. 611 funds state grants for students ages 6-21)
• Guarantees FAPE to children age 3-5
• Entitles them to Special Education and Related Services in the LRE if identified as having condition named in Part B of IDEA
SPEDCHAT WEBINAR SERIES
POLICY
Funding
• Funding formulas nearly identical, but Congress allocates total funds for 611/619 separately
• Districts use a combination of 611 and 619 funding to cover EC special education costs
• Must make FAPE available to all 3-5 year olds with disabilities in the state to be eligible
$1,677
$474
$0.00
$500.00
$1,000.00
$1,500.00
$2,000.00
Section 611 vs. Section 619 Avg. Per Pupil Spending
611 (Ages 6-21) 619 (Ages 3-5)
SPEDCHAT WEBINAR SERIES
Literacy and ECE

SPEDCHAT WEBINAR SERIES
“Reading is the foundation for all learning – and that foundation is built early,
by exposing young children to the love of books and the simple rules of language”
SPEDCHAT WEBINAR SERIES
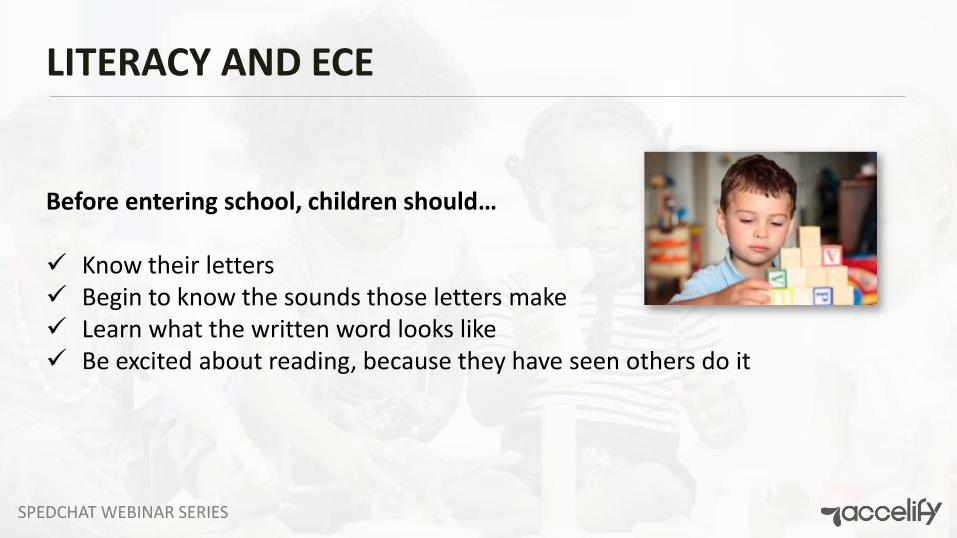
LITERACY AND ECE
Before entering school, children should…
Know their letters Begin to know the sounds those letters make Learn what the written word looks like Be excited about reading, because they have seen others do it

SPEDCHAT WEBINAR SERIES
LITERACY AND ECE
Early Literacy and the Link to Future Success
Which of the below do you think is the most accurate predictor of 9th grade reading scores?
• The amount of funding the child’s school receives• A child’s vocabulary and knowledge of the alphabet
in kindergarten • A child’s economic status

SPEDCHAT WEBINAR SERIES
LITERACY AND ECE
Early Literacy and the Achievement Gap
• To close the achievement gap in our schools, we must close the early childhood education gap in our society
• The federal government provides states with considerable funds for childcare –but there is little emphasis in the law on the educational quality of childcare. That must change

SPEDCHAT WEBINAR SERIES
LITERACY AND ECE
Early Literacy and Policy
• Anyone serious about educational reform must be serious about early childhood education
• If we want all our children reading by the third grade, then all our children must be ready to learn on their first day of school
• States must provide PreK programs with guidelines on language development, pre-reading and literacy skills
• States must have a plan to expand the training of child care and pre-school teachers in their state

SPEDCHAT WEBINAR SERIES
IDEA Section 619
What does the data tell us?

SPEDCHAT WEBINAR SERIES
IDEA 619 – What does the data tell us?
Early Literacy and Policy
• In the fall of 2005, 704,087 children age 3-5 were being served through Section 619 (8% of total age group)(Source: www.ideadata.org)
• In 2005-2006, $380 million dollars was awarded to the states and territories to help with the cost of the program

SPEDCHAT WEBINAR SERIES
IDEA 619 – What does the data tell us?
Year Total served under Part B ages 3-5
In the 50 states, DC, BIE schools, PR, and the four
outlying areas
Resident populationages 3-5
in the 50 states and DC
In the 50 states, DC, and BIE schools
% of resident population served under Part B
ages 3-5 in the 50 states, DC, and BIE
schools
2003 680,142 670,750 11,501,168 5.8
2004 701,949 693,245 11,714,436 5.9
2005 704,087 698,938 11,866,471 5.9
2006 714,384 706,635 11,987,484 5.9
2007 709,136 698,931 11,975,329 5.8
2008 709,004 700,296 12,037,364 5.8
2009 731,832 716,569 12,129,397 5.9
2010 735,245 720,740 12,255,590 5.9
2011 745,954 730,558 12,312,888 5.9
2012 750,131 736,195 12,203,162 6.0
SPEDCHAT WEBINAR SERIES
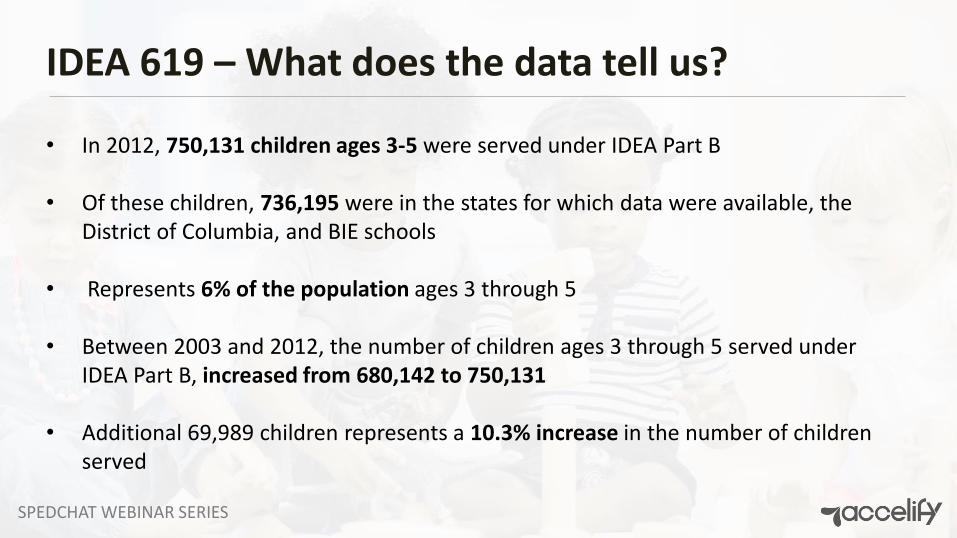
IDEA 619 – What does the data tell us?
• In 2012, 750,131 children ages 3-5 were served under IDEA Part B
• Of these children, 736,195 were in the states for which data were available, the District of Columbia, and BIE schools
• Represents 6% of the population ages 3 through 5
• Between 2003 and 2012, the number of children ages 3 through 5 served under IDEA Part B, increased from 680,142 to 750,131
• Additional 69,989 children represents a 10.3% increase in the number of children served

SPEDCHAT WEBINAR SERIES
IDEA Part B
Disability Categories and Demographics

SPEDCHAT WEBINAR SERIES
IDEA Part B – Disability Categories and Demographics
Percentage of children ages 3-5 served under IDEA, Part B, by disability category (Fall 2012)
• Speech or language impairments (44.7%)
• Developmental Delay (37.2%)
• Autism (7.8%)
• Other disabilities combined (10.3%)
45%
37%
8%
10%
Speech or language impairments
Developmental delay
Autism
Other disabilities combined
SPEDCHAT WEBINAR SERIES
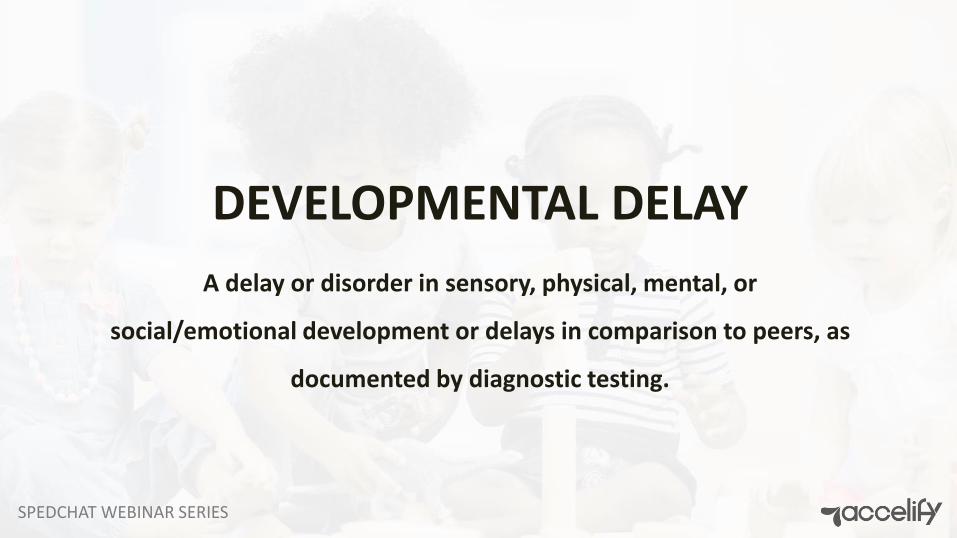
DEVELOPMENTAL DELAY
A delay or disorder in sensory, physical, mental, or
social/emotional development or delays in comparison to peers, as
documented by diagnostic testing.

SPEDCHAT WEBINAR SERIES
IDEA Part B – Disability Categories and Demographics
Developmental Delay
• IDEA allows states to:
• Use this eligibility category up to age 9
• Establish their own criteria such as developmental inventories and/or informed clinical opinion
*IDEA - Section 1402: Young children who may later be identified as Learning Disabled are frequently included in this category.

SPEDCHAT WEBINAR SERIES
IDEA Part B – Disability Categories and Demographics
Other Disabilities Combined Includes:
• Deaf-Blindness (<0.05%)
• ED (0.4%)
• Hearing Impairments (1.3%)
• Intellectual Disabilities (2.0%)
• Multiple Disabilities (1.1%)
• Orthopedic Impairments (0.9%)
• OHI (2.9%)
• SLD (1.2%)
• TBI (0.1%)
• Visual Impairments (0.4%)

SPEDCHAT WEBINAR SERIES
IDEA Part B – Disability Categories and Demographics
Race/ethnicityChild count in 49 states, DC, and
BIE schools
Resident population ages 3 through 5 in 49
states and DCRisk index (%)
Risk index for all other racial/ethnic groups
combined (%)Risk ratio
American Indian or Alaska Native
8,577 104,993 8.2 6.0 1.4
Asian 23,082 563,266 4.1 6.1 0.7
Black or African American 102,677 1,689,886 6.1 6.0 1.0
Hispanic/Latino 163,970 3,110,463 5.3 6.3 0.8
Native Hawaiian or Other Pacific Islander
2,112 24,044 8.8 6.0 1.5
White 399,008 6,168,348 6.5 5.6 1.2
Two or more races 36,770 542,162 6.8 6.0 1.1
Total 6,736,195 12,203,162 6.0 † †
*2012 Data
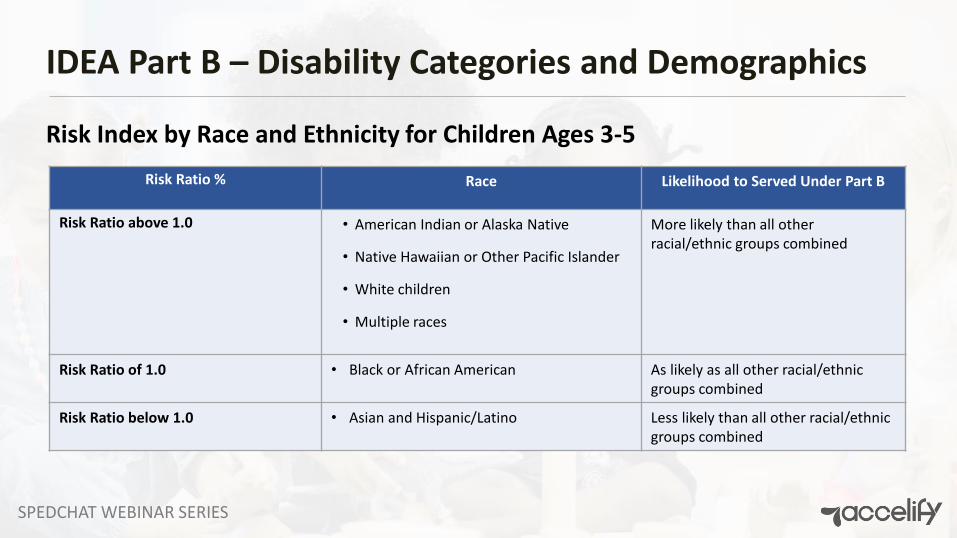
Risk Index by Race and Ethnicity for Children Ages 3-5
SPEDCHAT WEBINAR SERIES
IDEA Part B – Disability Categories and Demographics
Risk Index by Race and Ethnicity for Children Ages 3-5
Risk Ratio % Race Likelihood to Served Under Part B
Risk Ratio above 1.0 • American Indian or Alaska Native
• Native Hawaiian or Other Pacific Islander
• White children
• Multiple races
More likely than all other racial/ethnic groups combined
Risk Ratio of 1.0 • Black or African American As likely as all other racial/ethnicgroups combined
Risk Ratio below 1.0 • Asian and Hispanic/Latino Less likely than all other racial/ethnicgroups combined

SPEDCHAT WEBINAR SERIES
IDEA Part B – Disability Categories and Demographics
Children Ages 3-5 Served Under IDEA Part B by Educational Environment
• Regular early childhood program at least 10 hrs/week:
• Majority in program (37.2%)
• Majority elsewhere (17.4%)
• Regular early childhood program less than 10 hrs/week:
• Majority in program (5.3%)
• Majority elsewhere (5.1%)
• Separate Class (23.6%)
• Service provider location or some other location (6.5%)
• Other environments (4.9%)
37%
17%5%
5%
24%
7%5%
At least 10 hrs/wk - majority At least than 10 hrs/wk - elsewhere
Less than 10 hrs/wk - majority Less than 10 hrs/wk - elsewhere
Separate class Service provider location other
Other environments

SPEDCHAT WEBINAR SERIES
IDEA Part B – Disability Categories and Demographics
Children Ages 3-5 Served Under IDEA Part B by Educational Environment
• Regular early childhood program for some amount of time (65%)
• Separate Class (23.6%)
• Service provider location or some other location (6.5%)
• Other environments (4.9%)
• Separate school
• Residential facility
• Home
65%
24%
6%5%
Regular early childhood programSeparate classService provider location otherOther environments
SPEDCHAT WEBINAR SERIES
ESSA

SPEDCHAT WEBINAR SERIES
ESSA
Summary
• Standards
• Assessments
• Accountability Systems
• Public Reporting
• Teachers and Leaders
• Funding

SPEDCHAT WEBINAR SERIES
ESSA
Fiscal Requirements
• Supplement, not supplant (Sec. 1118)
• LEAs must demonstrate their methodology to allocate state and local funds to schools

SPEDCHAT WEBINAR SERIES
ESSA
Title II
Professional development (teachers, principals, school leaders)
Literacy Education for All, Results for the Nation (LEARN)
• Comprehensive birth through grade 12 literacy program
• Targets high-needs schools with greater percentage of children reading/writing below grade level
• All sections address SWDs
21st Century Community Learning Centers, charter, and magnet school programs
Family engagement program
• Statewide grants to carry out parent education and family engagement
• Training and technical assistance to states, LEAs, schools, and organizations

SPEDCHAT WEBINAR SERIES
ESSA
PreK Funding$250 million Preschool Development Grant program focused on children from low-income or vulnerable backgrounds
• Coordinate existing learning programs• Improve preschool program• Expand access• Strengthen transition to elementary school
SPEDCHAT WEBINAR SERIES
PROGRAM MODELS

SPEDCHAT WEBINAR SERIES
Program Models
Pay for Success Initiative (in ESSA): a performance-based grant, contract, or cooperative agreement awarded by a public entity in which a commitment is made to pay for improved outcomes that result in social benefit and direct cost savings or cost avoidance to the public sector.
SPEDCHAT WEBINAR SERIES
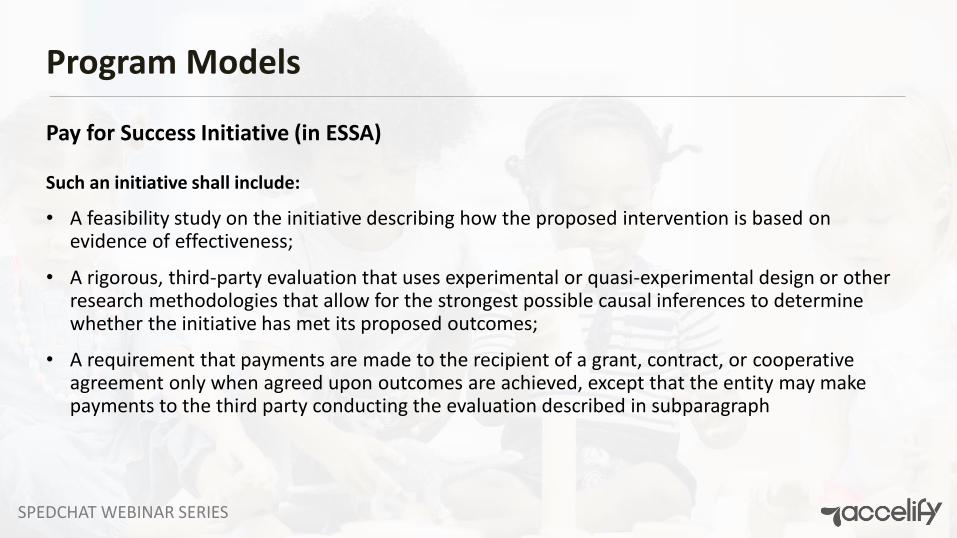
Program Models
Pay for Success Initiative (in ESSA)
Such an initiative shall include:
• A feasibility study on the initiative describing how the proposed intervention is based on evidence of effectiveness;
• A rigorous, third-party evaluation that uses experimental or quasi-experimental design or other research methodologies that allow for the strongest possible causal inferences to determine whether the initiative has met its proposed outcomes;
• A requirement that payments are made to the recipient of a grant, contract, or cooperative agreement only when agreed upon outcomes are achieved, except that the entity may make payments to the third party conducting the evaluation described in subparagraph

SPEDCHAT WEBINAR SERIES
Program Models
Pay for Success Initiative (in ESSA)
Specific interventions
“are not spelled out… allowing providers the flexibility to adopt whatever strategies they determine will be most effective,”
noting also that, in some cases, “private investment provides upfront financing, taking on the risk that the intervention won’t
succeed and recovering the investment if it does.”

SPEDCHAT WEBINAR SERIES
Program Models
Pay for Success Initiative (in ESSA)
Also found in:
• Title I, Part D, (“Prevention and Intervention Programs for Children and Youth Who Are Neglected, Delinquent, or At Risk”)
• In Title IV, Part A, (“Student Support and Academic Enrichment Grants,” section 4108, “Activities to Support Safe and Healthy Students”) of the new bill.

SPEDCHAT WEBINAR SERIES
Program Models
Pay for Success Initiative (in ESSA)
• Not a mandate but an allowable use option that state and LEAs can choose to incorporate into how they structure funding decisions — using outcomes as the driver of payment allocation
• Is just one instrument in the education system's general toolkit, aimed at helping children.
• Expands funding for high-quality programs that actually deliver results, leading to greater benefits for students
SPEDCHAT WEBINAR SERIES
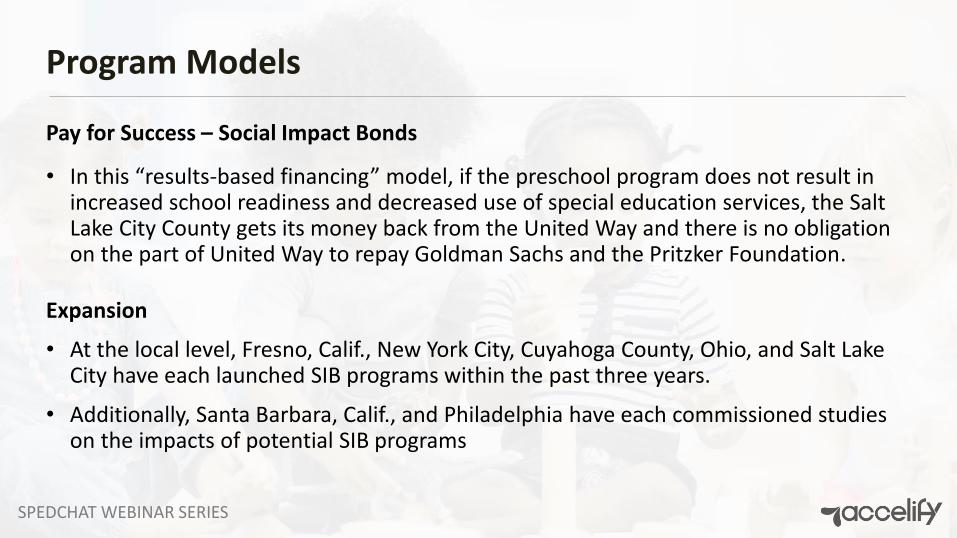
Program Models
Pay for Success – Social Impact Bonds
• In this “results-based financing” model, if the preschool program does not result in increased school readiness and decreased use of special education services, the Salt Lake City County gets its money back from the United Way and there is no obligation on the part of United Way to repay Goldman Sachs and the Pritzker Foundation.
Expansion
• At the local level, Fresno, Calif., New York City, Cuyahoga County, Ohio, and Salt Lake City have each launched SIB programs within the past three years.
• Additionally, Santa Barbara, Calif., and Philadelphia have each commissioned studies on the impacts of potential SIB programs
SPEDCHAT WEBINAR SERIES
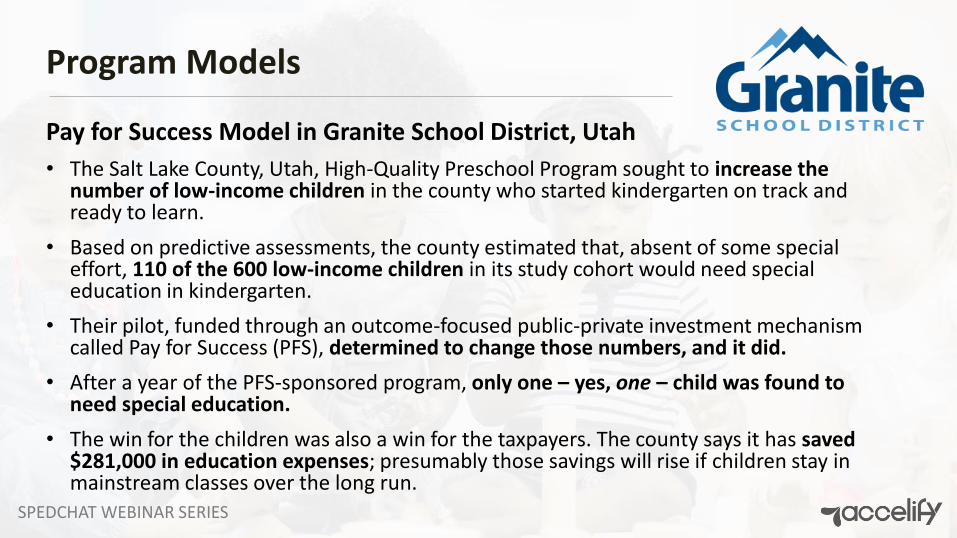
Program Models
Pay for Success Model in Granite School District, Utah
• The Salt Lake County, Utah, High-Quality Preschool Program sought to increase the number of low-income children in the county who started kindergarten on track and ready to learn.
• Based on predictive assessments, the county estimated that, absent of some special effort, 110 of the 600 low-income children in its study cohort would need special education in kindergarten.
• Their pilot, funded through an outcome-focused public-private investment mechanism called Pay for Success (PFS), determined to change those numbers, and it did.
• After a year of the PFS-sponsored program, only one – yes, one – child was found to need special education.
• The win for the children was also a win for the taxpayers. The county says it has saved $281,000 in education expenses; presumably those savings will rise if children stay in mainstream classes over the long run.
SPEDCHAT WEBINAR SERIES
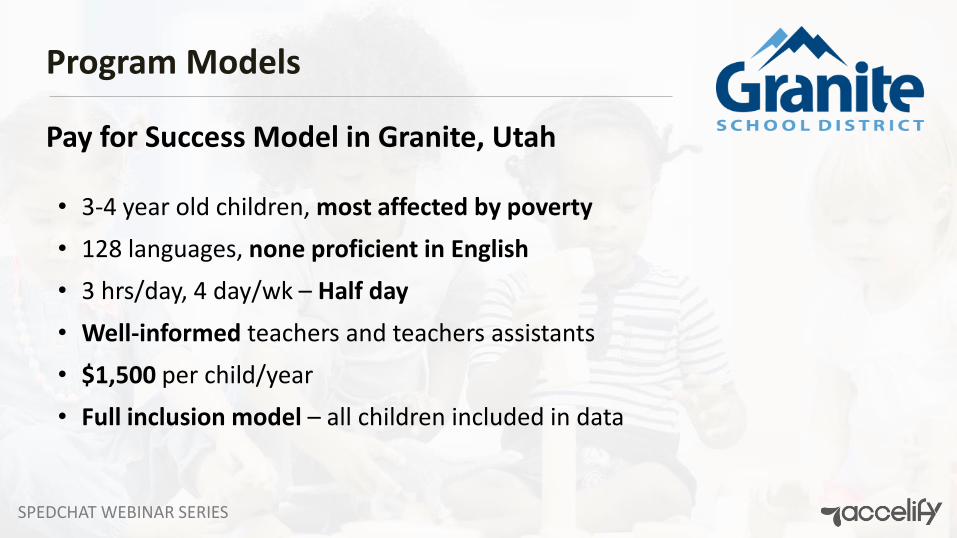
Pay for Success Model in Granite, Utah
• 3-4 year old children, most affected by poverty
• 128 languages, none proficient in English
• 3 hrs/day, 4 day/wk – Half day
• Well-informed teachers and teachers assistants
• $1,500 per child/year
• Full inclusion model – all children included in data
Program Models

SPEDCHAT WEBINAR SERIES
Social Impact Bonds
At the beginning of their 9th year:
• 12-hour a week intervention
• 34,000 children in study; replicated in YMCAs, charter schools, daycares, Head Start
• 180 languages in study, none proficient English
• Lowered SPED referral rate from 30% to 1%
• Cost savings over $3 million
• Sustained gains with no support post PreK
• Received over $8 million to extend study
Program Models

SPEDCHAT WEBINAR SERIES
Social Impact Bonds
Program Funding:
• Focus on evidence of effectiveness and sustained gains
• $7 million loan from Goldman Sachs and the Pritzker Foundation to the Granite School District to replicate and expand model
• Added 600 children, Sept. 1, 2013
• Added 1000 children, Sept. 1, 2014
• Added 1000 children, Sept. 1, 2015
Program Models

SPEDCHAT WEBINAR SERIES
Social Impact Bonds
Compare Costs to Benefits
• Abecedarian Project: $39,672/child
• Chicago CPC: $5372/child, half day
• Perry Preschool: $17,526/child
• Tulsa, OK: $4403/child, half day
• Tulsa, OK: $8803/child, full day
Program Models
Granite Study$1500/child, 3-hr day

SPEDCHAT WEBINAR SERIES
Program Models
Head Start
• ECE affects children’s school readiness and long-term outcomes
• 173 Head Start centers
• 4,667 children in study
• 2,559 three year olds
• 2,108 four year olds
*Head Start Impact Study, USDHHS, NHS, 2010

SPEDCHAT WEBINAR SERIES
Program Models
Head Start Impact Study Summary
• 4 year olds language and literacy faded
• No increase in math or pre-writing skills
• Slight gains did not lead to long-term gains in elementary school
• No affect for children attending HS for 2 years (entered at age 3)
Funding
• Fiscal budget in 2011 was $8.2 billion
*Head Start Impact Study, USDHHS, NHS, 2010

SPEDCHAT WEBINAR SERIES
WHAT WE KNOW

SPEDCHAT WEBINAR SERIES
What We Know…
“There is a greater tragedy than being labeled as a slow learner - and that
is being treated as one.”

SPEDCHAT WEBINAR SERIES
“Children are eager and capable learners…”

SPEDCHAT WEBINAR SERIES
Research (Hart & Risley, 1995)
Words Heard per hour Affirmatives per hour Prohibitions per hour
Professional family child
2153 32 5

SPEDCHAT WEBINAR SERIES
Research (Hart & Risley, 1995)
Words Heard per hour Affirmatives per hour Prohibitions per hour
Professional family child
2153 32 5
Working class child 1251 12 7

SPEDCHAT WEBINAR SERIES
Research (Hart & Risley, 1995)
Words Heard per hour Affirmatives per hour Prohibitions per hour
Professional family child
2153 32 5
Working class child 1251 12 7
Child living in poverty
616 5 11
SPEDCHAT WEBINAR SERIES
“Early learning begets later learning and early success breeds later success…The later in life we attempt to
repair early deficits, the costlier remediation becomes…”
James Heckman, Nobel Prize-Winner, Economics, 2000

SPEDCHAT WEBINAR SERIES
A longitudinal study of 407 students found that 74% of the children whose difficulty in reading was first
identified at nine years of age or older continued to read in the lowest quintile throughout their middle and high
school years.

SPEDCHAT WEBINAR SERIES
WHAT WE NEED

SPEDCHAT WEBINAR SERIES
Shift in Thinking
From… To…
StudentWhich students need help?
What help does EACH student need?
SystemCategorical program and
people availableIntention design based on services
and resources needed

SPEDCHAT WEBINAR SERIES
What We Need
• All students achieving to high standards by being provided sufficient time and support
• All low performing students being provided focused instruction
• All teachers teaching students to high standards by being given the right conditions and assistance
• All teachers intervening in the learning process when there is an indication of a failure to learn
• All teachers focusing early intervention resources on the early years of schooling
• All good first instruction being provided by the classroom teacher
*Leadership Compass, Fall 2006, National Association of School Principals
SPEDCHAT WEBINAR SERIES
HOW WE GET THERE
SPEDCHAT WEBINAR SERIES
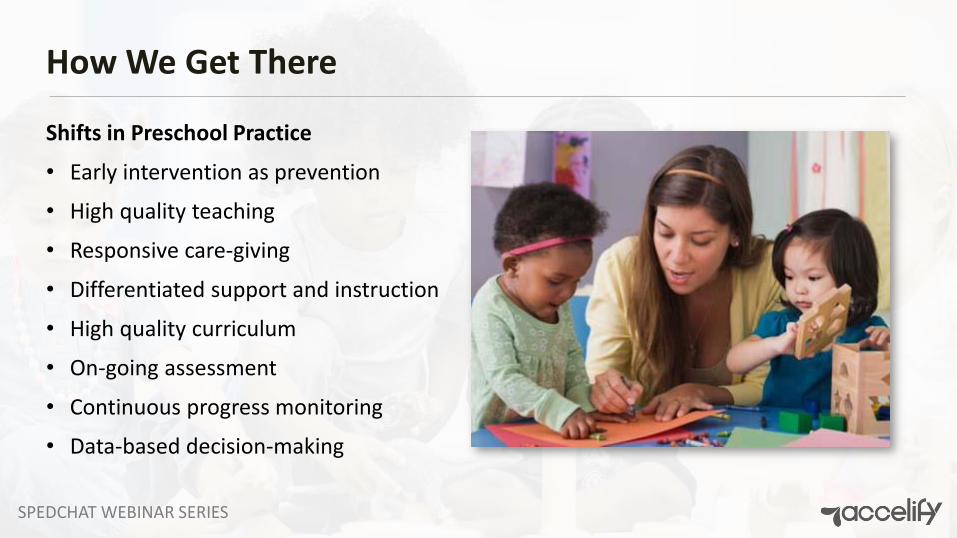
How We Get There
Shifts in Preschool Practice
• Early intervention as prevention
• High quality teaching
• Responsive care-giving
• Differentiated support and instruction
• High quality curriculum
• On-going assessment
• Continuous progress monitoring
• Data-based decision-making

SPEDCHAT WEBINAR SERIES
How We Get There
What Creates Sustained Gains?
• Evidence-based decision making
• Changes in teaching and practice
• Proven-effective curriculum
• Professional development
• Monitoring progress

SPEDCHAT WEBINAR SERIES
How We Get There
Quality preschool program have common characteristics
• Clear expectations and goals
• Leadership & support
• Classroom management
• Proven effective curriculum
• Evidence-based teaching/practice
• Progress monitoring
• Close gaps and sustain gains

To learn more about Accelify and find out about future webinars, events, and news, visit www.accelify.com or follow us on social media.
Thank you.
For additional information, contact:[email protected]
SPEDCHAT WEBINAR SERIESBuild knowledge. Gain expertise. Share best practices.