prejudice and wages: an empirical assessment ... -...
TRANSCRIPT
773
[ Journal of Political Economy, 2008, vol. 116, no. 5]� 2008 by The University of Chicago. All rights reserved. 0022-3808/2008/11605-0004$10.00
Prejudice and Wages: An Empirical Assessmentof Becker’s The Economics of Discrimination
Kerwin Kofi Charles and Jonathan GuryanUniversity of Chicago and National Bureau of Economic Research
We test the predictions from Becker’s (1957) seminal work on em-ployer prejudice and find that relative black wages (a) vary negativelywith the prejudice of the “marginal” white in a state, (b) vary negativelywith the prejudice in the lower tail of the prejudice distribution butare unaffected by the prejudice of the most prejudiced persons in astate, and (c) vary negatively with the fraction of a state that is black.Our estimates suggest that one-quarter of the racial wage gap is dueto prejudice, with nontrivial consequences for black lifetime earnings.
I. Introduction
Becker’s (1957) seminal The Economics of Discrimination launched theformal analysis of labor market discrimination among economists.Becker’s analysis focused on the relationship between racial prejudiceamong whites and discrimination against racial minorities in a com-petitive model. In contrast to much of the contemporaneous literature,Becker formalized the definition of racial preferences, depicting them
We thank Gary Becker, John Bound, Charlie Brown, Henry Farber, Larry Katz, KevinLang, Kevin Murphy, and Paul Oyer for helpful discussions regarding this work; seminarparticipants at the University of Chicago, Harvard, Wharton, City University of New York,Yale, Brown, the Institute for Research on Poverty, Princeton, the University of Georgia,Case Western, Brigham Young, University of Illinois–Chicago, Massachusetts Institute ofTechnology, University of California at Davis, and the University of Wisconsin–Madisonfor their suggestions; and Andrea Civelli and Phil Wengerd for research assistance. Guryanthanks the University of Chicago Graduate School of Business and the Industrial Relationsand Education Research Sections at Princeton University for research support. This re-search was also funded in part by the George J. Stigler Center for the Study of the Economyand the State at the University of Chicago Graduate School of Business. All errors are ourown.
774 journal of political economy
as an aversion to cross-racial interaction. In a series of models, he an-alyzed the effect of the possession of such preferences among customers,coworkers, and employers on black relative wages. Since the publicationof Becker’s work, discrimination has been one of the most intenselystudied topics in economics; theorists have posited different explana-tions for racial wage gaps, including many that do not depend on racialanimus, and there have been hundreds of empirical studies devoted tomeasuring and attempting to explain wage differences.1 Yet, curiously,in the massive and growing discrimination literature, there is no paperof which we are aware that tests the sharp yet subtle predictions ofBecker’s original prejudice model about the relationship between racialwage gaps and prejudice.2 In this paper, we attempt to address thisomission.
In the short-run version of Becker’s employer discrimination model,racial prejudice causes some employers to regard black workers as moreexpensive than they truly are. Market pressures cause blacks to be hiredby the least prejudiced employers in the market and to sort away fromthose with the highest levels of prejudice. In equilibrium, Becker showsthat black relative wages are determined by the most prejudiced em-ployer with whom they come into contact—the marginal discriminator.Racial wage gaps, in Becker’s formulation, are determined by the prej-udice of this marginal person, and not by the average level of prejudiceamong all employers. More generally, given the sorting mechanism de-scribed above and since blacks constitute a relatively small share of thelabor force in almost every labor market, wage gaps will generally bedetermined by variation in the level of prejudice of those in the lowertail of the prejudice distribution; how prejudiced the most prejudicedemployers are should not matter at all for wages in Becker’s framework.Finally, since the ease with which blacks are sorted to less prejudicedfirms varies inversely with the number of blacks in the market, with thelevel of prejudice held constant, equilibrium wages for blacks shouldvary negatively with the number of blacks in the market.
Despite its sharp predictions, one possible reason that Becker’smodel’s predictions about the connection between prejudice and wageshave not been empirically tested is Arrow’s (1972) famous criticism.Arrow argues that since prejudiced employers sacrifice profits by dis-criminating, such employers are ultimately driven from the market in
1 Some key explanations for discrimination that do not depend on racial prejudiceinclude imperfect information in statistical discrimination models (Phelps 1972; Aignerand Cain 1977; Altonji and Pierret 2001) and racial difference in productivity (O’Neill1990; Neal and Johnson 1996).
2 Although there has been very little work in economics studying racial prejudice directly,two exceptions are Cutler, Glaeser, and Vigdor (1999) and Card, Mas, and Rothstein(2008). Both of these papers study the relationship between prejudice and residentialracial segregation but do not examine the wage relationships that are our focus.
prejudice and wages 775
the long run in a competitive setting. Indeed, Arrow memorably re-marked that the employer discrimination model “predicts the absenceof the phenomenon it was designed to explain” (192). However, casualempiricism suggests that prejudicial feelings of the most odious sortwere a feature of the American landscape for many scores of years, andlogic dictates that these views have had something to do with racialdiscrimination against minorities. Moreover, Arrow himself and manysubsequent authors have shown that the connection between prejudiceand wages posited by Becker can survive in the long run if the marketis not perfectly competitive, if there are important nonconvexities, orif there are informational problems. In other work (Charles and Guryan2007), we show that the relationship between racial distaste and wagegaps can even survive perfect competition, as long as prejudicial tastesare portable across labor market roles, that is, that prejudiced employersremain prejudiced when they shut down a firm and become prejudicedworkers.
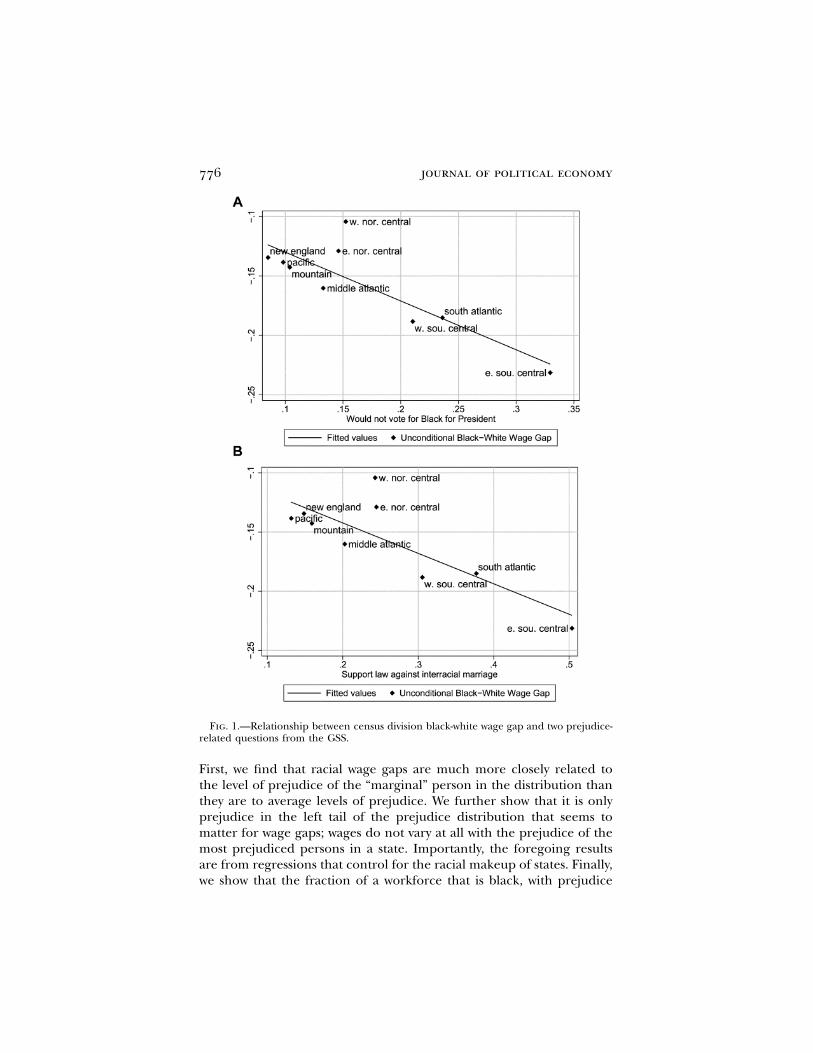
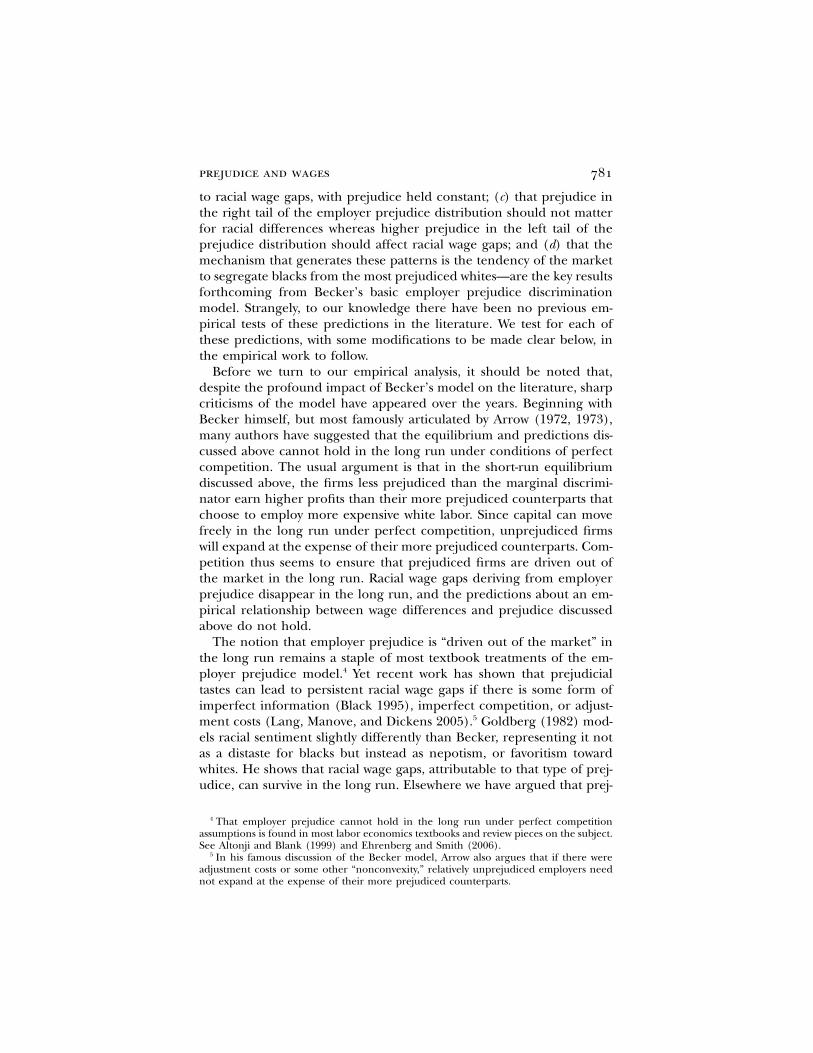
Supporting the view that prejudice may matter for wage determina-tion, consider figure 1, in which we relate the black-white wage gap ineach of the nine census divisions to the mean response among whitesin those divisions to two questions from the General Social Survey (GSS)about racial prejudice. The figure shows that blacks have much lowerrelative wages in places in which a higher fraction of whites reportopposing interracial marriage or whites would not vote for a black pres-ident. These figures do not confirm that a mechanism like that outlinedby Becker links prejudice and wages, but they are suggestive of such arelationship.3
Our empirical work is motivated by two related questions. First, towhat extent is the relationship between racial wage gaps consistent withthe predictions of the Becker prejudice model? Second, how large arole does racial prejudice play in generating observed wage gaps? Inour analysis we use the rich information on racial sentiments availablein multiple waves of data from the GSS. We summarize this informationon racial prejudice, describing its levels among different subgroups ofwhites and its evolution over time. In a series of analyses, we relateprejudice among whites in a state to the observed racial wage gap, usingwage data from the Current Population Survey (CPS). The data provideoverwhelming support for each of the predictions of Becker’s model.
3 Further potential evidence about the possible importance of racial prejudice may befound in a widely known recent study by Bertrand and Mullainathan (2004), who findthat resumes with black-sounding names sent to potential employers received fewer call-backs than other resumes. Although statistical discrimination might account for theseresults as suggested by later results on naming conventions studied by Fryer and Levitt(2004), the fact that so many personal traits of likely interest to employers are explicitlycontrolled for on the false resumes leaves open the possibility that some other force, suchas racial prejudice, might be at work.
776 journal of political economy
Fig. 1.—Relationship between census division black-white wage gap and two prejudice-related questions from the GSS.
First, we find that racial wage gaps are much more closely related tothe level of prejudice of the “marginal” person in the distribution thanthey are to average levels of prejudice. We further show that it is onlyprejudice in the left tail of the prejudice distribution that seems tomatter for wage gaps; wages do not vary at all with the prejudice of themost prejudiced persons in a state. Importantly, the foregoing resultsare from regressions that control for the racial makeup of states. Finally,we show that the fraction of a workforce that is black, with prejudice
prejudice and wages 777
in the state held constant, is strongly negatively related to racial wagegaps, just as the prejudice model predicts.
These results are robust to a variety of robustness tests and extensions.On the whole, our results are broadly suggestive of an important rolefor racial prejudice among whites in explaining differential labor marketoutcomes by race. In a series of calculations, we show that about one-quarter of the unconditional wage gap may be attributable to racialprejudice. We also show that the associated lifetime earnings costs borneby blacks in places in which the marginal white is more prejudiced arenot small: the discounted cost of living in such areas is between $34,000and $115,000, depending on the intensity of the prejudice of the mar-ginal white in their states.
The remainder of the paper proceeds as follows. Section II brieflyreviews Becker’s employer racial distaste model. Section III summarizesthe data used in the paper. Section IV presents the paper’s main em-pirical results. In Section V we discuss the main alternative interpretationof our results—that prejudice is correlated with unmeasured racial skilldifferences—and present the results of our attempts to deal with thisproblem by directly controlling for skill quality differences and throughthe use of instrumental variables. Section VI presents conclusions.
II. Theoretical Overview: Becker’s Employer Discrimination Model
Predictions from Becker’s (1957) seminal work on employer prejudiceare the foundation of the empirical analysis we conduct in this paper.In this section, we briefly review the key results from his basic model.We then discuss criticisms and extensions of the basic model that haveappeared in the literature.
Throughout his analysis, Becker assumes a perfectly competitive en-vironment, with production that is constant returns to scale. To focusattention on demand-side considerations, white (a) and black (b) work-ers are assumed to be perfect substitutes in production. Employers areassumed to be white and are differentially racially prejudiced. Beckerrepresents prejudice as a distaste for, or aversion to, cross-racial contact.Thus, an employer’s utility, , depends both on his profit and on theVi
number of blacks he employs, with each black worker he hires bringinghim disutility of . Employer utility is therefored ≥ 0i
V p p � d L , (1)i i i b
where is the employer’s profit; andp p f(L � L ) � w L � w L wi a b a a b b a
denote white and black wages, respectively; and is the constantw f(7)b
returns to scale production function. Employers choose white and blacklabor ( and ) to maximize (1).L La b
778 journal of political economy
The utility-maximizing choices, and , satisfy the following con-L* L*a b
ditions:
′f (L* � L*) � w ≤ 0, with equality if L* 1 0,b a a a
′f (L* � L*) � w � d ≤ 0, with equality if L* 1 0. (2)b a b i b
Condition (2) says that if an employer hires a particular type of laborat all, he does so up to the point at which its marginal product equalsits marginal cost, as assessed by the employer. For white labor this mar-ginal cost is the wage ; for black labor it is the wage of blacks pluswa
the employer’s prejudice, or . This result captures the essencew � db i
of Becker’s insight: prejudice causes an employer to behave as if blackworkers’ monetary wages are higher than they actually are. Since thetwo types of labor are perfect substitutes, (2) implies that an employerhires only white workers if his prejudice is such that andw ! w � da b i
hires only black workers otherwise. These hiring rules mean that marketpressures tend to sort prejudiced persons away from the object of theirprejudice: for any given level of wages, blacks are hired by the leastprejudiced employers in the market, and whites are hired by the mostprejudiced.
Equilibrium in the short run requires that the markets for white andblack workers clear, at equilibrium wages and . Assuming a suf-w* w*a b
ficiently smooth distribution of prejudice, some employer will be justindifferent between hiring black and white workers. The prejudice ofthis “marginal discriminator,” , is in fact equal to the equilibriumd*iracial wage gap, since his being indifferent about the race of workershe hires at equilibrium wages implies
w* p w* � d*. (3)a b i
Employers more prejudiced than the marginal discriminator hire onlywhites; those less prejudiced than hire only blacks, and the marketsd*ifor both black and white workers clear in equilibrium.
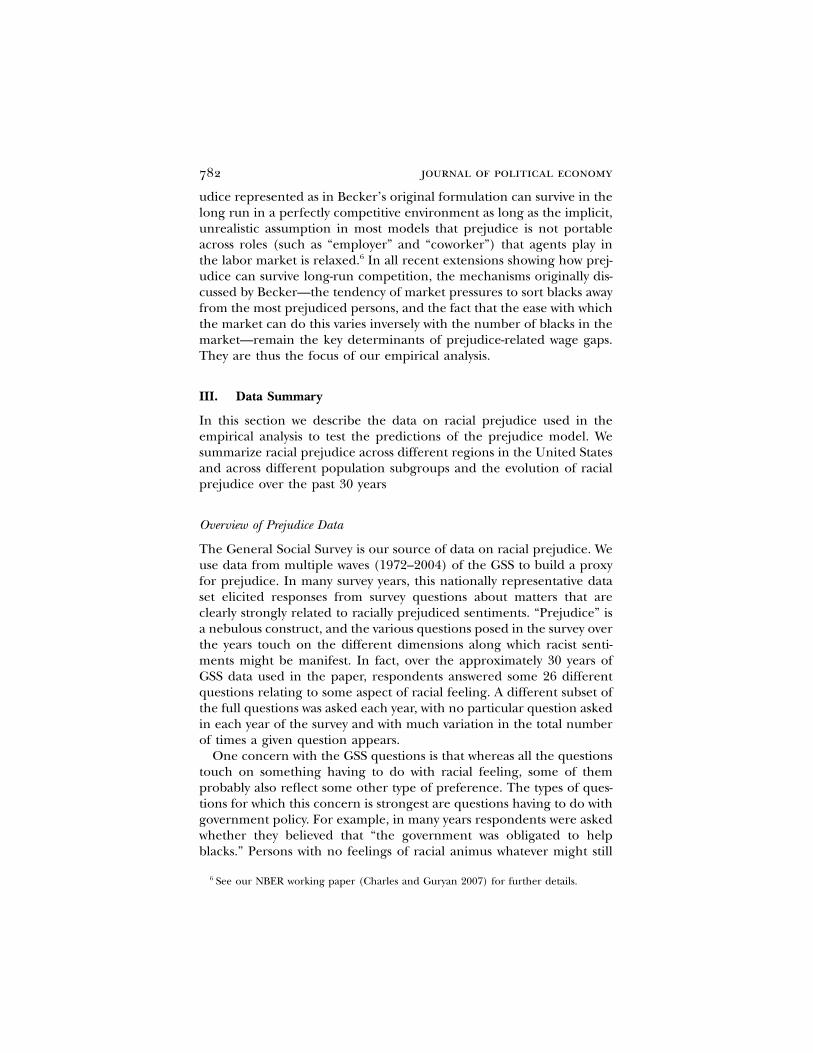
Becker’s simple, competitive framework yields a number of sharp yetsubtle predictions about prejudice and equilibrium racial wage gaps.The first is that the equilibrium racial wage gap is not determined bythe average level of prejudice among all employers. The foregoing showsthat black wages are determined by the prejudice of the most prejudicedemployer with whom blacks interact in equilibrium. Since blacks are,in utility terms, cheapest to the least prejudiced employers, they arehired first by these employers. The most prejudiced employer who hiresblacks—the marginal discriminator—has, in general, less prejudice thanthe mean prejudice among all employers in the market. Indeed, as seenin figure 2, the equilibrium wage gap might be zero if there are manyprejudiced employers in the market, as long as the supply of blacks and
prejudice and wages 779
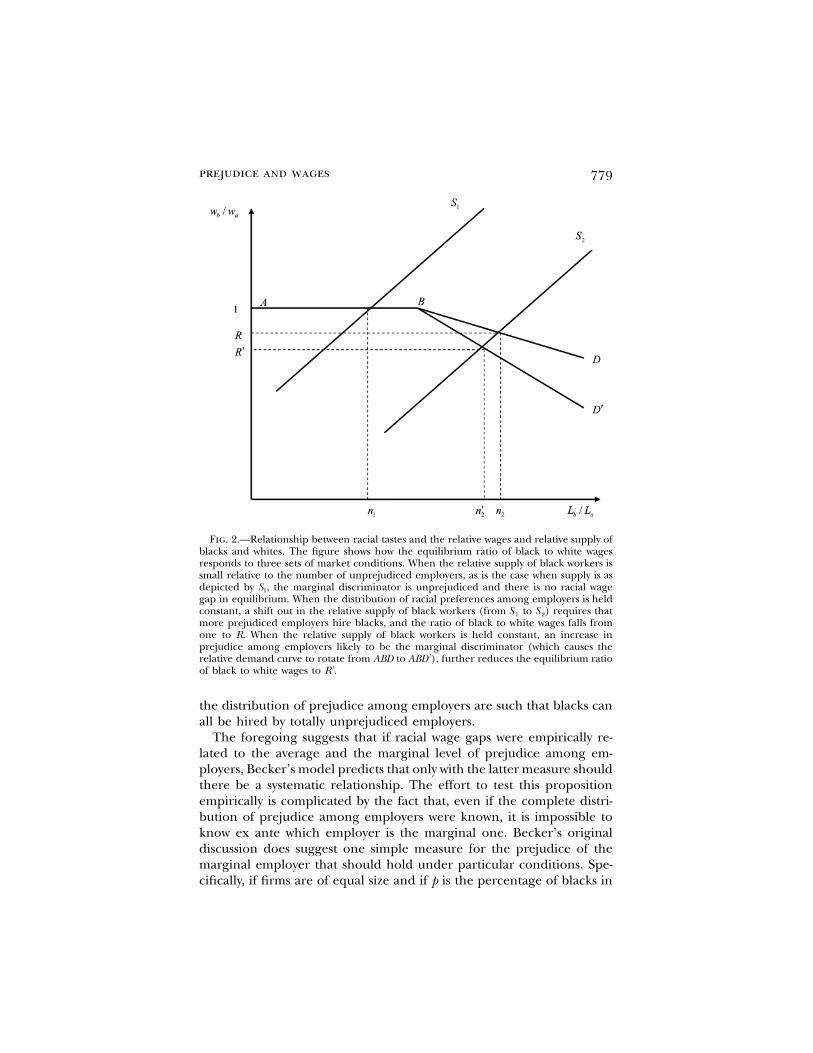
Fig. 2.—Relationship between racial tastes and the relative wages and relative supply ofblacks and whites. The figure shows how the equilibrium ratio of black to white wagesresponds to three sets of market conditions. When the relative supply of black workers issmall relative to the number of unprejudiced employers, as is the case when supply is asdepicted by , the marginal discriminator is unprejudiced and there is no racial wageS1
gap in equilibrium. When the distribution of racial preferences among employers is heldconstant, a shift out in the relative supply of black workers (from to ) requires thatS S1 2
more prejudiced employers hire blacks, and the ratio of black to white wages falls fromone to R. When the relative supply of black workers is held constant, an increase inprejudice among employers likely to be the marginal discriminator (which causes therelative demand curve to rotate from ABD to ), further reduces the equilibrium ratio′ABDof black to white wages to .′R
the distribution of prejudice among employers are such that blacks canall be hired by totally unprejudiced employers.
The foregoing suggests that if racial wage gaps were empirically re-lated to the average and the marginal level of prejudice among em-ployers, Becker’s model predicts that only with the latter measure shouldthere be a systematic relationship. The effort to test this propositionempirically is complicated by the fact that, even if the complete distri-bution of prejudice among employers were known, it is impossible toknow ex ante which employer is the marginal one. Becker’s originaldiscussion does suggest one simple measure for the prejudice of themarginal employer that should hold under particular conditions. Spe-cifically, if firms are of equal size and if p is the percentage of blacks in
780 journal of political economy
the workforce, the marginal employer’s prejudice will be the pth per-centile of the employer prejudice distribution. Of course, this measureof the marginal employer is an approximation and applies only undervery specific conditions. Furthermore, this measure necessarily conflatesthe two things that determine the marginal employer: the number ofblacks in the workforce and the distribution of prejudice among em-ployers. Empirically, it might be attractive to separately assess the impactof each of these components of the marginal employer on the equilib-rium wage difference.
Becker’s model yields sharp predictions about how wage gaps shouldbe separately related to these two variables. The effect of an increasein the number of blacks on equilibrium wages, all else equal, is clear.When the distribution of employer prejudice is held constant, an in-crease in the number of black workers means that blacks will, in equi-librium, have to be sorted to ever more prejudiced employers, so thatthe marginal employer is ever more prejudiced. This is illustrated infigure 2 by a shift of the relative supply curve from to , reducingS S1 2
relative wages from one to R. The equilibrium wage gap should thusbe increasing in the number of blacks in the market, with employerprejudice held constant.
The effect of a ceteris paribus increase in employer prejudice is moresubtle and depends on where in the distribution of prejudice that in-crease comes from. Since market pressures sort blacks to the least prej-udiced employers first, holding constant the number of blacks and in-creasing the prejudice of the most prejudiced employers in the marketshould not affect who the marginal employer is and thus should notaffect the equilibrium wage gap. However, an increase in the prejudiceof the least prejudiced employers while holding the number of blackworkers constant may make the marginal employer more prejudicedand thus increase the equilibrium wage gap. Such an increase in prej-udice among those likely to be the marginal employer is illustrated infigure 2 by the rotation of the relative demand curve from ABD to
, thereby reducing relative wages from R to . An increase in′ ′ABD Rprejudice among the most prejudiced would cause the relative demandcurve to rotate beginning beyond the point at which it intersects supply.In general, higher levels of prejudice in the right tail (higher percen-tiles) of the employer prejudice distribution should not affect equilib-rium wages, whereas because of the sorting of blacks toward less prej-udiced employers predicted by the model, relative black wages shouldfall as prejudice increases in the lower percentiles of the employer prej-udice distribution.
Jointly, these predictions—(a) that the marginal employer mattersmore than the average prejudice for relative wage differences; (b) thatthe number (or fraction) of blacks in the workforce is negatively related
prejudice and wages 781
to racial wage gaps, with prejudice held constant; (c) that prejudice inthe right tail of the employer prejudice distribution should not matterfor racial differences whereas higher prejudice in the left tail of theprejudice distribution should affect racial wage gaps; and (d) that themechanism that generates these patterns is the tendency of the marketto segregate blacks from the most prejudiced whites—are the key resultsforthcoming from Becker’s basic employer prejudice discriminationmodel. Strangely, to our knowledge there have been no previous em-pirical tests of these predictions in the literature. We test for each ofthese predictions, with some modifications to be made clear below, inthe empirical work to follow.
Before we turn to our empirical analysis, it should be noted that,despite the profound impact of Becker’s model on the literature, sharpcriticisms of the model have appeared over the years. Beginning withBecker himself, but most famously articulated by Arrow (1972, 1973),many authors have suggested that the equilibrium and predictions dis-cussed above cannot hold in the long run under conditions of perfectcompetition. The usual argument is that in the short-run equilibriumdiscussed above, the firms less prejudiced than the marginal discrimi-nator earn higher profits than their more prejudiced counterparts thatchoose to employ more expensive white labor. Since capital can movefreely in the long run under perfect competition, unprejudiced firmswill expand at the expense of their more prejudiced counterparts. Com-petition thus seems to ensure that prejudiced firms are driven out ofthe market in the long run. Racial wage gaps deriving from employerprejudice disappear in the long run, and the predictions about an em-pirical relationship between wage differences and prejudice discussedabove do not hold.
The notion that employer prejudice is “driven out of the market” inthe long run remains a staple of most textbook treatments of the em-ployer prejudice model.4 Yet recent work has shown that prejudicialtastes can lead to persistent racial wage gaps if there is some form ofimperfect information (Black 1995), imperfect competition, or adjust-ment costs (Lang, Manove, and Dickens 2005).5 Goldberg (1982) mod-els racial sentiment slightly differently than Becker, representing it notas a distaste for blacks but instead as nepotism, or favoritism towardwhites. He shows that racial wage gaps, attributable to that type of prej-udice, can survive in the long run. Elsewhere we have argued that prej-
4 That employer prejudice cannot hold in the long run under perfect competitionassumptions is found in most labor economics textbooks and review pieces on the subject.See Altonji and Blank (1999) and Ehrenberg and Smith (2006).
5 In his famous discussion of the Becker model, Arrow also argues that if there wereadjustment costs or some other “nonconvexity,” relatively unprejudiced employers neednot expand at the expense of their more prejudiced counterparts.
782 journal of political economy
udice represented as in Becker’s original formulation can survive in thelong run in a perfectly competitive environment as long as the implicit,unrealistic assumption in most models that prejudice is not portableacross roles (such as “employer” and “coworker”) that agents play inthe labor market is relaxed.6 In all recent extensions showing how prej-udice can survive long-run competition, the mechanisms originally dis-cussed by Becker—the tendency of market pressures to sort blacks awayfrom the most prejudiced persons, and the fact that the ease with whichthe market can do this varies inversely with the number of blacks in themarket—remain the key determinants of prejudice-related wage gaps.They are thus the focus of our empirical analysis.
III. Data Summary
In this section we describe the data on racial prejudice used in theempirical analysis to test the predictions of the prejudice model. Wesummarize racial prejudice across different regions in the United Statesand across different population subgroups and the evolution of racialprejudice over the past 30 years
Overview of Prejudice Data
The General Social Survey is our source of data on racial prejudice. Weuse data from multiple waves (1972–2004) of the GSS to build a proxyfor prejudice. In many survey years, this nationally representative dataset elicited responses from survey questions about matters that areclearly strongly related to racially prejudiced sentiments. “Prejudice” isa nebulous construct, and the various questions posed in the survey overthe years touch on the different dimensions along which racist senti-ments might be manifest. In fact, over the approximately 30 years ofGSS data used in the paper, respondents answered some 26 differentquestions relating to some aspect of racial feeling. A different subset ofthe full questions was asked each year, with no particular question askedin each year of the survey and with much variation in the total numberof times a given question appears.
One concern with the GSS questions is that whereas all the questionstouch on something having to do with racial feeling, some of themprobably also reflect some other type of preference. The types of ques-tions for which this concern is strongest are questions having to do withgovernment policy. For example, in many years respondents were askedwhether they believed that “the government was obligated to helpblacks.” Persons with no feelings of racial animus whatever might still
6 See our NBER working paper (Charles and Guryan 2007) for further details.
prejudice and wages 783
respond in the negative to this question because of their views aboutthe appropriate role of government. Given the paper’s aim, it is im-perative that we focus on responses that have to do exclusively withracial sentiment. We therefore do not use any of the five questionstouching on government policy and race in our analysis. For reasonsdiscussed below, in part of the analysis we need to focus on a consistentset of prejudice questions from one year to the next.7 When necessary,we therefore focus on four questions that jointly appear most frequentlyin the survey.
Appendix table A1 lists the GSS variable abbreviation and a summaryfor each of the full set of 26 racial prejudice questions asked in thesurvey. Most questions are in boldface. Those not in bold are the gov-ernment policy questions we always exclude, and the questions markedwith an asterisk are the set of four race questions asked consistentlyacross the survey. Throughout, we use responses from whites aged 18and older, and we recode responses so that higher values correspondto more prejudiced answers.8
Much of our analysis involves comparing levels of prejudice acrossindividuals and across geographic areas. To render these comparisonsfeasible, it is obviously necessary that we somehow combine the disparateprejudice responses into a unidimensional prejudice index. We do thisby first creating an individual-level index for each GSS respondent andthen by aggregating this individual-level index in various ways at thestate and census division levels. The individual-level prejudice index isbased on an average of responses to different GSS prejudice questions.To ensure that the response to each question is measured on the samescale and weighted equally in the index, we normalize the mean andstandard deviation of each of the GSS prejudice questions. Then, foreach GSS respondent, we compute the average of his or her normalizedresponse to each question.
Formally, let denote respondent i’s response in year t to the par-kdit
ticular prejudice question k. For each dimension of prejudice k and for
7 Although government policy questions are not included in our analysis, we find thatthey exhibit the same time-series properties and variation across states and regions as theprejudice questions we use.
8 In most cases, this recoding is straightforward (e.g., those who would not vote for anotherwise qualified black person for president are more prejudiced than those who would).In some cases the ordering of responses is less clear (e.g., those who think that the federalgovernment is spending too much improving the conditions of blacks may not be prej-udiced; they may think that the federal government is spending too much on everything).However, in each case we think that it is clear which response was meant to denote greaterprejudice.
784 journal of political economy
each individual i we create a normalized individual response in year tgiven by
k kd � E[d ]it i,77kd̃ p , (4)it k�Var (d )i,t*k
where is the first year in which the prejudice question k was askedt*kin the GSS. The normalized measure thus subtracts off from individualresponses to each question the mean of the responses to that questionin 1977 and divides by the standard deviation of answers measured inthe first year the question was asked. We normalize by the standarddeviation in the first year the question was asked rather than, say, theoverall standard deviation because we want to avoid a mechanical re-lationship between trends in responses and the weight the questionreceives in the overall aggregate. We choose 1977 as the normalizationyear because it was the year in which the largest number of prejudicequestions were asked. Two prejudice questions (HELPBLK andRACOPEN in the table) were not asked in 1977 but were asked in bothprior and subsequent years. A linearly interpolated mean is subtractedfor these variables instead of the 1977 mean.
These normalized responses, which are all measured on the samescale, are then aggregated into a one-dimensional aggregate prejudiceindex for individual i in year t by taking their average in the year, or
k˜D p d /K , (5)�it it tk
where is the number of prejudice questions asked in year t.Kt
To test the predictions of the prejudice model across different geo-graphic regions, we use several measures of the prejudice among whitesin a community. We compute aggregate measures of prejudice from
, which is the residual from a regression of on a full set of yearD̃ Dit it
dummies. The first measure of aggregate prejudice in a community—denoted “average” prejudice—is simply the mean across all years of
for whites in a particular geographic area. Another set of measuresD̃it
captures prejudice at different percentile points in the overall prejudicedistribution in a state. We use the 10th, 50th, and 90th percentiles ofthe distribution of within a state. Finally, we create an approximationD̃it
to the prejudice of the “marginal” white discriminator in the distribu-tion. As noted in the theory overview, under specific conditions, themarginal is well approximated by the pth percentile of the distribution
prejudice and wages 785
of prejudice, where p is the fraction of the workforce that is black.9
Notice that since we use year-residualized individual prejudice toD̃it
compute all the community-level prejudice indices, the downward sec-ular trend in individual-level prejudice that we document below doesnot lead us to disproportionately weight recent observations when cal-culating indices that measure prejudice in the left tail of the distribution(i.e., the 10th percentile or the marginal).10
Summarizing Patterns and Trends in Prejudice in the GSS
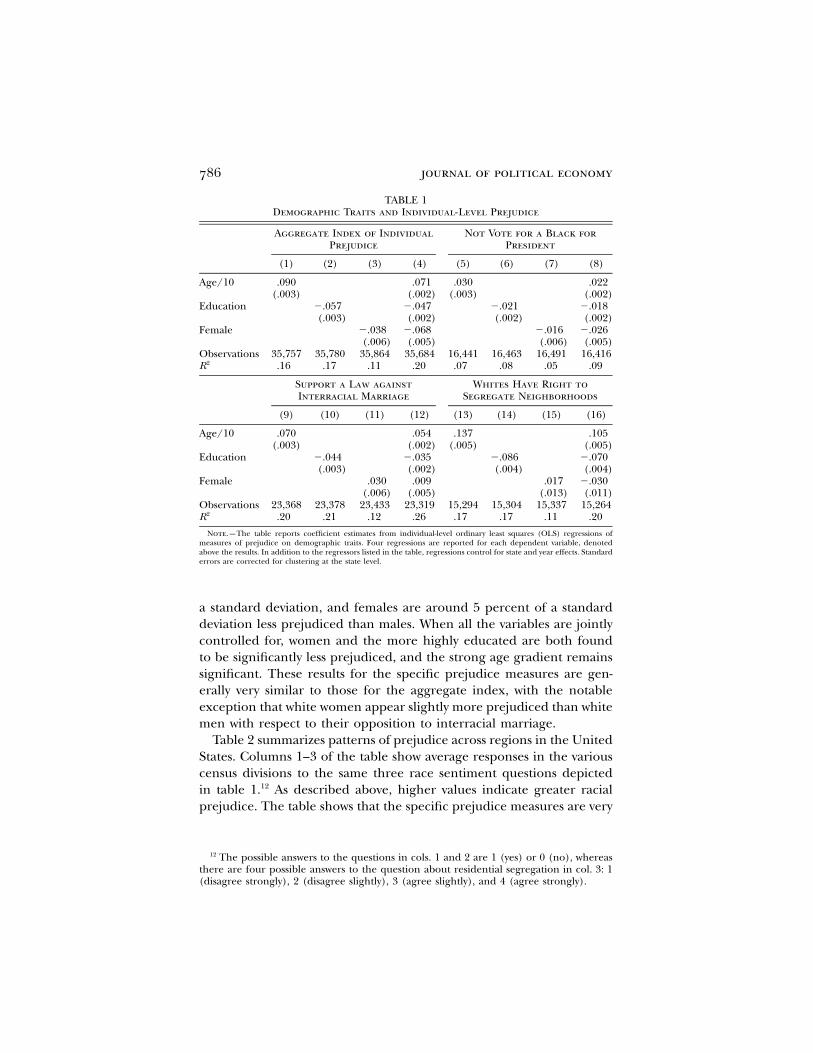
Before turning to the regressions that are our main focus, we presentsome initial results about prejudice to provide the reader a sense of thedata. Table 1 presents a series of regressions showing how key demo-graphic traits are related to an individual’s level of prejudice in the GSS.The table shows results for four outcomes: the individual aggregateprejudice index and unnormalized average responses to three of thespecific prejudice questions from which the unidimensional aggregateindex is constructed. The regressions are estimated on a pooled GSSsample across all years, and each regression controls for fixed year andstate fixed effects. The standard errors presented in the table are clus-tered at the level of the state.
The regression for the aggregate prejudice index shows that prejudiceexhibits a sharp age gradient, in that older whites are significantly morelikely to report prejudiced sentiments.11 To give a sense of the magnitudeof the estimate, a decade-older white in the sample is on average about13 percent of an individual-level standard deviation (which is about 0.7)more prejudiced. The regression also shows that higher-educated per-sons and females are significantly less prejudiced. Four years of edu-cation are associated with a reduction in prejudice of about a third of
9 For the percentile measures (including the marginal), we use an aggregate index ,D̃it
which is constructed from the four consistent questions asked in the GSS. We do not usethe full 26 questions when creating these percentile measures because the aggregatemeasure in that case is an average over responses to different numbers of questions indifferent years. The variance of the aggregate index based on the full 26 questions willtend mechanically to be higher in years in which a smaller number of questions happenedto be asked. Statistics based on the tails of the distribution would disproportionatelymeasure prejudice in those years in which a relatively small number of questions wereasked.
All the results presented below are virtually unchanged if the average is computed usingonly the four questions that are consistently asked together throughout the GSS.
10 The results are virtually unaffected if aggregate prejudice measures are computed onthe basis of rather than . Some of the point estimates are larger in specifications˜D Dit it
that use as the base distribution, but a one-standard-deviation change in each caseDit
implies virtually the same effect.11 The regressions control for year effects, but the usual problem restrains us from
making conclusions about whether the age gradient is driven by true age effects or cohorteffects.
786 journal of political economy
TABLE 1Demographic Traits and Individual-Level Prejudice
Aggregate Index of IndividualPrejudice
Not Vote for a Black forPresident
(1) (2) (3) (4) (5) (6) (7) (8)
Age/10 .090 .071 .030 .022(.003) (.002) (.003) (.002)
Education �.057 �.047 �.021 �.018(.003) (.002) (.002) (.002)
Female �.038 �.068 �.016 �.026(.006) (.005) (.006) (.005)
Observations 35,757 35,780 35,864 35,684 16,441 16,463 16,491 16,4162R .16 .17 .11 .20 .07 .08 .05 .09
Support a Law againstInterracial Marriage
Whites Have Right toSegregate Neighborhoods
(9) (10) (11) (12) (13) (14) (15) (16)
Age/10 .070 .054 .137 .105(.003) (.002) (.005) (.005)
Education �.044 �.035 �.086 �.070(.003) (.002) (.004) (.004)
Female .030 .009 .017 �.030(.006) (.005) (.013) (.011)
Observations 23,368 23,378 23,433 23,319 15,294 15,304 15,337 15,2642R .20 .21 .12 .26 .17 .17 .11 .20
Note.—The table reports coefficient estimates from individual-level ordinary least squares (OLS) regressions ofmeasures of prejudice on demographic traits. Four regressions are reported for each dependent variable, denotedabove the results. In addition to the regressors listed in the table, regressions control for state and year effects. Standarderrors are corrected for clustering at the state level.
a standard deviation, and females are around 5 percent of a standarddeviation less prejudiced than males. When all the variables are jointlycontrolled for, women and the more highly educated are both foundto be significantly less prejudiced, and the strong age gradient remainssignificant. These results for the specific prejudice measures are gen-erally very similar to those for the aggregate index, with the notableexception that white women appear slightly more prejudiced than whitemen with respect to their opposition to interracial marriage.
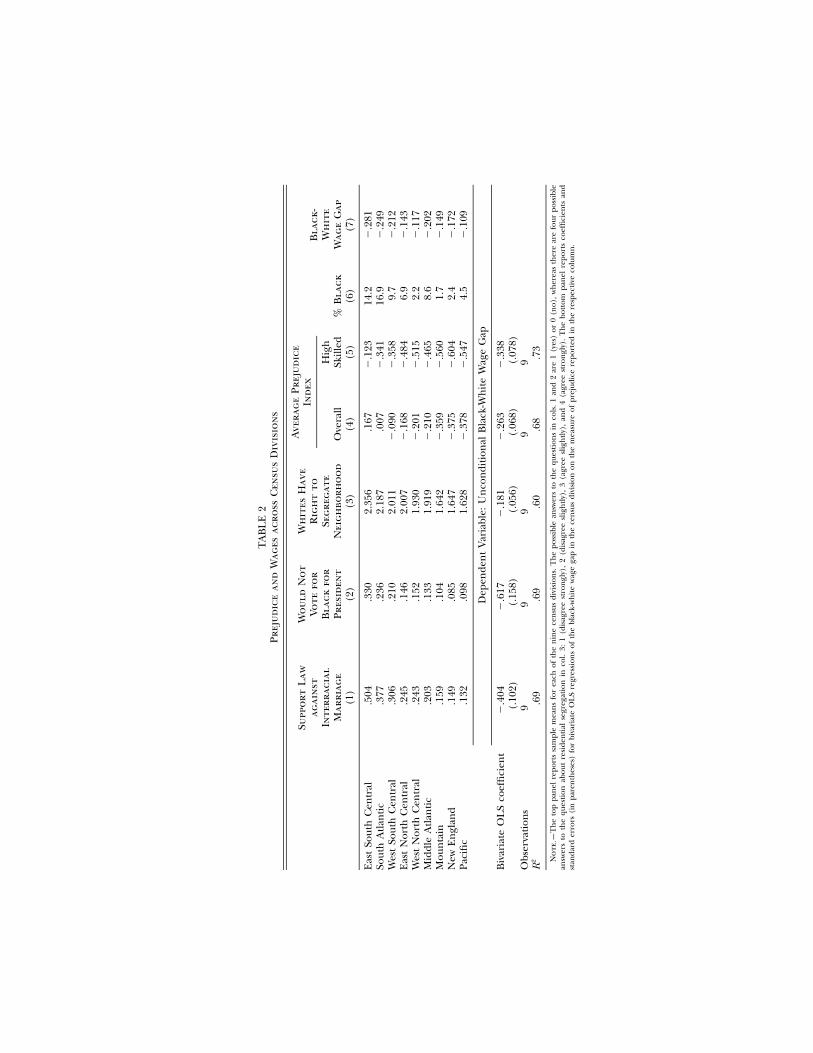
Table 2 summarizes patterns of prejudice across regions in the UnitedStates. Columns 1–3 of the table show average responses in the variouscensus divisions to the same three race sentiment questions depictedin table 1.12 As described above, higher values indicate greater racialprejudice. The table shows that the specific prejudice measures are very
12 The possible answers to the questions in cols. 1 and 2 are 1 (yes) or 0 (no), whereasthere are four possible answers to the question about residential segregation in col. 3: 1(disagree strongly), 2 (disagree slightly), 3 (agree slightly), and 4 (agree strongly).
TA
BL
E2
Prej
ud
ice
and
Wag
esac
ross
Cen
sus
Div
isio
ns
Supp
ort
Law
agai
nst
Inte
rrac
ial
Mar
riag
e(1
)
Wo
uld
No
tVo
tefo
rB
lack
for
Pres
iden
t(2
)
Wh
ites
Hav
eR
igh
tto
Seg
reg
ate
Nei
gh
borh
oo
d(3
)
Ave
rag
ePr
eju
dic
eIn
dex
%B
lack
(6)
Bla
ck-
Wh
ite
Wag
eG
ap(7
)O
vera
ll(4
)
Hig
hSk
illed
(5)
Eas
tSo
uth
Cen
tral
.504
.330
2.35
6.1
67�
.123
14.2
�.2
81So
uth
Atl
anti
c.3
77.2
362.
187
.007
�.3
4116
.9�
.249
Wes
tSo
uth
Cen
tral
.306
.210
2.01
1�
.090
�.3
589.
7�
.212
Eas
tN
orth
Cen
tral
.245
.146
2.00
7�
.168
�.4
846.
9�
.143
Wes
tN
orth
Cen
tral
.243
.152
1.93
0�
.201
�.5
152.
2�
.117
Mid
dle
Atl
anti
c.2
03.1
331.
919
�.2
10�
.465
8.6
�.2
02M
oun
tain
.159
.104
1.64
2�
.359
�.5
601.
7�
.149
New
En
glan
d.1
49.0
851.
647
�.3
75�
.604
2.4
�.1
72Pa
cifi
c.1
32.0
981.
628
�.3
78�
.547
4.5
�.1
09
Dep
ende
nt
Var
iabl
e:U
nco
ndi
tion
alB
lack
-Wh
ite
Wag
eG
ap
Biv
aria
teO
LS
coef
fici
ent
�.4
04�
.617
�.1
81�
.263
�.3
38(.
102)
(.15
8)(.
056)
(.06
8)(.
078)
Obs
erva
tion
s9
99
99
2R
.69
.69
.60
.68
.73
No
te.—
Th
eto
ppa
nel
repo
rts
sam
ple
mea
ns
for
each
ofth
en
ine
cen
sus
divi
sion
s.T
he
poss
ible
answ
ers
toth
equ
esti
ons
inco
ls.
1an
d2
are
1(y
es)
or0
(no)
,w
her
eas
ther
ear
efo
urpo
ssib
lean
swer
sto
the
ques
tion
abou
tre
side
nti
alse
greg
atio
nin
col.
3:1
(dis
agre
est
ron
gly)
,2
(dis
agre
esl
igh
tly)
,3
(agr
eesl
igh
tly)
,an
d4
(agr
eest
ron
gly)
.T
he
bott
ompa
nel
repo
rts
coef
fici
ents
and
stan
dard
erro
rs(i
npa
ren
thes
es)
for
biva
riat
eO
LS
regr
essi
ons
ofth
ebl
ack-
wh
ite
wag
ega
pin
the
cen
sus
divi
sion
onth
em
easu
reof
prej
udic
ere
port
edin
the
resp
ecti
veco
lum
n.
788 journal of political economy
highly correlated.13 By each of the measures, racial prejudice is mostsevere in the southeastern portion of the country and least severe inNew England and in the West. Prejudice is greatest in the East SouthCentral division (AL, KY, MS, and TN) and next greatest in the SouthAtlantic (DE, DC, FL, GA, MD, NC, SC, VA, and WV) and West SouthCentral (AR, LA, OK, and TX) divisions. Prejudice is least severe inNew England (CT, ME, MA, NH, RI, and VT) and in the Pacific (AK,CA, HI, OR, and WA) and Mountain (AZ, CO, ID, MT, NV, NM, UT,and WY) divisions.14
Columns 4 and 5 of the table show the means for the aggregateprejudice index—first over the entire sample of whites in a region andthen over a group of “high-skilled” (college graduate) whites, who mightbe more likely to be employers than the average person. Not surprisingly,the table reveals the same pattern of prejudice across regions as theseparate prejudice questions. This is true for both the sample of allwhites and the sample of the highly skilled, although the means showthat, in any division, the highly skilled are less racially prejudiced thantheir less educated counterparts.15 The difference in average prejudiceacross the various divisions is substantial. For example, between the EastSouth Central and New England census divisions, the difference is onthe order of 0.8 of an individual-level standard deviation. To put thisdifference in perspective, the median East South Central respondenthas the same aggregate prejudice as the 81st percentile respondent fromNew England. The median-prejudiced New England respondent wouldbe at the 26th percentile of the East South Central prejudice distribu-tion. A graphical description of the cumulative distribution of prejudiceacross the various divisions is presented in Appendix figure A1. Column6 of the table shows the fraction of the workforce that is black in eachcensus division. On the whole, the numbers indicate that blacks livedisproportionately in regions of the country in which racial prejudiceis most severe, on average. This pattern may indicate that prejudice is
13 To conserve space we obviously cannot show the same numbers for all the prejudicequestions. It is reassuring that the basic patterns shown in tables 1 and 2 are found forother measures as well.
14 It is possible that differences in answers to the GSS questions may not reflect differ-ences in racial prejudice at all. Instead, racial feelings might be the same everywhere, butthere are regional differences in people’s willingness to be candid about their underlyingracial sentiments. In our view, this argument brings up the question of why people indifferent places feel differentially obliged to hide their underlying racial sentiment. Onecould regard this willingness to be candid about racially insensitive feelings as itself in-dicative of the thing we have called prejudice. More important, notice that if there wereno content to people’s claims about their racial feelings, the GSS racial prejudice measureswould basically be noise and there should be no systematic relationship between statedprejudice and wage differences, as our various analyses find.
15 The values for the univariate average prejudice measure are generally negative. Thereason is that this measure is based on normalized measures described above, and allmeasures of prejudice have been declining since 1977.
prejudice and wages 789
caused in part by cross-racial contact and by competition for economicresources.
Using the individual prejudice measures, we earlier showed graphi-cally that black wages are relatively lower where prejudice is higher. Theregression results presented in the last two rows repeat this finding andalso show that racial wage gaps are larger where whites are more prej-udiced according to the aggregate prejudice index.16 At best, these pat-terns are merely suggestive about the causal connection between prej-udice and wages suggested by Becker’s model. Also suggestive is the factthat, although the correlation is weaker, the fraction of a workforce thatis black is also correlated with the level of the black-white wage gap.The analysis below tests more carefully whether the patterns of prejudiceand wage gaps fit the subtle patterns suggested by the theory. In thatwork, we address such issues as the fact that prejudice indices might becorrelated with unobserved regional differences in productivity betweenblack and white workers.
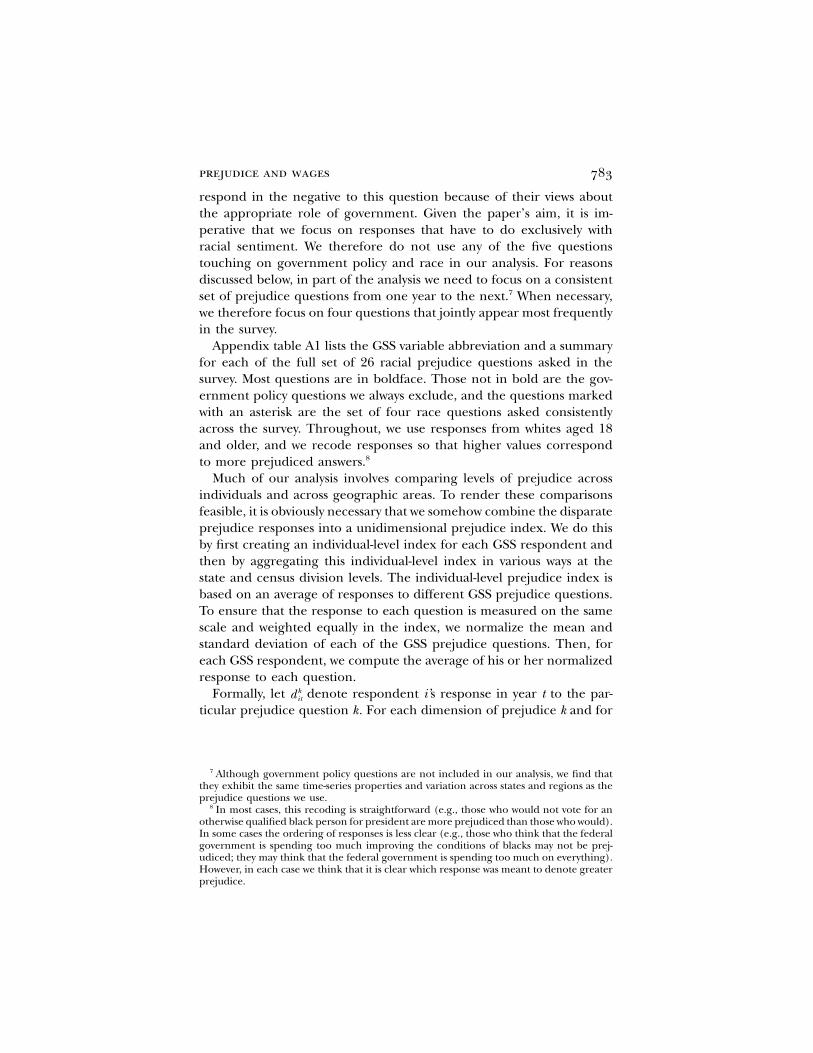
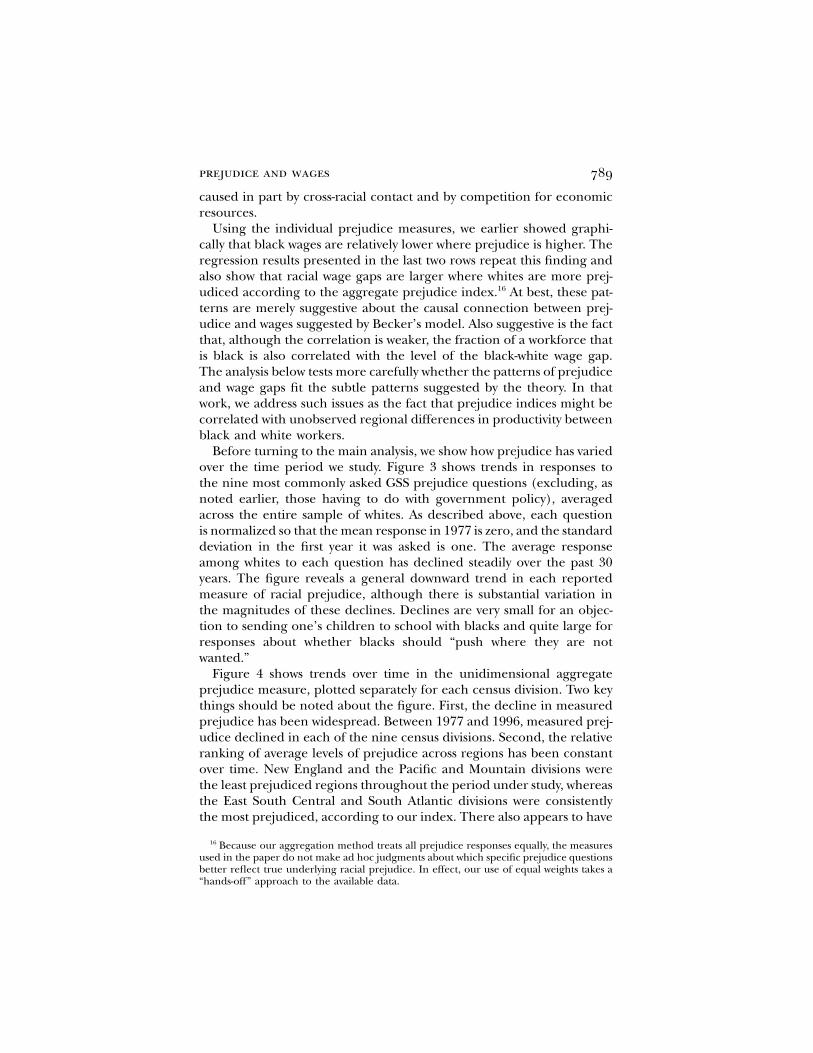
Before turning to the main analysis, we show how prejudice has variedover the time period we study. Figure 3 shows trends in responses tothe nine most commonly asked GSS prejudice questions (excluding, asnoted earlier, those having to do with government policy), averagedacross the entire sample of whites. As described above, each questionis normalized so that the mean response in 1977 is zero, and the standarddeviation in the first year it was asked is one. The average responseamong whites to each question has declined steadily over the past 30years. The figure reveals a general downward trend in each reportedmeasure of racial prejudice, although there is substantial variation inthe magnitudes of these declines. Declines are very small for an objec-tion to sending one’s children to school with blacks and quite large forresponses about whether blacks should “push where they are notwanted.”
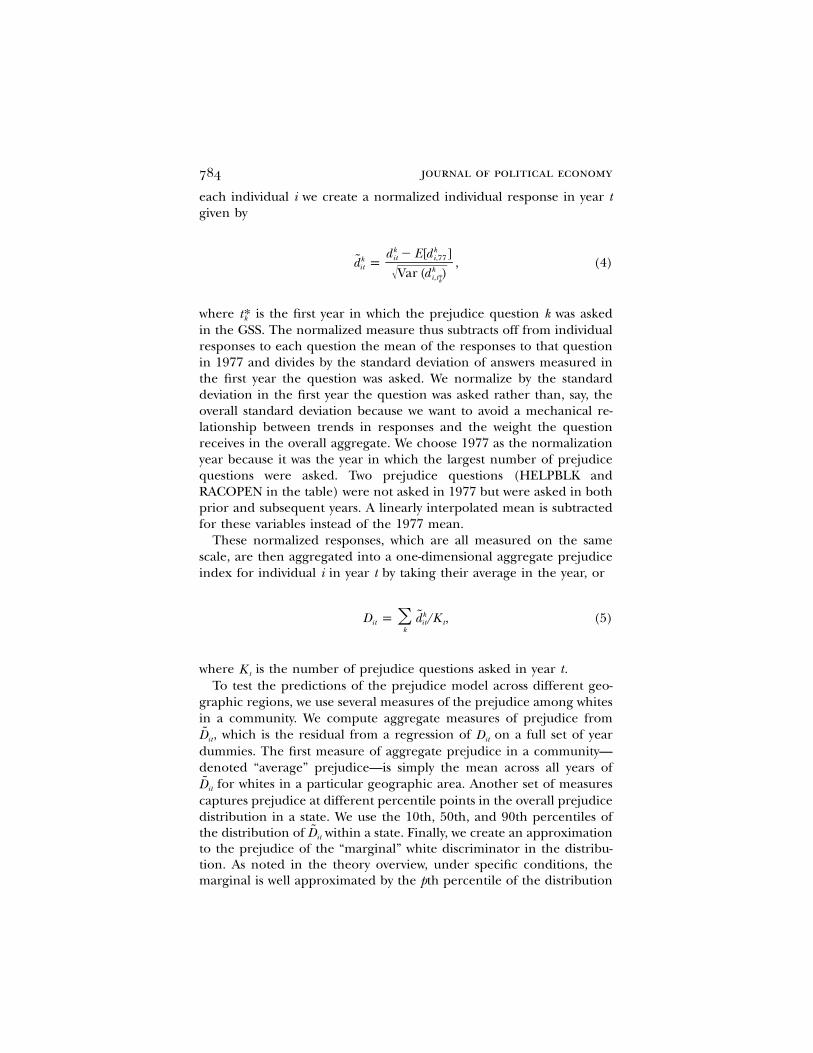
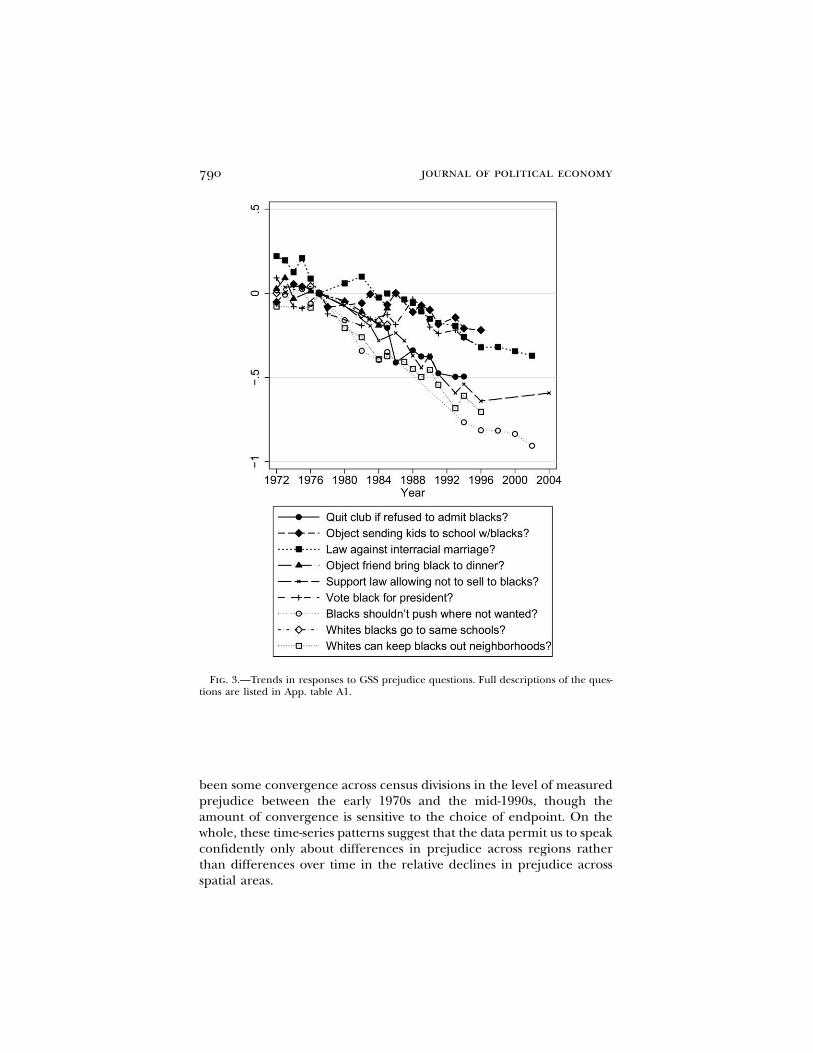
Figure 4 shows trends over time in the unidimensional aggregateprejudice measure, plotted separately for each census division. Two keythings should be noted about the figure. First, the decline in measuredprejudice has been widespread. Between 1977 and 1996, measured prej-udice declined in each of the nine census divisions. Second, the relativeranking of average levels of prejudice across regions has been constantover time. New England and the Pacific and Mountain divisions werethe least prejudiced regions throughout the period under study, whereasthe East South Central and South Atlantic divisions were consistentlythe most prejudiced, according to our index. There also appears to have
16 Because our aggregation method treats all prejudice responses equally, the measuresused in the paper do not make ad hoc judgments about which specific prejudice questionsbetter reflect true underlying racial prejudice. In effect, our use of equal weights takes a“hands-off” approach to the available data.
790 journal of political economy
Fig. 3.—Trends in responses to GSS prejudice questions. Full descriptions of the ques-tions are listed in App. table A1.
been some convergence across census divisions in the level of measuredprejudice between the early 1970s and the mid-1990s, though theamount of convergence is sensitive to the choice of endpoint. On thewhole, these time-series patterns suggest that the data permit us to speakconfidently only about differences in prejudice across regions ratherthan differences over time in the relative declines in prejudice acrossspatial areas.
prejudice and wages 791
Fig. 4.—Trends in prejudice by census division. The figure plots average over time bycensus division using the four prejudice questions jointly asked most frequently in theGSS.
IV. Base Empirical Results
To estimate the relationship between relative black wages and region-level measures of prejudice, we merge the prejudice indices describedabove with CPS data. We combine the May monthly supplement from1977 and 1978 with the Merged Outgoing Rotation Group (MORG)files from 1979 to 2002.17 The sample includes full-time black and whitemales aged 16–64. In the analysis, we take states to be separate labormarkets and make the implicit assumption that black workers cannotcostlessly move to equilibrate racial wage gaps. Our basic specificationcould be estimated in two alternative ways. One option would be toestimate an OLS regression of log wages on education, a quadratic inpotential experience, race-specific year dummies, a black dummy, the
17 See, e.g., Autor, Katz, and Kearney (2005) or Lemieux (2006) for a discussion of themerits of the May and MORG files for measuring wages. We follow Autor et al.’s samplerestrictions, dropping those with real hourly wages below the real value of the 1982 min-imum wage or with nominal wages above top-code levels. Top-coded responses are replacedwith 1.5 times the top-code value. All values in the paper are given in year 2000 dollars.We thank David Autor for sharing his programs with us.
The analysis below requires state-level wage gaps. State is not consistently reported inthe May CPS until 1977. For the earlier analysis at the census division level, we also usedata from the 1973–76 May CPS.
792 journal of political economy
average prejudice for the state, and the interaction between the partic-ular prejudice measure and a black indicator variable. The coefficientsof interest would be the estimated effect on the interaction terms. Inthe case of the average, for example, an estimated negative coefficientwould indicate how much lower black wages are relative to those ofwhites in states with higher average prejudice. The drawback of thismethod is that because the various prejudice indices vary only at thelevel of the state, this procedure might underestimate standard errors,even if the regressions were clustered at the level of the state.
An alternative method, which deals with this potential standard errorconcern, is executed in two steps. First, we estimate the residual black-white wage gap in each state. Specifically, we estimate by OLS the logwage regression described above but leave out the prejudice index andinclude a separate black dummy variable for each state. The estimatedeffects on each of these black dummy variables become the dependentvariable in the second step, which is weighted by the precision withwhich we estimate the state wage gap in the first step. In this second-step regression, one or more of the labor market prejudice indices arethe independent variables of interest. The second-step regression hasapproximately 45 observations and therefore produces conservativestandard error estimates.18
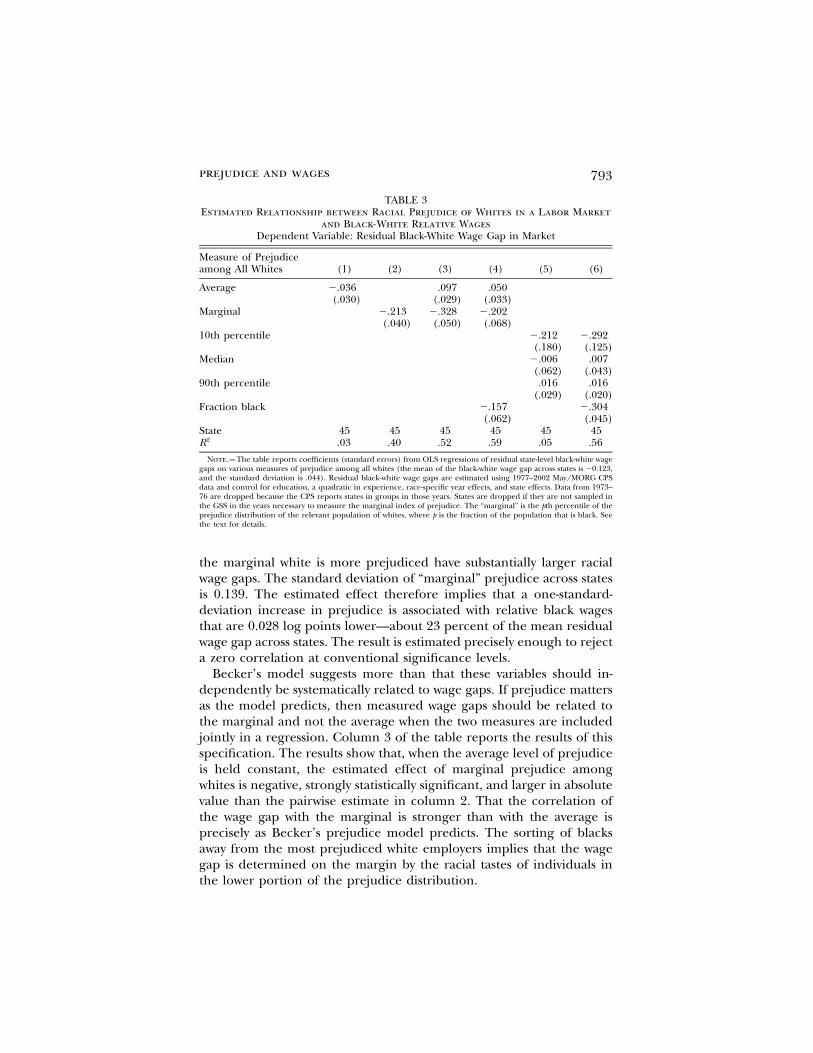
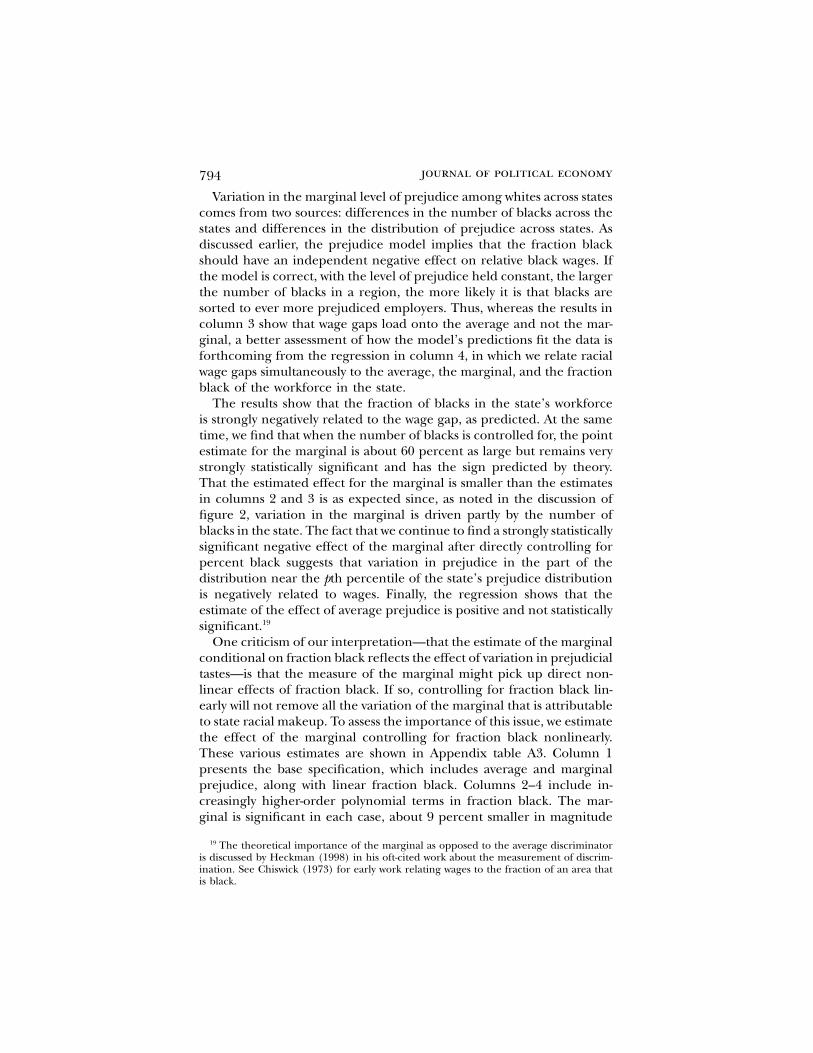
Table 3 presents the main results. The regressions in the table assesswhether the adjusted racial wage gaps across states vary with alternativemeasures of prejudice and with the racial makeup of those states in amanner predicted by the Becker prejudice model reviewed earlier. Thetable and most that follow report point estimates and standard errorsfor the average, median, 10th, and 90th percentiles of the white prej-udice distribution; the fraction of the workforce that is black; and theapproximation to the “marginal” level of prejudice described earlierand given by the pth percentile of the prejudice distribution, where pis the percentage of the state workforce that is black.
Column 1 shows the pairwise relationship between the black-whitewage gap and the average prejudice among whites in a state. These state-level results show a weaker relationship between wage gaps and averageprejudice than the earlier results shown at the census division level. Thepoint estimate is negative, suggesting that black wages are relatively lowerin states with higher average prejudice, but the relationship is not sta-tistically significant. In contrast, the pairwise relationship between theblack-white wage gap and the prejudice of an approximation of the“marginal” white in the labor market, shown in column 2, is striking.As the Becker model predicts, the regression shows that states in which
18 States are dropped because they are not separately identified in the GSS. These statesare small and tend to have very few blacks.
prejudice and wages 793
TABLE 3Estimated Relationship between Racial Prejudice of Whites in a Labor Market
and Black-White Relative WagesDependent Variable: Residual Black-White Wage Gap in Market
Measure of Prejudiceamong All Whites (1) (2) (3) (4) (5) (6)
Average �.036 .097 .050(.030) (.029) (.033)
Marginal �.213 �.328 �.202(.040) (.050) (.068)
10th percentile �.212 �.292(.180) (.125)
Median �.006 .007(.062) (.043)
90th percentile .016 .016(.029) (.020)
Fraction black �.157 �.304(.062) (.045)
State 45 45 45 45 45 452R .03 .40 .52 .59 .05 .56
Note.—The table reports coefficients (standard errors) from OLS regressions of residual state-level black-white wagegaps on various measures of prejudice among all whites (the mean of the black-white wage gap across states is �0.123,and the standard deviation is .044). Residual black-white wage gaps are estimated using 1977–2002 May/MORG CPSdata and control for education, a quadratic in experience, race-specific year effects, and state effects. Data from 1973–76 are dropped because the CPS reports states in groups in those years. States are dropped if they are not sampled inthe GSS in the years necessary to measure the marginal index of prejudice. The “marginal” is the pth percentile of theprejudice distribution of the relevant population of whites, where p is the fraction of the population that is black. Seethe text for details.
the marginal white is more prejudiced have substantially larger racialwage gaps. The standard deviation of “marginal” prejudice across statesis 0.139. The estimated effect therefore implies that a one-standard-deviation increase in prejudice is associated with relative black wagesthat are 0.028 log points lower—about 23 percent of the mean residualwage gap across states. The result is estimated precisely enough to rejecta zero correlation at conventional significance levels.
Becker’s model suggests more than that these variables should in-dependently be systematically related to wage gaps. If prejudice mattersas the model predicts, then measured wage gaps should be related tothe marginal and not the average when the two measures are includedjointly in a regression. Column 3 of the table reports the results of thisspecification. The results show that, when the average level of prejudiceis held constant, the estimated effect of marginal prejudice amongwhites is negative, strongly statistically significant, and larger in absolutevalue than the pairwise estimate in column 2. That the correlation ofthe wage gap with the marginal is stronger than with the average isprecisely as Becker’s prejudice model predicts. The sorting of blacksaway from the most prejudiced white employers implies that the wagegap is determined on the margin by the racial tastes of individuals inthe lower portion of the prejudice distribution.
794 journal of political economy
Variation in the marginal level of prejudice among whites across statescomes from two sources: differences in the number of blacks across thestates and differences in the distribution of prejudice across states. Asdiscussed earlier, the prejudice model implies that the fraction blackshould have an independent negative effect on relative black wages. Ifthe model is correct, with the level of prejudice held constant, the largerthe number of blacks in a region, the more likely it is that blacks aresorted to ever more prejudiced employers. Thus, whereas the results incolumn 3 show that wage gaps load onto the average and not the mar-ginal, a better assessment of how the model’s predictions fit the data isforthcoming from the regression in column 4, in which we relate racialwage gaps simultaneously to the average, the marginal, and the fractionblack of the workforce in the state.
The results show that the fraction of blacks in the state’s workforceis strongly negatively related to the wage gap, as predicted. At the sametime, we find that when the number of blacks is controlled for, the pointestimate for the marginal is about 60 percent as large but remains verystrongly statistically significant and has the sign predicted by theory.That the estimated effect for the marginal is smaller than the estimatesin columns 2 and 3 is as expected since, as noted in the discussion offigure 2, variation in the marginal is driven partly by the number ofblacks in the state. The fact that we continue to find a strongly statisticallysignificant negative effect of the marginal after directly controlling forpercent black suggests that variation in prejudice in the part of thedistribution near the pth percentile of the state’s prejudice distributionis negatively related to wages. Finally, the regression shows that theestimate of the effect of average prejudice is positive and not statisticallysignificant.19
One criticism of our interpretation—that the estimate of the marginalconditional on fraction black reflects the effect of variation in prejudicialtastes—is that the measure of the marginal might pick up direct non-linear effects of fraction black. If so, controlling for fraction black lin-early will not remove all the variation of the marginal that is attributableto state racial makeup. To assess the importance of this issue, we estimatethe effect of the marginal controlling for fraction black nonlinearly.These various estimates are shown in Appendix table A3. Column 1presents the base specification, which includes average and marginalprejudice, along with linear fraction black. Columns 2–4 include in-creasingly higher-order polynomial terms in fraction black. The mar-ginal is significant in each case, about 9 percent smaller in magnitude
19 The theoretical importance of the marginal as opposed to the average discriminatoris discussed by Heckman (1998) in his oft-cited work about the measurement of discrim-ination. See Chiswick (1973) for early work relating wages to the fraction of an area thatis black.
prejudice and wages 795
and fairly consistent as we allow fraction black to go from quadratic toquartic. Column 5 shows results from a less parametric specification inwhich we control for a set of dummy variables for different categoriesof fraction black. Again, the estimated effect of the marginal is statis-tically significant and is almost identical in magnitude to the base spec-ification with a linear fraction black control. These results suggest thatthe marginal is not picking up nonlinear direct effects of fraction black.Rather, it appears that the variation in the marginal after controllingfor percent black represents variation in prejudice.
Taken together, the results in columns 1–4 of table 3 are stronglyconsistent with the predictions of Becker’s prejudice model. However,these results do not constitute the sharpest possible associational testsof the model’s prediction. For one thing, our measure of the marginalis an approximation to what the true marginal likely is in a state. More-over, as discussed in the theory overview, Becker’s model yields sharppredictions about how wage gaps should be affected by prejudice in aparticular part of the prejudice distribution but not by prejudice at otherpoints.
In column 5 we relate state-level wage gaps to the level of prejudiceat the 10th, 50th, and 90th percentiles of the overall prejudice distri-bution. The results are striking. We find a large, significant, negativeeffect of prejudice at the 10th percentile. The estimated effects implythat the median and 90th percentiles of the prejudice distribution haveno effect on relative black wages. The results in column 6 of the tableare even more striking. When we control for the fraction of the stateworkforce that is black in addition to the three percentile points in theprejudice distribution, the effect of the 10th percentile prejudice is stillnegative and strongly statistically significant. Prejudice at the medianand 90th percentiles is again estimated to have no effect on state-levelracial wage gaps. The larger standard errors for the 10th percentileeffect derive directly from the fact that there is significantly less variationin the 10th percentile of prejudice than at the 50th or 90th percentile.It is noteworthy that, although most of the cross-sectional variation inlevels of prejudice across areas comes from differences in the prejudiceof the most prejudiced whites, it is variation in prejudice of less prej-udiced whites in an area that is related to the area’s racial wage gaps.20
20 The relative differences in variation across different percentiles of the prejudice dis-tribution can be seen in App. fig. A1. This figure understates, however, the absolute amountof state-level variation at each of the percentiles because it shows the cumulative distri-bution function at the census division level.
796 journal of political economy
Finally, in this regression the fraction of the state workforce that is blackhas a strongly negative and statistically significant effect.21
These results are strongly consistent with the predictions of the prej-udice model. It is worth emphasizing that they say much more than that“black wages are lower in places where whites are more prejudiced.”The fact that in a regression in which they are jointly controlled for,prejudice among the least prejudiced whites in an area matters forrelative black wages whereas that of the most prejudiced whites has noeffect at all, combined with the fact that the fraction of the state work-force that is black varies in a negative and statistically significant waywith relative black wages, suggests that only a mechanism of the sortfirst outlined by Becker can reconcile these facts.22 Indeed, the highervariance found in prejudice at the right tail and illustrated in Appendixfigure A1 might have led one to speculate that right tail prejudice wouldbe found to matter more empirically. That it does not makes the resultsall the more striking.23
On the whole, the estimates suggest that taste-based prejudice playsan important role in generating observed racial wage gaps. Consider achange in the 10th percentile of prejudice of the magnitude of theinterquartile range across states—something that corresponds in ourdata to moving from California to Kentucky. The interquartile range ofthe 10th percentile white prejudice is 0.064. The point estimate in col-umn 6 of table 3 implies that, with fraction black in the workforce heldconstant, this variation in prejudice is associated with a 1.9-percentage-point decline in black wages relative to white wages. The interquartile
21 As discussed above, we argue that it is the distribution of prejudice among whites thatdetermines relative black wages and not prejudice among persons who, at a point in time,happen to be playing the role of labor market employer. Nonetheless, we estimate a versionof table 3 but with prejudice measured among the set of people who are likely to beemployers—those with high skill. When the various measures are constructed from thesample of whites with at least some college training, we find results very similar to thoseshown in table 3. The results are presented in App. table A2.
22 In the wage context, only prejudice in the left tail matters because racial interactionsare mediated by a price mechanism operating in a market context. We would not expecta similar prediction in situations in which the racial outcomes are determined not by amarket but rather by some other mechanism, such as a vote. In fact, as one example, wefind that the log public welfare spending per black in a state (measured in 1978, 1987,or 1996) is significantly negatively related to the 90th percentile of prejudice in the statebut not to the median or 10th percentile. To the extent that policies that benefit blacksrelative to whites are determined by the median level of prejudice or prejudice in theright tail, it is more likely that the patterns we see in the wage regressions are driven byvariation in prejudice rather than by unobserved omitted factors.
23 We have experimented with including other percentile points of the prejudice dis-tribution, such as the 25th and 75th percentiles. Although not shown, these regressionsshow the same thing as the results in col. 5 of table 3: only prejudice in the left tail ofthe prejudice distribution (such as the 10th or 25th percentile) varies in a negative andstatistically significant way with relative black wages. Prejudice in the right tail consistentlyhas no effect on the racial wage gap.
prejudice and wages 797
range of percent black across states is 11 percentage points; a changeof this magnitude is like moving from Wisconsin to Tennessee in ourdata. The point estimate in column 6 therefore implies an additional3.3-percentage-point decline in black relative wages. These two estimatesimply that the mechanism by which prejudice affects racial wage gapsaccording to Becker’s model accounts for a 5.2-percentage-point re-duction in average relative hourly wages for black workers. This changeis about 25 percent of the unconditional black-white wage gap duringthe 30 years we study. While our results point to an important role forprejudice, they also suggest that other factors, such as unobserved skilldifferences, school quality differences, and statistical or other forms ofdiscrimination, collectively likely explain around three-quarters of un-conditional wage gaps.
Though prejudice explains only a significant minority of the black-white wage gap, the related costs borne by blacks relative to whites areeconomically large. Consider an 18-year-old black male choosing be-tween two states in which the marginal white is differentially prejudiced.Our estimates imply that if he lives in Florida rather than in Massachu-setts—the states that represent, respectively, the 75th and 25th percen-tiles of the marginal prejudice distribution—the net present value ofhis earning will be about $34,000 smaller. If he lives in Mississippi ratherthan in Wisconsin—the states that represent, respectively, the 90th and10th percentiles of the marginal prejudice distribution—his discountedearnings are about $115,000 smaller.24
In the next section, we address the two concerns that might lead usto question the conclusion that the patterns in table 3 reflect what couldbe termed the causal effect of prejudice and racial composition on racialwage gaps.
V. Extensions: Accounting for Endogenous Preferences and RacialComposition
On the whole, the results presented in table 3 are strongly supportiveof all the predictions of the prejudice model of wage discrimination.But can a causal interpretation be given to these results? The obviousspecific concern here is that regions with more severe measured prej-udice or higher numbers of blacks also have other unobserved char-acteristics that negatively affect black wages more than white wages.
24 To calculate these numbers, we multiply three values: the point estimates from col.3 of table 3, the relevant difference in prejudice of the marginal white across differentareas, and the net present value of annual earnings. To compute the net present valueof earnings, we estimate average hourly earning at each age and multiply this number by2,000—the number of hours worked by a full-time worker in a year. We discount the sumof these numbers using a discount rate of 3 percent.
798 journal of political economy
Though the regressions we have discussed thus far control for a richset of fixed effects and the most obvious suspects, such as differencesin education levels, there are always other possibilities. One example isthat some determinant of labor market outcomes, such as unobservedschool quality (not quantity), could be correlated with prejudice levels.25
In fact, this reduced school quality could be a direct result of prejudice,as the important historical example of segregated schools illustrates. Asecond possibility is that unobserved racial skill differences, as might bemeasured by the black-white test score gap, could be correlated withprejudice. The patterns we have documented could result from unob-served skill differences of this sort even if there were no direct effectof prejudice on wages in the labor market. The other type of potentialendogeneity concern in table 3 is the fact that the fraction of a workforcethat is black may be related to some unobserved determinant of wages.Potentially magnifying both of these concerns is that in the regressionswe have presented thus far, much of the variation in the data comesfrom comparisons between the southern states and the rest of the coun-try. Anything peculiar about labor market institutions or skill levels inthe South relative to the rest of the country could thus possibly explainour results.
Of course the ideal way to address any potential concern about theendogeneity of prejudice and of the fraction of a state workforce thatis black would be to find valid instruments for these variables. In thecase of the various percentile measures of the prejudice distribution,we do not have and cannot conceive of an instrument that could, forexample, generate plausibly exogenous variation in the 10th percentileof the prejudice distribution but not in the 90th, or vice versa. To dealwith any potential endogeneity of these measures, we therefore adoptthe approach of collecting information on the factors for which thereis the greatest concern that prejudice is correlated at the state level—measures of skill quality in the state.
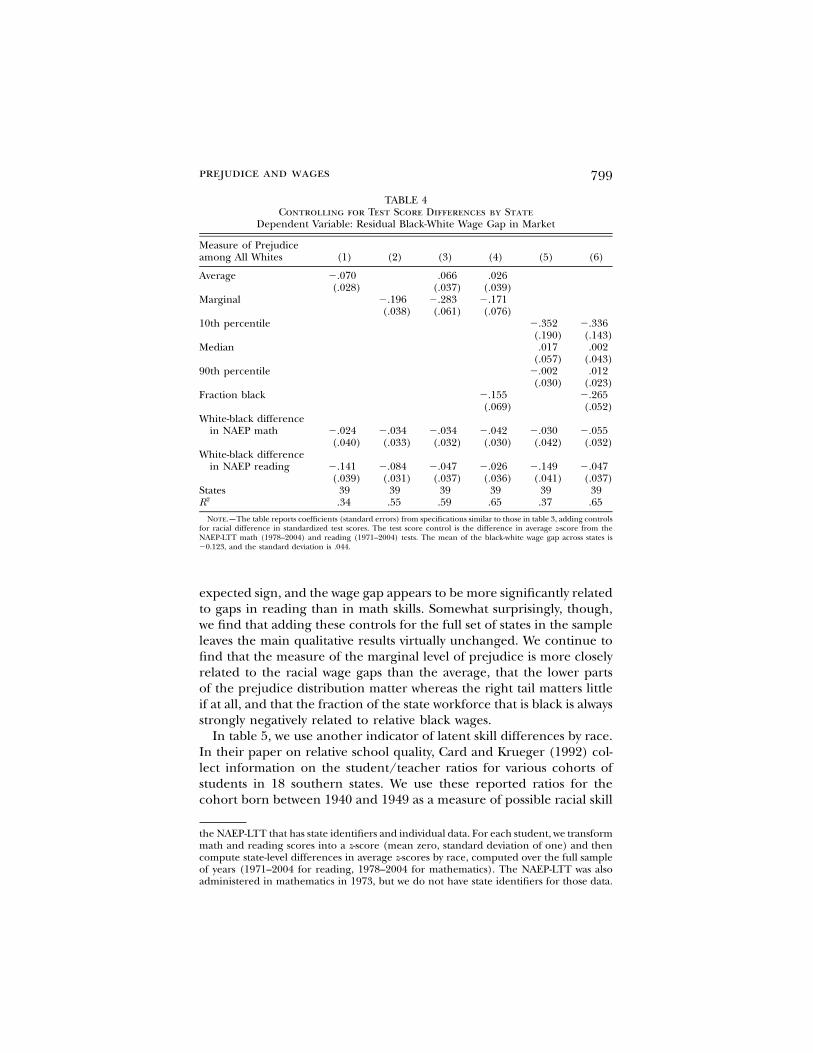
Tables 4 and 5 present the results from directly controlling for racialskill differences. In table 4 we reestimate the base results in table 3 butadd controls for the state-level racial difference in mean National As-sessment of Educational Progress–Long Term Trend (NAEP-LTT) mathand reading scores.26 These measures of racial skill differences have the
25 Notice that it would not cause a bias if school quality were relatively lower for bothblacks and whites since we include state effects, unless the effect of school quality onwages differed by race.
26 The NAEP-LTT is a standardized test administered to U.S. students and is designedto measure trends and cross-sectional patterns in educational performance. It is sometimesreferred to as “the Nation’s Report Card.” Since 1971, students of age 9, 13, and 17 havebeen randomly selected and tested in mathematics and reading. Each subject is testedapproximately every 4 years. The content tested by the NAEP-LTT has remained un-changed so that comparisons over time can be made. We use a restricted-use version of
prejudice and wages 799
TABLE 4Controlling for Test Score Differences by State
Dependent Variable: Residual Black-White Wage Gap in Market
Measure of Prejudiceamong All Whites (1) (2) (3) (4) (5) (6)
Average �.070 .066 .026(.028) (.037) (.039)
Marginal �.196 �.283 �.171(.038) (.061) (.076)
10th percentile �.352 �.336(.190) (.143)
Median .017 .002(.057) (.043)
90th percentile �.002 .012(.030) (.023)
Fraction black �.155 �.265(.069) (.052)
White-black differencein NAEP math �.024 �.034 �.034 �.042 �.030 �.055
(.040) (.033) (.032) (.030) (.042) (.032)White-black difference
in NAEP reading �.141 �.084 �.047 �.026 �.149 �.047(.039) (.031) (.037) (.036) (.041) (.037)
States 39 39 39 39 39 392R .34 .55 .59 .65 .37 .65
Note.—The table reports coefficients (standard errors) from specifications similar to those in table 3, adding controlsfor racial difference in standardized test scores. The test score control is the difference in average z-score from theNAEP-LTT math (1978–2004) and reading (1971–2004) tests. The mean of the black-white wage gap across states is�0.123, and the standard deviation is .044.
expected sign, and the wage gap appears to be more significantly relatedto gaps in reading than in math skills. Somewhat surprisingly, though,we find that adding these controls for the full set of states in the sampleleaves the main qualitative results virtually unchanged. We continue tofind that the measure of the marginal level of prejudice is more closelyrelated to the racial wage gaps than the average, that the lower partsof the prejudice distribution matter whereas the right tail matters littleif at all, and that the fraction of the state workforce that is black is alwaysstrongly negatively related to relative black wages.
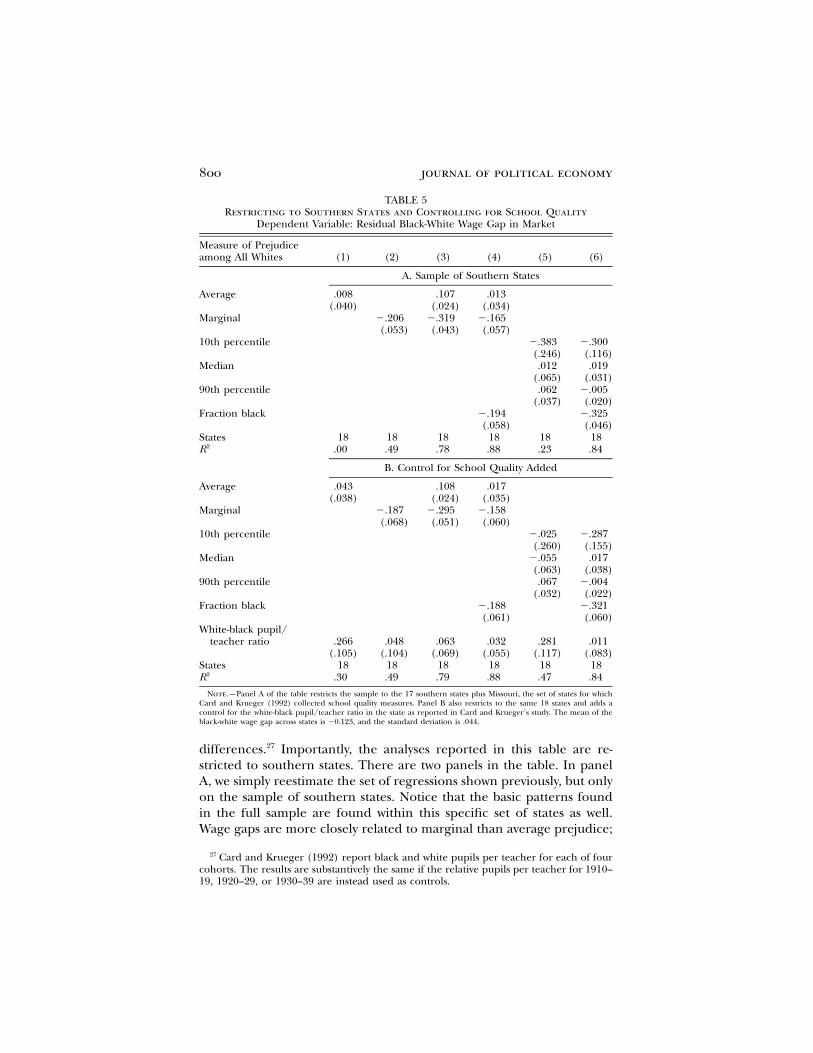
In table 5, we use another indicator of latent skill differences by race.In their paper on relative school quality, Card and Krueger (1992) col-lect information on the student/teacher ratios for various cohorts ofstudents in 18 southern states. We use these reported ratios for thecohort born between 1940 and 1949 as a measure of possible racial skill
the NAEP-LTT that has state identifiers and individual data. For each student, we transformmath and reading scores into a z-score (mean zero, standard deviation of one) and thencompute state-level differences in average z-scores by race, computed over the full sampleof years (1971–2004 for reading, 1978–2004 for mathematics). The NAEP-LTT was alsoadministered in mathematics in 1973, but we do not have state identifiers for those data.
800 journal of political economy
TABLE 5Restricting to Southern States and Controlling for School Quality
Dependent Variable: Residual Black-White Wage Gap in Market
Measure of Prejudiceamong All Whites (1) (2) (3) (4) (5) (6)
A. Sample of Southern States
Average .008 .107 .013(.040) (.024) (.034)
Marginal �.206 �.319 �.165(.053) (.043) (.057)
10th percentile �.383 �.300(.246) (.116)
Median .012 .019(.065) (.031)
90th percentile .062 �.005(.037) (.020)
Fraction black �.194 �.325(.058) (.046)
States 18 18 18 18 18 182R .00 .49 .78 .88 .23 .84
B. Control for School Quality Added
Average .043 .108 .017(.038) (.024) (.035)
Marginal �.187 �.295 �.158(.068) (.051) (.060)
10th percentile �.025 �.287(.260) (.155)
Median �.055 .017(.063) (.038)
90th percentile .067 �.004(.032) (.022)
Fraction black �.188 �.321(.061) (.060)
White-black pupil/teacher ratio .266 .048 .063 .032 .281 .011
(.105) (.104) (.069) (.055) (.117) (.083)States 18 18 18 18 18 18
2R .30 .49 .79 .88 .47 .84
Note.—Panel A of the table restricts the sample to the 17 southern states plus Missouri, the set of states for whichCard and Krueger (1992) collected school quality measures. Panel B also restricts to the same 18 states and adds acontrol for the white-black pupil/teacher ratio in the state as reported in Card and Krueger’s study. The mean of theblack-white wage gap across states is �0.123, and the standard deviation is .044.
differences.27 Importantly, the analyses reported in this table are re-stricted to southern states. There are two panels in the table. In panelA, we simply reestimate the set of regressions shown previously, but onlyon the sample of southern states. Notice that the basic patterns foundin the full sample are found within this specific set of states as well.Wage gaps are more closely related to marginal than average prejudice;
27 Card and Krueger (1992) report black and white pupils per teacher for each of fourcohorts. The results are substantively the same if the relative pupils per teacher for 1910–19, 1920–29, or 1930–39 are instead used as controls.
prejudice and wages 801
TABLE 6Two-Stage Least Squares Estimates Using Fraction Black in 1920 as an
InstrumentDependent Variable: Residual Black-White Wage Gap in Market
Measure of Prejudiceamong All Whites (1) (2) (3) (4) (5) (6)
Average �.036 .127 .070(.030) (.033) (.044)
Marginal �.204 �.401 �.251(.044) (.063) (.102)
10th percentile �.212 �.309(.180) (.128)
Median �.006 .010(.062) (.044)
90th percentile .016 .016(.029) (.021)
Fraction black �.175 �.367(.094) (.055)
State 45 45 45 45 45 452R .03 .40 .50 .57 .05 .54
Note.—The table reports coefficients (standard errors) from two-stage least squares regressions of residual state-levelblack-white wage gaps on various measures of prejudice among all whites. Fraction black in the state estimated in the1920 Census is used as an instrument for the contemporaneous fraction black, and an alternative marginal based onthe fraction black in 1920 is used as an instrument for the contemporaneous marginal. The mean of the black-whitewage gap across states is �0.123, and the standard deviation is .044.
the marginal is significantly negatively related to relative black wages,even conditional on average prejudice and fraction black; and wagegaps are significantly related to the 10th percentile of the prejudicedistribution but not to the median or the 90th percentile, conditionalon fraction black. Panel B repeats the analysis above but adds the Card-Krueger measure of black-white relative school quality to each regres-sion. The strong similarity between these results and those presentedearlier is quite striking. The results indicate that our results do notappear to be driven by unobserved differences between the South andthe rest of the country. They also show that when we control for a widelyregarded measure of school quality (and thus skill) differences withinthe South, key results remain basically qualitatively unchanged.
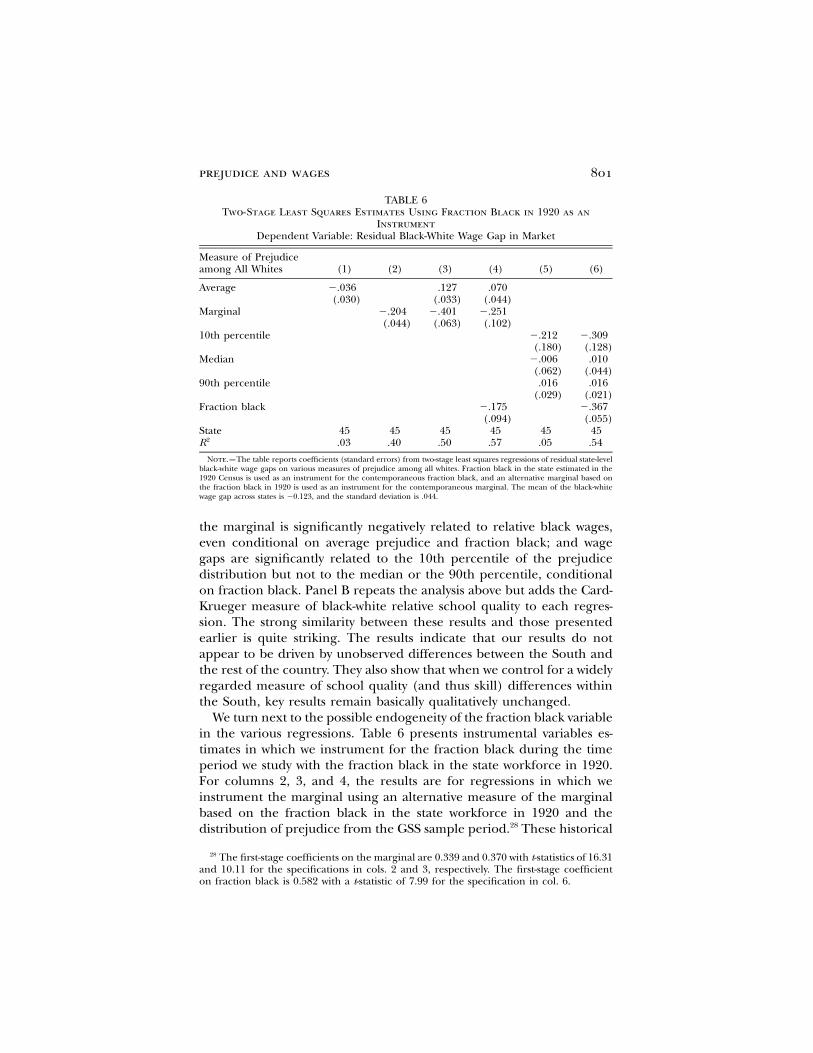
We turn next to the possible endogeneity of the fraction black variablein the various regressions. Table 6 presents instrumental variables es-timates in which we instrument for the fraction black during the timeperiod we study with the fraction black in the state workforce in 1920.For columns 2, 3, and 4, the results are for regressions in which weinstrument the marginal using an alternative measure of the marginalbased on the fraction black in the state workforce in 1920 and thedistribution of prejudice from the GSS sample period.28 These historical
28 The first-stage coefficients on the marginal are 0.339 and 0.370 with t-statistics of 16.31and 10.11 for the specifications in cols. 2 and 3, respectively. The first-stage coefficienton fraction black is 0.582 with a t-statistic of 7.99 for the specification in col. 6.
802 journal of political economy
population shares are obviously correlated with the number of blackscurrently living in a state. In effect, the instrumental variables strategyisolates and uses only that variation in the current racial makeup of astate attributable to the historical accident of where blacks were located8 decades ago. To the extent that this historical racial makeup of statesis independent of current determinants of wages, the estimates arepurged of the endogeneity concerns from recent migration.
The table shows that this measure for the marginal yields results thatare strikingly similar to the baseline results. We stress that we cannotreject the possibility that a state’s historical racial makeup is correlatedin some way with factors that determine wages nearly a century later,but the results raise confidence that the results we are estimating reallyreflect the effect of the marginal discriminator being drawn from ahigher point in the distribution of prejudice rather than some corre-lation between unmeasured productivity and current racial composition.The results in column 6 are probably even more convincing. In theseregressions we include the different percentile measures and simplyinstrument for the fraction black. Again, the results are qualitativelyalmost identical to the main results presented earlier.
In summary, we believe that these results taken together stronglysupport the results presented in the previous section and suggest thatthe relationship we document between relative wages and both the prej-udice in a state and the fraction of the state workforce that is blackderives causally from the mechanisms described in Becker’s prejudicemodel.
Examining the Role of Workplace Segregation
Before concluding, we present one final set of results assessing therelationship between workforce racial segregation and racial wage gaps.In the review of the model, we stressed that a key point of Becker’sreasoning is that the degree to which racial wage gaps are observed inequilibrium will depend on the extent to which the market can besegregated by race. The only data that we could find about the extentto which whites interacted with blacks at work—the dimension of seg-regation most relevant for thinking about the effect of contact discrim-ination—come from the 2000 wave of the National Education Longi-tudinal Study of 1988 (NELS). NELS respondents were asked whatfraction of their coworkers were of the same race as they.29 The NELSpopulation is relatively young in 2000, but this information about work-place segregation will be closely related to what is true of whites overall
29 Specifically, people were asked, “What percentage of the people in your present/mostrecent workplace are of the same race as you?”
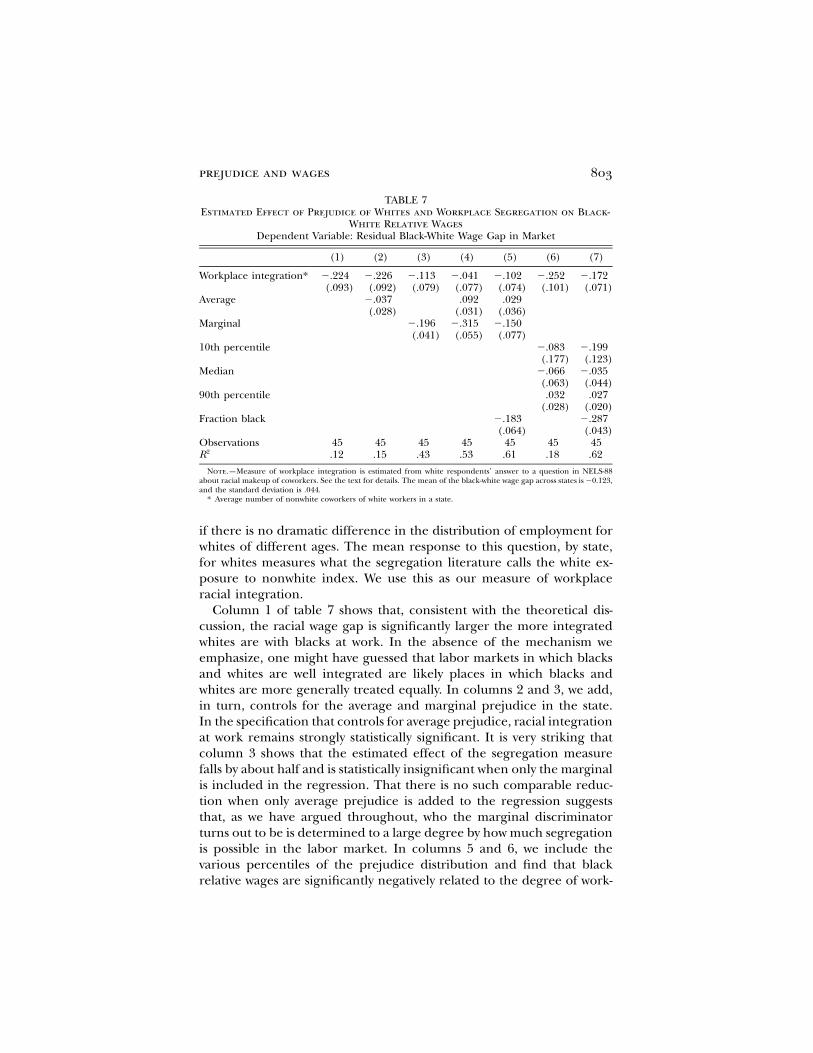
prejudice and wages 803
TABLE 7Estimated Effect of Prejudice of Whites and Workplace Segregation on Black-
White Relative WagesDependent Variable: Residual Black-White Wage Gap in Market
(1) (2) (3) (4) (5) (6) (7)
Workplace integration* �.224 �.226 �.113 �.041 �.102 �.252 �.172(.093) (.092) (.079) (.077) (.074) (.101) (.071)
Average �.037 .092 .029(.028) (.031) (.036)
Marginal �.196 �.315 �.150(.041) (.055) (.077)
10th percentile �.083 �.199(.177) (.123)
Median �.066 �.035(.063) (.044)
90th percentile .032 .027(.028) (.020)
Fraction black �.183 �.287(.064) (.043)
Observations 45 45 45 45 45 45 452R .12 .15 .43 .53 .61 .18 .62
Note.—Measure of workplace integration is estimated from white respondents’ answer to a question in NELS-88about racial makeup of coworkers. See the text for details. The mean of the black-white wage gap across states is �0.123,and the standard deviation is .044.
* Average number of nonwhite coworkers of white workers in a state.
if there is no dramatic difference in the distribution of employment forwhites of different ages. The mean response to this question, by state,for whites measures what the segregation literature calls the white ex-posure to nonwhite index. We use this as our measure of workplaceracial integration.
Column 1 of table 7 shows that, consistent with the theoretical dis-cussion, the racial wage gap is significantly larger the more integratedwhites are with blacks at work. In the absence of the mechanism weemphasize, one might have guessed that labor markets in which blacksand whites are well integrated are likely places in which blacks andwhites are more generally treated equally. In columns 2 and 3, we add,in turn, controls for the average and marginal prejudice in the state.In the specification that controls for average prejudice, racial integrationat work remains strongly statistically significant. It is very striking thatcolumn 3 shows that the estimated effect of the segregation measurefalls by about half and is statistically insignificant when only the marginalis included in the regression. That there is no such comparable reduc-tion when only average prejudice is added to the regression suggeststhat, as we have argued throughout, who the marginal discriminatorturns out to be is determined to a large degree by how much segregationis possible in the labor market. In columns 5 and 6, we include thevarious percentiles of the prejudice distribution and find that blackrelative wages are significantly negatively related to the degree of work-
804 journal of political economy
place integration conditional on the full distribution of prejudicial tastesand the fraction black in the workforce in the state. The fact that theeffect of workplace integration falls more when the marginal is con-trolled for than when the percentiles of the prejudice distribution andpercent black are included argues further that a mechanism linkingwages and prejudice, operating through the market’s ability to separateraces at work, determines the racial wage gap, as we have arguedthroughout.
VI. Conclusion
Our primary goal in this paper has been to empirically test the sharpbut subtle predictions about the relationship between community-levelprejudice and racial wage gaps implied in Becker’s seminal model ofemployer discrimination. To our knowledge, no previous paper in thelarge literature on discrimination has attempted to do this.
We motivate our analysis by first reviewing the short-run version ofBecker’s classic model, from which the predictions that are central toour analysis come. We then discuss criticisms by Arrow and others, ar-guing that those predictions cannot hold in the long run under standardcompetitive assumptions. We point out that this interpretation has be-come the standard discussion in most textbook discussions of employerprejudice, despite the fact that recent work by various authors, includingprevious work of ours, has shown that prejudice can indeed survive inthe labor market in the long run.
Using rich data on prejudice from multiple years of data from theGeneral Social Survey, we summarize both the cross-sectional variationand trends over time in racial prejudice among whites. We documentsignificant variation in prejudice across different regions of the country.We also show that while reported prejudice has declined significantlyeverywhere over the past 30 years, the magnitude of that decline hasbeen fairly consistent across regions, though there is some evidence ofconvergence.
In our main empirical analysis, we test for, and confirm, a series ofkey predictions from the standard Becker model. First, we show thatracial wage gaps are much more closely related to the level of prejudiceof the “marginal” person in the distribution than they are to averagelevels of prejudice. Even more striking, we show that it is only prejudicein the left tail of the prejudice distribution that seems to matter forwage gaps; wages do not vary at all with the prejudice of the mostprejudiced persons in a state. This is precisely as the Becker modelpredicts. Finally, we show that the fraction of a workforce that is blackis strongly negatively related to racial wage gaps—again, just as theprejudice model predicts. We conduct a variety of robustness tests, in-
prejudice and wages 805
cluding instrumental variables estimates and regressions in which wecontrol directly for skill differences across regions that might be analternative explanation for our results. Our key results are robust to allthese extensions.
In our view, the paper’s various results point to an important role forracial prejudice in wage determination for minorities. Clearly, muchmore work, both on the theoretical front and with respect to empiricalanalysis, needs to be done in order for us to have a better sense of theways in which prejudice operates and the effect it has on wages. Forexample, we have analyzed a particularly simple form of racial animus:an aversion to cross-racial contact. In this we follow Becker, who assumesthat this is the form that racial prejudice takes. However, racial animuscan take other forms that might be relevant for wage determination.Explicit theoretical analysis of alternative formulations of prejudice isan obvious next step for future work. In addition, an important areafor future work would be to assess how racial prejudice, perhaps throughits effect on wages, affects other important outcomes such as migrationor occupational choice.
Our various results suggest that racial prejudice among whites ac-counts for as much as one-fourth of the gap in wages between blacksand whites. This is a significant share and is associated with a presentdiscounted loss in annual earnings for blacks of between $34,000 and$115,000, depending on the intensity of the prejudice of the marginalwhite in their states. However, the fact that three-quarters of the racialwage gap appears not to be the result of prejudice suggests that theother mechanisms posited in the literature such as statistical discrimi-nation and human capital differences indeed matter very importantlyfor racial wage determination.
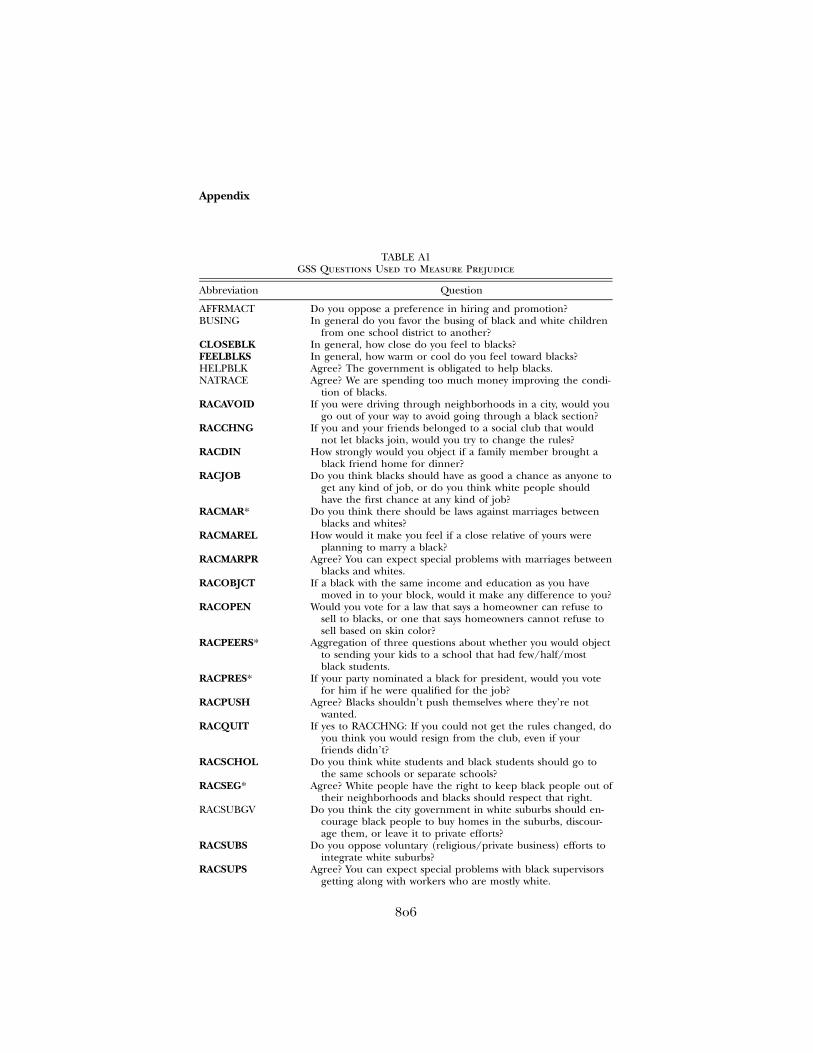
806
Appendix
TABLE A1GSS Questions Used to Measure Prejudice
Abbreviation Question
AFFRMACT Do you oppose a preference in hiring and promotion?BUSING In general do you favor the busing of black and white children
from one school district to another?CLOSEBLK In general, how close do you feel to blacks?FEELBLKS In general, how warm or cool do you feel toward blacks?HELPBLK Agree? The government is obligated to help blacks.NATRACE Agree? We are spending too much money improving the condi-
tion of blacks.RACAVOID If you were driving through neighborhoods in a city, would you
go out of your way to avoid going through a black section?RACCHNG If you and your friends belonged to a social club that would
not let blacks join, would you try to change the rules?RACDIN How strongly would you object if a family member brought a
black friend home for dinner?RACJOB Do you think blacks should have as good a chance as anyone to
get any kind of job, or do you think white people shouldhave the first chance at any kind of job?
RACMAR* Do you think there should be laws against marriages betweenblacks and whites?
RACMAREL How would it make you feel if a close relative of yours wereplanning to marry a black?
RACMARPR Agree? You can expect special problems with marriages betweenblacks and whites.
RACOBJCT If a black with the same income and education as you havemoved in to your block, would it make any difference to you?
RACOPEN Would you vote for a law that says a homeowner can refuse tosell to blacks, or one that says homeowners cannot refuse tosell based on skin color?
RACPEERS* Aggregation of three questions about whether you would objectto sending your kids to a school that had few/half/mostblack students.
RACPRES* If your party nominated a black for president, would you votefor him if he were qualified for the job?
RACPUSH Agree? Blacks shouldn’t push themselves where they’re notwanted.
RACQUIT If yes to RACCHNG: If you could not get the rules changed, doyou think you would resign from the club, even if yourfriends didn’t?
RACSCHOL Do you think white students and black students should go tothe same schools or separate schools?
RACSEG* Agree? White people have the right to keep black people out oftheir neighborhoods and blacks should respect that right.
RACSUBGV Do you think the city government in white suburbs should en-courage black people to buy homes in the suburbs, discour-age them, or leave it to private efforts?
RACSUBS Do you oppose voluntary (religious/private business) efforts tointegrate white suburbs?
RACSUPS Agree? You can expect special problems with black supervisorsgetting along with workers who are mostly white.
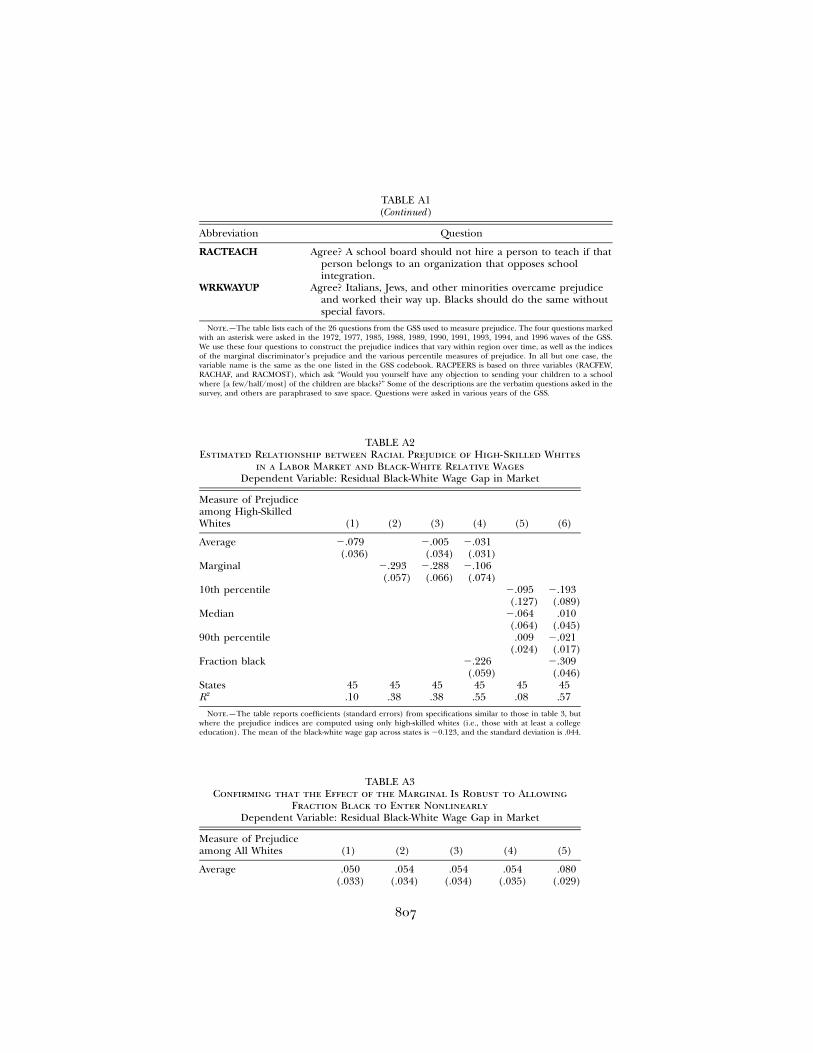
807
TABLE A1(Continued)
Abbreviation Question
RACTEACH Agree? A school board should not hire a person to teach if thatperson belongs to an organization that opposes schoolintegration.
WRKWAYUP Agree? Italians, Jews, and other minorities overcame prejudiceand worked their way up. Blacks should do the same withoutspecial favors.
Note.—The table lists each of the 26 questions from the GSS used to measure prejudice. The four questions markedwith an asterisk were asked in the 1972, 1977, 1985, 1988, 1989, 1990, 1991, 1993, 1994, and 1996 waves of the GSS.We use these four questions to construct the prejudice indices that vary within region over time, as well as the indicesof the marginal discriminator’s prejudice and the various percentile measures of prejudice. In all but one case, thevariable name is the same as the one listed in the GSS codebook. RACPEERS is based on three variables (RACFEW,RACHAF, and RACMOST), which ask “Would you yourself have any objection to sending your children to a schoolwhere [a few/half/most] of the children are blacks?” Some of the descriptions are the verbatim questions asked in thesurvey, and others are paraphrased to save space. Questions were asked in various years of the GSS.
TABLE A2Estimated Relationship between Racial Prejudice of High-Skilled Whites
in a Labor Market and Black-White Relative WagesDependent Variable: Residual Black-White Wage Gap in Market
Measure of Prejudiceamong High-SkilledWhites (1) (2) (3) (4) (5) (6)
Average �.079 �.005 �.031(.036) (.034) (.031)
Marginal �.293 �.288 �.106(.057) (.066) (.074)
10th percentile �.095 �.193(.127) (.089)
Median �.064 .010(.064) (.045)
90th percentile .009 �.021(.024) (.017)
Fraction black �.226 �.309(.059) (.046)
States 45 45 45 45 45 452R .10 .38 .38 .55 .08 .57
Note.—The table reports coefficients (standard errors) from specifications similar to those in table 3, butwhere the prejudice indices are computed using only high-skilled whites (i.e., those with at least a collegeeducation). The mean of the black-white wage gap across states is �0.123, and the standard deviation is .044.
TABLE A3Confirming that the Effect of the Marginal Is Robust to Allowing
Fraction Black to Enter NonlinearlyDependent Variable: Residual Black-White Wage Gap in Market
Measure of Prejudiceamong All Whites (1) (2) (3) (4) (5)
Average .050(.033)
.054(.034)
.054(.034)
.054(.035)
.080(.029)
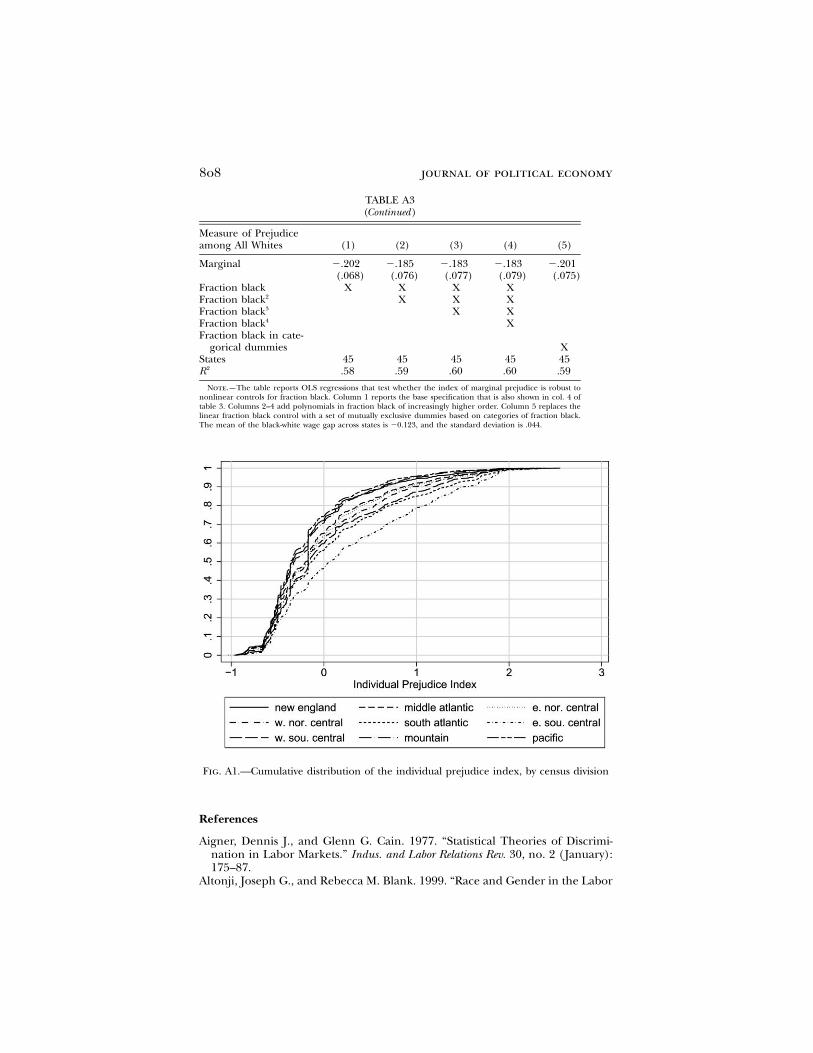
808 journal of political economy
TABLE A3(Continued)
Measure of Prejudiceamong All Whites (1) (2) (3) (4) (5)
Marginal �.202(.068)
�.185(.076)
�.183(.077)
�.183(.079)
�.201(.075)
Fraction black X X X XFraction black2 X X XFraction black3 X XFraction black4 XFraction black in cate-
gorical dummies XStates 45 45 45 45 45
2R .58 .59 .60 .60 .59
Note.—The table reports OLS regressions that test whether the index of marginal prejudice is robust tononlinear controls for fraction black. Column 1 reports the base specification that is also shown in col. 4 oftable 3. Columns 2–4 add polynomials in fraction black of increasingly higher order. Column 5 replaces thelinear fraction black control with a set of mutually exclusive dummies based on categories of fraction black.The mean of the black-white wage gap across states is �0.123, and the standard deviation is .044.
Fig. A1.—Cumulative distribution of the individual prejudice index, by census division
References
Aigner, Dennis J., and Glenn G. Cain. 1977. “Statistical Theories of Discrimi-nation in Labor Markets.” Indus. and Labor Relations Rev. 30, no. 2 (January):175–87.
Altonji, Joseph G., and Rebecca M. Blank. 1999. “Race and Gender in the Labor
prejudice and wages 809
Market.” In Handbook of Labor Economics, vol. 3C, edited by Orley C. Ashenfelterand David Card. New York: Elsevier.
Altonji, Joseph G., and Charles R. Pierret. 2001. “Employer Learning and Sta-tistical Discrimination.” Q.J.E. 116, no. 1 (February): 313–50.
Arrow, Kenneth. 1972. “Some Mathematical Models of Race in the LaborMarket.” In Racial Discrimination in Economic Life, edited by A. H. Pascal. Lex-ington, MA: Lexington Books.
———. 1973. “The Theory of Discrimination.” In Discrimination in Labor Markets,edited by Orley Ashenfelter and Albert Rees. Princeton, N.J.: Princeton Univ.Press.
Autor, David H., Lawrence F. Katz, and Melissa S. Kearney. 2005. “Trends in U.S.Wage Inequality: Re-assessing the Revisionists.” Working Paper no. 11627 (Sep-tember), NBER, Cambridge, MA.
Becker, Gary S. [1957] 1971. The Economics of Discrimination. 2nd ed. Chicago:Univ. Chicago Press.
Bertrand, Marianne, and Sendhil Mullainathan. 2004. “Are Emily and Greg MoreEmployable than Lakisha and Jamal? A Field Experiment on Labor MarketDiscrimination.” A.E.R. 94, no.4 (September): 991–1013.
Black, Dan A. 1995. “Discrimination in an Equilibrium Search Model.” J. LaborEcon. 13, no. 2 (April): 309–34.
Card, David, and Alan Krueger. 1992. “Does School Quality Matter? Returns toEducation and the Characteristics of Public Schools in the United States.”J.P.E. 100, no. 1 (February): 1–40.
Card, David, Alexandre Mas, and Jesse Rothstein. 2008. “Tipping and the Dy-namics of Segregation.” Q.J.E. 123, no. 1 (February): 177–218.
Charles, Kerwin K., and Jonathan Guryan. 2007. “Prejudice and the Economicsof Discrimination.” Working Paper no. 13661, NBER, Cambridge, MA.
Chiswick, Barry R. 1973. “Racial Discrimination in the Labor Market: A Test ofAlternative Hypotheses.” J.P.E. 81, no. 6 (November/December): 1330–52.
Cutler, David, Edward Glaeser, and Jacob Vigdor. 1999. “The Rise and Declineof the American Ghetto.” J.P.E. 107, no. 3 (June): 455–506.
Ehrenberg, Ronald, and Robert S. Smith. 2006. Modern Labor Economics: Theoryand Public Policy. 9th ed. Boston: Addison-Wesley.
Fryer, Roland, and Steve Levitt. 2004. “The Causes and Consequences of Dis-tinctively Black Names.” Q.J.E. 119, no. 3 (August): 767–805.
Goldberg, Matthew S. 1982. “Discrimination, Nepotism, and the Long-Run WageDifferential.” Q.J.E. 97, no. 2 (May): 307–19.
Heckman, James J. 1998. “Detecting Discrimination.” J. Econ. Perspectives 12, no.2 (Spring): 101–16.
Lang, Kevin, Michael Manove, and William Dickens. 2005. “Racial Discriminationin Markets with Announced Wages.” A.E.R. 95, no. 4 (September): 1327–40.
Lemieux, Thomas. 2006. “Increasing Residual Wage Inequality: CompositionEffects, Noisy Data, or Rising Demand for Skill?” A.E.R. 96, no. 3 (June): 461–98.
Neal, Derek A., and William R. Johnson. 1996. “The Role of Premarket Factorsin Black-White Wage Differences.” J.P.E. 104, no. 5 (October): 869–95.
O’Neill, June. 1990. “The Role of Human Capital in Earnings Differences be-tween Black and White Men.” J. Econ. Perspectives 4, no. 4 (Fall): 25–45.
Phelps, Edmund S. 1972. “The Statistical Theory of Racism and Sexism.” A.E.R.62, no. 4 (September): 659–61.