preit 1999 annual report2 (thousands of dollars except per share results) years ended december 31...
TRANSCRIPT

196019601960
1 9 9 9
Pennsylvania Real Estate Investment Trust
A n n u a l R e p o r t
W e w e r e h e r e f o r t y y e a r s a g o.

L o o k w h e r e w e

a r e t o d a y .
2
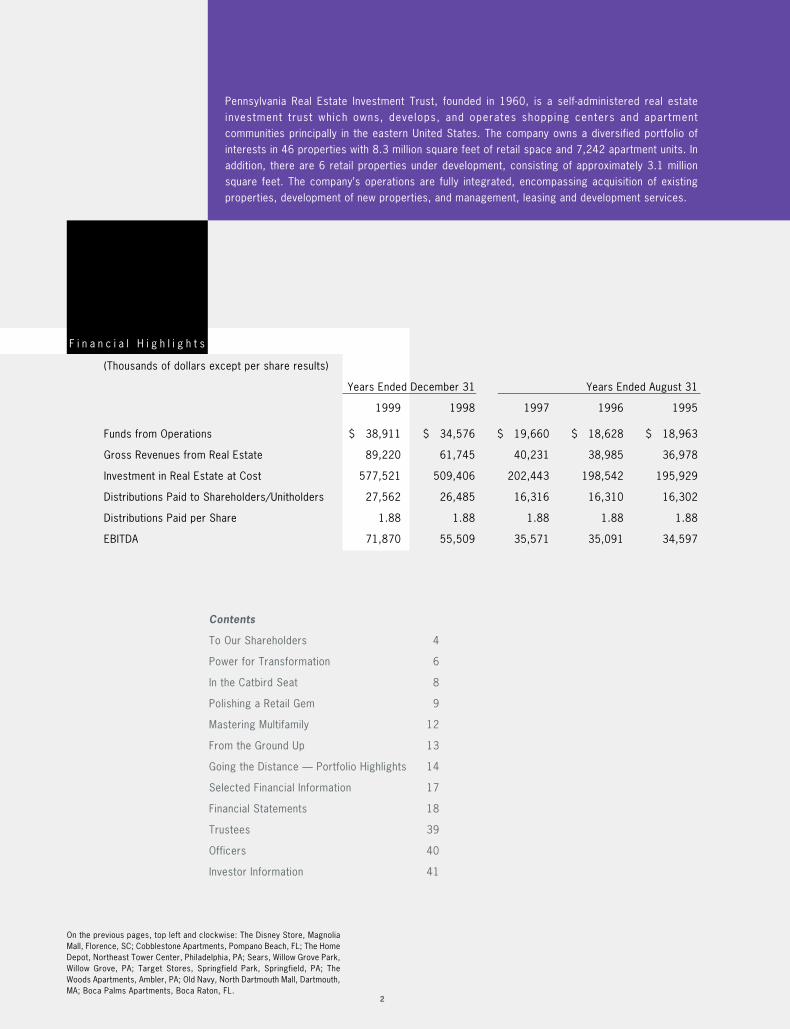
(Thousands of dollars except per share results)
Years Ended December 31 Years Ended August 31
1999 1998 1997 1996 1995
Funds from Operations $ 38,911 $ 34,576 $ 19,660 $ 18,628 $ 18,963
Gross Revenues from Real Estate 89,220 61,745 40,231 38,985 36,978
Investment in Real Estate at Cost 577,521 509,406 202,443 198,542 195,929
Distributions Paid to Shareholders/Unitholders 27,562 26,485 16,316 16,310 16,302
Distributions Paid per Share 1.88 1.88 1.88 1.88 1.88
EBITDA 71,870 55,509 35,571 35,091 34,597
Pennsylvania Real Estate Investment Trust, founded in 1960, is a self-administered real estateinvestment trust which owns, develops, and operates shopping centers and apartmentcommunities principally in the eastern United States. The company owns a diversified portfolio ofinterests in 46 properties with 8.3 million square feet of retail space and 7,242 apartment units. Inaddition, there are 6 retail properties under development, consisting of approximately 3.1 millionsquare feet. The company’s operations are fully integrated, encompassing acquisition of existingproperties, development of new properties, and management, leasing and development services.
F i n a n c i a l H i g h l i g h t s
Contents
To Our Shareholders 4
Power for Transformation 6
In the Catbird Seat 8
Polishing a Retail Gem 9
Mastering Multifamily 12
From the Ground Up 13
Going the Distance — Portfolio Highlights 14
Selected Financial Information 17
Financial Statements 18
Trustees 39
Officers 40
Investor Information 41
On the previous pages, top left and clockwise: The Disney Store, MagnoliaMall, Florence, SC; Cobblestone Apartments, Pompano Beach, FL; The HomeDepot, Northeast Tower Center, Philadelphia, PA; Sears, Willow Grove Park,Willow Grove, PA; Target Stores, Springfield Park, Springfield, PA; TheWoods Apartments, Ambler, PA; Old Navy, North Dartmouth Mall, Dartmouth,MA; Boca Palms Apartments, Boca Raton, FL.

3
For40years, PREIT has been in the business of
building value for our investors. Across 92 consecutive
periods, PREIT has paid out a substantial dividend — never
reduced, never omitted. We have sustained this consistent
track record of profitability through our creativity, discipline,
entrepreneurship, diverse strengths and a relentless focus
on increasing the value of our investments. And we are just
getting started.
1960 1970 1980 1990 2000
Four Decades of Consistently
Strong Returns
(10/1/60 – 12/31/99)
The value of a $10,000 investment
in 1,000 PREIT shares in 1960,
with dividends reinvested. Between
1960 and the end of 1999, this
investment produced an average
return of 12.6 percent.
$ 1,200,000
1,000,000
800,000
600,000
400,000
200,000
0

4
We Are Just Getting Started
R o n a l d R u b i nC h i e f E x e c u t i v e O f f i c e r
To Our Shareholders:This year was another strong one for our business, with solid performance, consistentdividends and new initiatives. It was, however, a disappointing year for share prices acrossthe REIT industry, as our excellent performance was met with indifference from themarket. Given this environment, while we continue to develop our underlying business, weare actively implementing new financial and competitive strategies to address changingmarket conditions. These include new strategic partnerships to leverage our resourcesand a tighter focus for our real estate portfolio.
Over four decades as a public company, we have proven our ability to prosper acrossmany ups and downs of both real estate and financial markets. This year was noexception. In 1999, funds from operations (FFO) increased by 8.2 percent to $2.65 pershare, and net operating income rose by 33.8 percent to $76.8 million. We launched twomajor retail projects — Paxton Towne Centre in Harrisburg, Pennsylvania, and MetroplexShopping Center in Plymouth Meeting, Pennsylvania — which will come on line in the thirdquarter of 2000. Using strong relationships with retailers, more than 75 percent of thespace in these new centers was pre-leased before construction started — just one wayour long industry experience contributes to our successful track record in development.
Projects such as Paxton and Metroplex are strategic investments in the future. They arewell leased, well designed and well located. These two projects are building long-termvalue for shareholders. While their impact doesn’t show up on the income statement today,they are expected to make significant contributions to revenues beginning in 2001.
Leveraging Resources and ExpertiseThis year, we developed a strategic partnership to leverage our resources andrelationships. The acquisition of Willow Grove Park mall in Willow Grove, Pennsylvania willbe financed through a partnership with a major pension fund, the Pennsylvania StateEmployees Retirement System. This transaction is our first significant joint venture with amajor institutional investor. It conserves resources in the short-term, while allowing us toexercise our management and development expert ise. We are explor ing s imi larpartnerships to deploy our funds strategically and create the highest value for ourshareholders.
At the same time, we made progress in sharpening our strategic focus through thedisposition of non-core properties and the acquisition of partners’ interests in severalprojects. By gaining full control of several multifamily properties, we were able to producesignificant increases in both occupancy and rents. In addition, the sale of undevelopedland and other tangential assets added nearly $7 million to our cash resources. This year,we also retained Eastdil Realty to sell the majority of our supermarket and drugstore strip
$ 800M
Inv
es
tm
en
t
NO
I
700M
600M
500M
400M
300M
200M
100M
0M
80M
70M
60M
50M
40M
30M
20M
10M
0M1995 1996 1997 1998 1999
Investment in Operating PropertiesDevelopment & Construction in Progress (CIP)NOI
5
center portfolio — six properties with 870,000 square feet ofGLA. This move is expected to generate additional capital forour core businesses, while allowing us to concentrate on ourstrengths in retail power centers, malls and multifamily.
We continue to exercise financial and operational discipline toincrease the power of our investments, boost revenues andcut costs. Our arrangement of $108 mil l ion in long-termfinancing in April locked in a favorable rate of 6.77 percent,protecting us against interest rate increases. We also aregenerating new sources of ancillary and sponsorship revenuesfrom our existing properties.
An Age of Rapid ChangeThe future promises to hold even more changes for ourcompany and our industry. Although it represents only a smallpercentage of the retail market, we saw the rapid emergenceof electronic commerce in 1999. We believe that e-commercewill have an impact on how retail purchases are fulfilled, butnot in ways that undermine the value and experience of ourreal estate business. Apparel and high-end retailing, which areat the core of regional malls, are expected to remain strong inth is new reta i l i ng era. The per formance of mu l t i fami lyproperties also should be unaffected.
Just as newspapers thrived after the advent of radio and themotion picture industry grew even more rapidly after theintroduction of television, we expect physical and virtualreta i l ing to complement one another. Successful d irectmarketing companies such as Gateway are developing theirown retail outlets as a 3-D billboard for their direct sales, andtop retailers such as The Gap are finding the Web is a greattool for increasing store visits and building a store’s image.This complementary relationship between “clicks and bricks”retailing was reflected in the excellent sales across all ourretail properties during the 1999 holiday season — while Web-based businesses also enjoyed rapid growth.
Finally, like our tenants, we are finding ways to use the Internetto support our own business. We are rolling out Web sites forall our malls and power centers to support the marketing ofour retailers and strengthen connections with customers. Asnew technologies emerge, we are committed to using them tobuild value for our business.
Looking ForwardWe already have seen many changes in the course of our firstfour decades — the rapid growth of suburban populations andthe rise of baby boomers, Generation X and echo boomers.Jus t as we have met these cha l l enges , we w i l l f i ndopportunities in the shifts ahead — creative ways to use ourstrengths in the development, acquisition and management ofreta i l and mult i fami ly propert ies to produce strong andconsistent returns for our shareholders.
Although we were among the first REITs, we continue to takean en t repreneur ia l approach to our bus iness . We a redeveloping innovative strategies for changing markets andhave many new projects in the pipel ine. In selecting ourportfolio of properties, we look for dynamic investments wherewe can develop, renovate and add value.
It has been a wonderful first four decades. Thank you for yourcommitment to PREIT. We look forward to even greater returnsin the decades ahead. In many ways, we are just gettingstarted.
Ronald RubinChief Executive Officer
Jonathan B. WellerPresident and Chief Operating Officer
Sylvan M. CohenChairman
March 15, 2000
S y l v a n M . C o h e nC h a i r m a n
J o n a t h a n B . W e l l e rP r e s i d e n t a n d C h i e f O p e r a t i n g O f f i c e r

6
Paxton Towne Centre Development, February 2000,Harrisburg, PA.
Our experience gives us the power for transformation — to turn anundeveloped site into a booming retail center, to jump-start a decliningmal l or br ing an underperforming apartment community to fu l lcapacity. Like a marathon runner, we have built our expertise andstrong relationships with key retailers through steady training. Ourmanagement team is one of the deepest and most experienced, withan average of 21 years at the company and 28 years in the industry.All this power is focused on one goal: building value for our customers,partners and shareholders.
P o w e r f o r T r a n s f o r m a t i o n

7

8
– George F. RubinPresident, PREIT-RUBIN, Inc.
“ Our mall management and development expertise allows us to recognizeopportunit ies to create value. Through a partnership with a majorpension fund, we are gaining control of a high-value property in a waythat uses our financial resources strategically.”
B u i l d i n g f o r t h e F u t u r e
Three level view of Willow Grove Park Fountain Court.
After developing and managing Willow Grove Park mall for nearly twodecades, we have an excellent view of its strong current performanceand untapped potential in a very attractive retail market. In 1999, weinitiated plans for a $140 million acquisition of the mall — originally developed by The Rubin Organization. To increase the valueof this asset, we developed a renovation plan — which includes the addition of a fourth anchor, Macy’s — and signed otherhigh-profile retailers. Finally, we partnered with a major pension fund, The Pennsylvania StateEmployees Retirement System, to make the acquisition. This relationship conserves ourresources during construction while utilizing our full management talents.
In the Catbird Seat

9
U s i n g C r e a t i v i t y T o P a c k t h e H o u s e
“ At the end of 1999, we recorded the best year in the history of NorthDartmouth Mall, with strong increases in sales and NOI. Retailers havedone very well here, occupancy has gone up and rents are rising. We areseeing real results.”
– Joseph F. CoradinoExecutive Vice President, Retail Division
The brand new GAP store at North Dartmouth Mall.
North Dartmouth Mall in Dartmouth, Massachusetts, wasa diamond in the rough when we acquired it in 1997. Bychanging the tenant mix to meet customer needs, with the addition of tenants like Old Navy, The Gap and American Eagle, wetransformed this underperformer into a star. Occupancy has improved to 87 percent and sales rose 28 percent in 1999 to$343 per square foot. Net operating income has increased 37 percent since 1997 to $4.8 million. Now that its potential hasbeen proven, we announced plans in November to invest $8 million in renovationsto build on this success. These renovations, beginning in 2000, will allow us toattract new tenants and draw more customers from this high-potential market.
Polishing a Retailing Gem

10
While many REITs specialize only in one product line, we specialize in two —
multifamily
11
Our diverse management strengths and geographic reach give us the flexibility to succeed through many different cycles of the market. Like cross-training, thisstrategy ensures that we have the broad capabilities and resiliency to perform con-sistently well, and to build value for our investors, no matter what the future holds.
and retail.

12
– Raymond J. TrostVice President, Asset ManagementSpeaking to our new management team at the Emerald Point multifamily property inVirginia Beach after PREIT acquired full control of the property from a former partner.
B e e n T h e r e , D o n e T h a t
“ We ’ve seen fire, hurricanes, tornadoes… there is nothing that canhappen here that we haven’t seen before.”
Eagle’s Nest Apartments in Coral Springs, Florida.
The expertise of PREIT’s seasoned multifamily leadership consistently pays off.This year we significantly improved the performance of two multifamily propertiesafter acquiring control from former partners in 1998. Renovations and a changein management at Fox Run Apartments in Delaware and Eagle’s Nest Apartments in Florida helped drive up occupancy to 96percent at both properties and boost rents by an average of 5.5 percent. This is a clear demonstration of the power of PREIT’smultifamily skills, honed in owning or managing themore than 7,000 apartments in our portfolio.
Mastering Multifamily

13
L o n g - T e r m V a l u e C r e a t i o n
“ We have the discipline to focus on real estate with high intrinsic value.Not only wi l l these locations have value for the purposes we areproposing today but also for other uses in the future.”
– Douglas S. GraysonExecutive Vice President, Development
Target Stores at Paxton Towne Centre under construction, February 2000.
PREIT brought together top national retailers and a growingmarket to create what will be the premiere regional power centerfor Harrisburg, Pennsylvania. The 695,000 square-foot PaxtonTowne Centre, scheduled for completion in August 2000, opens up new territory for anchor tenants such as Target Stores,Kohl’s, Weis Markets, Borders Books and Music, Michael’s Crafts, and Bed, Bath & Beyond. The retailers in the $62 millioncenter discovered an outstanding location in a rapidly growing residential community strategically located in the dominant retailcorridor between Interstates 83 and 81. Our ability to match top retailers with attractive markets isone of the ways we turn promising real estate into strong value for our company and investors.
From theGround Up

G o i n g t h e D i s t a n c e
14
Multifamily
Retail Properties
Other
12/31/98 $64812/31/99 $743
36%
1%
63%
40%
2%
58%
T o t a l P o r t f o l i o
Percentage of investment in real estate, at cost (in millions)
P r o p e r t y L o c a t i o n s
P o r t f o l i o H i g h l i g h t sNo. of
Summary Properties Square Feet Units Acres
Portfolio at 12/31/98Retail Properties 20 8,048,114 — —Multifamily 19 — 7,243 —Industrial Properties 6 689,791 — —Land 3 — — 90Total 48 8,737,905 7,243 90
Development Retail Properties 5 2,195,662 — —
Combined Total 53 10,933,567 7,243 90
Portfolio at 12/31/99Retail Properties 22 8,305,954 —Multifamily 19 — 7,242Industrial Properties 5 548,791 —Total 46 8,854,745 7,242
DevelopmentRetail Properties 6 3,050,070 —
Combined Total 52 11,904,815 7,242
PA
MDDE
NJ
Headquarters
Existing Properties
Development Properties
Managed Properties
Note: Delaware Valley bullet encompasses 13 managed properties
We own interests in 8.3 million square feet of retail space, are managing 20.8 millionsquare feet, and have 3.1 million square feet in development. All told, these propertieswould cover a one-foot path from Philadelphia to Los Angeles and back.

15
E x i s t i n g R e t a i l P r o p e r t i e sOwnership Total
City State Property Type Interest Acquired GLA
Christiana Center I Newark DE Power Center 100% 1998 302,439Valley View Shopping Center Wilmington DE Strip Center 100% 1998 55,798Mandarin Corners Jacksonville FL Strip Center 100% 1986 238,861 Park Plaza Shopping Center (1) Pinellas Park FL Strip Center 50% 1963 155,528South Blanding Village Jacksonville FL Strip Center 100% 1986 106,857North Dartmouth Mall Dartmouth MA Enclosed Mall 100% 1997 637,866Forestville Shopping Center Forestville MD Strip Center 100% 1983 217,934 Prince Georges Plaza Hyattsville MD Enclosed Mall 100% 1998 744,911 Rio Mall Rio Grande NJ Strip Center 60% 1973 165,583 Crest Plaza Shopping Center Allentown PA Strip Center 100% 1964 157,370 Festival at Exton Exton PA Strip Center 100% 1998 144,952 Ingleside Center Thorndale PA Strip Center 70% 1981 101,271 Laurel Mall Hazleton PA Enclosed Mall 40% 1988 558,801 Lehigh Valley Mall Allentown PA Enclosed Mall 50% 1973 1,051,253 Northeast Tower Center (2)(3) Philadelphia PA Power Center 89% 1998 479,498 Palmer Park Mall Easton PA Enclosed Mall 50% 1972 456,879 Red Rose Commons Lancaster PA Power Center 50% 1998 463,042Springfield Park Springfield PA Strip Center 50% 1997 268,500The Court at Oxford Valley Langhorne PA Power Center 50% 1997 704,486 Whitehall Mall Allentown PA Power Center 50% 1964 530,096 Florence Commons Florence SC Strip Center 100% 1999 197,258Magnolia Mall Florence SC Enclosed Mall 100% 1997 566,771 Total (22 properties) 8,305,954
D e v e l o p m e n t R e t a i l P r o p e r t i e sExpected Ownership Total
City State Property Type Completion Status Interest GLA (4)
Christiana Center (Phase II) Newark DE Power Center 4Q01 Pre-Development 100% 445,000Metroplex Shopping Center Plymouth Meeting PA Power Center 4Q00 Construction 50% 780,000Creekview Shopping Center Warrington PA Power Center 4Q00 Construction 100% 418,416Frankford Arsenal Philadelphia PA Power Center 4Q01 Pre-Development 100% 508,559Pavillion at Market East Philadelphia PA Entertainment Center 4Q01 Pre-Development 50% 202,844Paxton Towne Center Harrisburg PA Power Center 4Q00 Construction 100% 695,251Total (6 properties) 3,050,070
(1) PREIT’s interest sold to its joint venture partner in January 2000
(2) Income producing as of 12/31/99, but still under development
(3) PREIT will acquire the remaining 11% ownership interest in January 2002
(4) Approximate
R e a l E s t a t e I n v e s t m e n t s

16
M u l t i f a m i l y P r o p e r t i e sOwnership
City State Interest Acquired No. of Units
Fox Run Apartments Bear DE 100% 1988/1998 414Boca Palms Apartments Boca Raton FL 100% 1994 522Cobblestone Apartments Pompano Beach FL 100% 1992 384Countrywood Apartments Tampa FL 50% 1993 536Eagle's Nest Apartments Coral Springs FL 100% 1988/1998 264Palms of Pembroke Pembroke Pines FL 100% 1994 348Shenandoah Village Apartments West Palm Beach FL 100% 1993 220Marylander Apartments Baltimore MD 100% 1962 507Regency Lakeside Apartments Omaha NE 50% 1990 433Hidden Lakes Apartments Dayton OH 100% 1994 360Kenwood Gardens Toledo OH 100% 1963 5042031 Locust Street Philadelphia PA 100% 1961 87Cambridge Hall Apartments West Chester PA 50% 1967 233Camp Hill Plaza Apartments Camp Hill PA 100% 1969 300Fox Run Apartments Warminster PA 50% 1969 196Lakewood Hills Apartments Harrisburg PA 100% 1972 562Will-O-Hill Apartments Reading PA 50% 1984 190The Woods Ambler PA 100% 1998 320Emerald Point (1) (2) Virginia Beach VA 65% 1993 862Total (19 properties) 7,242
I n d u s t r i a l P r o p e r t i e sOwnership Square
City State Interest Acquired Feet
Warehouse and Plan (Interstate Container Corp.) Lowell MA 100% 1963 197,000Warehouse (Aramark) Pennsauken NJ 100% 1962 12,034Warehouse (Sears Roebuck & Co.) Pennsauken NJ 100% 1963 29,450Warehouse (Aramark) Allentown PA 100% 1962 16,307Warehouse and Distribution Center (CVS Drug Co.) Alexandria VA 100% 1962 294,000Total (5 properties) 548,791
M a j o r N o n - P R E I T O w n e d M a n a g e d P r o p e r t i e sCity State Total GLA
Christiana Mall Newark DE 1,102,711Fairfield Mall Chicopee MA 384,772Swansea Mall Swansea MA 691,042Cumberland Mall Vineland NJ 828,483Hudson Mall Jersey City NJ 375,459Beaver Valley Mall Monaca PA 1,147,605Susquehanna Valley Mall Selinsgrove PA 663,519Willow Grove Park (3) Willow Grove PA 982,255Total (8 properties) 6,175,846
M a n a g e d a n d L e a s e d P o r t f o l i oRetail Multifamily Office/Industrial Total
No. Square Feet No. Square Feet No. Square Feet No. Square Feet
PREIT Owned 14 4,575,894 13 4,517,784 5 548,791 32 9,642,469Non-PREIT Owned 17 7,747,955 3 1,423,750 7 1,938,333 27 11,110,038Total 31 12,323,849 16 5,941,534 12 2,487,124 59 20,752,507
(1) Emerald Point is a 65%–owned joint venture which is reported on a consolidated basis.
(2) PREIT acquired partner’s 35 percent interest in January 2000.
(3) PREIT participated in the purchase of Willow Grove Park in February 2000.
R e a l E s t a t e I n v e s t m e n t s ( c o n t i n u e d )
1 9 9 9 A n n u a l R e p o r t P e n n s y l v a n i a R e a l E s t a t e I n v e s t m e n t T r u s t
17
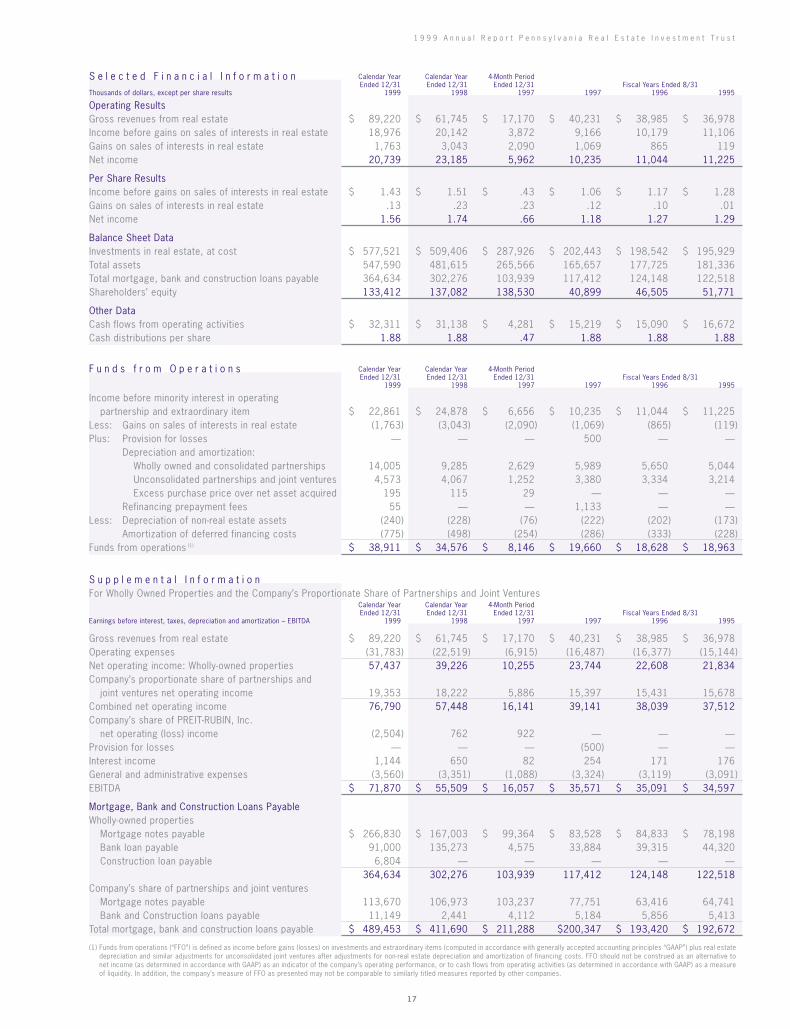
S e l e c t e d F i n a n c i a l I n f o r m a t i o n Calendar Year Calendar Year 4-Month PeriodEnded 12/31 Ended 12/31 Ended 12/31 Fiscal Years Ended 8/31
Thousands of dollars, except per share results 1999 1998 1997 1997 1996 1995
Operating ResultsGross revenues from real estate $ 89,220 $ 61,745 $ 17,170 $ 40,231 $ 38,985 $ 36,978Income before gains on sales of interests in real estate 18,976 20,142 3,872 9,166 10,179 11,106Gains on sales of interests in real estate 1,763 3,043 2,090 1,069 865 119Net income 20,739 23,185 5,962 10,235 11,044 11,225
Per Share ResultsIncome before gains on sales of interests in real estate $ 1.43 $ 1.51 $ .43 $ 1.06 $ 1.17 $ 1.28Gains on sales of interests in real estate .13 .23 .23 .12 .10 .01Net income 1.56 1.74 .66 1.18 1.27 1.29
Balance Sheet DataInvestments in real estate, at cost $ 577,521 $ 509,406 $ 287,926 $ 202,443 $ 198,542 $ 195,929Total assets 547,590 481,615 265,566 165,657 177,725 181,336Total mortgage, bank and construction loans payable 364,634 302,276 103,939 117,412 124,148 122,518Shareholders’ equity 133,412 137,082 138,530 40,899 46,505 51,771
Other DataCash flows from operating activities $ 32,311 $ 31,138 $ 4,281 $ 15,219 $ 15,090 $ 16,672Cash distributions per share 1.88 1.88 .47 1.88 1.88 1.88
F u n d s f r o m O p e r a t i o n s Calendar Year Calendar Year 4-Month PeriodEnded 12/31 Ended 12/31 Ended 12/31 Fiscal Years Ended 8/31
1999 1998 1997 1997 1996 1995
Income before minority interest in operatingpartnership and extraordinary item $ 22,861 $ 24,878 $ 6,656 $ 10,235 $ 11,044 $ 11,225
Less: Gains on sales of interests in real estate (1,763) (3,043) (2,090) (1,069) (865) (119)Plus: Provision for losses — — — 500 — —
Depreciation and amortization:Wholly owned and consolidated partnerships 14,005 9,285 2,629 5,989 5,650 5,044Unconsolidated partnerships and joint ventures 4,573 4,067 1,252 3,380 3,334 3,214Excess purchase price over net asset acquired 195 115 29 — — —
Refinancing prepayment fees 55 — — 1,133 — —Less: Depreciation of non-real estate assets (240) (228) (76) (222) (202) (173)
Amortization of deferred financing costs (775) (498) (254) (286) (333) (228)Funds from operations (1) $ 38,911 $ 34,576 $ 8,146 $ 19,660 $ 18,628 $ 18,963
S u p p l e m e n t a l I n f o r m a t i o nFor Wholly Owned Properties and the Company’s Proportionate Share of Partnerships and Joint Ventures
Calendar Year Calendar Year 4-Month PeriodEnded 12/31 Ended 12/31 Ended 12/31 Fiscal Years Ended 8/31
Earnings before interest, taxes, depreciation and amortization – EBITDA 1999 1998 1997 1997 1996 1995
Gross revenues from real estate $ 89,220 $ 61,745 $ 17,170 $ 40,231 $ 38,985 $ 36,978Operating expenses (31,783) (22,519) (6,915) (16,487) (16,377) (15,144)Net operating income: Wholly-owned properties 57,437 39,226 10,255 23,744 22,608 21,834Company’s proportionate share of partnerships and
joint ventures net operating income 19,353 18,222 5,886 15,397 15,431 15,678Combined net operating income 76,790 57,448 16,141 39,141 38,039 37,512Company’s share of PREIT-RUBIN, Inc.
net operating (loss) income (2,504) 762 922 — — —Provision for losses — — — (500) — —Interest income 1,144 650 82 254 171 176General and administrative expenses (3,560) (3,351) (1,088) (3,324) (3,119) (3,091)EBITDA $ 71,870 $ 55,509 $ 16,057 $ 35,571 $ 35,091 $ 34,597
Mortgage, Bank and Construction Loans PayableWholly-owned properties
Mortgage notes payable $ 266,830 $ 167,003 $ 99,364 $ 83,528 $ 84,833 $ 78,198Bank loan payable 91,000 135,273 4,575 33,884 39,315 44,320Construction loan payable 6,804 — — — — —
364,634 302,276 103,939 117,412 124,148 122,518Company’s share of partnerships and joint ventures
Mortgage notes payable 113,670 106,973 103,237 77,751 63,416 64,741Bank and Construction loans payable 11,149 2,441 4,112 5,184 5,856 5,413
Total mortgage, bank and construction loans payable $ 489,453 $ 411,690 $ 211,288 $200,347 $ 193,420 $ 192,672
(1) Funds from operations (“FFO”) is defined as income before gains (losses) on investments and extraordinary items (computed in accordance with generally accepted accounting principles “GAAP”) plus real estatedepreciation and similar adjustments for unconsolidated joint ventures after adjustments for non-real estate depreciation and amortization of financing costs. FFO should not be construed as an alternative tonet income (as determined in accordance with GAAP) as an indicator of the company’s operating performance, or to cash flows from operating activities (as determined in accordance with GAAP) as a measureof liquidity. In addition, the company’s measure of FFO as presented may not be comparable to similarly titled measures reported by other companies.
18
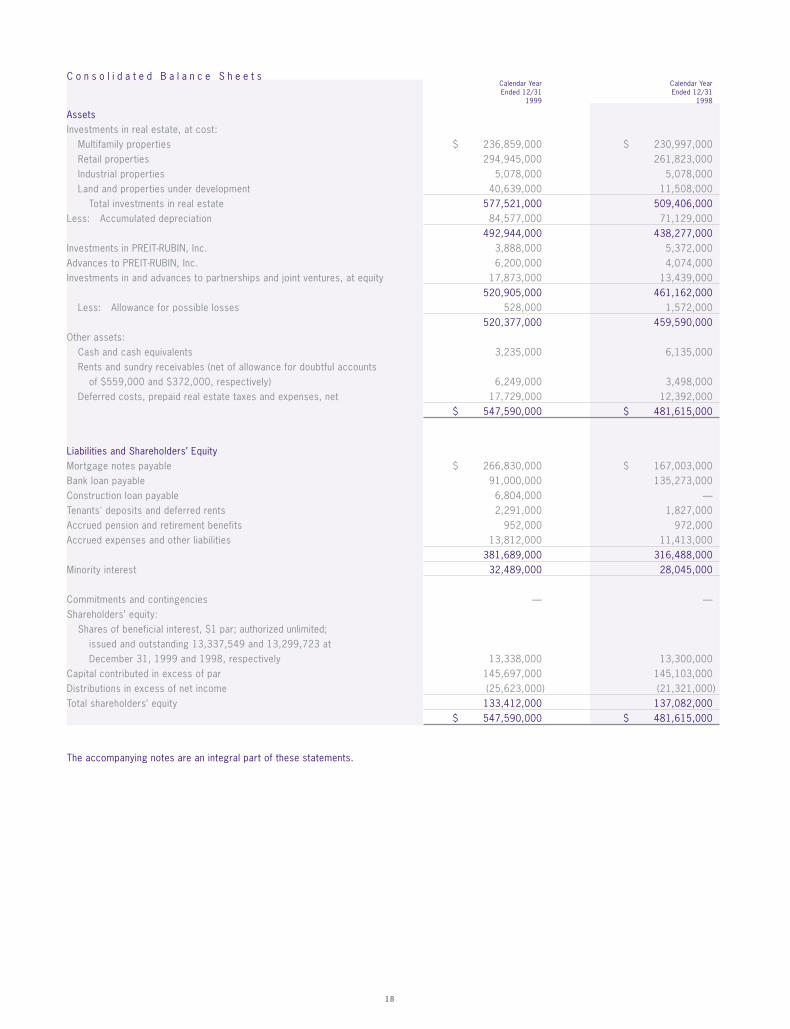
C o n s o l i d a t e d B a l a n c e S h e e t sCalendar Year Calendar YearEnded 12/31 Ended 12/31
1999 1998
AssetsInvestments in real estate, at cost:
Multifamily properties $ 236,859,000 $ 230,997,000Retail properties 294,945,000 261,823,000Industrial properties 5,078,000 5,078,000Land and properties under development 40,639,000 11,508,000
Total investments in real estate 577,521,000 509,406,000Less: Accumulated depreciation 84,577,000 71,129,000
492,944,000 438,277,000Investments in PREIT-RUBIN, Inc. 3,888,000 5,372,000Advances to PREIT-RUBIN, Inc. 6,200,000 4,074,000Investments in and advances to partnerships and joint ventures, at equity 17,873,000 13,439,000
520,905,000 461,162,000Less: Allowance for possible losses 528,000 1,572,000
520,377,000 459,590,000Other assets:
Cash and cash equivalents 3,235,000 6,135,000Rents and sundry receivables (net of allowance for doubtful accounts
of $559,000 and $372,000, respectively) 6,249,000 3,498,000Deferred costs, prepaid real estate taxes and expenses, net 17,729,000 12,392,000
$ 547,590,000 $ 481,615,000
Liabilities and Shareholders’ EquityMortgage notes payable $ 266,830,000 $ 167,003,000Bank loan payable 91,000,000 135,273,000Construction loan payable 6,804,000 —Tenants' deposits and deferred rents 2,291,000 1,827,000Accrued pension and retirement benefits 952,000 972,000Accrued expenses and other liabilities 13,812,000 11,413,000
381,689,000 316,488,000Minority interest 32,489,000 28,045,000
Commitments and contingencies — — Shareholders’ equity:
Shares of beneficial interest, $1 par; authorized unlimited;issued and outstanding 13,337,549 and 13,299,723 at December 31, 1999 and 1998, respectively 13,338,000 13,300,000
Capital contributed in excess of par 145,697,000 145,103,000Distributions in excess of net income (25,623,000) (21,321,000)Total shareholders’ equity 133,412,000 137,082,000
$ 547,590,000 $ 481,615,000
The accompanying notes are an integral part of these statements.
1 9 9 9 A n n u a l R e p o r t P e n n s y l v a n i a R e a l E s t a t e I n v e s t m e n t T r u s t
19
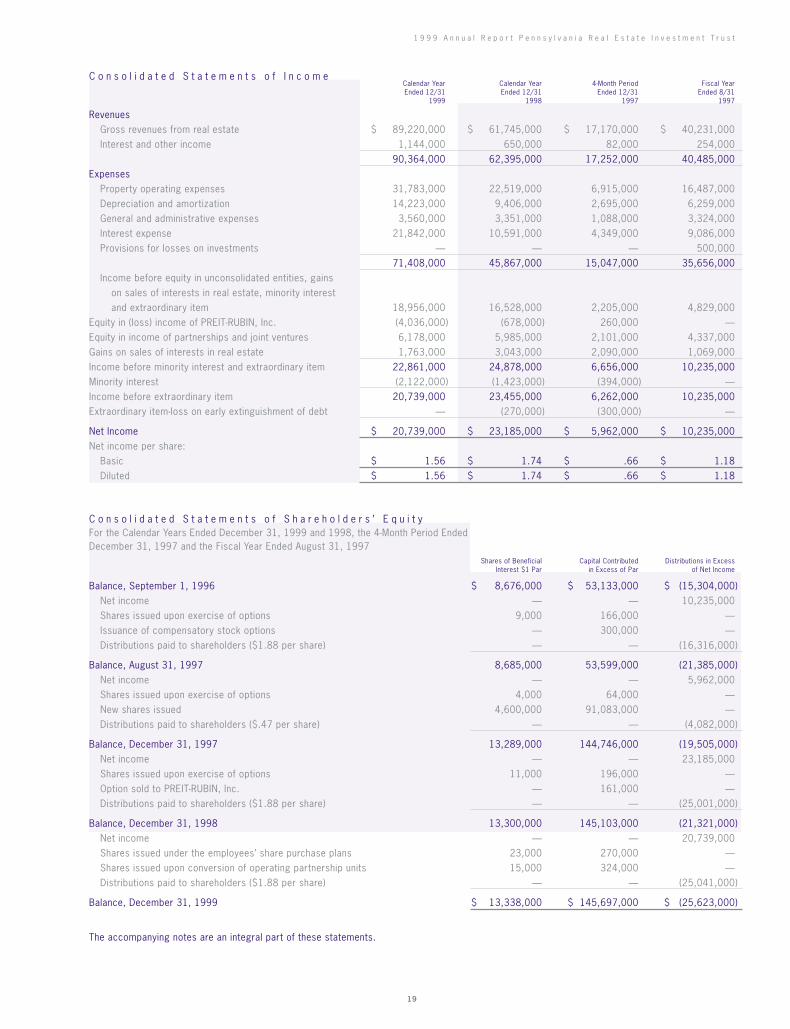
C o n s o l i d a t e d S t a t e m e n t s o f I n c o m eCalendar Year Calendar Year 4-Month Period Fiscal YearEnded 12/31 Ended 12/31 Ended 12/31 Ended 8/31
1999 1998 1997 1997
RevenuesGross revenues from real estate $ 89,220,000 $ 61,745,000 $ 17,170,000 $ 40,231,000Interest and other income 1,144,000 650,000 82,000 254,000
90,364,000 62,395,000 17,252,000 40,485,000Expenses
Property operating expenses 31,783,000 22,519,000 6,915,000 16,487,000Depreciation and amortization 14,223,000 9,406,000 2,695,000 6,259,000General and administrative expenses 3,560,000 3,351,000 1,088,000 3,324,000Interest expense 21,842,000 10,591,000 4,349,000 9,086,000Provisions for losses on investments — — — 500,000
71,408,000 45,867,000 15,047,000 35,656,000Income before equity in unconsolidated entities, gains
on sales of interests in real estate, minority interestand extraordinary item 18,956,000 16,528,000 2,205,000 4,829,000
Equity in (loss) income of PREIT-RUBIN, Inc. (4,036,000) (678,000) 260,000 —Equity in income of partnerships and joint ventures 6,178,000 5,985,000 2,101,000 4,337,000Gains on sales of interests in real estate 1,763,000 3,043,000 2,090,000 1,069,000Income before minority interest and extraordinary item 22,861,000 24,878,000 6,656,000 10,235,000Minority interest (2,122,000) (1,423,000) (394,000) —Income before extraordinary item 20,739,000 23,455,000 6,262,000 10,235,000Extraordinary item-loss on early extinguishment of debt — (270,000) (300,000) —
Net Income $ 20,739,000 $ 23,185,000 $ 5,962,000 $ 10,235,000Net income per share:
Basic $ 1.56 $ 1.74 $ .66 $ 1.18Diluted $ 1.56 $ 1.74 $ .66 $ 1.18
C o n s o l i d a t e d S t a t e m e n t s o f S h a r e h o l d e r s ’ E q u i t yFor the Calendar Years Ended December 31, 1999 and 1998, the 4-Month Period Ended December 31, 1997 and the Fiscal Year Ended August 31, 1997
Shares of Beneficial Capital Contributed Distributions in ExcessInterest $1 Par in Excess of Par of Net Income
Balance, September 1, 1996 $ 8,676,000 $ 53,133,000 $ (15,304,000)Net income — — 10,235,000Shares issued upon exercise of options 9,000 166,000 — Issuance of compensatory stock options — 300,000 — Distributions paid to shareholders ($1.88 per share) — — (16,316,000)
Balance, August 31, 1997 8,685,000 53,599,000 (21,385,000)Net income — — 5,962,000Shares issued upon exercise of options 4,000 64,000 — New shares issued 4,600,000 91,083,000 — Distributions paid to shareholders ($.47 per share) — — (4,082,000)
Balance, December 31, 1997 13,289,000 144,746,000 (19,505,000)Net income — — 23,185,000Shares issued upon exercise of options 11,000 196,000 —Option sold to PREIT-RUBIN, Inc. — 161,000 —Distributions paid to shareholders ($1.88 per share) — — (25,001,000)
Balance, December 31, 1998 13,300,000 145,103,000 (21,321,000)Net income — — 20,739,000Shares issued under the employees’ share purchase plans 23,000 270,000 —Shares issued upon conversion of operating partnership units 15,000 324,000 —Distributions paid to shareholders ($1.88 per share) — — (25,041,000)
Balance, December 31, 1999 $ 13,338,000 $ 145,697,000 $ (25,623,000)
The accompanying notes are an integral part of these statements.

20
C o n s o l i d a t e d S t a t e m e n t s o f C a s h F l o w sCalendar Year Calendar Year 4-Month Period Fiscal YearEnded 12/31 Ended 12/31 Ended 12/31 Ended 8/31
1999 1998 1997 1997
Cash Flows from Operating Activities:Net income $ 20,739,000 $ 23,185,000 $ 5,962,000 $ 10,235,000Adjustments to reconcile net income to
net cash provided by operating activities:Minority interest in operating partnerships 2,122,000 1,423,000 394,000 —Depreciation and amortization 14,223,000 9,406,000 2,695,000 6,259,000Provision for doubtful accounts 210,000 194,000 — —Gains on sales of interests in real estate (1,763,000) (3,043,000) (2,090,000) (1,069,000)Provision for losses on investments — — — 500,000 Issuance of compensatory stock options — — — 300,000Loss on early extinguishment of debt — 270,000 300,000 —Equity in loss (income) of PREIT-RUBIN, Inc. 4,036,000 678,000 (260,000) —Decrease in allowance for possible losses (98,000) (197,000) (61,000) (710,000)Change in assets and liabilities,
net of effects from acquisitions:Net change in other assets (7,634,000) (7,858,000) (2,926,000) 8,000Net change in other liabilities 476,000 7,080,000 267,000 (304,000)
Net cash provided by operating activities 32,311,000 31,138,000 4,281,000 15,219,000
Cash Flows from Investing Activities:Net investments in wholly-owned real estate (36,971,000) (150,793,000) (47,972,000) (3,901,000)Investments in property under development (26,802,000) (5,917,000) (1,246,000) — Investments in partnerships and joint ventures (8,299,000) (15,030,000) (9,947,000) (2,649,000)Investments in and advances to PREIT-RUBIN, Inc. (2,126,000) (1,330,000) (1,448,000) — Cash distributions from partnerships and joint
ventures in excess of (less than) equity in income 3,789,000 10,328,000 (518,000) 17,605,000Cash proceeds from sales of interests in partnerships 1,491,000 3,008,000 3,862,000 2,069,000 Cash proceeds from sales of wholly-owned real estate 4,045,000 — — —Decrease in notes receivable — — — 1,649,000Deposits on agreement to purchase real estate — — — (5,336,000) Deferred acquisition costs — — — (1,488,000)Net cash (used in) provided by investing activities (64,873,000) (159,734,000) (57,269,000) 7,949,000
Cash Flows from Financing Activities:Principal installments on mortgage notes payable (3,672,000) (1,518,000) (9,318,000) (1,305,000)Proceeds from mortgage notes payable 120,500,000 68,314,000 — —Proceeds from construction loan payable 6,804,000 — — —Prepayment of mortgage notes payable (17,000,000) (33,680,000) — —Net (payment) borrowing from revolving credit facility (47,873,000) 127,706,000 (29,309,000) (5,153,000) Payment of deferred financing costs (1,438,000) (1,076,000) (859,000) — Shares of beneficial interest issued 293,000 206,000 96,829,000 175,000 Distributions paid to shareholders (25,041,000) (25,001,000) (4,082,000) (16,316,000)Distributions paid to OP unit holders (2,521,000) (1,484,000) (304,000) — Distributions to minority partners (390,000) (60,000) (44,000) (200,000)Net cash provided by (used in) financing activities 29,662,000 133,407,000 52,913,000 (22,799,000)Net (decrease) increase in cash and cash equivalents (2,900,000) 4,811,000 (75,000) 369,000Cash and cash equivalents, beginning of period 6,135,000 1,324,000 1,399,000 1,030,000Cash and cash equivalents, end of period $ 3,235,000 $ 6,135,000 $ 1,324,000 $ 1,399,000
Supplemental Disclosure of Noncash Investing Activities:Accrual of acquisition costs $ — $ — $ — $ 778,000
The accompanying notes are an integral part of these statements.

1 9 9 9 A n n u a l R e p o r t P e n n s y l v a n i a R e a l E s t a t e I n v e s t m e n t T r u s t
21
1 . S u m m a r y o f S i g n i f i c a n t A c c o u n t i n g P o l i c i e s
Nature of Operations
Pennsylvania Real Estate Investment Trust (collectively with its subsidiaries,
the “Company”) is a fully integrated, self-administered and self-managed
real estate investment trust (“REIT”) which acquires, rehabilitates, develops,
and operates retail and multifamily properties. Substantially all of the
Company’s properties are located in the Eastern United States, with
concentrations in the Mid-Atlantic states and in Florida.
The Company’s interest in its properties is held through PREIT Associates,
L.P. (the “Operating Partnership”). The Company is the sole general
partner of the Operating Partnership and, as of December 31, 1999, the
Company held a 90.7% interest in the Operating Partnership. The Operating
Partnership holds a 95% economic interest in PREIT-RUBIN, Inc. (the
“Management Company”) through its ownership of 95% of the Management
Company’s stock, which represents all of the nonvoting common stock
of the Management Company.
Consolidation
The Company consolidates its accounts and the accounts of the Operating
Partnership and reflects the remaining interest in the Operating Partnership
as minority interest. All significant intercompany accounts and transactions
have been eliminated in consolidation.
Investment in Management Company
The Company’s investment in the Management Company is accounted for
using the equity method. See Notes 3 and 5 for further discussion.
Partnership and Joint Venture Investments
The Company accounts for its investment in partnerships and joint
ventures which it does not control using the equity method of accounting.
These investments, which represent 40% to 70% noncontrolling ownership
interests, are recorded initially at the Company’s cost and subsequently
adjusted for the Company’s net equity in income and cash contributions
and distributions.
Statements of Cash Flows
The Company considers all highly liquid short-term investments with an
original maturity of three months or less to be cash equivalents. Cash
paid for interest was $22,101,000; $10,146,000; $4,412000; and
$8,963,000 for the calendar years ended December 31, 1999 and
1998, the four-month period ended December 31, 1997, and the fiscal
year ended August 31, 1997, respectively. At December 31, 1999 and
1998, cash and cash equivalents totaling $3,235,000 and $6,135,000,
respectively included tenant escrow deposits of $724,000 and $514,000,
respectively.
Capitalization of Costs
It is the Company’s policy to capitalize interest and real estate taxes related
to properties under development and to depreciate these costs over the
life of the related assets in order to more properly match revenues and
expenses. These items are capitalized for income tax purposes and
amortized or depreciated in accordance with the provisions of the Internal
Revenue Code. For the calendar years ended December 31, 1999 and
1998 and the four-month period ended December 31, 1997, the Company
capitalized interest and real estate taxes of $2,311,000; $1,578,000
and $247,000. No interest or taxes were capitalized for the fiscal year
ended August 31, 1997.
The Company capitalized as deferred costs certain expenditures related
to the financing and leasing of certain properties. Capitalized loan fees
are being amortized over the term of the related loans and leasing
commissions are being amortized over the term of the related leases.
The Company capitalizes certain deposits associated with planned future
purchases of real estate. These deposits are transferred to the properties
upon consummation of the transaction.
Depreciation
The Company, for financial reporting purposes, depreciates its buildings,
equipment and leasehold improvements over their estimated useful lives
of 10 to 40 years, using the straight-line method of depreciation. For federal
income tax purposes, the Company currently uses the straight-line method
of depreciation and the useful lives prescribed by the Internal Revenue Code.
Allowance for Possible Losses
The Company reviews the carrying value of long-lived assets for impairment
whenever events or changes in circumstances indicate that the carrying
amount of an asset may not be recoverable. If the sum of the expected
future cash flows (undiscounted and without interest charges) is less than
the carrying amount of the asset, an impairment loss is recognized.
Measurement of an impairment loss for these assets is based on the
estimated fair market value of the assets.
During the fiscal year ended August 31, 1997, an impairment loss of
approximately $500,000 was recorded following the expiration of an option
to sell certain land parcels held by a partnership in which the Company
held an equity interest.
Benefit Plans
The Company has provided pension benefits since 1970 for all employees,
excluding the Chairman, for whom retirement benefits are provided in an
employment contract.
With regard to the Chairman’s employment contract, no expense provision
was required for the calendar years ended December 31, 1999 and
1998, the four-month period ended December 31, 1997 or for the fiscal
year ended August 31, 1997 with respect to the Chairman’s post-
termination benefits.
N o t e s t o C o n s o l i d a t e d F i n a n c i a l S t a t e m e n t sFor the Calendar Years Ended December 31, 1999 and 1998, the Four-Month Period Ended December 31, 1997 and the Fiscal Year Ended August 31, 1997.

22
Derivative Financial Instruments
The Company at times enters into interest rate swap and cap agreements
in order to manage interest rate exposure on certain floating rate debt.
When interest rates change, the differential to be paid or received is accrued
as interest expense and is recognized over the life of the swap agreements.
The costs of cap transactions are deferred and amortized over the
contract period. The amortized costs of cap transactions and interest
income and interest expense on swap transactions are included in
mortgage and bank loan interest.
The Financial Accounting Standards Board has issued SFAS No. 133,
“Accounting For Derivative Instruments and Hedging Activities.” This
Statement establishes accounting and reporting standards requiring that
every derivative instrument (including certain derivative instruments
embedded in other contracts) be recorded in the balance sheet as either
an asset or liability measured at its fair value. The Company will be
required to adopt this statement effective as of January 1, 2001. The
Company does not expect the adoption of this Statement to have a
material impact on its financial position or results of operations.
Percentage Rental Income
Starting in the second quarter of 1998, the Company began recording
percentage rental income for shopping center leases in accordance with
the Emerging Issues Task Force guidance on recording contingent rental
income. Prior to that date, the Company recorded percentage rental
income on a pro rata basis over the annual lease period if the achievement
of the specific sales target was probable (see Note 13).
Income Taxes
The Company has elected to qualify as a real estate investment trust under
Sections 856-860 of the Internal Revenue Code and intends to remain
so qualified. Accordingly, no provision for federal income taxes has been
reflected in the accompanying financial statements.
Earnings and profits, which determine the taxability of distributions to
shareholders, will differ from net income reported for financial reporting
purposes due to differences in cost basis, differences in the estimated
useful lives used to compute depreciation and differences between the
allocation of the Company’s net income and loss for financial reporting
purposes and for tax reporting purposes.
2 . C h a n g e i n F i s c a l Y e a r - E n d
On October 14, 1997, the Company announced its intention to change
its fiscal year-end from August 31 to December 31. On February 17, 1998,
the Company filed a Transition Report on Form 10-Q which included its
results for the period September 1, 1997 through December 31, 1997
and the comparable period. Listed below is unaudited income statement
information with respect to the four-month period ended December 31,
1996:
4--Month Period Ended12/31/96
Revenues $ 13,397,000Net income $ 4,842,000Basic income per share $ .56Diluted income per share $ .56
The Company is subject to a federal excise tax computed on a calendar
year. The excise tax equals 4% of the excess, if any, of 85% of the
Company’s ordinary income plus 95% of the Company’s capital gain net
income for the calendar year over cash distributions during the calendar
year, as defined. The Company has in the past distributed a substantial
portion of its taxable income in the subsequent fiscal year and may also
follow this policy in the future.
No provision for excise tax was made for the calendar years ended
December 31, 1999 and 1998, the four months ended December 31,
1997 or for the fiscal year ended August 31, 1997 as no tax was due.
The tax status of distributions paid to shareholders was composed of the
following for the calendar years ended December 31, 1999, 1998 and
1997:Calendar Year Ended Calendar Year Ended Calendar Year Ended
12/31/99 12/31/98 12/31/97
Ordinary income $ 1.67 $ 1.63 $ 1.66Capital gains .21 .25 .22
$ 1.88 $ 1.88 $ 1.88
The Management Company is subject to federal, state and local income
taxes. The operating results of the Management Company include a
provision or benefit for income taxes. Tax benefits are recorded by the
Management Company to the extent realizable.
Comprehensive Income
Net income as reported by the Company reflects total comprehensive
income for the calendar year ended December 31, 1999 and 1998, for
the four-month period ended December 31, 1997 and for the fiscal year
ended August 31, 1997.
Use of Estimates
The preparation of financial statements in conformity with generally
accepted accounting principles requires management to make estimates
and assumptions that affect the reported amount of assets and liabilities
and disclosure of contingent assets and liabilities at the date of the
financial statements and the reported amounts of revenue and expenses
during the reporting period. Actual results could differ from those
estimates.
Reclassifications
Certain prior period amounts have been reclassified to conform with the
current year presentation.

1 9 9 9 A n n u a l R e p o r t P e n n s y l v a n i a R e a l E s t a t e I n v e s t m e n t T r u s t
23
3 . T h e T R O T r a n s a c t i o n
On September 30, 1997, the Company completed a series of related
transactions pursuant to which the Company: (i) transferred substantially
all of its real estate interests to PREIT Associates, L.P. of which the
Company is the sole general partner; (ii) the Operating Partnership
acquired all of the non-voting common shares of The Rubin Organization,
Inc. (“TRO”), a commercial real estate development and management firm
(renamed “PREIT-RUBIN, Inc.”), constituting 95% of the total equity of PREIT-
RUBIN, Inc. in exchange for the issuance of 200,000 Class A Operating
Partnership (“OP”) Units; (iii) the Operating Partnership acquired the
interests of certain affiliates of TRO (“TRO Affiliates”) in The Court at Oxford
Valley, Magnolia Mall, North Dartmouth Mall and Springfield Park; (iv) the
Operating Partnership agreed to acquire the interests of TRO Affiliates
in Hillview Shopping Center and Northeast Tower Center, at prices based
upon a pre-determined formula; and (v) the Operating Partnership acquired
the development rights of certain TRO Affiliates, subject to related
obligations, in Christiana Power Center (Phases I and II), Red Rose
Commons and Blue Route Metroplex. Subsequent to that date, by mutual
agreement with the TRO affiliates, the Operating Partnership did not
acquire Hillview Shopping Center.
The following pro forma financial information of the Company for the four-
month period ended December 31, 1997 and the fiscal year ended
August 31, 1997 gives effect to the acquisitions of the properties as if
the purchases had occurred on September 1, 1996.
4-Month Period Ended Fiscal Year Ended (Unaudited) 12/31/97 8/31/97
Pro forma total revenues $ 18,292,000 $ 53,209,000Pro forma net income $ 6,692,000 $ 10,459,000Basic pro forma net income
per common share $ .71 $ 1.21Diluted pro forma net income
per common share $ .71 $ 1.20
The pro forma financial information presented within this footnote is not
necessarily indicative of the results which actually would have occurred
if the acquisitions had been consummated on September 1, 1996, nor
does the pro forma information purport to represent the results of
operations for future periods.
Class A Cash Paid Net Liabilities Other TotalOP Units (Received) Assumed Transaction Costs Purchase Price
Investment in PREIT-RUBIN, Inc.(1) $ 10,410,000 $ (878,000) $ — $ 793,000 $ 10,325,000Investment in The Court at Oxford Valley 5,458,000 683,000 — 688,000 6,829,000Magnolia Mall 5,000,000 15,165,000 25,154,000 977,000 46,296,000North Dartmouth Mall — 35,000,000 — 986,000 35,986,000Development Properties (See Note 11) — 6,446,000 — 1,859,000 8,305,000
$ 20,868,000 $ 56,416,000 $ 25,154,000 $ 5,303,000 $ 107,741,000
(1) Includes value of OP units issued on September 30, 1997 and issued and accrued in subsequent earn-out periods as described above.
As part of the September 30, 1997 transactions discussed above, the
Company entered into a contribution agreement (the “TRO Contribution
Agreement”) which includes a provision to issue up to 800,000 additional
Class A OP units over the five-year period beginning October 1, 1997
and ending September 30, 2002 according to a formula based upon the
Company’s adjusted funds from operations per share during the five-year
period. The TRO Contribution Agreement establishes “hurdle” and “target”
levels set forth for the Company’s adjusted funds from operations, as
defined per share during specified earn-out periods to determine whether,
and to what extent, the contingent OP units will be issued. The Company
intends to account for the issuance of contingent OP units as additional
purchase price when such amounts are determinable. For the four months
ended December 31, 1997, 32,500 OP units were earned, resulting in
additional purchase price of approximately $830,000. For the year ended
December 31, 1998, 130,000 OP units were earned resulting in additional
purchase price of approximately $2.5 million. For the year ended December
31, 1999, 167,500 OP units were earned resulting in additional purchase
price of approximately $2.4 million.
Pursuant to the terms of the partnership agreement, the limited partners
of the Operating Partnership received a conversion right, which enables
each limited partner to convert his/her interest in the Operating Partnership
into shares of beneficial interest or cash, at the election of the Company
on a one for one basis beginning one year following the respective issue
date. In 1999, a former TRO partner converted approximately 15,000
OP units to shares of beneficial interest for total consideration of
$339,000. Certain OP units issued in connection with the acquisition of
Magnolia Mall can be converted at the option of the limited partner at
any time after issuance.
All of the acquisitions described above have been recorded by the
Company using the purchase method of accounting. The Company
accounts for its noncontrolling investment in PREIT-RUBIN, Inc. using the
equity method. The excess of the purchase price of PREIT-RUBIN, Inc.
over the fair value of net assets acquired is being amortized over 35 years.
The following table summarizes the consideration paid to acquire the assets
and businesses described above:
24
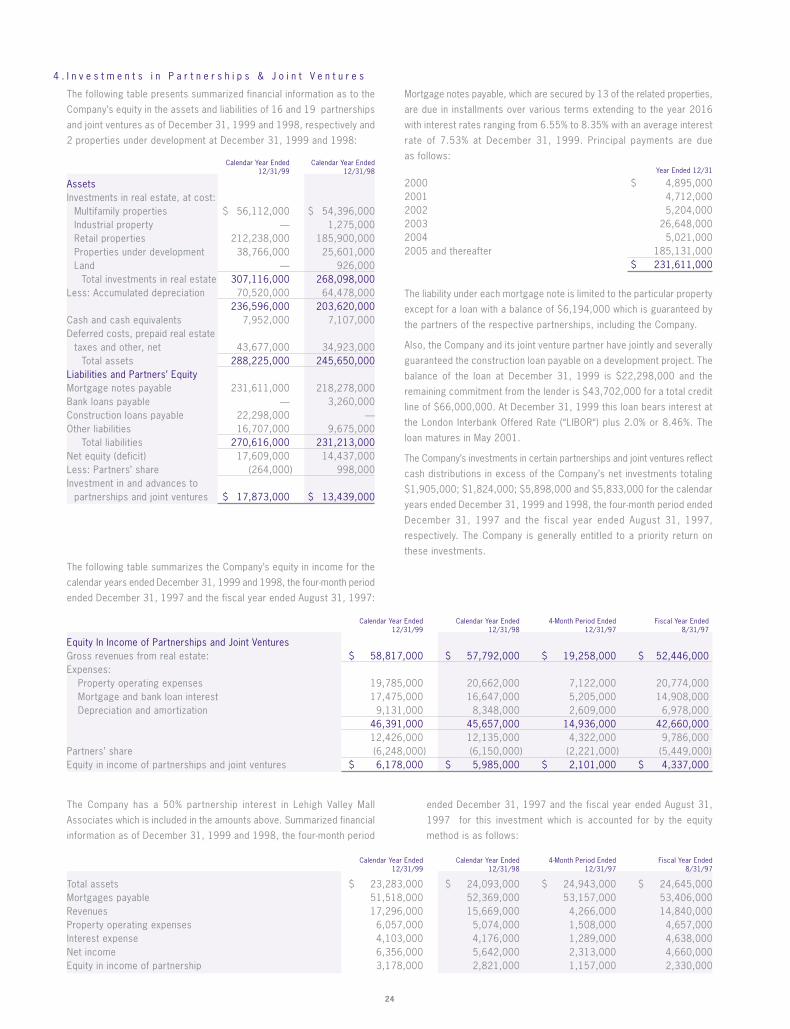
4 . I n v e s t m e n t s i n P a r t n e r s h i p s & J o i n t V e n t u r e s
The following table presents summarized financial information as to the
Company’s equity in the assets and liabilities of 16 and 19 partnerships
and joint ventures as of December 31, 1999 and 1998, respectively and
2 properties under development at December 31, 1999 and 1998:
Calendar Year Ended Calendar Year Ended12/31/99 12/31/98
AssetsInvestments in real estate, at cost:
Multifamily properties $ 56,112,000 $ 54,396,000Industrial property — 1,275,000Retail properties 212,238,000 185,900,000Properties under development 38,766,000 25,601,000Land — 926,000
Total investments in real estate 307,116,000 268,098,000Less: Accumulated depreciation 70,520,000 64,478,000
236,596,000 203,620,000Cash and cash equivalents 7,952,000 7,107,000Deferred costs, prepaid real estate
taxes and other, net 43,677,000 34,923,000Total assets 288,225,000 245,650,000
Liabilities and Partners’ EquityMortgage notes payable 231,611,000 218,278,000Bank loans payable — 3,260,000Construction loans payable 22,298,000 —Other liabilities 16,707,000 9,675,000
Total liabilities 270,616,000 231,213,000Net equity (deficit) 17,609,000 14,437,000Less: Partners’ share (264,000) 998,000Investment in and advances to
partnerships and joint ventures $ 17,873,000 $ 13,439,000
Calendar Year Ended Calendar Year Ended 4-Month Period Ended Fiscal Year Ended12/31/99 12/31/98 12/31/97 8/31/97
Total assets $ 23,283,000 $ 24,093,000 $ 24,943,000 $ 24,645,000Mortgages payable 51,518,000 52,369,000 53,157,000 53,406,000Revenues 17,296,000 15,669,000 4,266,000 14,840,000Property operating expenses 6,057,000 5,074,000 1,508,000 4,657,000Interest expense 4,103,000 4,176,000 1,289,000 4,638,000Net income 6,356,000 5,642,000 2,313,000 4,660,000Equity in income of partnership 3,178,000 2,821,000 1,157,000 2,330,000
Mortgage notes payable, which are secured by 13 of the related properties,
are due in installments over various terms extending to the year 2016
with interest rates ranging from 6.55% to 8.35% with an average interest
rate of 7.53% at December 31, 1999. Principal payments are due
as follows:Year Ended 12/31
2000 $ 4,895,0002001 4,712,0002002 5,204,0002003 26,648,0002004 5,021,0002005 and thereafter 185,131,000
$ 231,611,000
The liability under each mortgage note is limited to the particular property
except for a loan with a balance of $6,194,000 which is guaranteed by
the partners of the respective partnerships, including the Company.
Also, the Company and its joint venture partner have jointly and severally
guaranteed the construction loan payable on a development project. The
balance of the loan at December 31, 1999 is $22,298,000 and the
remaining commitment from the lender is $43,702,000 for a total credit
line of $66,000,000. At December 31, 1999 this loan bears interest at
the London Interbank Offered Rate (“LIBOR“) plus 2.0% or 8.46%. The
loan matures in May 2001.
The Company’s investments in certain partnerships and joint ventures reflect
cash distributions in excess of the Company’s net investments totaling
$1,905,000; $1,824,000; $5,898,000 and $5,833,000 for the calendar
years ended December 31, 1999 and 1998, the four-month period ended
December 31, 1997 and the fiscal year ended August 31, 1997,
respectively. The Company is generally entitled to a priority return on
these investments.
Calendar Year Ended Calendar Year Ended 4-Month Period Ended Fiscal Year Ended12/31/99 12/31/98 12/31/97 8/31/97
Equity In Income of Partnerships and Joint VenturesGross revenues from real estate: $ 58,817,000 $ 57,792,000 $ 19,258,000 $ 52,446,000Expenses:
Property operating expenses 19,785,000 20,662,000 7,122,000 20,774,000Mortgage and bank loan interest 17,475,000 16,647,000 5,205,000 14,908,000Depreciation and amortization 9,131,000 8,348,000 2,609,000 6,978,000
46,391,000 45,657,000 14,936,000 42,660,00012,426,000 12,135,000 4,322,000 9,786,000
Partners’ share (6,248,000) (6,150,000) (2,221,000) (5,449,000)Equity in income of partnerships and joint ventures $ 6,178,000 $ 5,985,000 $ 2,101,000 $ 4,337,000
The following table summarizes the Company’s equity in income for the
calendar years ended December 31, 1999 and 1998, the four-month period
ended December 31, 1997 and the fiscal year ended August 31, 1997:
The Company has a 50% partnership interest in Lehigh Valley Mall
Associates which is included in the amounts above. Summarized financial
information as of December 31, 1999 and 1998, the four-month period
ended December 31, 1997 and the fiscal year ended August 31,
1997 for this investment which is accounted for by the equity
method is as follows:
1 9 9 9 A n n u a l R e p o r t P e n n s y l v a n i a R e a l E s t a t e I n v e s t m e n t T r u s t
25
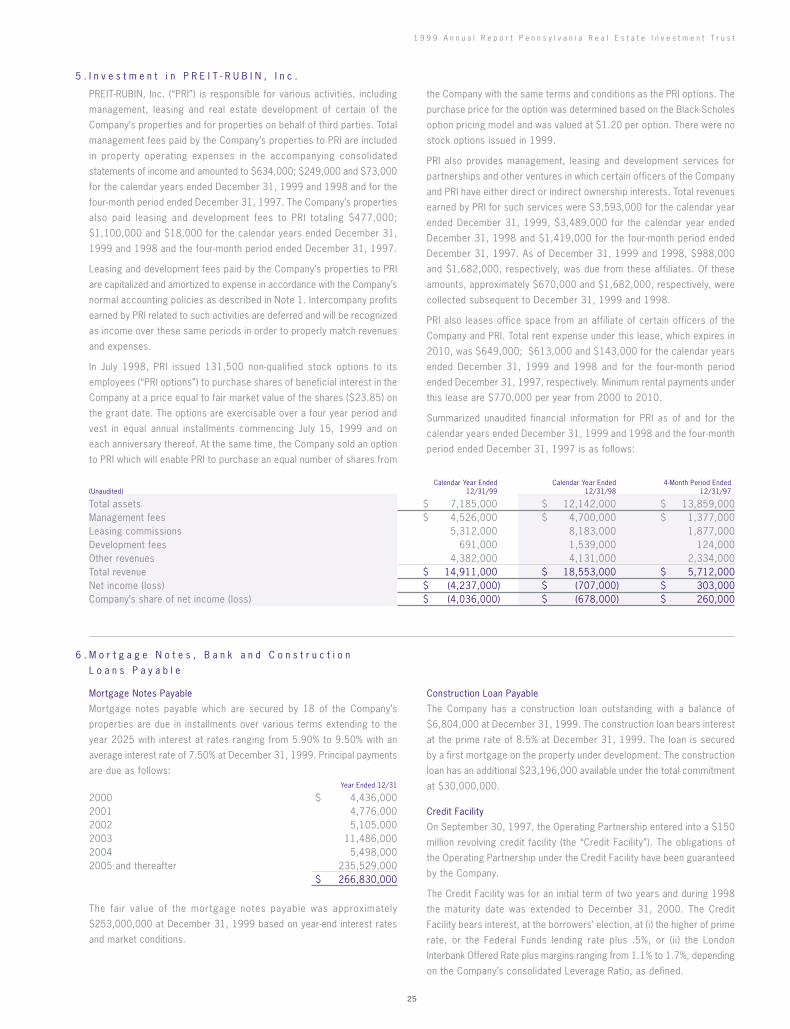
5 . I n v e s t m e n t i n P R E I T - R U B I N , I n c .
PREIT-RUBIN, Inc. (“PRI”) is responsible for various activities, including
management, leasing and real estate development of certain of the
Company’s properties and for properties on behalf of third parties. Total
management fees paid by the Company’s properties to PRI are included
in property operating expenses in the accompanying consolidated
statements of income and amounted to $634,000; $249,000 and $73,000
for the calendar years ended December 31, 1999 and 1998 and for the
four-month period ended December 31, 1997. The Company’s properties
also paid leasing and development fees to PRI totaling $477,000;
$1,100,000 and $18,000 for the calendar years ended December 31,
1999 and 1998 and the four-month period ended December 31, 1997.
Leasing and development fees paid by the Company’s properties to PRI
are capitalized and amortized to expense in accordance with the Company’s
normal accounting policies as described in Note 1. Intercompany profits
earned by PRI related to such activities are deferred and will be recognized
as income over these same periods in order to properly match revenues
and expenses.
In July 1998, PRI issued 131,500 non-qualified stock options to its
employees (“PRI options”) to purchase shares of beneficial interest in the
Company at a price equal to fair market value of the shares ($23.85) on
the grant date. The options are exercisable over a four year period and
vest in equal annual installments commencing July 15, 1999 and on
each anniversary thereof. At the same time, the Company sold an option
to PRI which will enable PRI to purchase an equal number of shares from
the Company with the same terms and conditions as the PRI options. The
purchase price for the option was determined based on the Black-Scholes
option pricing model and was valued at $1.20 per option. There were no
stock options issued in 1999.
PRI also provides management, leasing and development services for
partnerships and other ventures in which certain officers of the Company
and PRI have either direct or indirect ownership interests. Total revenues
earned by PRI for such services were $3,593,000 for the calendar year
ended December 31, 1999, $3,489,000 for the calendar year ended
December 31, 1998 and $1,419,000 for the four-month period ended
December 31, 1997. As of December 31, 1999 and 1998, $988,000
and $1,682,000, respectively, was due from these affiliates. Of these
amounts, approximately $670,000 and $1,682,000, respectively, were
collected subsequent to December 31, 1999 and 1998.
PRI also leases office space from an affiliate of certain officers of the
Company and PRI. Total rent expense under this lease, which expires in
2010, was $649,000; $613,000 and $143,000 for the calendar years
ended December 31, 1999 and 1998 and for the four-month period
ended December 31, 1997, respectively. Minimum rental payments under
this lease are $770,000 per year from 2000 to 2010.
Summarized unaudited financial information for PRI as of and for the
calendar years ended December 31, 1999 and 1998 and the four-month
period ended December 31, 1997 is as follows:
Calendar Year Ended Calendar Year Ended 4-Month Period Ended(Unaudited) 12/31/99 12/31/98 12/31/97
Total assets $ 7,185,000 $ 12,142,000 $ 13,859,000Management fees $ 4,526,000 $ 4,700,000 $ 1,377,000Leasing commissions 5,312,000 8,183,000 1,877,000Development fees 691,000 1,539,000 124,000Other revenues 4,382,000 4,131,000 2,334,000Total revenue $ 14,911,000 $ 18,553,000 $ 5,712,000Net income (loss) $ (4,237,000) $ (707,000) $ 303,000Company’s share of net income (loss) $ (4,036,000) $ (678,000) $ 260,000
6 . M o r t g a g e N o t e s , B a n k a n d C o n s t r u c t i o n
L o a n s P a y a b l e
Mortgage Notes Payable
Mortgage notes payable which are secured by 18 of the Company’s
properties are due in installments over various terms extending to the
year 2025 with interest at rates ranging from 5.90% to 9.50% with an
average interest rate of 7.50% at December 31, 1999. Principal payments
are due as follows:Year Ended 12/31
2000 $ 4,436,0002001 4,776,0002002 5,105,0002003 11,486,0002004 5,498,0002005 and thereafter 235,529,000
$ 266,830,000
The fair value of the mortgage notes payable was approximately
$253,000,000 at December 31, 1999 based on year-end interest rates
and market conditions.
Construction Loan Payable
The Company has a construction loan outstanding with a balance of
$6,804,000 at December 31, 1999. The construction loan bears interest
at the prime rate of 8.5% at December 31, 1999. The loan is secured
by a first mortgage on the property under development. The construction
loan has an additional $23,196,000 available under the total commitment
at $30,000,000.
Credit Facility
On September 30, 1997, the Operating Partnership entered into a $150
million revolving credit facility (the “Credit Facility”). The obligations of
the Operating Partnership under the Credit Facility have been guaranteed
by the Company.
The Credit Facility was for an initial term of two years and during 1998
the maturity date was extended to December 31, 2000. The Credit
Facility bears interest, at the borrowers’ election, at (i) the higher of prime
rate, or the Federal Funds lending rate plus .5%, or (ii) the London
Interbank Offered Rate plus margins ranging from 1.1% to 1.7%, depending
on the Company’s consolidated Leverage Ratio, as defined.

26
Calendar Year Ended 12/31/99 Calendar Year Ended 12/31/98 4-Month Period Ended 12/31/97 Fiscal Year Ended 8/31/97Basic Diluted Basic Diluted Basic Diluted Basic Diluted
Income before extraordinary item $ 20,739 $ 20,739 $ 23,455 $ 23,455 $ 6,262 $ 6,262 $ 10,235 $ 10,235Extraordinary item — — (270) (270) (300) (300) — —Net income $ 20,739 $ 20,739 $ 23,185 $ 23,185 $ 5,962 $ 5,962 $ 10,235 $ 10,235Weighted average shares outstanding 13,318 13,318 13,297 13,297 9,049 9,049 8,679 8,679Effect of share options issued — — — 17 — 50 — 25Total weighted average
shares outstanding 13,318 13,318 13,297 13,314 9,049 9,099 8,679 8,704Income per share before
extraordinary item $ 1.56 $ 1.56 $ 1.76 $ 1.76 $ .69 $ .69 $ 1.18 $ 1.18Extraordinary item per share — — (.02) (.02) (.03) (.03) — —Net income per share $ 1.56 $ 1.56 $ 1.74 $ 1.74 $ .66 $ .66 $ 1.18 $ 1.18
8 . B e n e f i t P l a n s
The Company maintains a 401(k) Plan (the “Plan”) in which substantially
all of the officers and employees are eligible to participate. The Plan permits
eligible participants, as defined in the plan agreement, to defer up to 15%
of their compensation, and the Company, at its discretion, may match a
percentage of the employees’ contributions. The employees’ contributions
are fully vested and contributions from the Company vest in accordance
with an employee’s years of service as defined in the plan agreement.
The Company’s contributions to the Plan for the calendar years ended
December 31, 1999 and 1998, the four-month period ended December
31, 1997 and for the fiscal year ended August 31, 1997 were $ 34,000;
$29,000; $43,000; and $41,000, respectively.
The Company a lso mainta ins a Supplementa l Ret i rement P lan
(the “Supplemental Plan”) covering certain senior management employees.
The Supplemental Plan provides eligible employees through normal
retirement date, as defined in the plan agreement, a benefit amount
similar to that which would have been received under the provisions of
a pension plan which was terminated in 1994. Contributions due by the
Company under the provisions of this plan were $62,000; $60,000;
$22,000 and $92,000 for the calendar years ended December 31, 1999
and 1998, the four-month period ended December 31, 1997 and for the
fiscal year ended August 31, 1997, respectively.
The Company and PRI also each maintain share purchase plans through
which Company and PRI employees may purchase shares of beneficial
interest at a discount of the fair market value. In 1999, 23,000 shares
were purchased for total consideration of $293,000.
7 . N e t I n c o m e P e r S h a r e
Basic Earnings Per Share (“EPS”) is based on the weighted average
number of common shares outstanding during the year. Diluted EPS is
based on the weighted average number of shares outstanding during the
year, adjusted to give effect to common share equivalents. A reconciliation
between basic and diluted EPS is shown below (in thousands, except per
share data).
As of December 31, 1999, the Operating Partnership had $91 million
outstanding on the Credit Facility. The weighted average interest rate based
on amounts borrowed on the Credit Facility was 6.95% and 7.06% for
the calendar years ended December 31, 1999 and 1998, respectively
and 7.48% for the four-month period ended December 31, 1997.
The Credit Facility requires the Company to maintain ongoing compliance
with a number of customary financial and other covenants, including
leverage ratios based on gross asset value, fixed charge coverage ratios
and a minimum tangible net worth requirement.
During 1999, the Company amended the Credit Facility. A minimum
mortgaged asset debt service coverage ratio was added. Also, the
amendment required the recording of the mortgages, assignments of rents,
leases, and profits, and UCC-1 Financing Statements that had been
delivered by the Borrower with respect to certain properties that, as of
April 15, 1999 were unencumbered. These nine properties, along with
two additional properties added via the amendment, are now referred to
as the Mortgaged Properties. One of the Development Properties will be
added to the Mortgaged Properties after it is substantially completed.
As of December 31, 1999, the Company was in compliance with all debt
covenants.
The Company has l imited its exposure to increases in LIBOR on
$20,000,000 of its floating rate debt by entering into a swap agreement
which fixes a rate of 6.12% versus 30-day LIBOR through June 2001. In
the event that the Company wanted to terminate the swap agreement
referred to above, the amount which would be receivable at December
31, 1999 was approximately $84,000.
The Company is exposed to credit loss in the event of nonperformance
by the counterparty to the agreement; however, the Company does not
anticipate nonperformance by the counterparty.
During the calendar year ended December 31, 1998, the Company
incurred a prepayment penalty of $270,000 in connection with a mortgage
refinancing. During the four-month period ended December 31, 1997, the
Company wrote off unamortized deferred financing costs of $300,000
in connection with the refinancing of its Credit Facility. These amounts
have been reflected as extraordinary items in the accompanying
consolidated statements of income for the respective periods.

1 9 9 9 A n n u a l R e p o r t P e n n s y l v a n i a R e a l E s t a t e I n v e s t m e n t T r u s t
27
9 . S t o c k O p t i o n P l a n s
In December 1990, the shareholders approved an incentive stock option
plan for key employees (the “Employees Plan”) and a stock option plan
for nonemployee trustees (the “Nonemployee Trustees Plan”), covering
200,000 and 100,000 shares of beneficial interest, respectively. Under
the terms of the plans, the purchase price of shares subject to each option
granted will be at least equal to the fair market value of the shares on
the date of grant. Options under the incentive stock option plan may be
exercised as determined by the Company, but in no event later than 10
years from the date of grant. In December 1993, the Board of Trustees
amended the incentive stock option plan for key employees, to increase
the number of shares subject to option to 400,000 shares, to change
the name of the plan to the “1990 Incentive and Non-Qualifying Stock Option
Plan” and to expand some provisions of the plan. The stock option plan
for nonemployee trustees provides for annual grants of 2,500 options
(becoming exercisable in four equal installments). The options expire 10
years after the date of grant.
In December 1993, the Board of Trustees adopted a nonqualifying stock
option plan covering 100,000 shares. The Company granted options on
February 1, 1994 having a term of 10 years and subject to the other terms
and conditions set forth in the plan. All 100,000 shares are outstanding
at December 31, 1999.
On September 30, 1997, the Company adopted an Incentive and Non-
Qualified Stock Option Plan (the “1997 Stock Option Plan”) in connection
with the TRO Transaction. Options on 455,000 Shares were granted to
former TRO officers and employees on September 30, 1997 at an
exercise price of $25.41 per share. All options granted on September
30, 1997 vest in four equal annual installments commencing January 1,
1999, and on each anniversary date thereof.
In April, 1999, the Company adopted an Equity Incentive Plan (the “1999
Equity Incentive Plan”). Options to purchase approximately 400,000
shares are available under the 1999 Equity Incentive Plan, including all
forfeited options and all unallocated options left over from the Company’s
1993 Stock Option Plan and 1997 Stock Option Plan. As of December
31, 1999, no options had been issued under the 1999 Equity Incentive
Plan.
See Note 5 for a discussion of stock options at the Management Company.
Changes in options outstanding are as follows:
1997 1993 Employees NonemployeeExercise Price Stock Option Plan Stock Option Plan Plan Trustees Plan
Options outstanding at 8/31/97 $15.75–$25.375 — 100,000 340,125 38,250
Options granted $25.41 455,000 — — —Options exercised $15.75–$20.375 — — — (3,750)Options outstanding at 12/31/97 $15.75–$25.41 455,000 100,000 340,125 34,500
Options granted $23.85 — — 17,500 5,000Options exercised $18.00–$20.375 — — (5,875) (5,000)Options forfeited $18.00–$22.75 (23,000) — (3,375) —Options outstanding at 12/31/98 $15.75–$25.41 432,000 100,000 348,375 34,500
Options granted — — — — 5,000Options exercised — — — — —Options forfeited $18.00–$25.41 (72,000) — (500) (5,500)Options outstanding at 12/31/99 $15.75–$25.41 360,000 100,000 347,875 34,000
At December 31, 1999, options for 513,500 shares of beneficial interest
with an aggregate purchase price of $11,348,000 (average of $22.10
per share) were exercisable.
During the fourth quarter of 1997, the Board of Trustees extended the
exercise dates for 62,500 options previously granted to an officer of the
Company and two retiring trustees. As a result, the Company recorded
compensation expense of $300,000 for the four-month period ended
December 31, 1997 relating to this change in terms.
During fiscal year 1997, the Company adopted SFAS No. 123, “Accounting
for Stock-Based Compensation.” SFAS No. 123 encourages a fair value
method of accounting for employee stock options and similar equity
instruments. The statement also allows an entity to continue to account
for stock-based compensation using the intrinsic value method in APB
Opinion No. 25. As provided for in the statement, the Company elected
to continue the intrinsic value method of expense recognition. If
compensation cost for these plans had been determined using the fair
value method prescribed by SFAS No. 123, the Company’s net income
and net income per share would have reflected the unaudited pro forma
amounts indicated below:
Calendar Year Ended Calendar Year Ended 4-Month Period Ended Fiscal Year Ended12/31/99 12/31/98 12/31/97 8/31/97
Net income:As reported $ 20,739,000 $ 23,185,000 $ 5,962,000 $ 10,235,000Pro forma $ 20,435,000 $ 22,884,000 $ 5,861,000 $ 10,212,000
Net income per share:As reported–
Basic $ 1.56 $ 1.74 $ .66 $ 1.18Diluted $ 1.56 $ 1.74 $ .66 $ 1.18
Pro forma–Basic $ 1.53 $ 1.72 $ .65 $ 1.18Diluted $ 1.53 $ 1.72 $ .65 $ 1.18

28
1 0 . O p e r a t i n g L e a s e s
The Company’s apartments are typically leased to residents under
operating leases for a period of one year. The Company’s shopping
centers are leased to tenants under operating leases with expiration
dates extending to the year 2019.
Future minimum rentals under noncancelable operating leases are as
follows:Years Ended 12/31
2000 $ 23,236,0002001 23,878,0002002 22,991,0002003 21,682,0002004 19,869,000Thereafter 130,272,000
$ 241,928,000
The total future minimum rentals presented above do not include amounts
that may be received as tenant reimbursements for charges to cover
increases in certain operating costs.
11 . C o m m i t m e n t s a n d C o n t i n g e n c i e s
During 1995, certain environmental matters arose at certain properties
in which the Company has an interest. The Company retained environmental
consultants in order to investigate these matters. At one property, in which
the Company has a 50% ownership interest, groundwater contamination
exists which the Company alleges was caused by the former tenant.
Estimates to remediate this property, which are subject to the length of
monitoring and the extent of remediation required, range in total from
$50,000 to $100,000. In addition, above normal radon levels had been
detected at three wholly-owned properties. Approximately $250,000 of
costs were incurred to remediate two of the properties.
The Company has recorded its share of these liabilities totaling $94,000
related to the consultants’ evaluation of these matters which, in certain
instances, are subject to applicable state approvals of the remediation
plans. In management’s opinion, no material incremental cost will be
incurred on these properties. The Company will pursue recovery of
remediation costs from all of the responsible parties, including its tenants
and partners.
The Company is also involved in a number of development and
redevelopment projects which may require equity funding by the Company,
or third-party debt or equity financing. In each case, the Company will
evaluate the financing opportunities available to it at the time the project
requires funding. In cases where the project is undertaken with a joint
venture partner, the Company’s flexibility in funding the project may be
governed by the joint venture agreement or the covenants existing in its
line of credit which limit the use of borrowed funds in joint venture
projects. At December 31, 1999, the Company had approximately
$73,000,000 committed to complete current development and
redevelopment projects. Of this amount, approximately $40,000,000 of
construction financing has been placed.
In connection with certain development properties, including those
development properties acquired as part of the TRO Transaction (see Note
3), the Company may be required to issue additional OP units upon the
achievement of certain financial results. Further, the Company is obligated
to acquire the remaining 11% interest in the Northeast Tower Center by
the end of the first quarter of 2002. Finally, the Company is committed
to issuing OP units valued at approximately $3,070,000 in connection
with the acquisition of land on which the Christiana Power Center (Phase
I) is substantially built. These units are expected to be issued at the
completion of building and leasing the shopping center.
The pro forma effect on the results may not be representative of the impact
in future years because the fair value method was not applied to options
granted before 1996.
There were no options granted in 1999.
The fair value of each option was estimated on the grant date using
the Black-Scholes option pricing model and the assumptions presented
below:Calendar Year Ended 4-Month Period Ended Fiscal Year Ended
12/31/98 12/31/97 8/31/97
Expected life in years 5 5 5Risk-free interest rate 5.52% 6.09% 6.10%Volatility 17.76% 18.38% 17.31%Dividend yield 9.67% 7.65% 7.28%
The weighted average fair value of each option granted was $1.20,
$2.34 and $2.05 for the calendar year ended December 31, 1998, the
four-month period ended December 31, 1997 and the fiscal year ended
August 31, 1997, respectively. Outstanding options as of December 31,
1999 have a weighted average remaining contractual life of 6.39 years,
an average exercise price of $23.19 per share and an aggregate purchase
price of $ 19,519,000.

1 9 9 9 A n n u a l R e p o r t P e n n s y l v a n i a R e a l E s t a t e I n v e s t m e n t T r u s t
29
1 2 . A c q u i s i t i o n s
During 1999, the Company acquired two shopping centers, three shopping
center development sites, and an additional 10% interest in a shopping
center in which it now owns a 60% interest. The Company paid
approximately $51.4 million, consisting of $28.0 million in cash, $12.5
million in assumed debt, $9.9 million in new debt and $1.0 million through
the issuance of OP units. Each of these acquisitions was accounted for
by the purchase method of accounting. The results of operations for the
acquired properties have been included from their respective purchase
dates. The 1999 acquisitions did not result in a requirement to present
pro forma information. From September 30, 1997 to December 31,
1998 the Company acquired wholly owned interests in eight properties
and a 50% interest in two properties. The Company paid approximately
$248.3 million, consisting of $126.0 million in cash, $93.5 million in
assumed debt, and $28.8 million of operating partnership units. The
Company also acquired the remaining 50% interests in two multifamily
properties and a parcel of undeveloped land for cash of $0.8 million and
1 3 . S u m m a r y o f Q u a r t e r l y R e s u l t s ( u n a u d i t e d )
The following presents a summary of the unaudited quarterly financial
information for the calendar year ended December 31, 1999 and 1998.
assumption of liabilities of $33.6 million. Each of these acquisitions was
accounted for by the purchase method of accounting. The unaudited pro
forma information presented within this footnote is not necessarily
indicative of the results which actually would have occurred if the
acquisitions had been consummated on September 1, 1996, nor does
the pro forma information purport to represent the results of operations
for future periods.Calendar Year Ended 4-Month Period Ended Fiscal Year Ended
12/31/98 12/31/97 8/31/97
Pro forma total revenues $ 76,846,000 $ 24,626,000 $ 70,819,000
Pro forma net income $ 23,664,000 $ 6,889,000 $ 9,790,000
Basic pro formanet income per share $ 1.78 $ .51 $ .74
Diluted pro formanet income per share $ 1.78 $ .50 $ .74
Calendar Year Ended 12/31/99In thousands of dollars, except per share data 1st Quarter 2nd Quarter 3rd Quarter 4th Quarter Total
Revenues (1) $ 21,739 $ 22,061 $ 22,242 $ 24,322 $ 90,364Income before gains on sales of interests in real estate (1) $ 4,524 $ 4,918 $ 4,902 $ 4,632 $ 18,976Gains on sales of interests in real estate 1,346 — 162 255 1,763Net income $ 5,870 $ 4,918 $ 5,064 $ 4,887 $ 20,739Basic net income per share:
Income before gains on sales of interests in real estate $ .34 $ .37 $ .37 $ .35 $ 1.43Gains on sales of interests in real estate .10 — .01 .02 .13
Total $ .44 $ .37 $ .38 $ .37 $ 1.56Diluted income per share:
Income before gains on sales of interests in real estate $ .34 $ .37 $ .37 $ .35 $ 1.43Gains on sales of interests in real estate .10 — .01 .02 .13
Total $ .44 $ .37 $ .38 $ .37 $ 1.56
(1) 1st Quarter reclassified to conform with current year presentation.
Calendar Year Ended 12/31/98In thousands of dollars, except per share data 1st Quarter 2nd Quarter 3rd Quarter 4th Quarter Total
Revenues (1) $ 13,647 $ 13,916 $ 14,913 $ 19,269 $ 61,745Income before gains on sales of interests in real estate $ 4,593 $ 4,439 $ 5,739 $ 5,371 $ 20,142Gains on sales of interests in real estate — 1,766 1,277 — 3,043Net income (2) $ 4,593 $ 6,205 $ 7,016 $ 5,371 $ 23,185Basic net income per share:
Income before gains on sales of interests in real estate $ .35 $ .34 $ .43 $ .39 $ 1.51Gains on sales of interests in real estate — .13 .10 — .23
Total $ .35 $ .47 $ .53 $ .39 $ 1.74Diluted income per share:
Income before gains on sales of interests in real estate $ .34 $ .34 $ .43 $ .39 $ 1.51Gains on sales of interests in real estate — .13 .10 — .23
Total $ .34 $ .47 $ .53 $ .39 $ 1.74
(1) In May 1998, the Emerging Issues Task Force reached a consensus that a lessor should defer recognition of percentage rental income in interim periods until the specified target that triggers the contingent rental income is achieved. The Company recorded percentage rental income of $260,000, $402,000, $79,000 and $1,045,000 in the first, second, third and fourth quarters, respectively.
(2) In the fourth quarter of 1998, the Company expensed $270,000 of prepayment fees relating to a mortgage which was refinanced.

30
1 4 . S e g m e n t I n f o r m a t i o n
In 1998, the Company adopted Statement of Financial Accounting
Standards No. 131, “Disclosures about Segments of an Enterprise and
Related Information.” This Statement established standards for reporting
financial information about operating segments in interim and annual
financial reports and provides for a “management approach” in identifying
the reportable segments.
The Company has four reportable segments: (1) retail properties, (2)
multifamily properties, (3) other, and (4) corporate. The retail segment
includes the operation and management of 22 regional and community
shopping centers (12 wholly-owned and 10 owned in joint venture form).
The multifamily segment includes the operation and management of 19
apartment communities (13 wholly-owned and 6 owned in joint venture
form). The other segment includes the operation and management of 6
retail properties under development (4 wholly-owned and 2 owned in
joint venture form) and 5 industrial properties (all wholly-owned). The
corporate segment is responsible for cash and investment management
and certain other general support functions.
The accounting policies for the segments are the same as those described
in Note 1, except that for segment reporting purposes, the Company uses
the “proportionate-consolidation method” of accounting (a non-GAAP
measure) for joint venture properties, instead of the equity method of
accounting. The Company calculates the proportionate-consolidation
method by applying their percentage ownership interest to the historical
financial statements of their equity method investments.
Adjustments to TotalCalendar Year Ended 12/31/99 Retail Multifamily Other Corporate Total Equity Method Consolidated
Real estate operating revenues $ 64,870 $ 51,891 $ 1,534 $ — $ 118,295 $ (29,075) $ 89,220Real estate operating expenses 19,857 21,617 31 — 41,505 (9,722) 31,783Net operating income 45,013 30,274 1,503 — 76,790 (19,353) 57,437General and administrative expenses — — — (3,560) (3,560) — (3,560)Interest income — — — 1,144 1,144 — 1,144PRI net operating income — — — (2,504) (2,504) 2,504 —EBIDTA 45,013 30,274 1,503 (4,920) 71,870 (16,849) 55,021Interest expense (17,261) (12,534) (263) (1,107) (31,165) 9,323 (21,842)Depreciation and amortization (10,615) (7,712) (98) (1,238) (19,663) 5,440 (14,223)PRI income taxes — — — 56 56 (56) —Gains on sales of interests in real estate 445 — 1,318 — 1,763 — 1,763Minority interest in operating partnership — — — (2,122) (2,122) — (2,122)Equity in interest of partnerships and
joint ventures — — — — — 6,178 6,178Equity in loss of PRI — — — — — (4,036) (4,036)Net income $ 17,582 $ 10,028 $ 2,460 $ (9,331) $ 20,739 $ — $ 20,739Investments in real estate, at cost $ 402,154 $ 265,165 $ 75,819 $ — $ 743,138 $ (165,617) $ 577,521Total assets $ 384,417 $ 208,020 $ 72,796 $ 15,812 $ 681,045 $ (133,455) $ 547,590Capital expenditures $ 293 $ 3,332 $ — $ — $ 3,625 $ (432) $ 3,193
Adjustments to TotalCalendar Year Ended 12/31/98 Retail Multifamily Other Corporate Total Equity Method Consolidated
Real estate operating revenues $ 42,272 $ 46,167 $ 1,619 $ — $ 90,058 $ (28,313) $ 61,745 Real estate operating expenses 13,030 19,545 35 — 32,610 (10,091) 22,519 Net operating income 29,242 26,622 1,584 — 57,448 (18,222) 39,226 General and administrative expenses — — — (3,351) (3,351) — (3,351)Interest income — — — 650 650 — 650 PRI net operating income — — — 762 762 (762) — EBIDTA 29,242 26,622 1,584 (1,939) 55,509 (18,984) 36,525Interest expense (11,067) (7,050) (341) (973) (19,431) 8,840 (10,591)Depreciation and amortization (6,182) (6,869) (117) (1,198) (14,366) 4,960 (9,406)PRI income taxes — — — 123 123 (123) — Gains on sales of interests in real estate 1,277 1,766 — — 3,043 — 3,043 Minority interest in operating partnership — — — (1,423) (1,423) — (1,423)Equity in interest of partnerships and
joint ventures — — — — — 5,985 5,985 Equity in loss of PRI — — — — — (678) (678)Loss on early extinguishment of debt — (270) — — (270) — (270)Net income $ 13,270 $ 14,199 $ 1,126 $ (5,410) $ 23,185 $ — $ 23,185Investments in real estate, at cost $ 356,243 $ 258,195 $ 33,712 $ — $ 648,150 $ (138,744) $ 509,406Total assets $ 269,829 $ 137,125 $ 9,410 $ 179,517 $ 595,881 $ (114,266) $ 481,615 Capital expenditures $ 831 $ 3,777 $ — $ — $ 4,608 $ (974) $ 3,634

1 9 9 9 A n n u a l R e p o r t P e n n s y l v a n i a R e a l E s t a t e I n v e s t m e n t T r u s t
31
Adjustments to Total4-Month Period Ended 12/31/97 Retail Multifamily Other Corporate Total Equity Method Consolidated
Real estate operating revenues $ 11,076 $ 14,902 $ 538 $ — $ 26,516 $ (9,346) $ 17,170 Real estate operating expenses 3,714 6,654 7 — 10,375 (3,460) 6,915Net operating income 7,362 8,248 531 — 16,141 (5,886) 10,255General and administrative expenses — — — (1,088) (1,088) — (1,088)Interest income — — — 82 82 — 82 PRI net operating income — — — 922 922 (922) — EBIDTA 7,362 8,248 531 (84) 16,057 (6,808) 9,249 Interest expense (2,290) (4,534) (57) (195) (7,076) 2,727 (4,349)Depreciation and amortization (1,588) (2,126) (39) (434) (4,187) 1,492 (2,695)PRI income taxes — — — (228) (228) 228 —Gains on sales of interests in real estate 2,090 — — — 2,090 — 2,090 Minority interest in operating partnership — — — (394) (394) — (394)Equity in interest of partnerships and
joint ventures — — — — — 2,101 2,101 Equity in income of PRI — — — — — 260 260 Loss on early extinguishment of debt — — — (300) (300) — (300)Net income $ 5,574 $ 1,588 $ 435 $ (1,635) $ 5,962 $ — $ 5,962Investments in real estate, at cost $ 190,928 $ 214,587 $ 20,093 $ — $ 425,608 $ (137,681) $ 287,927Total assets $ 104,099 $ 107,474 $ 5,344 $ 161,461 $ 378,378 $ (112,812) $ 265,566Capital expenditures $ 114 $ 1,405 $ — $ — $ 1,519 $ (308) $ 1,211
Adjustments to TotalFiscal Year Ended 8/31/97 Retail Multifamily Other Corporate Total Equity Method Consolidated
Real estate operating revenues $ 20,186 $ 44,158 $ 1,426 $ — $ 65,770 $ (25,539) $ 40,231 Real estate operating expenses 6,911 19,686 32 — 26,629 (10,142) 16,487 Net operating income 13,275 24,472 1,394 — 39,141 (15,397) 23,744 General and administrative expenses — — — (3,324) (3,324) — (3,324)Provision for losses on investments — — — (500) (500) — (500)Interest income — — — 254 254 — 254 EBIDTA 13,275 24,472 1,394 (3,570) 35,571 (15,397) 20,174 Interest expense (4,446) (12,161) (159) — (16,766) 7,680 (9,086)Depreciation and amortization (3,151) (6,264) (118) (106) (9,639) 3,380 (6,259)Gains on sales of interests in real estate 1,069 — — — 1,069 — 1,069 Equity in interest of partnerships and
joint ventures — — — — — 4,337 4,337 Net income $ 6,747 $ 6,047 $ 1,117 $ (3,676) $ 10,235 $ — $ 10,235 Investments in real estate, at cost $ 94,185 $ 212,521 $ 9,486 $ — $ 316,192 $ (113,749) $ 202,443Total assets $ 52,781 $ 150,833 $ 5,091 $ 43,598 $ 252,303 $ (86,646) $ 165,657 Capital expenditures $ 794 $ 3,258 $ — $ — $ 4,052 $ (1,330) $ 2,722
1 5 . S u b s e q u e n t E v e n t s
In 2000, the Company and an unrelated third-party formed a partnership
and purchased the Willow Grove Park shopping center in Willow Grove,
Pennsylvania for approximately $140 million. Upon completion of certain
investment requirements, including the funding of an expansion of the
shopping center, the Company’s current 0.01% interest in the partnership
that owns the shopping center wi l l increase to a subordinated
50% interest.
In 2000, the Company purchased, for $11 million, including the assumption
of debt, its partner’s 35% interest in the Emerald Point Multifamily
Community. The property is now 100% owned and operated by the
Company.

32
To the Shareholders and Trustees of
Pennsylvania Real Estate Investment Trust:
We have audited the accompanying consolidated balance sheets of
Pennsylvania Real Estate Investment Trust (a Pennsylvania Trust) and
Subsidiaries as of December 31, 1999 and December 31, 1998 and the
related consolidated statements of income, shareholders’ equity and
cash flows for the years then ended, the four-month period ended
December 31, 1997 and the fiscal year ended August 31, 1997. These
financial statements are the responsibility of the Company’s management.
Our responsibility is to express an opinion on these financial statements
based on our audits. We did not audit the financial statements for Lehigh
Valley Mall Associates, a partnership in which the Company has a 50%
interest which is reflected in the accompanying financial statements
using the equity method of accounting. The equity in net income of
Lehigh Valley Mall Associates represents 15%, 12%, 19% and 23% of net
income for the years ended December 31, 1999 and 1998, the four-month
period ended December 31, 1997 and for the fiscal year ended August
31, 1997, respectively. The financial statements of Lehigh Valley Mall
Associates were audited by other auditors whose report has been furnished
to us and our opinion, insofar as it relates to the amounts included for
Lehigh Valley Mall Associates, is based solely on the report of the other
auditors.
We conducted our audits in accordance with auditing standards generally
accepted in the United States. Those standards require that we plan and
perform the audit to obtain reasonable assurance about whether the
financial statements are free of material misstatement. An audit includes
examining, on a test basis, evidence supporting the amounts and
disclosures in the financial statements. An audit also includes assessing
the accounting principles used and significant estimates made by
management, as well as evaluating the overall financial statement
presentation. We believe that our audits provide a reasonable basis for
our opinion.
In our opinion, based upon our audit and the report of other auditors, the
financial statements referred to above present fairly, in all material
respects, the financial position of Pennsylvania Real Estate Investment
Trust and Subsidiaries as of December 31, 1999 and 1998, and the results
of their operations and their cash flows for the years ended December
31, 1999 and 1998, the four-month period ended December 31, 1997
and the fiscal year ended August 31, 1997, in conformity with accounting
principles generally accepted in the United States.
Arthur Andersen LLP
Philadelphia, Pennsylvania
March 1, 2000
R e p o r t o f I n d e p e n d e n t P u b l i c A c c o u n t a n t s
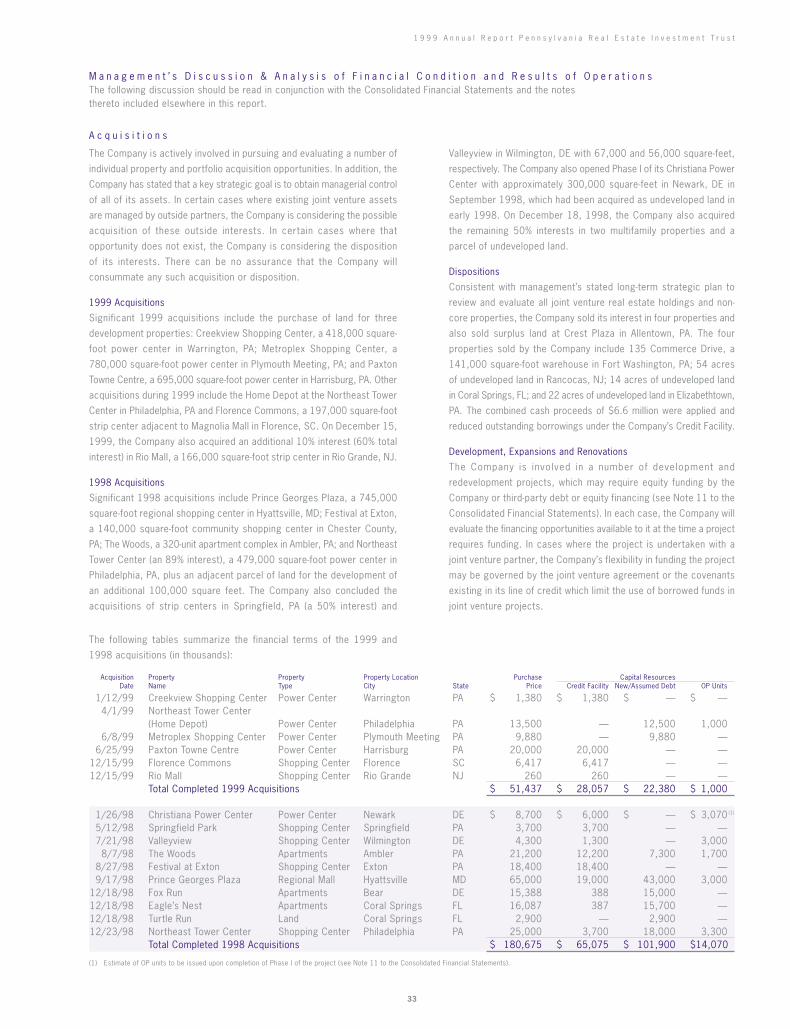
1 9 9 9 A n n u a l R e p o r t P e n n s y l v a n i a R e a l E s t a t e I n v e s t m e n t T r u s t
33
A c q u i s i t i o n s
The Company is actively involved in pursuing and evaluating a number of
individual property and portfolio acquisition opportunities. In addition, the
Company has stated that a key strategic goal is to obtain managerial control
of all of its assets. In certain cases where existing joint venture assets
are managed by outside partners, the Company is considering the possible
acquisition of these outside interests. In certain cases where that
opportunity does not exist, the Company is considering the disposition
of its interests. There can be no assurance that the Company will
consummate any such acquisition or disposition.
1999 Acquisitions
Significant 1999 acquisitions include the purchase of land for three
development properties: Creekview Shopping Center, a 418,000 square-
foot power center in Warrington, PA; Metroplex Shopping Center, a
780,000 square-foot power center in Plymouth Meeting, PA; and Paxton
Towne Centre, a 695,000 square-foot power center in Harrisburg, PA. Other
acquisitions during 1999 include the Home Depot at the Northeast Tower
Center in Philadelphia, PA and Florence Commons, a 197,000 square-foot
strip center adjacent to Magnolia Mall in Florence, SC. On December 15,
1999, the Company also acquired an additional 10% interest (60% total
interest) in Rio Mall, a 166,000 square-foot strip center in Rio Grande, NJ.
1998 Acquisitions
Significant 1998 acquisitions include Prince Georges Plaza, a 745,000
square-foot regional shopping center in Hyattsville, MD; Festival at Exton,
a 140,000 square-foot community shopping center in Chester County,
PA; The Woods, a 320-unit apartment complex in Ambler, PA; and Northeast
Tower Center (an 89% interest), a 479,000 square-foot power center in
Philadelphia, PA, plus an adjacent parcel of land for the development of
an additional 100,000 square feet. The Company also concluded the
acquisitions of strip centers in Springfield, PA (a 50% interest) and
M a n a g e m e n t ’ s D i s c u s s i o n & A n a l y s i s o f F i n a n c i a l C o n d i t i o n a n d R e s u l t s o f O p e r a t i o n sThe following discussion should be read in conjunction with the Consolidated Financial Statements and the notes thereto included elsewhere in this report.
Acquisition Property Property Property Location Purchase Capital ResourcesDate Name Type City State Price Credit Facility New/Assumed Debt OP Units
1/12/99 Creekview Shopping Center Power Center Warrington PA $ 1,380 $ 1,380 $ — $ —4/1/99 Northeast Tower Center
(Home Depot) Power Center Philadelphia PA 13,500 — 12,500 1,0006/8/99 Metroplex Shopping Center Power Center Plymouth Meeting PA 9,880 — 9,880 —
6/25/99 Paxton Towne Centre Power Center Harrisburg PA 20,000 20,000 — —12/15/99 Florence Commons Shopping Center Florence SC 6,417 6,417 — —12/15/99 Rio Mall Shopping Center Rio Grande NJ 260 260 — —
Total Completed 1999 Acquisitions $ 51,437 $ 28,057 $ 22,380 $ 1,000
1/26/98 Christiana Power Center Power Center Newark DE $ 8,700 $ 6,000 $ — $ 3,070 (1)
5/12/98 Springfield Park Shopping Center Springfield PA 3,700 3,700 — —7/21/98 Valleyview Shopping Center Wilmington DE 4,300 1,300 — 3,000
8/7/98 The Woods Apartments Ambler PA 21,200 12,200 7,300 1,7008/27/98 Festival at Exton Shopping Center Exton PA 18,400 18,400 — —9/17/98 Prince Georges Plaza Regional Mall Hyattsville MD 65,000 19,000 43,000 3,000
12/18/98 Fox Run Apartments Bear DE 15,388 388 15,000 —12/18/98 Eagle’s Nest Apartments Coral Springs FL 16,087 387 15,700 —12/18/98 Turtle Run Land Coral Springs FL 2,900 — 2,900 —12/23/98 Northeast Tower Center Shopping Center Philadelphia PA 25,000 3,700 18,000 3,300
Total Completed 1998 Acquisitions $ 180,675 $ 65,075 $ 101,900 $14,070
(1) Estimate of OP units to be issued upon completion of Phase I of the project (see Note 11 to the Consolidated Financial Statements).
Valleyview in Wilmington, DE with 67,000 and 56,000 square-feet,
respectively. The Company also opened Phase I of its Christiana Power
Center with approximately 300,000 square-feet in Newark, DE in
September 1998, which had been acquired as undeveloped land in
early 1998. On December 18, 1998, the Company also acquired
the remaining 50% interests in two multifamily properties and a
parcel of undeveloped land.
Dispositions
Consistent with management’s stated long-term strategic plan to
review and evaluate all joint venture real estate holdings and non-
core properties, the Company sold its interest in four properties and
also sold surplus land at Crest Plaza in Allentown, PA. The four
properties sold by the Company include 135 Commerce Drive, a
141,000 square-foot warehouse in Fort Washington, PA; 54 acres
of undeveloped land in Rancocas, NJ; 14 acres of undeveloped land
in Coral Springs, FL; and 22 acres of undeveloped land in Elizabethtown,
PA. The combined cash proceeds of $6.6 million were applied and
reduced outstanding borrowings under the Company’s Credit Facility.
Development, Expansions and Renovations
The Company is involved in a number of development and
redevelopment projects, which may require equity funding by the
Company or third-party debt or equity financing (see Note 11 to the
Consolidated Financial Statements). In each case, the Company will
evaluate the financing opportunities available to it at the time a project
requires funding. In cases where the project is undertaken with a
joint venture partner, the Company’s flexibility in funding the project
may be governed by the joint venture agreement or the covenants
existing in its line of credit which limit the use of borrowed funds in
joint venture projects.
The following tables summarize the financial terms of the 1999 and
1998 acquisitions (in thousands):
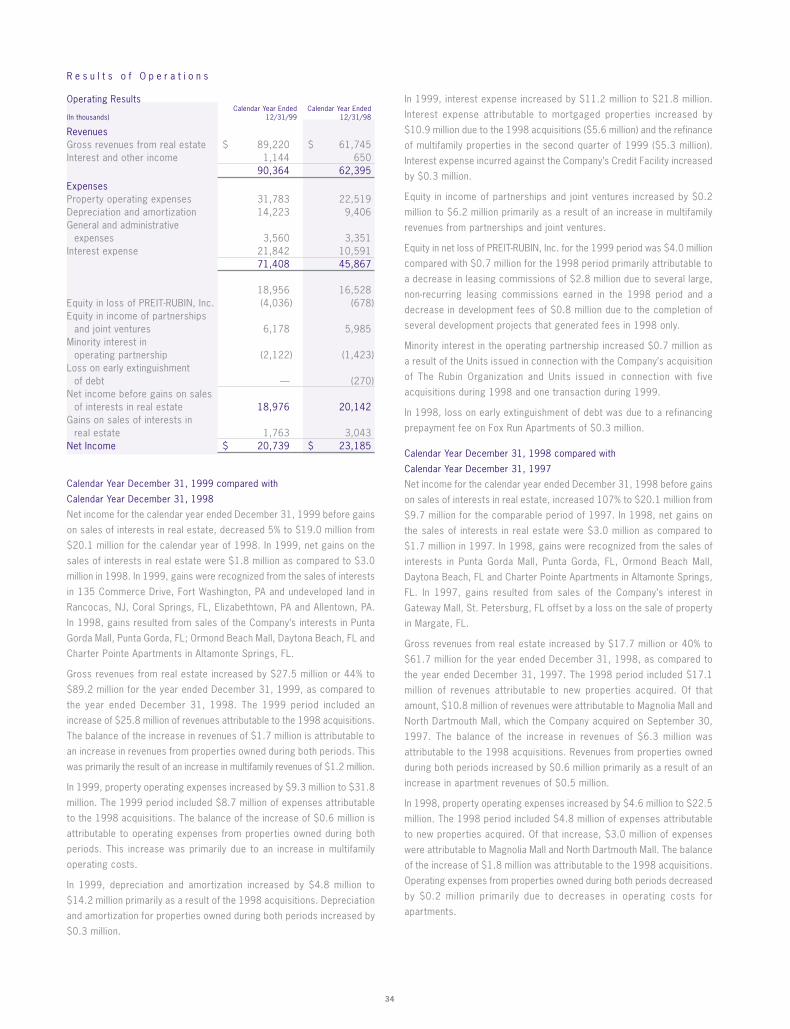
34
Calendar Year December 31, 1999 compared with
Calendar Year December 31, 1998
Net income for the calendar year ended December 31, 1999 before gains
on sales of interests in real estate, decreased 5% to $19.0 million from
$20.1 million for the calendar year of 1998. In 1999, net gains on the
sales of interests in real estate were $1.8 million as compared to $3.0
million in 1998. In 1999, gains were recognized from the sales of interests
in 135 Commerce Drive, Fort Washington, PA and undeveloped land in
Rancocas, NJ, Coral Springs, FL, Elizabethtown, PA and Allentown, PA.
In 1998, gains resulted from sales of the Company’s interests in Punta
Gorda Mall, Punta Gorda, FL; Ormond Beach Mall, Daytona Beach, FL and
Charter Pointe Apartments in Altamonte Springs, FL.
Gross revenues from real estate increased by $27.5 million or 44% to
$89.2 million for the year ended December 31, 1999, as compared to
the year ended December 31, 1998. The 1999 period included an
increase of $25.8 million of revenues attributable to the 1998 acquisitions.
The balance of the increase in revenues of $1.7 million is attributable to
an increase in revenues from properties owned during both periods. This
was primarily the result of an increase in multifamily revenues of $1.2 million.
In 1999, property operating expenses increased by $9.3 million to $31.8
million. The 1999 period included $8.7 million of expenses attributable
to the 1998 acquisitions. The balance of the increase of $0.6 million is
attributable to operating expenses from properties owned during both
periods. This increase was primarily due to an increase in multifamily
operating costs.
In 1999, depreciation and amortization increased by $4.8 million to
$14.2 million primarily as a result of the 1998 acquisitions. Depreciation
and amortization for properties owned during both periods increased by
$0.3 million.
In 1999, interest expense increased by $11.2 million to $21.8 million.
Interest expense attributable to mortgaged properties increased by
$10.9 million due to the 1998 acquisitions ($5.6 million) and the refinance
of multifamily properties in the second quarter of 1999 ($5.3 million).
Interest expense incurred against the Company’s Credit Facility increased
by $0.3 million.
Equity in income of partnerships and joint ventures increased by $0.2
million to $6.2 million primarily as a result of an increase in multifamily
revenues from partnerships and joint ventures.
Equity in net loss of PREIT-RUBIN, Inc. for the 1999 period was $4.0 million
compared with $0.7 million for the 1998 period primarily attributable to
a decrease in leasing commissions of $2.8 million due to several large,
non-recurring leasing commissions earned in the 1998 period and a
decrease in development fees of $0.8 million due to the completion of
several development projects that generated fees in 1998 only.
Minority interest in the operating partnership increased $0.7 million as
a result of the Units issued in connection with the Company’s acquisition
of The Rubin Organization and Units issued in connection with five
acquisitions during 1998 and one transaction during 1999.
In 1998, loss on early extinguishment of debt was due to a refinancing
prepayment fee on Fox Run Apartments of $0.3 million.
Calendar Year December 31, 1998 compared with
Calendar Year December 31, 1997
Net income for the calendar year ended December 31, 1998 before gains
on sales of interests in real estate, increased 107% to $20.1 million from
$9.7 million for the comparable period of 1997. In 1998, net gains on
the sales of interests in real estate were $3.0 million as compared to
$1.7 million in 1997. In 1998, gains were recognized from the sales of
interests in Punta Gorda Mall, Punta Gorda, FL, Ormond Beach Mall,
Daytona Beach, FL and Charter Pointe Apartments in Altamonte Springs,
FL. In 1997, gains resulted from sales of the Company’s interest in
Gateway Mall, St. Petersburg, FL offset by a loss on the sale of property
in Margate, FL.
Gross revenues from real estate increased by $17.7 million or 40% to
$61.7 million for the year ended December 31, 1998, as compared to
the year ended December 31, 1997. The 1998 period included $17.1
million of revenues attributable to new properties acquired. Of that
amount, $10.8 million of revenues were attributable to Magnolia Mall and
North Dartmouth Mall, which the Company acquired on September 30,
1997. The balance of the increase in revenues of $6.3 million was
attributable to the 1998 acquisitions. Revenues from properties owned
during both periods increased by $0.6 million primarily as a result of an
increase in apartment revenues of $0.5 million.
In 1998, property operating expenses increased by $4.6 million to $22.5
million. The 1998 period included $4.8 million of expenses attributable
to new properties acquired. Of that increase, $3.0 million of expenses
were attributable to Magnolia Mall and North Dartmouth Mall. The balance
of the increase of $1.8 million was attributable to the 1998 acquisitions.
Operating expenses from properties owned during both periods decreased
by $0.2 million primarily due to decreases in operating costs for
apartments.
R e s u l t s o f O p e r a t i o n s
Operating ResultsCalendar Year Ended Calendar Year Ended
(In thousands) 12/31/99 12/31/98
RevenuesGross revenues from real estate $ 89,220 $ 61,745Interest and other income 1,144 650
90,364 62,395
ExpensesProperty operating expenses 31,783 22,519Depreciation and amortization 14,223 9,406General and administrative
expenses 3,560 3,351Interest expense 21,842 10,591
71,408 45,867
18,956 16,528Equity in loss of PREIT-RUBIN, Inc. (4,036) (678)Equity in income of partnerships
and joint ventures 6,178 5,985Minority interest in
operating partnership (2,122) (1,423)Loss on early extinguishment
of debt — (270)Net income before gains on sales
of interests in real estate 18,976 20,142Gains on sales of interests in
real estate 1,763 3,043Net Income $ 20,739 $ 23,185

1 9 9 9 A n n u a l R e p o r t P e n n s y l v a n i a R e a l E s t a t e I n v e s t m e n t T r u s t
35
In 1998, depreciation and amortization increased by $2.5 million to $9.4
million primarily as a result of depreciation of $2.2 million from the
addition of Magnolia Mall and North Dartmouth Mall and the 1998
acquisitions. Depreciation and amortization for properties owned during
both periods increased by $0.3 million.
In 1998, interest expense increased by $0.3 million to $10.6 million.
Interest expense attributable to mortgaged properties increased by $0.5
million due to the acquisition of Magnolia Mall, The Woods Apartments and
Prince Georges Plaza, offset by the repayment of the mortgage on
Cobblestone Apartments in December 1997. Interest expense incurred
against the Company’s Credit Facility decreased by $0.2 million.
Equity in income of partnerships and joint ventures increased by $0.2
million to $6.0 million primarily as a result of the Company’s purchase
of a 50% interest in Oxford Valley Road Associates on September 30,
1997 and Springfield Mall, acquired during the second quarter of 1998,
which together contributed $0.6 million for the period. Equity in the
income of properties owned during both periods decreased by $0.3
million. This decrease was caused by a $0.6 million reduction from
Whitehall Mall which was being redeveloped, offset by increases of $0.3
million from other joint ventures.
In 1997, loss on early extinguishment of partnerships and joint venture
debt of $1.2 million related to refinancing fees paid on Lehigh Valley Mall
and Regency Apartments.
Equity in net loss of PREIT-RUBIN, Inc. for the 1998 period was $0.7 million
compared with income of $0.3 million for the 1997 period.
Minority interest in the operating partnership increased $1.0 million as
a result of the Units issued in connection with the Company’s acquisition
of The Rubin Organization and Units issued in connection with five
acquisitions during 1998.
In 1998, loss on early extinguishment of debt was due to a refinancing
prepayment fee on Fox Run Apartments of $0.3 million.
Calendar Year December 31, 1998 compared with
Fiscal Year August 31, 1997
Net income for the calendar year ended December 31, 1998 before gains
on sales of interests in real estate, increased 118% to $20.1 million from
$9.2 million for the fiscal year 1997. In 1998, net gains on the sales of
interests in real estate were $3.0 million as compared to $1.0 million in
1997. In 1998, gains were recognized from the sales of interests in Punta
Gorda Mall, Punta Gorda, FL, Ormond Beach Mall, Daytona Beach, FL and
Charter Pointe Apartments in Altamonte Springs, FL. In 1997, gains on
sales of the Company’s interest in shopping centers in Lancaster, Beaver
Falls and Waynesburg, PA of $1.5 million were offset by a loss on sale
of shopping center in Margate, FL of $0.4 million.
Gross revenues from real estate increased by $21.5 million or 53% to
$61.7 million for the year ended December 31, 1998, as compared to
$40.2 million for the year ended August 31, 1997. The 1998 period
included $20.5 million of revenues attributable to properties acquired.
Of that amount, $14.2 million of revenues were attributable to Magnolia
Mall and North Dartmouth Mall. The balance of the increase of $6.3
million was attributable to the 1998 acquisitions. Revenues from properties
owned during both periods increased by $1.0 million primarily as a result
of an increase in apartment revenues of $0.7 million.
In 1998, property operating expenses increased by $6.0 million to $22.5
million. The 1998 period included $6.1 million of expenses attributable
to properties acquired. Of that increase, $4.3 million of expenses were
attributable to Magnolia Mall and North Dartmouth Mall. The balance of
the increase of $1.8 million was attributable to the 1998 acquisitions.
Operating expenses from properties owned during both periods decreased
by $0.1 million primarily due to decreases in operating costs for apartments.
In 1998, depreciation and amortization increased by $3.1 million to $9.4
million primarily as a result of additional depreciation expense of $2.6
million from the acquisition of Magnolia Mall and North Dartmouth Mall
in 1997 and the 1998 acquisitions. Depreciation and amortization from
properties owned during both periods increased by $0.3 million.
In 1998, interest expense increased by $1.5 million to $10.6 million.
Interest expense attributable to properties increased by $3.8 million due
to the acquisition of Magnolia Mall, The Woods Apartments and Prince
Georges Plaza, offset by the repayment of the mortgage on Cobblestone
Apartments in December 1997. Interest expense incurred against the
Company’s Credit Facility decreased by $2.3 million.
Equity in income of partnerships and joint ventures increased by $1.6
million to $6.0 million as a result of the Company’s purchase of a 50%
interest in Oxford Valley Road Associates on September 30, 1997 and
three other properties, which contributed $0.7 million for the period. Equity
in the income of properties owned during both periods increased by
$0.9 million. This increase was net of a $0.8 million decrease from
Whitehall Mall which was being redeveloped.
Equity in net loss of PREIT-RUBIN, Inc. for the 1998 period was $0.7 million.
Minority interest in the operating partnership was $1.4 million as a result
of the Units issued in connection with the Company’s acquisition of The
Rubin Organization and Units issued in connection with five 1998
acquisitions (see Notes 3 and 12 to the Consolidated Financial Statements).
In 1998, loss on early extinguishment of debt was due to a refinancing
prepayment fee on Fox Run Apartments of $0.3 million.
Four-Month Periods Ended December 31, 1997 and 1996
Net income for the four months ended December 31, 1997 increased to
$6.0 million from $4.9 million as reported in the comparable period in
the prior year.
Gross revenues from real estate increased by $3.9 million to $17.0
million for the four month period ended December 31, 1997 as compared
to the same period in the prior year. The 1997 period included $3.5 million
of revenues attributable to Magnolia Mall and North Dartmouth Mall.
Revenues from properties owned during both periods increased by
$0.3 million primarily as a result of an increase in apartment revenues.
Operating expenses increased by $1.4 million to $6.9 million. The 1997
period included $1.3 million of expenses attributable to Magnolia Mall and
North Dartmouth Mall. Operating expenses from properties owned during
both periods increased by $0.1 million.
Depreciation and amortization increased by $0.6 million to $2.7 million
primarily as a result of the addition of the Magnolia Mall and North
Dartmouth Mall properties of $0.4 million, and increased amortization of
financing costs of approximately $0.1 million.
Interest expense increased by $1.2 million to $4.3 million as a result of
interest on borrowings against the Company’s Credit Facility for acquisitions
and working capital needs.
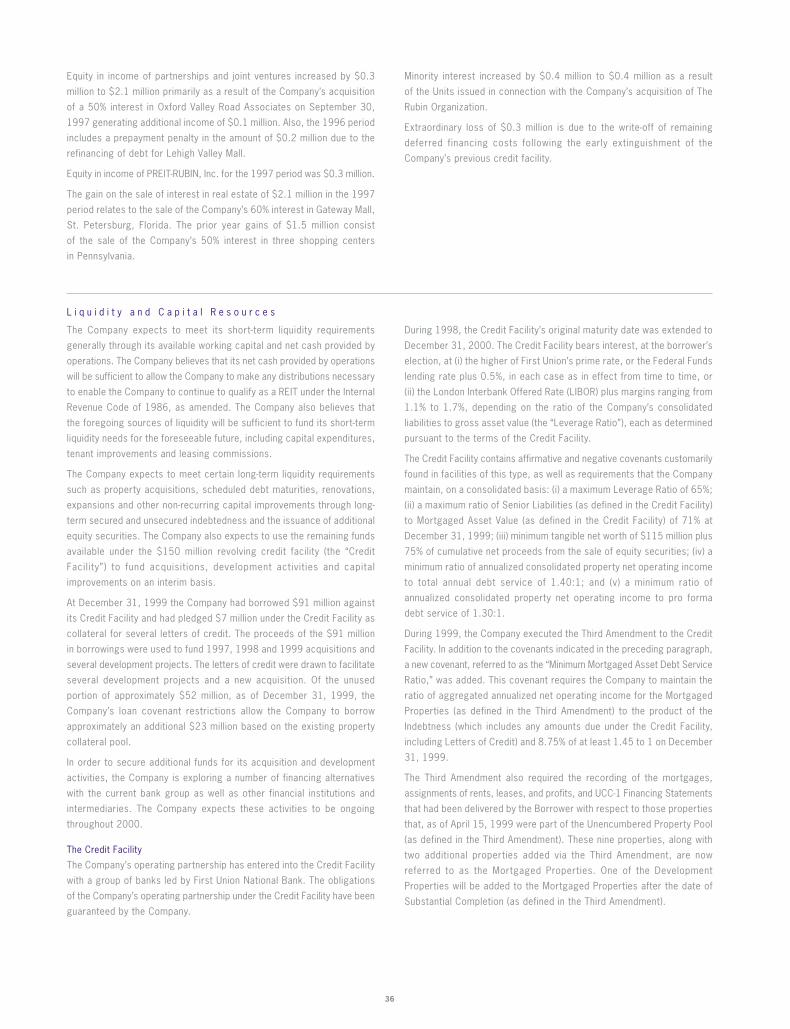
36
Minority interest increased by $0.4 million to $0.4 million as a result
of the Units issued in connection with the Company’s acquisition of The
Rubin Organization.
Extraordinary loss of $0.3 million is due to the write-off of remaining
deferred financing costs following the early extinguishment of the
Company’s previous credit facility.
Equity in income of partnerships and joint ventures increased by $0.3
million to $2.1 million primarily as a result of the Company’s acquisition
of a 50% interest in Oxford Valley Road Associates on September 30,
1997 generating additional income of $0.1 million. Also, the 1996 period
includes a prepayment penalty in the amount of $0.2 million due to the
refinancing of debt for Lehigh Valley Mall.
Equity in income of PREIT-RUBIN, Inc. for the 1997 period was $0.3 million.
The gain on the sale of interest in real estate of $2.1 million in the 1997
period relates to the sale of the Company’s 60% interest in Gateway Mall,
St. Petersburg, Florida. The prior year gains of $1.5 million consist
of the sale of the Company’s 50% interest in three shopping centers
in Pennsylvania.
L i q u i d i t y a n d C a p i t a l R e s o u r c e s
The Company expects to meet its short-term liquidity requirements
generally through its available working capital and net cash provided by
operations. The Company believes that its net cash provided by operations
will be sufficient to allow the Company to make any distributions necessary
to enable the Company to continue to qualify as a REIT under the Internal
Revenue Code of 1986, as amended. The Company also believes that
the foregoing sources of liquidity will be sufficient to fund its short-term
liquidity needs for the foreseeable future, including capital expenditures,
tenant improvements and leasing commissions.
The Company expects to meet certain long-term liquidity requirements
such as property acquisitions, scheduled debt maturities, renovations,
expansions and other non-recurring capital improvements through long-
term secured and unsecured indebtedness and the issuance of additional
equity securities. The Company also expects to use the remaining funds
available under the $150 million revolving credit facility (the “Credit
Facil ity”) to fund acquisitions, development activities and capital
improvements on an interim basis.
At December 31, 1999 the Company had borrowed $91 million against
its Credit Facility and had pledged $7 million under the Credit Facility as
collateral for several letters of credit. The proceeds of the $91 million
in borrowings were used to fund 1997, 1998 and 1999 acquisitions and
several development projects. The letters of credit were drawn to facilitate
several development projects and a new acquisition. Of the unused
portion of approximately $52 million, as of December 31, 1999, the
Company’s loan covenant restrictions allow the Company to borrow
approximately an additional $23 million based on the existing property
collateral pool.
In order to secure additional funds for its acquisition and development
activities, the Company is exploring a number of financing alternatives
with the current bank group as well as other financial institutions and
intermediaries. The Company expects these activities to be ongoing
throughout 2000.
The Credit Facility
The Company’s operating partnership has entered into the Credit Facility
with a group of banks led by First Union National Bank. The obligations
of the Company’s operating partnership under the Credit Facility have been
guaranteed by the Company.
During 1998, the Credit Facility’s original maturity date was extended to
December 31, 2000. The Credit Facility bears interest, at the borrower’s
election, at (i) the higher of First Union’s prime rate, or the Federal Funds
lending rate plus 0.5%, in each case as in effect from time to time, or
(ii) the London Interbank Offered Rate (LIBOR) plus margins ranging from
1.1% to 1.7%, depending on the ratio of the Company’s consolidated
liabilities to gross asset value (the “Leverage Ratio”), each as determined
pursuant to the terms of the Credit Facility.
The Credit Facility contains affirmative and negative covenants customarily
found in facilities of this type, as well as requirements that the Company
maintain, on a consolidated basis: (i) a maximum Leverage Ratio of 65%;
(ii) a maximum ratio of Senior Liabilities (as defined in the Credit Facility)
to Mortgaged Asset Value (as defined in the Credit Facility) of 71% at
December 31, 1999; (iii) minimum tangible net worth of $115 million plus
75% of cumulative net proceeds from the sale of equity securities; (iv) a
minimum ratio of annualized consolidated property net operating income
to total annual debt service of 1.40:1; and (v) a minimum ratio of
annualized consolidated property net operating income to pro forma
debt service of 1.30:1.
During 1999, the Company executed the Third Amendment to the Credit
Facility. In addition to the covenants indicated in the preceding paragraph,
a new covenant, referred to as the “Minimum Mortgaged Asset Debt Service
Ratio,” was added. This covenant requires the Company to maintain the
ratio of aggregated annualized net operating income for the Mortgaged
Properties (as defined in the Third Amendment) to the product of the
Indebtness (which includes any amounts due under the Credit Facility,
including Letters of Credit) and 8.75% of at least 1.45 to 1 on December
31, 1999.
The Third Amendment also required the recording of the mortgages,
assignments of rents, leases, and profits, and UCC-1 Financing Statements
that had been delivered by the Borrower with respect to those properties
that, as of April 15, 1999 were part of the Unencumbered Property Pool
(as defined in the Third Amendment). These nine properties, along with
two additional properties added via the Third Amendment, are now
referred to as the Mortgaged Properties. One of the Development
Properties will be added to the Mortgaged Properties after the date of
Substantial Completion (as defined in the Third Amendment).

1 9 9 9 A n n u a l R e p o r t P e n n s y l v a n i a R e a l E s t a t e I n v e s t m e n t T r u s t
37
Contingent Liabilities
The Company along with certain of its joint venture partners has guaranteed
debt totaling $6.2 million (see Note 4 to Consolidated Financial Statements).
Also, the Company and its joint venture partner have jointly and severally
guaranteed the construction loan payable on a development project. The
balance of the loan at December 31, 1999 is $22.3 million and the
remaining commitment from the lender is $43.7 million for a total credit
line of $66.0 million.
Interest Rate Protection
In order to reduce exposure to variable interest rates, the Company
entered into a six-year interest rate swap agreement with First Union, on
$20 million of indebtedness which fixes a rate of 6.12% per annum
versus 30-day LIBOR until June 2001.
Financial Instruments Sensitivity Analysis
The analysis below presents the sensitivity of the market value of the
Company’s financial instruments to selected changes in the general level
of market interest rates. In order to mitigate the impact of fluctuation in
market interest rates, the Company‘s derivative and other financial
instruments consist of long-term debt (including current portion) and an
interest rate swap agreement. All financial instruments are entered into
for other than trading purposes and the net market value of these financial
instruments combined is referred to as the net financial instrument
position. As of December 31, 1999, the Company’s consolidated debt
portfolio consisted of $266.8 million in fixed rate mortgage notes and
$91.0 million borrowed under its revolving Credit Facility. The Company
has limited its exposure to increases in LIBOR on its floating rate debt
by entering into a $20.0 million interest rate swap agreement which
expires in June 2001 and carries a fixed interest rate of 6.12% versus
30-day LIBOR. Management does not foresee any significant changes in
the Company’s exposure to interest rate fluctuations or how such exposure
will be managed in the near future.
Changes in market interest rates have different impacts on the fixed and
variable portions of the Company’s debt portfolio. A change in market
interest rates on the fixed portion of the debt portfolio impacts the net
financial instrument position, however, it has no impact on interest
incurred or cash flows. A change in market interest rates on the variable
portion of the debt portfolio impacts the interest incurred and cash flows,
but does not impact the net financial instrument position. The sensitivity
analysis, related to the fixed debt portfolio, assumes an immediate 100
basis point move in interest rates from their actual December 31, 1999
levels, with all other variables held constant. A 100 basis point increase
in market interest rates would result in a decrease in the net financial
instrument position of $13.5 million at December 31, 1999. A 100 basis
point decrease in market interest rates would result in an increase in the
net financial instrument position of $14.6 million at December 31, 1999.
Based on the variable-rate debt included in the Company’s debt portfolio,
including an interest rate swap agreement, as of December 31, 1999,
a 100 basis point increase in interest rates would result in an additional
$0.7 million in interest incurred at December 31, 1999. A 100 basis
point decrease would reduce interest incurred by $0.7 million at December
31, 1999.
Mortgage Notes
In addition to amounts due under the Credit Facility, during the next three
years construction and mortgage loans, secured by properties owned by
two partnerships in which the Company has an interest, mature by their
terms. Balloon payments on these loans total $22.9 million of which the
Company’s proportionate share is $11.8 million. Construction and
mortgage loans on properties wholly-owned by the Company also mature
by their terms. Balloon payments on these loans total $21.7 million.
In order to secure additional funds for its acquisition and development
activities, on April 13, 1999, the Company concluded the financing of
eight multifamily communities with $108.0 million of permanent, fixed-
rate, long-term debt. With the financing, the Company replaced short-term
floating rate debt with fixed rate, mortgage debt. The new debt carries
a weighted average fixed interest rate of approximately 6.77%. The eight
properties secure the non-recourse loans, which amortize over 30 years
and mature in May 2009. Proceeds from these newly-placed loans were
used to (i) repay approximately $88.0 million of the Credit Facility, (ii) pay
off a short-term floating rate loan of approximately $17.0 million and (iii)
fund approximately $3.0 million in closing costs.
Commitments
At December 31, 1999, the Company had approximately $73 million
committed to complete current development and redevelopment projects.
Of this amount, approximately $40.0 million of construction financing has
been placed. In connection with certain development properties, including
those development properties acquired as part of the Company’s acquisition
of The Rubin Organization (see Note 3 to the Consolidated Financial
Statements), the Company may be required to issue additional Units
upon the achievement of certain financial results.
Cash Flows
During the year ended December 31, 1999, the Company generated $32.3
million in cash flow from operating activities. Other sources and uses of
cash flow included: (i) $120.5 million in net proceeds from mortgage notes
payable, and (ii) $6.8 million proceeds from a construction loan payable;
offset by (i) $47.9 million net repayments of the Company’s Credit Facility,
(ii) $17.0 million of prepayments of mortgage notes payable, (iii) $3.7
million of other principal installments, and (iv) $27.6 million of distributions
to shareholders and Unit holders. During the year ended December 31,
1999, the Company had net investing activities of $64.9 million including:
(i) investments in wholly-owned real estate assets ($37.0 million), (ii)
investments in property under development ($26.8 million), (iii) investments
in partnerships and joint ventures ($8.3 million), (iv) investments in the
affiliated management company ($2.1 million), offset by (i) cash proceeds
from gains on sales of real estate interests of $5.5 million and (ii) cash
distributions from partnerships and joint ventures in excess of equity in
income of $3.8 million.

38
F u n d s F r o m O p e r a t i o n s
The Company computes Funds from Operations in accordance with
standards established by NAREIT which may not be comparable to Funds
from Operations reported by other REITs that do not define the term in
accordance with the current NAREIT definition or that interpret the current
NAREIT definition differently than the Company. Funds from Operations
does not represent cash generated from operating activities in accordance
with GAAP and should not be considered as an alternative to net income
(determined in accordance with GAAP) as an indication of the Company’s
financial performance or as an alternative to cash flow from operating
activities (determined in accordance with GAAP) as a measure of the
Company’s liquidity, nor is it indicative of funds available to fund the
Company’s cash needs, including its ability to make cash distributions.
Funds from operations increased 12.5% to $38.9 million for the year ended
December 31, 1999, as compared to $34.6 million in 1998. The increase
is primarily due to an improvement in net operating income from residential
properties and newly acquired properties in 1998 and 1999.
Capital Expenditures
During calendar 1999, the Company expended $3.6 million for capital
expenditures; $3.3 million ($517 per unit owned adjusted for partnership
interests) for multifamily communities and $0.3 million for shopping
centers. The Company’s policy is to capitalize expenditures for floor
coverings, appliances and major exterior preparation and painting for
apartments. During the year, $1.3 million ($229 per unit owned) was
expended for floor covering and $0.65 million ($108 per unit owned)
for appliances.
Environmental Matters
In 1994, the Company established a reserve of $0.6 mil l ion for
environmental remediation costs. In addition, the Company received a credit
of $0.4 million for environmental matters in connection with the acquisition
of two properties. Since 1994 a total of $0.7 million was charged against
the reserve. The Company also reduced the reserve by $0.2 million
leaving a balance of $0.1 million, which is the Company’s share of the
estimated remaining environmental liability. There can be no assurance
that these amounts will be adequate to cover future environmental costs.
Year 2000
The Company expended approximately $0.2 million in connection with
hardware, software and equipment upgrades and repairs relating to the
Year 2000 issue. The Company did not incur any significant interruption
of services in connection with the Year 2000, nor does the Company expect
to incur any in the future.
Competition
The Company’s shopping centers compete with other shopping centers
in their trade areas as well as alternative retail formats, including
catalogues, home shopping networks and internet commerce. Apartment
properties compete for tenants with other multifamily properties in their
markets. Economic factors, such as employment trends and the level of
interest rates, impact shopping center sales as well as a prospective
tenant’s choice to rent or own his/her residence.
Inflation
Inflation can have many effects on the financial performance of the
Company. Shopping center leases often provide for the payment of rents
based on a percentage of sales which may increase with inflation. Leases
may also provide for tenants to bear all or a portion of operating expenses
which may reduce the impact of such increases on the Company. Apartment
leases are normally for a one-year term which may allow the Company
to seek increased rents as leases are renewed or when new tenants are
obtained.
Forward-Looking Statements
The matters discussed in this report, as well as news releases issued
from time to time by the Company use forward-looking terminology such
as “may,” “will,” “should,” “expect,” “anticipate,” “estimate,” “plan,” or
“continue” or the negative thereof or other variations thereon, or
comparable terminology which constitute “forward-looking statements.”
Such forward-looking statements (including without limitation, information
concerning the Company’s planned acquisition, development and divestiture
activities, short- and long-term liquidity position, ability to raise capital
through public and private offerings of debt and/or equity securities,
availability of adequate funds at reasonable cost, revenues and operating
expenses for some or all of the properties, leasing activities, occupancy
rates, changes in local market conditions or other competitive factors)
involve known and unknown risks, uncertainties and other factors that
may cause the actual results, performance or achievements of the
Company’s results to be materially different from any future results,
performance or achievements expressed or implied by such forward-looking
statements. The Company disclaims any obligation to update any such
factors or to publicly announce the result of any revisions to any of the
forward-looking statements contained herein to reflect future events or
developments.

1 9 9 9 A n n u a l R e p o r t P e n n s y l v a n i a R e a l E s t a t e I n v e s t m e n t T r u s t
39
T r u s t e e s
S y l v a n M . C o h e n , C h a i r m a nAge 85; Trustee since 1960; Chairman ofProperty Committee
Founding Trustee; Chief Executive Officer until 1997.Of counsel to Drinker Biddle & Reath LLP and formerpartner in the Philadelphia law firm of Cohen, Shapiro,Polisher, Shiekman and Cohen. Trustee and formerPresident of the International Council of ShoppingCenters and the National Association of Real EstateInvestment Trusts. Trustee of Orleans Homebuilders,Inc. and EQK Realty Investors I. Member of AdvisoryBoard of the Real Estate Center at the WhartonSchool. Former President of the Jewish Federation ofGreater Philadelphia and trustee or director of UnitedWay, March of Dimes, University of PennsylvaniaMedical Center, National Conference of Christians andJews and Police Athletic League of Philadelphia.
W i l l i a m R . D i m e l i n gAge 58; Trustee since 1982; Member of the AuditCommittee and Executive Compensation andHuman Resources Committee
Partner and co-founder, Dimeling, Schreiber andPark (private investment partnership); FormerExecutive Vice President of the Reading Company andpartner in the law firm of Townsend, Elliot andMunson. Director of New Piper Aircraft Corporation,Burlingtone Motor Carriers and a number of theDS&P portfolio firms.
R o s e m a r i e B . G r e c oAge 53; Trustee since 1997; Member of AuditCommittee
Principal, GRECOventures (business investment andleadership development); former CEO and President,CoreStates Bank, N.A. Director of Cardone Industries,Inc., Genuardi Markets, Inc., PECO Energy Corp.,PRWT Comserve, Inc., Radian, Inc. and Sunoco, Inc.Past chair of the Greater Philadelphia Chamber ofCommerce, former interim president and CEO ofPhiladelphia Private Industry Council and formerchair of Philadelphia Women’s Commission. Formermember of Philadelphia Planning Commission andBoard of Education.
L e e H . J a v i t c hAge 69; Trustee since 1985; Member of AuditCommittee and Executive Compensation andHuman Resources Committee
Private Investor and former Chairman and ChiefExecutive Officer, Giant Food Stores, Inc. Directorof Jewish Theological Seminary of America, AllfirstFinancial Inc., and Jewish Community Center ofHarrison, NY. Former director of MAZON: A JewishResponse to Hunger, Rye Country Day School,Pennsylvania Counci l on Ar ts, and execut ivecommittee member of Boy Scouts of America.
L e o n a r d I . K o r m a nAge 64; Trustee since 1996; Member of PropertyCommittee and Executive Compensation andHuman Resources Committee
Chairman and Chief Executive Officer, KormanCommercial Properties, Inc. (real estate developmentand management). Member of regional advisoryboard of First Union National Bank. Trustee of AlbertEinstein Health Care Network, Thomas JeffersonUniversity, and Korman Family Foundation.
J e f f r e y P . O r l e a n sAge 53; Trustee since 1986; Member of PropertyCommittee and Audit Committee
Chairman and Chief Executive Officer, OrleansHomebuilders, Inc. (residential development); Partner,Orleans Builders and Developers. Director of BuildersLeague of South Jersey, the National Association ofHome Builders, New Jersey National Bank, Mainard,Inc., and Resort at Palm Aire, Inc. Member of Boardof Federation of Jewish Agencies, The Baldwin School,The William Penn Charter School, The AmericanCommittee for the Weizmann Institute of Science,Albert Einstein Medical Center and Children’s Hospital.
G e o r g e F . R u b i nAge 57; President, PREIT-RUBIN, Inc.; Trusteesince 1997
Joined The Rubin Organization, Inc. in 1970. Boardmember of Lafayette College, Elwyn Institute, theCentral Philadelphia Development Corporation, theFoundation for Architecture, and The PhiladelphiaVietnam Veteran’s Memorial. Chairman of the Boardof Thorncroft Therapeutic Horseback Riding, Inc.
R o n a l d R u b i nAge 68; Chief Executive Officer; Trustee since1997; Member of Property Committee
Joined Richard I. Rubin and Co., Inc. in 1953 andserved as chairman and chief executive officer of TheRubin Organization, Inc. for over 25 years. Trusteeof International Council of Shopping Centers. Directorof PECO Energy Corp. Chairman of Center CityDistrict and past Chairman of the Greater PhiladelphiaChamber of Commerce. Served on boards of FranklinInstitute, Philadelphia Orchestra, Albert EinsteinMedical Center, Tel Aviv University, American Friendsof Hebrew University, Midlantic Bank (now PNC),University of the Arts and the United Jewish Appeal.
J o n a t h a n B . W e l l e rAge 53; President and Chief Operating Officer;Trustee since 1994; Member of PropertyCommittee
Joined the Company in 1994; former Executive VicePresident and Director of Eastdil Realty, Inc. (realestate investment banking). Member of NationalAssociation of Real Estate Investment Trusts, UrbanLand Institute and International Council of ShoppingCenters. Director of Lower Merion Conservancy.

40
Pennsylvania Real Estate Investment Trust
S y l v a n M . C o h e nChairman
R o n a l d R u b i nChief Executive Officer
J o n a t h a n B . W e l l e rPresident and Chief Operating Officer
E d w a r d A . G l i c k m a nExecutive Vice President and Chief Financial Officer
J e f f r e y A . L i n nSenior Vice President – Acquisitions and Secretary
D a n t e J . M a s s i m i n iSenior Vice President – Finance and Treasurer
R a y m o n d J . T r o s tVice President – Asset Management
PREIT–RUBIN, Inc.
G e o r g e F . R u b i nPresident
J o s e p h F . C o r a d i n oExecutive Vice President – Retail Division
D o u g l a s S . G r a y s o nExecutive Vice President – Development
L e o n a r d B . S h o r eExecutive Vice President – Special Projects
P o w e l l W . A r m s I I IVice President – Development
J u d i t h E . B a k e rVice President – Human Resources
J o n a t h e n B e l lVice President – Financial Services
E l a i n e B e r g e rVice President – Specialty Leasing
V e r n o n B o w e nVice President – Risk Management
D a v i d B r y a n tVice President – Financial Services
N i c o l i n a C o l u m b oVice President – Director of Mall Leasing
H a r v e y D i a m o n dVice President – Site Acquisition
C h e r y l K . D o u g h e r t yVice President – Marketing
R . S c o t t P e t r i eVice President – Retail Management
T i m o t h y R . R u b i nVice President – Director of Strip Center Leasing
L a r r y T r a c h t m a nVice President – Legal
M a r i o C . V e n t r e s c a , J r .Vice President – Retail Asset Management
P R E I T i s a m e m b e r o f :National Association of Real Estate Investment Trusts
International Council of Shopping Centers
National Multi-Housing Council
Pension Real Estate Association
Urban Land Institute
O f f i c e r s

H e a d q u a r t e r s
200 South Broad Street
Philadelphia, PA 19102–3803
215.875.0700
215.546.7311 Fax
www.preit.com
I n d e p e n d e n t P u b l i c A c c o u n t a n t s
Arthur Andersen LLP
1601 Market Street
Philadelphia, PA 19103–2499
L e g a l C o u n s e l
Drinker Biddle & Reath LLP
One Logan Square
18th & Cherry Streets
Philadelphia, PA 19103–6996
T r a n s f e r A g e n t a n d R e g i s t r a r
For change of address, lost dividend checks, shareholder
records and other shareholder matters, contact:
American Stock Transfer & Trust Co.
40 Wall Street
New York, NY 10005
800.937.5449
718.331.1852 Fax
I n v e s t o r I n q u i r i e s
Shareholders, prospective investors and analysts seeking
information about the company should direct their inquiries to:
Jean Dardzinski
Director of Investor Relations
Pennsylvania Real Estate Investment Trust
200 South Broad Street
Philadelphia, PA 19102–3803
215.875.0735
215.549.8562 Fax
Email: [email protected]
A n n u a l M e e t i n g
The Annual Meeting of Shareholders is scheduled for 11 am
on Wednesday, May 10, 2000 at the Park Hyatt at the Bellevue,
200 South Broad Street, Philadelphia, Pennsylvania.
F o r m s 1 0 - K a n d 1 0 - Q
The Company’s Annual Report on Form 10-K, including financial
statements and schedules, and Quarterly Reports on
Form 10-Q, which are filed with the Securities and Exchange
Commission, may be obtained without charge from
the Company.
M a r k e t P r i c e a n d D i s t r i b u t i o n R e c o r d
The following table shows the high and low sales prices
for PREIT shares and cash distributions paid for the periods
indicated.
Quarters Ended 12/31/99 High Low Distributions Paid
March 31 20.25 18.56 $ 0.47June 30 21.69 18.56 0.47September 30 21.00 18.56 0.47December 31 18.88 14.00 0.47
$ 1.88
Quarters Ended 12/31/98 High Low Distributions Paid
March 31 25.25 23.50 $ 0.47June 30 24.69 21.50 0.47September 30 24.13 18.63 0.47December 31 21.50 18.75 0.47
$ 1.88
As of December 31, 1999, there were approximately 1,260
shareholders of record of the company’s shares of beneficial
interest.
S t o c k M a r k e t
New York Stock Exchange
I n v e s t o r I n f o r m a t i o n
Des
ign:
Alle
man
n Al
mqu
ist
& J
ones
; Ed
itoria
l: Ro
bert
Gun
ther
; Ph
otog
raph
y: V
ario
us
41

P e n n s y l v a n i a R e a l E s t a t e I n v e s t m e n t Tr u s t
200 South Broad Street
Philadelphia, PA 19102–3803
www.preit.com