preferential trading arrangements, by geographic … entered into preferential trading arrangements,...
TRANSCRIPT
Norman S. Fieleke
Vice President and Economist, FederalReserve Bank of Boston. Kenneth S.Neuhauser provided research assistance.
O ver the past several decades, more and more countries haveI entered into preferential trading arrangements, provoking con-cern that the benefits of free trade are being sacrificed to
growing discrimination. Just how widespread is this discrimination ininternational trade, and is it "legitimate" under the codes of interna-tional behavior to which countries generally subscribe? What doeseconomic theory tell us about the likely consequences of such discrim-ination, and why do so many nations engage in it? Are patterns of tradebeing seriously distorted by the emergence of discriminatory "tradingblocs"? The answers offer little indication that the sky is falling, butneither do they provide grounds for complacency.
The Prevalence of Preferential TradingTo our knowledge, no comprehensive compilation of preferential
trading arrangements has previously been published. And the listing inTable I may be less than complete, although we invested much researchin its preparation. The list is formidable. Included in the 23 arrange-ments identified are 119 countries, accounting for some 82 percent ofthe world’s international trade in goods. No region is free from sucharrangements; indeed, one would be hard-pressed to find even onecountry that does not receive from, or grant to, other countries someform of explicit preferential treatment in international trade, althoughthat treatment might take some mode other than participation in amultilateral arrangement such as those included in the table.
Preferential trading arrangements take several forms, but all favorthe trade of the participants over that of nonparticipating countries. Inthe most casual arrangement, the trade preference association, eachmember establishes lower governmental barriers against imports ofgoods from other members than against comparable imports from

Table 1Preferential Trading_Arrangements, by Geographic Regi~on__and Yea~r_L~aunchedRegion, Title Year
and Membership Launched
Africa:Communaute Economique de I’Afrique de I’Ouest (CEAO), or West African EconomicCommunity:
Benin, Burkina Faso, C6te d’lvoire, Mall, Mauritania, Niger, Senegal
Union Douaniere et Economique de I’Afrique Centrale (UDEAC), or Economic andCustoms Union of Central Africa:
Cameroon, Central African Republic, Chad, Congo, Equatorial Guinea, Gabon
Southern African Customs Union (SACU):Bophuthatswana, Botswana, Ciskei, Lesotho, Namibia, South Africa, Swaziland,Transkei, Venda
Type of TradeArrangement
Mano River Union (MRU):Guinea, Liberia, Sierra Leone
Economic Community of West African States (ECOWAS):Benin, Burkina Faso, Cape Verde, C6te d’lvoire, The Gambia, Ghana, Guinea,Guinea-Bissau, Liberia, Mall, Mauritania, Niger, Nigeria, Senegal, Sierra Leone, Togo
Preferential Trade Area for Eastern and Southern African States (PTA):Burundi, Comoros, Djibouti, Ethiopia, Kenya, Lesotho, Malawi, Mauritius,Mozambique, Rwanda, Somalia, Swaziland, Tanzania, Uganda, Zambia, Zimbabwe
Communaut# Economique des Etats de I’Afrique Centrale (CEEAC), or EconomicCommunity of Central African States:
Burundi, Cameroon, Central African Republic, Chad, Congo, Equatorial Guinea,Gabon, Rwanda, Sao Tome and Principe, Zaire
Arab Maghreb Union (AMU):Algeria, Libya, Mauritania, Morocco, Tunisia
1959 Customs union
1964 Customs union
1969 Customs union
1973 Customs union
1975 Common market
1981 Trade preferenceassociation
1981 Common market
1989 Common market
Asia:Association of Southeast Asian Nations (ASEAN):
Brunei, Indonesia, Malaysia, Philippines, Singapore, Thailand
Bangkok Agreement:Bangladesh, India, Laos, South Korea, Sri Lanka
1967 Free trade area
1976 Trade preferenceassociation
Europe:European Community (EC):
Belgium, Denmark, France, Germany, Greece, Ireland, Italy, Luxembourg,Netherlands, Portugal, Spain, United Kingdom
European Free Trade Association (EFTA):Austria, Finland, Iceland, Liechtenstein, Norway, Sweden, Switzerland
European Community and European Free Trade Association:Member countries of the EC and EFTA
1957 Common market
1960 Free trade area
1972 Industrial freetrade area
Latin America:Central American Common Market (CACM):
Costa Rica, El Salvador, Guatemala, Honduras, Nicaragua1960
Andean Common Market (ANCOM):Bolivia, Colombia, Ecuador, Peru, Venezuela
1969
Caribbean Common Market (CARICOM): 1973Antigua and Barbuda, Bahamas, Barbados, Belize, Dominic& Grenada, Guyana,Jamaica, Montserrat, St. Kitts-Nevis, St. Lucia, St. Vincent and the Grenadines,Trinidad and Tobago ..............
Customs union
Common market
Common market
4 May/June 1992 New England Economic Reviezo

Table 1 continued
Region, Titleand Membership
Latin American Integration Association (LAIA):Argentina, Bolivia, Brazil, Chile, Colombia, Ecuador, Mexico, Paraguay, Peru,Uruguay, Venezuela
Year Type of TradeLaunched Arrangement
1980 Trade preferenceassociation
Organization of Eastern Caribbean States (OECS):Antigua and Barbuda, Dominica, Grenada, Montserrat, St. Kitts-Nevis, St. Lucia,St. Vincent and Grenadines, Virgin Islands U.K.
1981 Customs union
Southern Cone Common Market (MERCOSUL or MERCOSUR):Argentina, Brazil, Paraguay, Uruguay
1991 Common market
Middle East:Gulf Cooperation Council (GCC):
Bahrain, Kuwait, Oman, Qatar, Saudi Arabia, United Arab Emirates1981 Common market
Middle East and Africa:Arab Common Market (ACM):
Egypt, Iraq, Jordan, Lebanon, Libya, Mauritania, Syria1964 Common market
North America:Canada-United States Free Trade Agreement:
Canada, United States1989 Free trade area
Oceania:Australia-New Zealand Closer Economic Relations Trade Agreement (ANZCERT):
Australia, New Zealand1983 Free trade area
Other:Other preferential arrangements include various bilateral free trade agreements,such as between Israel and the EC, Israel and the United States, and Chile andMexico, and also preferential treatment for imports from less developed countries bymany countries, including the EC and the United States.
Source: See the Appendix.
nonmember countries. In the free trade area, mem-bers go a step further and completely eliminategovernmental barriers against goods imports fromother members, but, as in the trade preference asso-ciation, maintain their individual barriers againstimports from nonmembers. Establishment of a cus-toms union requires that members not only eliminategovernment barriers against merchandise importsfrom one another, but also establish identical barri-ers--in particular, a common tariff barrier sharedby all---against imports from nonmembers. Finally,the customs union becomes a common market withthe removal of artificial or governmental impedi-ments to all transactions between members, includ-ing transfers of labor, capital, and services as well asgoods.
Is It Legal?A code of law for international trade is set forth
in the General Agreement on Tariffs and Trade(GATT), which is applied as a treaty obligationamong countries that subscribe, or "contract," to theAgreement. In addition, GATT entails an organiza-tion, or forum, in which countries discuss and nego-tiate issues of international trade, such as the multi-lateral liberalizations under consideration in thecurrent Uruguay Round. GATT entered into force in1948, with 23 original contracting parties, a numberthat had grown to 103 by November 1991, with anadditional 29 countries applying the agreement defacto (GATT 1980, 1992).
The very first paragraph of the very first article of
May/June 1992 New England Economic Review 5
the General Agreement lays down a broad prohibi-tion against the use of preferential tariff rates: "Withrespect to customs dues . . . any advantage, favor,privilege or immunity granted by any contractingparty to any product originating in or destined forany other country shall be accorded immediately andunconditionally to the like product originating in ordestined for the territories of all other contractingparties." (GATT 1969, p. 2) This language givesexpression to the unconditional most-favored-nation(MFN) principle, the principle that each contractingparty must grant to every other contracting partytreatment as favorable as it grants to any country.Long before the GATT, this principle of nondiscrim-ination had been generally observed by many nations.
However, the very second paragraph of thissame first article allows an exception to this principle,permitting the continued application of many prefer-ential tariff rates that were in effect at the time theGATT was adopted. And a much more significantexception is to be found in Article XXIV, which spellsout the conditions under which GATT signatoriesmay form customs unions and free trade areas (andinterim arrangements leading to them). The forma-tion of such preferential trading arrangements isallowed as long as the following conditions are met:(1) trade barriers are eliminated on substantially alltrade among members; (2) the trade barriers remain-ing against nonmembers are not higher or morerestrictive than those previously in effect (in the caseof a customs union, not "on the whole" higher ormore restrictive); and (3) interim arrangements lead-
No region is free from preferentialtrading arrangements, favoringthe trade of the participants over
that of nonparticipating countries.
ing to the free trade area or customs union areemployed for only a reasonable length of time.
Provided these three rather ambiguous condi-tions are satisfied, arrangements such as those listedin Table I do not violate the legal obligations assumedby members of the GATT. Nonmembers are free todiscriminate without satisfying any such conditions(unless they have limited that freedom through othertreaty obligations), according to the prevailing inter-
pretation of international law (Jackson 1989, p. 134).Of the countries participating in the discriminatoryarrangements identified in the table, only 18 neitherbelong to GATT nor apply its provisions de facto.
Under GATT it has been possible to rationalize, ifnot justify, the proliferation of preferential tradingarrangements because of the ambiguous languageused in specifying the three conditions that thesearrangements must meet. Phrases such as "substan-tially all trade," "not on the whole higher or morerestrictive," and "reasonable length of time" haveallowed much latitude for interpretation. This lati-tude has been exploited. The GATT has been notifiedof more than 70 preferential trading arrangements--some establishing very loose preferences as "interimagreements" with no date for completing a free tradearea---but GATT has never formally disapproved anyof them (OECD 1990, p. 18; Jackson 1989, p. 141).
Although preferential arrangements of the sortindicated in Table 1 are the subject of this article, itshould be noted that they are by no means the onlymode of discrimination in international trade. Onevariant close to the types listed in the table is thegranting of preferences to imports from less devel-oped countries under schemes such as the General-ized System of Preferences (GSP), which was sanc-tioned by a waiver of the GATT most-favored-nationprinciple from 1971 to 1981 and thereafter by aninternational agreement (Jackson 1989, p. 141; Carl1986, pp. 7-8). Another prominent form of discrimi-nation is the widespread use of so-called "voluntary"export restraints, under which a country agrees un-der pressure to limit its exports of a certain good to aparticular importing country or countries. The re-straints imposed by Japan over its automobile exportsto the United States are a well-known example. Otherforms of significant discrimination could be adduced.All in all, more than one-fourth of world trade fails toobserve the MFN principle, according to one recentestimate (Kostecke 1987, pp. 425 ft.).
Does It Matter?Few words arouse more revulsion than "discrim-
ination." But is discrimination in international trade aharmful practice? And if so, why is it so prevalent?
Perhaps the strongest case ever made againstdiscrimination in international trade is Jacob Viner’sclassic work, The Customs Union Issue (1950), in whichViner focused on the effect of customs unions. Hisconclusion was that, "with respect to most customs
6 May/June 1992 New England Economic Revi~v
union projects the protectionist is right and the freetrader is wrong in regarding the project as some-thing, given his premises, which he can logicallysupport" (p. 41). Viner based this conclusion on thebelief that formation of a preferential trading areasuch as a customs union would usually shift pur-chases of traded goods primarily from lower to highermoney cost sources (excluding tariffs), rather thanfrom higher to lower cost sources.
In briefest outline, the underlying reasoning is asfollows. Once the customs union has been com-pleted, members will import from one another some
Viner believed that the formationof a preferential trading area
would usually shift purchases oftraded goods primarily from lower
to higher money cost sources(excluding tariffs).
commodities that previously they did not import atall because of their tariffs (now eliminated on tradeamong the members). This "trade creation" is effi-cient and desirable, as it entails a shift from a highercost (domestic) source to a lower cost (foreign)source. But because the union maintains a tariffbarrier against imports from nonmembers, the mem-bers will also now import from one another somecommodities that previously they had imported fromnonmembers who had supplied the items at thelowest cost including the tariffs then levied (at ratesthat were the same for both members and nonmem-bers). This "trade diversion" from a lower cost (non-member) source to a higher cost (member) source isinefficient and undesirable. It was Viner’s opinionthat in the construction of the typical customs unionhigh priority would be given to protecting domesticindustries, so that trade diversion would outweightrade creation. He believed this undesirable outcomewould be even more likely in the case of preferentialtrading arrangements short of full customs union, onthe grounds that the participants would select pref-erences that were predominantly protective of theirown industries.
To this case against preferential trading arrange-ments, Viner recognized one significant qualification.
Within the enlarged protected market formed by suchan arrangement, the expansion of output in variousindustries might be accompanied by economies ofscale, with lower costs per unit of output, and thisgain in efficiency might offset the losses stemmingfrom net trade diversion. This beneficial outcome heconsidered unlikely, arguing that in most industriesplants can attain their most efficient scale even if theindustry is not large.
Viner also appreciated that by adopting a com-mon tariff against imports from nonmembers, and bynegotiating as a unit on trade issues with the rest ofthe world, the countries forming a customs unioncould exercise greater economic leverage than if theyacted individually. Thus, the union might find itpossible to improve the terms on which it traded withother countries. Any such gain for the union would,of course, represent a loss for the rest of the world.
While a number of significant refinements havebeen made in Viner’s analysis, the concepts of tradecreation, trade diversion, and economies of scalehave remained central to empirical studies of prefer-ential trading arrangements.1 Empirical studies arevery important, because both Viner’s and subsequenttheorizing have made one thing clear, namely, it isnot possible to say a priori that customs unions--or,more generally, preferential trading arrangements--will inevitably either enhance or diminish worldefficiency or world welfare. Each case must be exam-ined carefully on its own merits. This is not to arguethat preferential trading arrangements may be moreefficient than perfectly free trade among all countries.But given that trade is less than free, the formation ofa preferential area may or may not represent animprovement.
Thus, it is not only the GATT, but economictheory as well, that is somewhat ambiguous on theissue of preferential trading areas. It would be wrongto conclude from this shared ambiguity that GATTwas based on the theorizing outlined in this section,as that theory blossomed only after GATT wasfounded. In the drafting of the GATT, economictheory probably was less influential than the harshlessons of the years between the world wars, a periodthat witnessed a proliferation of bilateral and otherdiscriminatory arrangements inimical to world tradeand responsible for worsening both the Great De-pression and international relations. In terms of sub-
1For developments in theory following Viner’s work, seeGunter (1989); Wonnacott and Lutz (1989); Kowalczyk (1990); andthe references cited in these works.
May/June 1992 New England Economic Review 7
sequent economic theorizing, the three conditionsrequired of preferential trading areas under GATTArticle XXIV can be viewed as tending to restrain thetrade-diverting aspects of such schemes while en-couraging their trade-creating aspects. Of course, aswith any agreement, the GATT is no better than itsinterpretation and enforcement.
Empirical AnalysesSince empirical analysis is crucial to evaluation of
a preferential trading area, what has been revealed bysuch studies? Are they helpful in resolving the ambi-guity of theory?
In recent years surprisingly little of the empiricalresearch on preferential trading areas has providedestimates of trade creation and diversion. What is notsurprising is that such estimates have been chiefly forthe European Community (EC), the major customsunion to develop after World War II. These ECestimates generally agree that for manufacturedproducts trade creation exceeded trade diversion. Onthe other hand, EC policy toward agriculture hasbeen highly protectionist and has likely generatedsubstantial trade diversion. Thus, one recent surveyconcludes, "it is not obvious from . . . the empiricalstudies whether the volume of trade created out-weighed that of trade diverted, whether there wasany external trade creation by which non-membersbenefited from the increased EC market size, orwhether the customs union among the original ECmembers improved global allocative efficiency"(Pomfret 1988, p. 131, emphasis added).
Similar conclusions are drawn regarding re-search into two other effects noted by Viner, namely,effects on economies of scale and terms of trade: "theavailable evidence shows that increased scale econo-mies have been realized in some EC sectors since theestablishment of the customs union, but gives littleindication of a causal relationship or of the magnitudeof any allocative efficiency gains .... Finally, al-though it is widely agreed that the EC customs unionhas involved terms of trade effects, there are fewestimates of their magnitude .... In sum, the ECcustoms union seems to have involved small (andperhaps even negative) static welfare gains, possiblebut unproven dynamic benefits, and a welfare trans-fer from non-members" (Pomfret 1988, pp. 133-135).
Thus, empirical analysis has done little to resolvethe ambiguity of theory on the question of whetherpreferential trading areas such as the EC serve to
enhance or diminish global efficiency and welfare. Ifin fact the benefits are so dubious, why are sucharrangements so widespread? Before tackling thispuzzle, we should note that by no means have allpreferential trading arrangements turned out to beviable. Indeed, even some of those identified in Table1 are, at this writing, more nearly nominal thanfunctional. Because of this mixed record, much atten-tion has been given to the question of what promotesthe viability or demise of preferential arrangements,especially customs unions and free trading areas. Areview of the conclusions is not only interesting in itsown right but also sheds some light on the puzzle ofwhy so many of these arrangements are launched.
This research on the viability of customs unionsand free trade areas has yielded somewhat moredefinitive results than has research on trade creationand diversion and on welfare effects. The arrange-ments that endure and that seem to foster tradeamong the participants often display the followingcharacteristics:2
(1) the member countries have relatively sim-ilar levels of per capita GNP and relatively similareconomic structures;
(2) the member countries have compatiblelaws and policies governing international tradeflows and adopt an across-the-board rather thanproduct-by-product approach toward liberalizingtrade among themselves;
(3) the member countries are not located vastdistances apart.
It is one thing to observe these characteristicsand another to explain why they seem to promote thesuccess of a preferential arrangement. Presumably,similar levels of per capita GNP reduce the likelihoodof disagreements over trade flow adjustments thatgenerate unemployment or, more generally, thatredistribute income. Firms in poorer countries fearthe superior technology, managerial skills, and capi-talization of firms in richer countries while workers inthe richer countries fear the competition of lower-paid laborers in the poorer countries. These fears,and the disputes they provoke, may be less intenseamong countries with similar levels of development.It also happens that such countries commonly trademore heavily with each other, even in the absence ofpreferential understandings, than do countries ofwidely differing economic structure and per capitaincome.
2 See Schott (1991, pp. 2-3); Wonnacott and Lutz (1989, pp.74-83); Thoumi (1989); and Carl (1986, pp. 13-34).
8 May/June 1992 New England Economic Review

In the realm of government policy, two pointsseem especially relevant. First, conflicting nationallaws and policies toward international commerceobviously inhibit its development. Second, barriers totrade between the members of a preferential arrange-ment are generally reduced more expeditiously if thesuccessive reductions are applied to virtually all bar-riers, across the board, rather than if reductions ofvarying degrees are negotiated for different products.Successful opposition by affected interest groups ismore likely to arise against reductions proposedproduct by product than those undertaken across theboard.
With respect to the last of the characteristicscommon to successful preferential arrangements, thelesser is the distance between countries, the lower arethe costs of transportation and communication thatencumber their trade, other things equal. Other thingsare not always equal, of course, and geographic prox-imity is no guarantee of success. But customs unions orfree trade areas are seldom, if ever, even attemptedamong nations that are poles apart.
The characteristics that make for success areclearly present in the case of the largest and longest-lived of the customs unions, the European Commu-nity (EC). Near the other extreme are the less suc-cessful Latin American Integration Association(LAIA)--and especially its predecessor, the LatinAmerican Free Trade Area (LAFTA)--and the Eco-nomic Community of West African States (ECO-WAS). Progress within ECOWAS has been impededby the participation of its members in other preferen-tial trading arrangements that impose obligationsincompatible with those assumed under ECOWAS.The resulting inconsistency of the members’ commer-cial policies has contributed to virtual paralysis in themutual reduction of trade barriers (Agyemang 1990,esp. pp. 67 and 79). In the case of LAFTA, theproduct-by-product negotiating approach posed aformidable obstacle. The same approach has slowedthe reduction of trade barriers within the Associationof Southeast Asian Nations (ASEAN).3 More gener-ally, progress within a number of integrationschemes launched by less developed countries, suchas LAFTA, has been slowed by disagreements overhow the perceived gains and losses might be distrib-uted, and over compensation to be provided bycountries that gain to poorer, losing countries.4 Thesedisagreements, of course, illustrate the likelihood offriction where per capita incomes and economicstructures differ very much among the member coun-tries.
Overall, preferential trading arrangements havea mixed record, with few approaching their an-nounced goals; and even for the more successfularrangements it is hard to prove demonstrable bene-fits for the world at large or even for the members.Such being the case, why are these arrangements socommon? A definitive answer is elusive, but themotivations behind many arrangements are fairlyreadily discerned.
Why So Many Preferential TradingArrangements?
A Vinerian answer to this question might runalong the following lines. Trade-diverting preferen-tial arrangements are promoted by the producerswho benefit, while the consumers who are injuredoffer little opposition. The explanation for this activ-ism on the part of producers and passivity on the partof consumers is that the gains from diversion reapedby protected industries are concentrated enough toinspire them to lobby for preferential arrangements,while the injury done to consumers is spread too
Motives besides protectionism--some economic, others more
nearly political--lie behind theformation of preferential trading
arrangements.
thinly among them to provoke their strong protesta-tions.
This rather traditional explanation of protection-ist successes no doubt has some validity, but it is onlypart of the story. Other motives besides vulgar self-interested protectionism are also at work. Some areeconomic in nature, others more nearly political. Apolitical motivation played an important role in theformation of the EC. It was hoped that economicintegration would strengthen political ties among theWest European countries and reduce the likelihood of
3 See Carl (1986, pp. 15-17); Wonnacut and Lutz (1989, pp.74-77); and Balasubramanyam (1989, pp. 173-74).
4 See Carl (1986, pp. 16, 21-22, 28); Wonnacut and Lutz (1989,pp. 8243); and Pomfret (1988, pp. 145M7).
s See, for example, MacBean and Snowden (1981, pp. 145-46).
May/June 1992 New England Economic Review 9
conflicts among them, such as had led to World WarII, while also providing a democratic bulwark againstthe Soviet communist bloc.5 The prospective expan-sion of the EC to include some of the recentlyliberated countries of Central and Eastern Europe issimilarly justified on the grounds that their inclusionwill enhance the stability of theLr struggling newmarket economies and democratic institutions.
Another motivation at least partly political innature is frustration with the slow advance of tradeliberalization under GATT-sponsored negotiations. Ahighly influential example of this glacial pace is thecurrent Uruguay Round--negotiations that werelaunched by more than 70 nations in September 1986and that, at this writing, have yet to produce anoverall agreement. One reason for this lack of prog-ress is that trade negotiations these days are tacklingmore complex issues, such as intellectual propertyrights, dispute settlement techniques, nontariff barri-ers, and trade in services. Not surprisingly, agree-ments on matters of this nature are more readilyreached among relatively few countries whose rele-vant policies are already fairly similar, a fact thatinclines countries to strike a (preferential) bargainwith just a few other countries rather than endure thelengthy and dubious multilateral GATT negotiations.
Still another reason that some countries opt forpreferential rather than MFN agreements conductedthrough GATT is to avoid giving a "free ride," in theform of liberalizing or market-opening measures, tocountries that fail to reciprocate (Belous and Hartley1990, p. 13). For example, several countries mightagree to extend to each other’s banking firms theright to open branches within each other’s borders,but be reluctant to extend the same right to banksin another country that did not offer that right.
Among less developed countries an importantgoal of preferential trading arrangements may be toreduce dependence on industrial countries, espe-cially as a source of manufactured goods, by fosteringtrade and integration among the parties to the ar-rangement. A closely related goal may be to enhancethe bargaining power of the parties vis-a-vis theindustrial countries (Agyemang 1990, pp. 57-58).
Finally, countries may seek inclusion in prefer-ential trading arrangements not because they expectsignificant gains but to avoid losses from the tradediversion to which they would be exposed as outsid-ers. Even if a preferential arrangement creates moretrade than it diverts, the nonmembers experienceonly diversion--a reduction in their exports to themembers--unless, over the long run, the arrange-
ment serves to accelerate the economic growth (anddemand for imports) of the member countries. In thecase of a customs union, such as the EC, anotherpotential loss to be avoided through joining is the lessfavorable terms of international trade that the union,to its own advantage, may be able to impose upon theoutside world. For these and other reasons, countriesoften fear the consequences of being "left out" ofpreferential arrangements. And countries that are leftout may form their own arrangements, partly in"self-defense" and partly merely in imitation of otherarrangements; the power of example can be powerfulindeed.
Are Discriminatory Blocs Capturing andTransforming the World’s Trade?
Table 2 reports, in order of magnitude, thepercentage shares of world merchandise trade attrib-utable to preferential trading groups identified inTable 1. As indicated in the first row of data, coun-tries belonging to these arrangements account formore than 80 percent of all international trade. And,as noted at the bottom of Table 1 and elsewhere inthis article, these arrangements by no means exhaustthe catalog of preferential trading schemes in use.
The EC’s share of world trade is much largerthan that of any other trading group. Because the ECand EFTA have formed a free trade area for manu-factured goods, the Canada-United States Free TradeArea is an even more distant second than indicatedby the percentages reported. While some of thetrading groups account for inconsequential shares ofworld trade, the aggregate for all the groups is mostimpressive.
But are these trading groups turning into tradingblocs that promote trade among themselves at theexpense of trade with the rest of the world? The merefinding that members of a group trade more inten-sively with each other than with other countrieswould not establish that the group had "turnedinward." For one thing, the members are often closergeographically to one another than to nonmembercountries and would be expected to trade moreintensively, other things equal, if only because oflower transportation and communications costs.Moreover, if the members enjoy more rapid growthin production and overall trade than the rest of theworld, trade among them would ordinarily be ex-pected to grow more rapidly than their trade with therest of the world.
10 May/June 1992 New England Economic Review
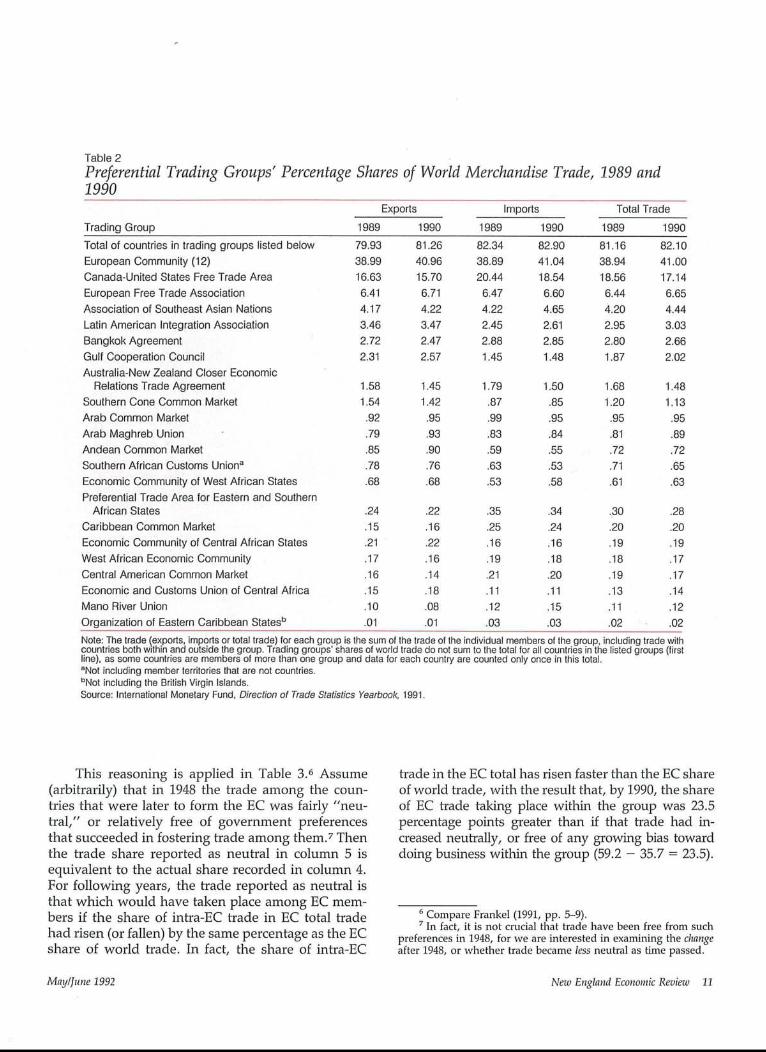
Table 2Preferential Trading Groups" Percentage Shares of World Merchandise Trade, 1989 and1990
Exports Imports
Trading Group 1989 1990 1989 1990Total of countries in trading groups listed below 79.93 81.26 82.34 82.90European Community (12) 38.99 40.96 38.89 41.04Canada-United States Free Trade Area 16.63 15.70 20.44 18.54European Free Trade Association 6.41 6.71 6.47 6.60Association of Southeast Asian Nations 4.17 4.22 4.22 4.65Latin American Integration Association 3.46 3.47 2.45 2.61Bangkok Agreement 2.72 2.47 2.88 2.85Gulf Cooperation Council 2.31 2.57 1.45 1.48Australia-New Zealand Closer Economic
Relations Trade Agreement 1.58 1.45 1.79 1,50 1.68 1.48Southern Cone Common Market 1.54 1.42 .87 .85 1.20 1.13Arab Common Market .92 .95 .99 .95 .95 .95Arab Maghreb Union .79 .93 .83 .84 .81 .89Andean Common Market .85 .90 .59 .55 .72 .72Southern African Customs Uniona .78 .76 .63 .53 .71 .65Economic Community of West African States .68 .68 .53 .58 .61 .63Preferential Trade Area for Eastern and Southern
African States .24 .22 .35 .34 .30 .28Caribbean Common Market .15 .16 .25 .24 .20 .20Economic Community of Central African States .21 .22 .16 .16 .19 .19West African Economic Community .17 .16 .19 .18 .18 .17Central American Common Market .16 .14 .21 .20 .19 .17Economic and Customs Union of Central Africa .15 .18 .11 .11 .13 .14Mano River Union .10 .08 .12 .15 .11 .12Organization of Eastern Caribbean Statesh .01 .01 .03 .03 .02 .02
Total Trade
1989 1990
81.16 82.1038.94 41.0018.56 17.146.44 6.654.20 4.442.95 3.032.80 2.661.87 2.02
Note: The trade (exports, imports or total trade) for each group is the sum of the trade of the individual members of the group, including trade withcountries both within and outside the group. Trading groups’ shares of world trade do not sum to the total for all countries in the listed groups (firstline), as some countries are members of more than one group and data for each country are counted only once in this total.~Not including member territories that are not countries.~Not including the British Virgin Islands.Source: International Monetary Fund, Direction of Trade Statistics Yearbook, 1991.
This reasoning is applied in Table 3.6 Assume(arbitrarily) that in 1948 the trade among the coun-tries that were later to form the EC was fairly "neu-tral," or relatively free of government preferencesthat succeeded in fostering trade among them.7 Thenthe trade share reported as neutral in column 5 isequivalent to the actual share recorded in column 4.For following years, the trade reported as neutral isthat which would have taken place among EC mem-bers if the share of intra-EC trade in EC total tradehad risen (or fallen) by the same percentage as the ECshare of world trade. In fact, the share of intra-EC
trade in the EC total has risen faster than the EC shareof world trade, with the result that, by 1990, the shareof EC trade taking place within the group was 23.5percentage points greater than if that trade had in-creased neutrally, or free of any growing bias towarddoing business within the group (59.2 - 35.7 = 23.5).
6 Compare Frankel (1991, pp. 5-9).7 In fact, it is not crucial that trade have been free from such
preferences in 1948, for we are interested in examining the changeafter 1948, or whether trade became less neutral as time passed.
May/June 1992 Nezo England Economic Review 11

Table 3European Communit~ (12) Trade with Selected Areas, 1948 to 1990
In Billions of U.S. Dollars As Percent of EC Total Trade
Trade with Actual Neutral Actual Trade EC Total TradeTotal Intra-EC the United Intra-EC Intra-EC with the as Percent ofTrade Trade States Trade Tradea United States World Trade
Year (1) (2) (3) (4) (5) (6) (7)1948 35.2 9.6 4.6 27.4 27.4 13.0 31.41949 37.5 11.5 4.4 30.6 31.6 11.8 36.31950 37.4 13.0 3.6 34.7 31.3 9.7 36.0
1951 50.8 16.4 5.3 32.3 29.8 10.4 34.31952 49.8 16.4 4.9 33.0 29.8 9.9 34.31953 49.8 17.4 4.2 35.0 30.4 8.5 34.91954 53.7 19.3 4.4 35.9 31.5 8.2 36.21955 61.2 22.4 5.8 36.7 30.1 9.5 34.6
1956 67.1 24.6 7.0 36.7 29.7 10.5 34.11957 73.4 26.6 8.1 36.2 29.9 11.1 34.41958 71.5 26.2 7.0 36.6 34.6 9.8 39.81959 76.9 29.6 8.0 38.4 34.8 10.4 40.01960 89.7 35.7 9.5 39.8 35.4 10.6 40.7
1961 95.8 40.5 9.6 42.3 35.9 10.0 41.21962 102.8 45.5 10.4 44.3 36.6 10.1 42.11963 113.5 52.1 11.2 45.9 37.0 9.9 42.51964 127.0 59.6 12.5 47.0 36.3 9.9 41.71965 139.4 66.4 13.9 47.6 36.6 10.0 42.11966 152.5 73.3 15.6 48,0 36.3 10.2 41.71967 158.7 76.7 16.0 48.3 35.7 10.1 41.11968 176.7 87.0 18.8 49.2 35.2 10.6 40.51969 208.4 106.8 20.3 51.2 36,5 9.7 41.91970 240.4 124.8 23.2 51.9 36.3 9.6 41.71971 272.1 144.3 24.7 53.0 37.1 9.1 42.71972 326.3 178.3 27.9 54.7 37.5 8.5 43.11973 451.8 247.5 36.9 54.8 37.3 8.2 42.91974 605.6 311.3 47.1 51.4 34.7 7.8 39.81975 634.3 326.1 45.7 51.4 35.0 7.2 40.21976 709.0 372.2 50.1 52.5 34.3 7.1 39.51977 809.3 424.8 56.2 52.5 34.3 6.9 39.41978 964.5 518.7 68.8 53.8 35.4 7.1 40.71979 1235.6 675.2 86.7 54.6 35.9 7.0 41.31980 1463.7 766.6 104.7 52.4 34.8 7.2 40.01981 1323.7 668.8 102.9 50.5 30.0 7.8 34.51982 1270.7 660.1 99.2 51.9 30.8 7.8 35.41983 1226.9 648.9 97.6 52.9 30.7 8.0 35.21984 1249.7 656.3 110.2 52.5 29.5 8.8 33.91985 1313.7 702.8 118.3 53.5 30.3 9.0 34.81986 1577.9 896.7 131.1 56.8 33.5 8.3 38.51987 1914.3 1114.0 149.6 58.2 34.6 7.8 39.81988 2147.4 1257.6 164.0 58.6 33.9 7.6 39.01989 2305.2 1346.5 176,9 58.4 33.7 7.7 38.71990 2784.0 1648.7 201.8 59.2 35.7 7.2 41.1Note: Trade is defined as the sum of repoded exports (fob) and imports (cif). The EC includes Belgium, Denmark, France, Germany (West), Greece,Ireland, Italy, Luxembourg, the Netherlands, Portugal, Spain, and the United Kingdom.aEC percent of world trade (col. 7) in current year multiplied by the ratio [(intra-EC trade as a percent of EC total trade (col. 4) in 1948)/(EC percentof world trade (col. 7) in 1948)].Source: International Monetary Fund, Direction of Trade Statistics through U.S. Department of Commerce, Compro data retrieval system.
12 May/June 1992 New England Economic Review

What is of interest in such data is not so muchthe position in any one year but the change that hasoccurred over the years, because what part of trade istruly neutral in any year is highly debatable. What isbeyond debate is that the members of the EC havecome to trade much more intensively with one an-other than would be expected from their trade withthe entire world, a fact that is reflected in the widen-ing gap between the shares reported for actual andneutral intra-EC trade. As the customs union wascompleted and its membership has expanded, thebias toward intra-group trade has grown. Thus, theEC has increasingly assumed at least this character-istic of a trading bloc.
Because the EC and EFTA now comprise a verysizable free trade area for manufactured products,that arrangement also merits special attention. As canbe seen in Table 4, EC-EFTA, like the EC, has becomemuch more inward-oriented in its trade. Three of theEFTA countries have applied for full membership inthe EC, and their inclusion seems highly likely.
Comparable data for the Canada-United StatesFree Trade Area in Table 5 lend only weak support tothe perception of a developing trade bloc. To be sure,the share of actual trade between the two nationsexceeded the neutral share by about 10 percentagepoints in 1990, but that differential has not risenappreciably in years and, indeed, was notably smallerin 1990 than in the early 1970s. Data that could beobtained on this differential for other preferentialtrading arrangements may be found in Table 6.
Whether a particular arrangement has tended tobecome a trading bloc is clearer in some cases than inothers. Our own assessment, based on Table 6 andpresented in Table 7, is that most of them haveshown this tendency in recent years. Those that haveaccount for about two-thirds of the world’s trade.
Not only the direction but the composition oftrade flows is influenced by preferential trading ar-rangements. At any time a nation will have devel-oped certain comparative, or relatively competitive,advantages and disadvantages in world markets thatwill be exhibited in the composition of its exports andimports if markets are relatively free and efficient.The nation’s "revealed comparative advantage" maybe measured by the ratio of the nation’s net exports(exports minus imports) in each commodity categoryto the sum of the nation’s total exports and imports inthat category (Balassa and Noland 1989, p. 175). Thisratio, or index, can take on any value between - 1 and+1; the larger the algebraic value for a commoditycategory relative to the values for other categories,
the greater is the country’s revealed comparativeadvantage in the commodity category concerned.Thus, one can measure how the revealed compara-tive advantage of a country or of a preferentialtrading arrangement has changed over the years.
This analytic technique is applied here to the ECand the EFTA. It is well known that the EC haspursued a highly protectionist policy for its agricul-ture, so it might be expected that the EC’s relativecompetitive position in agricultural commoditieswould have (artificially) improved over the years, as
The members of the EC have cometo trade much more intensivelywith one another than would be
expected from their trade with theentire world, thereby assuming at
least this characteristic of atrading bloc.
exports were promoted through subsidies and im-ports were impeded through the variable tariff levyand other devices. One might also wonder if apreferential trading area such as the EC would pro-vide inducements that boosted net exports of sophis-ticated manufactures in an effort to stimulate techno-logical advance within the member countries.
These hypotheses receive no support from thestatistics in Table 8. The rankings for the commoditygroups listed in this table are based on revealedcomparative advantage ratios computed for the two-year periods 1962-63 (the earliest for which the de-sired data were readily available) and 1988-89. To besure, the EC’s greatest revealed comparative advan-tage in 1988-89 was in beverages and tobacco, and thecomparative advantage of that category had improvedmarkedly since 1962-63. But the ranking, or relativecompetitiveness, of food and live animals deterio-rated over the same span of years, and the oppositewould have happened if the EC had actually suc-ceeded in strengthening its competitive position inthese agricultural items. Similarly, the EC’s revealedcomparative advantage weakened in machines andtransport equipment, the reverse of what would haveoccurred under policies successfully promoting thesesophisticated manufactures in world markets.
May/June 1992 New England Economic Review 13

Table 4European Community (12) and European Free Trade Association (EC-EFTA) Trade withSelected Areas, 1948 to 1990
In Billions of U.S. Dollars As Percent of EC-EFTA Total Trade Total EC-EFTAIntra- Trade with Actual Neutral Intra- Actual Trade Trade as
Total EC-EFTA the United Intra-EC-EFTA EC-EFTA with the Percent ofTrade Trade States Trade Tradea United States World Trade
Year (1) (2) (3) (4) (5) (6) (7)
1948 42.6 16.8 5.7 39.4 39.4 13.4 38.01949 44.5 18.7 5.3 42.1 44.6 11.9 43.11950 44.2 20.5 4.4 46.4 44.0 9.9 42.6
1951 60.9 27.9 6.3 45.8 42.6 10.4 41.2 ’1952 59.6 27.7 6.0 46.5 42.4 10.0 41.01953 58.9 28.1 5.1 47.7 42.7 8.7 41.31954 63.9 31.6 5.3 49.4 44.5 8.2 43.11955 72.7 36.6 6.8 50.3 42.4 9.4 41.0
1956 80.1 40.4 8.3 50.4 42.1 10.3 40.71957 85.5 42.4 9.3 49.6 41.4 10.9 40.01958 82.9 41.6 8.0 50.1 47.7 9.6 46.11959 89.1 46.0 9.1 51.7 48.0 10.2 46.41960 106.3 57.0 11.0 53.7 49.9 10.3 48.3
1961 113.7 64.2 11.0 56.4 50.6 9.6 49.01962 122.0 70.9 11.8 58.2 51.7 9.7 50.01963 134.2 79.5 12.8 59.2 52.0 9.5 50.21964 150.4 90.5 14.3 60.2 51.1 9.5 49.41965 165.0 100.2 15.8 60.7 51.6 9.6 49.9
1966 180.1 109.1 17.8 60.6 50.9 9.9 49.21967 187.6 113.7 18.1 60.6 50.2 9.7 48.51968 207.8 126.6 21.2 60.9 49.3 10.2 47.61969 244.5 153.6 22.9 62.8 50.9 9.4 49.21970 283.5 180.5 26.1 63.7 50.9 9.2 49.2
1971 318.9 205.2 27.8 64.3 51.8 8.7 50.11972 381.6 251.2 31.5 65.8 52.2 8.2 50.41973 527.6 348.0 41.5 66.0 51.8 7.9 50.11974 708.1 440.2 53.1 62.2 48.2 7.5 46.61975 743.4 460.5 51.9 61.9 48.7 7.0 47.1
1976 829.6 519.8 56.7 62.7 47.8 6.8 46.21977 945.8 592.6 63.8 62.7 47.7 6.8 46.11978 1122.1 715.8 78.3 63.8 49.0 7.0 47.31979 1434.6 926.5 98.3 64.6 49.6 6.9 47.91980 1703.2 1071.2 118.3 62.9 48.1 6.9 46.5
1981 1539.7 935.9 116.7 60.8 41.5 7.6 40.11982 1476.0 915.2 112.2 62.0 42.6 7.6 41.21983 1428.5 903.7 111.6 63.3 42.5 7.8 41.01984 1456.5 918.0 125.8 63.0 40.9 8.6 39.51985 1532.7 981.7 134.5 64.0 42.0 8.8 40.6
1986 1847.5 1253.1 149.7 67.8 46.6 8.1 45.11987 2242.2 1552.0 171.2 69.2 48.2 7.6 46.61988 2508.3 1737.5 187.9 69.3 47.1 7.5 45.51989 2686.4 1850.4 203.4 68.9 46.7 7.6 45.11990 3234.8 2255.0 232.1 69.7 49.4 7.2 47.7
Note: Trade is defined as the sum of reported exports (fob) and impods (cit). EFTA is here defined to include Austria, Finland, Iceland, Norway,Sweden, and Switzerland.aEC-EFTA percent of world trade (col. 7) in current year multiplied by the ratio [(intra-group trade as a percent of EC-EFTA total trade (col. 4) in1948)/(EC-EFTA percent of world trade (col. 7) in 1948)].Source: International Monetary Fund, Direction of Trade Statistics through U.S. Department of Commerce, Compro data retrieval system.
14 May/June 1992 Nero E~,gland Economic Review

Table 5Canada-United States Free Trade Area (Can-US) Trade with Selected Areas, 1948-90
In Billions of U.S, Dollars As Percent of Can-US Trade with World
Year194819491950
19511952195319541955
19561957195819591960
19611962196319641965
19661967 82.31968 95.41969 104.71970 116.7
1971 127.41972 149.51973 195.31974 276.01975 281.8
1976 325.71977 364.21978 419.31979 513.21980 612.6
1981 654.61982 600,81983 616.61984 732.91985 752.1
1986 785.71987 874.51988 1016.71989 1106.91990 1168.2Note:
Can-US TotalTrade as
Total Trade Can-US Actual Can-US Neutral Can-US Percent ofwith World Trade Trade Tradea World Trade
(1) (2) (3) (4) (5)26.4 7.3 27.8 27.8 23.625.2 7.3 28.9 28.8 24.425.7 8.2 31.7 29.2 24.8
36.6 11.7 32.1 29.1 24.735.5 11.3 31.9 28.8 24.536.3 12.0 33.0 30.0 25.534.5 11.3 32.8 27.4 23.237.1 12.8 34.5 24.7 20,9
43.9 14.9 34.0 26.3 22.346,4 14.9 32.1 25.6 21.743.4 13.9 32.0 28.4 24.146.4 15.2 32.8 28.5 24.248.8 14.5 29.8 26.1 22.2
49.0 14.9 30.3 24.9 21.151.8 16.0 30.8 25.0 21.255.1 16.6 30.2 24.3 20.662.2 18.9 30.5 24.1 20.467.6 21.7 32.2 24.1 20.4
78.5 26.4 33.6 25.3 21,529.8 36.2 25.1 21.335.4 37.1 25.8 21.940.5 38.7 24.8 21.141.7 35.7 23.9 20.2
47.8 37.5 23.6 20,056.6 37.9 23.3 19.869.2 35.4 21.9 18.589.2 32.3 21.4 18.291.0 32.3 21.0 17.9
106.7 32.8 21.4 18.1116.7 32.1 20.9 17.7129.6 30.9 20.8 17.7152.2 29.7 20.2 17.1163.8 26.7 19.7 16.7
182.6 27.9 20,1 17.1169.4 28.2 19.7 16.8193.3 31.3 20.9 17.7237.6 32.4 23.4 19.9244.4 32.5 23.5 19.9
242.4 30.9 22.6 19.2268.4 30.7 21.4 18.2310.6 30.5 21.8 18.5335.1 30.3 21.9 18.6354.9 30.4 20.3 17.2
Trade is defined as the sum of reported exports (fob) and imports (cif)."Can-US percent of world trade (col. 5) in current year multiplied by the ratio [(Can-US trade as a percent of Can-US total trade with world (col. 3)in 1948)/(Can-US percent of world trade (col. 5) in 1948)].Source: International Monetary Fund, Direction of Trade Statistics through U.S. Department of Commerce, Compro data retrieval system.
May/June 1992 New England Economic Revi~v 15

Table 6Excess of Actual over Neutral Intragroup Trade, as Percentage of Group Total Trade, forVarious Trading Groups
Trading Arrangement and Percentage Excess~’
Can.-U.S. EC (12)-CACM FTA EC (12) EFTA EFTA MERCOSUR ANCOM ASEAN LAIA GCC
0 0 0 0 0-.3 .1 -1.0 -2.5 -.6
-1.7 2.6 3.4 2.3 -.9
-1.0 3.0 2.4 3.2 -1.1-2.1 3.1 3.2 4.1 .1-2.3 3.0 4.6 5.0 -.2-2.2 5.5 4.4 4.9 -.2-2.0 9.8 6.6 7.9 .2
-1.8 7.7 7.0 8.3 -.1-1.6 6.5 6.3 8.2 1.9 0-1.4 3.5 2.0 2.4 1.4 .5
1.2 4.4 3.6 3.7 1.5 -1.51.9 3.7 4.4 3.7 .2 -1.7
3.4 5.4 6.4 5.8 .7 -3.83.6 5.8 7.7 6.5 .9 -2.16.0 5.9 8.9 7.3 1.4 -.89.4 6.4 10.7 9.1 2.1 3.2
10.8 8.1 11.0 9.1 2.7 5.2
14.2 8.4 11.8 9.7 3.4 3.516.8 11.1 12.6 10.4 4.5 3.420.2 11.3 14.0 11.7 4.7 4.220.1 13.8 14.8 11.9 5.5 4.020.7 11.9 15.6 12.8 6.3 3.6
Year ANZCERT1948 01949 01950 -.2
1951 -.51952 .31953 1.01954 1.41955 1.6
1956 2.51957 3.61958 3.91959 2.71960 2.6
1961 3.21962 3.31963 4.11964 3.61965 3.4
1966 3.71967 3.41968 3.51969 3.11970 4~1
1971 4.4 18.5 14.0 15.9 12.5 6.7 2.51972 4.9 18.4 14.6 17.2 13.7 6.9 1.4 0 0 01973 5.4 18.4 13.6 17.5 14.1 6.7 1.1 .7 -3.2 .81974 5.3 17.5 10.9 16.7 14.0 7.4 -.2 .3 -7.1 -.61975 4.7 16.6 11.3 16.5 13.2 7.4 -.4 1.2 -5.6 .4
1976 4.9 16.2 11.4 18.1 14.9 6.7 1.4 1.9 -5.5 2.11977 5.2 13.3 11.1 18.2 15.0 6.2 1.6 2.4 -6.2 3.21978 5.2 16.4 10.1 18.4 14.8 4.9 2.1 1.1 -6.5 1.91979 5.4 15.4 9.5 18.7 15.0 5.1 4.4 1.6 -6.3 2.5 01980 5.1 18.5 7.0 17.6 14.8 4.6 3.3 1.2 -9.0 .7 -1.1
1981 5.2 16.8 7.8 20.5 19.3 5.8 1.9 1.6 -9.4 .6 -.71982 4.9 16.4 8.4 21.1 19.4 5.7 2.3 2.3 -9.1 2.2 .11983 5.5 16.4 10.5 22.2 20.8 5.3 1.1 2.3 -9.3 1.2 .81984 5.9 14.0 9.0 23.0 22.1 5.5 2.1 1.8 -9.9 1.3 2.01985 5.4 11.0 9.0 23.2 22.0 5.3 1.8 1.9 -6.2 .7 3.4
1986 5.2 8.0 8.3 23.4 21.2 4.9 5.4 1.9 -4.6 4.3 4.61987 6.3 10.1 9.3 23.6 21.0 4.7 4.6 2.7 -5.4 4.1 4.51988 6.1 9.8 8.8 24.6 22.2 4.5 4.5 2.9 -8.7 3.8 4.81989 5.8 10.0 8.4 24.7 22.2 4.5 6.4 3.1 -11.6 4.7 5.31990 6.1 10.0 10.1 23.5 20.4 4.1 6.8 2.5 -13.2 3.6 4.9
aMinus sign indicates excess of neutral over actual intragroup trade.Note: As available, data are shown beginning with 1948. Lesotho and Swaziland are not included in PTA, nor is SACU included in this table,because of lack of data.Source: International Monetary Fund, Direction of Trade Statistics through U.S. Department of Commerce, Compro data retrieval system,
16 May/June 1992 New England Economic Review
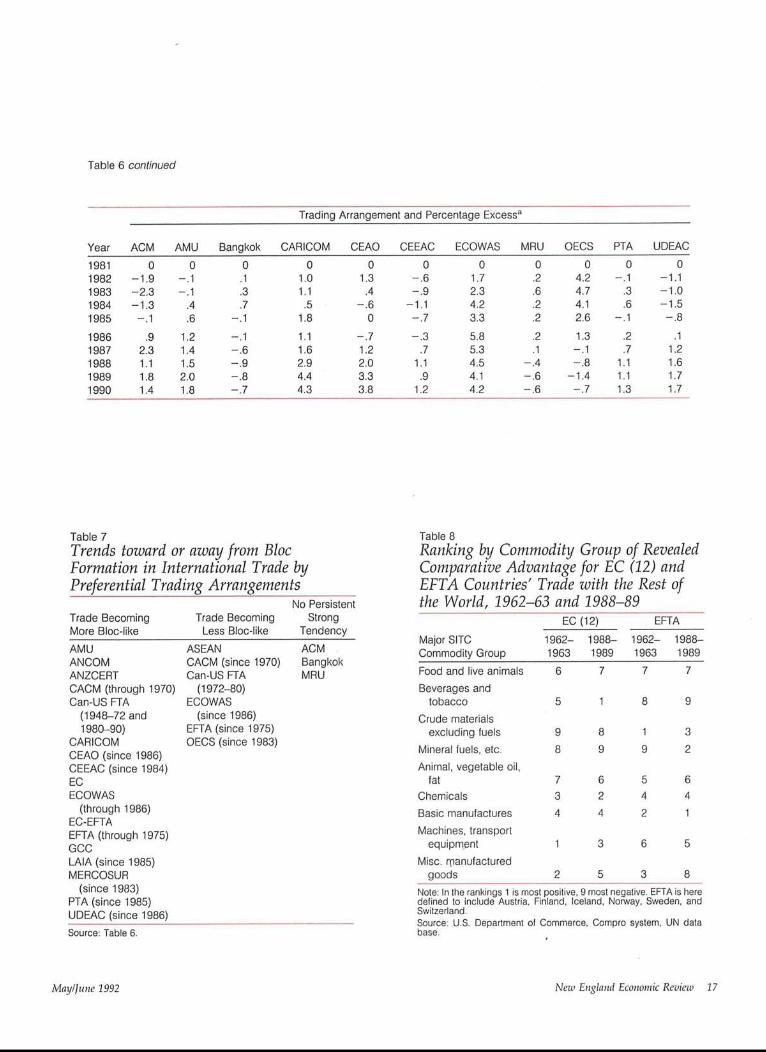
Table 6 continued
Year ACM AMU Bangkok
1981 0 0 01982 -1.9 -.1 .11983 -2.3 -.1 ,31984 -1,3 .4 .71985 -,1 .6 -.1
1986 .9 1,2 -.11987 2.3 1,4 -.61988 1.1 1.5 -.91989 1.8 2.0 -.81990 1.4 1.8 -.7
Trading Arrangement and Percentage Excess~
CARICOM CEAO CEEAC ECOWAS MRU OECS PTA UDEAC
0 0 0 0 0 0 0 01.0 1.3 -.6 1.7 .2 4.2 -.1 -1.11.1 .4 -.9 2.3 .6 4.7 .3 -1.0.5 -.6 -1.1 4.2 .2 4.1 .6 -1.5
1.8 0 -.7 3.3 .2 2.6 -.1 -.8
1.1 -.7 -,3 5.8 .2 1.3 .2 .11.6 1.2 .7 5.3 .1 -.1 .7 1.22.9 2.0 1.1 4.5 -.4 -.8 1.1 1.64.4 3.3 .9 4.1 -.6 -1.4 1.1 1.74.3 3.8 1.2 4.2 -.6 -.7 1.3 1.7
Table 7Trends toward or away from BlocFormation in International Trade byPreferential Trading Arrangements
No PersistentTrade BecomingMore Bloc-likeAMUANCOMANZCERTCACM (through 1970)Can-US FTA
(1948-72 and1980-90)
CARICOMCEAO (since 1986)CEEAC (since 1984)ECECOWAS
(through 1986)EC-EFTAEFTA (through 1975)GCCLAIA (since 1985)MERCOSUR
(since 1983)PTA (since 1985)UDEAC (since 1986)Source: Table 6.
Trade BecomingLess Bloc-like
ASEANCACM (since 1970)Can-US FTA
(1972-80)ECOWAS
(since 1986)EFTA (since 1975)OECS (since 1983)
StrongTendency
ACMBangkokMRU
Table 8Ranking by Commodity Group of RevealedComparative Advantage for EC (12) andEFTA Countries’ Trade with the Rest ofthe World, 1962-63 and 1988-89
EC (12) EFTA
Major SlTC 1962- 1988- 1962- 1988-Commodity Group 1963 1989 1963 1989
Food and live animals 6 7 7 7Beverages and
tobacco 5 1 8 9
Crude materialsexcluding fuels 9 8 1 3
Mineral fuels, etc. 8 9 9 2Animal, vegetable oil,
fat 7 6 5 6Chemicals 3 2 4 4
Basic manufactures 4 4 2 1Machines, transport
equipment 1 3 6 5
Misc. m. anufacturedgoods 2 5 3 8
Note: In lhe rankings 1 is most positive, 9 most negative. EFTA is heredefined to include Austria, Finland, Iceland, Norway, Sweden, andSwitzerland.Source: U.S. Department of Commerce, Compro system, UN database.
May/June 1992 New England Economic Review 17

This is not to say that EC policies to protectagriculture or to promote sophisticated manufactureswere without effect. Absent any policies of this na-ture, the deteriorations in rankings of food and liveanimals and of machines and transport equipmentcould have been even greater. What can be said hereis that deteriorations did take place in spite of anysuch policies.
EFTA is much less tightly organized than the EC,especially with respect to agriculture. While the sta-tistics in Table 8 would tend to support a hypothesisthat EFTA has promoted certain categories of manu-factures, further research beyond the scope of thisarticle would be required to confirm that hypothesis.
Where Do We Go from Here?In spite of Viner’s classic critique, it would be
hard to demonstrate that the preferential tradingarrangements now in operation have had a signifi-cantly deleterious impact on the world economy. Todemonstrate the opposite would be almost as diffi-cult, however (because of the complexity of thequestion and the data required), and much concernhas been voiced that the international economy istending to fracture into estranged, if not hostile,discriminatory trading blocs. The EC constitutes onebloc, and is expanding, perhaps eventually to encom-pass virtually all of Europe. Another bloc may beforming around the free trade area formed by Canadaand the United States, which are negotiating withMexico to establish a North American Free TradeArea--which, in turn, could be extended to all ofLatin America. Finally, some foresee the develop-ment of a third major bloc in East Asia centered aboutJapan, although countries in the region have shownno inclination for such an arrangement.
In any event, preferential liberalization of trade isclearly inferior to global liberalization. Although theglobal approach pursued under GATT may be com-plex and slow, any nation that undertakes to negoti-ate a series of preferential trade agreements~includ-ing a series of bilateral agreements eventuallyforming a free trade area--will find that this alternateapproach is far from swift and simple. Under thepreferential approach, each new agreement musttake into account bargains struck in prior agreements,and prior agreements may well have to be renegoti-ated to accommodate the interests of all parties. Andparadoxically, to negotiate liberalization across abroad range of trade may be more difficult for just a
few countries than for many, because when manyoffer sweeping reductions in barriers the odds may begreater that each party will perceive some consider-able gain. Partly for this reason, GATT negotiationsare much more likely than bilateral negotiations toyield liberalization of the most pernicious and intrac-table nontariff barriers, especially within highly sen-sitive areas such as agriculture and textiles and ap-parel.
But if global negotiations fail, blocs that genu-inely liberalized trade among themselves could im-prove the general welfare and set a good example. Inparticular, they should welcome new members, forthe best free trade area is worldwide in scope. In thisconnection, some encouragement should be takenfrom the recent collapse of the most discriminatorytrading bloc of them all--COMECON, the Council forMutual Economic Assistance, whose membershipwas drawn from the former Soviet communist bloc.
Conclusion
A multiplicity of preferential arrangements haspermeated the trading world. In recent years most ofthese arrangements, accounting for about two-thirdsof world trade, have increasingly resembled "tradingblocs," in that their trade has become oriented moreinward, among bloc members, and less outward,with the rest of the world. This outcome is hardlysurprising, since the essence of a preferential tradingarrangement is to discriminate in favor of the trade ofparticipants over that of nonparticipating countries.
Certain types of preferential arrangements aresanctioned by the international codes to which mostcountries subscribe. This law is rather vague and hasbeen loosely interpreted or applied, so that govern-ments have felt relatively free to discriminate ininternational trade without much risk of retaliationfrom the countries that are disadvantaged.
Like the law, the standard theory of internationaltrade is somewhat ambiguous regarding preferentialarrangements. To be sure, the theory asserts that freetrade is more efficient than discriminatory trade. Buttheory also acknowledges that in a world with lessthan free trade a discriminatory (or preferential) re-duction of trade barriers can enhance efficiency incertain circumstances. Unfortunately, because of thecomplexity of the issue, very little has been learnedabout the actual impact of preferential trading onworld efficiency and welfare, although a number ofempirical studies have been undertaken.
18 May/June 1992 New England Economic Review

Not all preferential trading arrangements haveendured. They seem more likely to flourish if themembers are fairly similar in their economic struc-tures, per capita incomes, and policies toward inter-national trade, if they are fairly close geographically,and if they adopt an across-the-board rather thanproduct-by-product approach toward liberalizingtrade among themselves.
That so many preferential arrangements havebeen launched may seem puzzling, in view of theirfrequent failure to attain their goals and their dubiousimpact on world efficiency and welfare. More thanone motivation has been at work. Producers whoexpect to gain greater protection may lobby for pref-erential arrangements, while the injured consumersmay offer little resistance. Also, frustration with theslow progress of global trade liberalization and with
the "free ride" taken by some countries that benefitbut contribute little has inspired growing interest inpreferential arrangements limited to "kindred souls,"all of whom contribute. Or nations may join sucharrangements to enhance their bargaining powervis-i~-vis the rest of the world or to avoid being "leftout" and becoming victims of increased discrimina-tion. Sometimes the motivation is partly to form amore stable political area, as was the case for the E.C.
Over the long run, nondiscriminatory reductionsin trade barriers are clearly preferable to discrimina-tory reductions. But should global negotiations fail,blocs that truly liberalized trade among themselvescould improve the general welfare. To set the bestexample for the rest of the trading world, they shouldbe receptive to new members, for the ideal free tradearea is worldwide in scope.
ReferencesAgyemang, Augustus Asante. 1990. "Trade Liberalization Under
the Treaty of the Economic Community of West African States(ECOWAS): Some Preliminary Highlights of Legal and EconomicProblems." Journal of World Trade, vol. 24, no. 6 (December), pp.57-79¯
Balassa, Bela, and Marcus Noland. 1989. "The Changing Compar-ative Advantage of Japan and the United States." Journal of theJapanese and h,ternational Economies, vol. 3 (June), pp. 174-88.
Balasubramanyam, V.N. 1989. "ASEAN and Regional Trade Coop-eration in Southeast Asia." In Greenaway, Hyclak, and Thorn-ton, eds., Economic Aspects of Regional Trading Arrm,gements, pp.167~7. New York: New York University Press¯
Belous, Richard S. and Rebecca S. Hartley. 1990¯ "Regional Trad-ing Blocs: An Introduction." In Belous and Hartley, eds., TheGrowth of Regional Trading Blocs in the Global Economy, pp. 1-21.Washington, D.C.: National Planning Association.
Bruce, James. 1991. "Latin Nations in Mercosul Bloc to Begin DutyCuts Nov. 29." The Journal of Commerce, November 4, p. 5A.
Carl, Beverly May. 1986. Economic Integration Among DevelopingNations: Law and Policy. Praeger Special Studies, Praeger Scien-tific. New York: Praeger Publishers.
EI-Kuwaiz, Abdullah Ibrahim. 1987. "Economic integration of theCooperation Council of the Arab States of the Gulf: Challenges,Achievements and Future Outlook." In J. Sandwizk, ed. The GulfCooperation Council, pp. 71~3. London: Westview Press for theAmerican-Arab Affairs Council.
Frankel, Jeffrey A. 1991. "Is a Yen Bloc Forming in Pacific Asia?" inRichard O’Brien, ed., Finance and the International Economy: 5, TheAMEX Bank Review Prize Essays in Memory of Robert Marjolin,pp. 5-20. New York: Oxford University Press.
General Agreement on Tariffs and Trade. 1969. Basic Instrumentsand Selected Documents, vol. IV, March. Geneva: The ContractingParties to the General Agreement on Tariffs and Trade.
¯ "GATT: What It Is, What It Does." 1980. GAiT Informa-tion Service.
¯1992. International Trade 1990-91. Geneva: GATF.Guma, X.P. 1990. "The Revised Southern African Customs Union
Agreement: An Appraisal." The South African Journal of Econom-ics, vol. 58, no. 1, pp. 63-77.
Gunter, Frank R. 1989. "Customs Union Theory: Retrospect andProspect¯" In Greenaway, Hyclak, and Thornton, eds., EconomicAspects of Regional Trading Arrangements, pp. 1-30. New York:New York University Press¯
International Monetary Fund, General Economy Division of theBureau of Statistics. 1991. Direction of Trade Statistics Yearbook,1991. Washington, D.C.: International Monetary Fund.
Jackson, John H. 1989. The World Trading System: Law m,d Policy ofInternational Economic Relations. Cambridge, Massachusetts: TheMIT Press.
Jennings, Thomas¯ 1991. "United States-Canada Free-Trade Agree-ment: After 2 Years, How Does It Shape Up?" InternationalEconomic Review, United States International Trade Commission,April, pp. 7-9.
Kostecke, M.M. 1987. "Export-restraint Arrangements and TradeLiberalization." World Economy, vol. 10, no. 4, pp. 425-53.
Kowalczyk, Corsten. 1990. "Welfare and Customs Unions." Na-tional Bureau of Economic Research. Working Paper no. 3476,October. Cambridge, MA: NBER.
Krugman, Paul. 1991. "The Move Toward Free Trade Zones."Economic Review, Federal Reserve Bank of Kansas City, Novem-ber/December, pp. 5-25.
Lewis, Paul. 1984. "Western Europe Ends Industrial Trade Curbs. °’The New York Times, January 2, p. 39.
MacBean, A.I. and P.N. Snowden. 1981. International lnstitututionsin Trade and Finance. London: George Allen & Unwin Ltd.
Manifold, Diane. 1992. "Regional Organizations in SoutheastAsia." International Economic Review, United States internationalTrade Commission, April, pp. 12-17.
Moore, Paul. 1992. "Approval of Andean Trade Preference ActWill Create Opportunities for U.S. Business." Business America,January 13, p. 15.
Organisation for Economic Cooperation and Development, TradeCommittee¯ 1990."Recent Developments in Regional TradingArrangements among OECD Countries: Main Implications forThird Countries and for the Multilateral Trading System." Noteby the Secretariat, December 21, 1990. Paris: OECD.
MaylJune 1992 New England Economic Review 19

Pomfret, Richard. 1988. Unequal Trade: The Economics of Discrimina-tory International Trade Policies. New York: Basil Blackwell, Inc.
Pura, Raphael. 1992. "ASEAN Leaders See Need to Create UnifiedMarket to Avoid Loss of Trade." The Wall Street Journal, January28, p. A10.
Schott, Jeffrey J. 1991. "Trading Blocs and the World TradingSystem." The World Economy, vol. 14, no. 1 (March), pp. 1-17.
Stamps, James. 1991a. "Laying the Groundwork for Free Trade inthe Western Hemisphere: An Update." International EconomicReview, United States International Trade Commission, October,pp. 9-11.
. 1991b. "Liberalizing Trade in Latin America and theCaribbean: An Update." International Economic Review, UnitedStates International Trade Commission, April, pp. 6-7.
Thoumi, Francisco E. 1989. "Bilateral Trade Flows and EconomicIntegration in Latin America and the Caribbean." World Devel-opment, vol. 17, no. 3, pp. 421-29.
Thurston, Charles W. 1991. "Another Trade Zone Formed asChile, Mexico Implement Pact." The Journal of Commerce, Decem-ber 31, pp. 1A-2A.
Union of International Associations. 1991. Yearbook of InternationalOrganizations 1991-1992.28th ed., vols. 1 & 3. Brussels: Union ofInternational Associations.
United Nations, Department of International Economic and SocialAffairs. 1990. World Economic Survey 1990: Current Trends andPolicies in the World Economy. New York: United Nations.
--. 1991. World Economic Survey 1991: Current Trends and Policiesin the World Economy. New York: United Nations.
U.S. Department of State, Bureau of Public Affairs, Office of theHistorian. 1990. "European Community Integration, 1951-1990." April.
U.S. Department of State. 1991. "Fact Sheet: Association of SouthEast Asian Nations (ASEAN).°’ Dispatch, August 5, p. 564.
Viner, Jacob. 1950. The Customs Union Issue. New York: CarnegieEndowment for International Peace. Reprint, Washington, D.C.:Anderson Kramer Associates, 1961.
Wonnacott, Paul, and Lutz, Mark. 1989. "Is There a Case for FreeTrade Areas?" In Jeffrey J. Schott, ed., Free Trade Areas and U.S.Trade Policy, pp. 59-95. Washington, D.C.: Institute for Interna-tional Economics.
Appendix: Sources for Table 1
Agyemang, Augustus Asante. 1990. "Trade Liberalization Underthe Treaty of the Economic Community of West African States(ECOWAS): Some Preliminary Highlights of Legal and EconomicProblems." Journal of World Trade, vol. 24, no. 6 (December), pp.57-79.
Balasubramanyam, V.N. 1989. "ASEAN" and Regional TradeCooperation in Southeast Asia." In Greenaway, Hyclak, andThornton, eds., Economic Aspects of Regional Trading Arrange-ments, pp. 169-70. New York: New York University Press.
Bruce, James. 1991. "Latin Nations in Mercosul Bloc to Begin DutyCuts Nov. 29." The Journal of Commerce, November 4, p. 5A.
EI-Kuwaiz, Abdu|lah Ibrahim. 1987. "Economic Integration of theCooperation Council of the Arab States of the Gulf: Challenges,Achievements and Future Outlook." In J. Sandwizk, ed., TheGulf Cooperation Council, pp. 71-83. London: Westview Press forthe American-Arab Affairs Council.
Guma, X.P. 1990. "The Revised Southern African Customs UnionAgreement: An Appraisal." The South African Journal of Econom-ics, vol. 58, no. I, pp. 63-77.
Jennings, Thomas. 1991. "United States-Canada Free-Trade Agree-ment: After 2 Years, How Does It Shape Up?" InternationalEconomic Review. United States International Trade Commission,April pp. 7-9.
Lewis, Paul. 1984. "Western Europe Ends Industrial Trade Curbs."The New York Times, January 2, p. 39.
MacBean, A. I. and P. N. Snowden. 1981. International Institutionsin Trade and Finance. London: George Allen and Unwin Ltd, pp.167-68.
Manifold, Diane. 1992. "Regional Organizations in SoutheastAsia." International Economic Review, United States InternationalTrade Commission, April, p. 13.
Moore, Paul. 1992. "Approval of Andean Trade Preference ActWill Create Opportunities for U.S. Business." Business America,January 13, p. 15.
Organisation for Economic Cooperation and Development, TradeCommittee. 1990. "Recent Developments in Regional TradingArrangements among OECD Countries: Main Implications forThird Countries and for the Multilateral Trading System." Noteby the Secretariat December 21, 1990, p. 19.
Pomfret, Richard. 1988. Unequal Trade: The Economics of Discrimina-tory International Trade Policies. New York: Basil Blackwell Inc.,pp. 84-89.
Pura, Raphael. 1992. "ASEAN Leaders See Need to Create UnifiedMarket to Avoid Loss of Trade." The Wall Street Journal, January28, p. A10.
Stamps, James. 1991. "Laying the Groundwork for Free Trade inthe Western Hemisphere: An Update." International EconomicReview, United States International Trade Commission. October,pp. 9-11.
---. 1991. "Liberalizing Trade in Latin America and the Carib-bean: An Update." International Economic Review, United StatesInternational Trade Commission. April, pp. 6-7.
Thurston, Charles W. 1991. "Another Trade Zone Formed asChile, Mexico Implement Pact." The Journal of Commerce, Decem-ber 31, p. 1A-2A.
Union of International Associations. 1991. Yearbook of InternationalOrganizations 1991-1992.28th ed., vols. 1 & 3. Brussels: Union ofInternational Associations.
United Nations, Department of International Economic and SocialAffairs. 1990. World Economic Survey 1990. Current Trends andPolicies in the World Economy. New York: United Nations, pp.67-68, 70.
U.S. Department of State, Bureau of Public Affairs, Office of theHistorian. 1990. "European Community Integration, 1951-1990." April.
U.S. Department of State. 1991. "Fact Sheet: Association of SouthEast Asian Nations (ASEAN)." Dispatch, August 5, 1991, p. 564.
20 May/June 1992 New England Economic Review