preference of sensory neural coding for 1=f signals
TRANSCRIPT
PRL 94, 108103 (2005) P H Y S I C A L R E V I E W L E T T E R S week ending18 MARCH 2005
Preference of Sensory Neural Coding for 1=f Signals
Yuguo Yu, Richard Romero, and Tai Sing LeeCenter for the Neural Basis of Cognition, and Computer Science Department, Carnegie Mellon University, 4400 Fifth Avenue,
Pittsburgh, Pennsylvania 15213, USA(Received 21 October 2004; published 18 March 2005)
0031-9007=
We investigated the influences of different types of temporal correlations in the input signal on thefunctions and coding properties of neurons in the primary visual cortex (V1). We found that the temporaltransfer functions of V1 neurons exhibit higher gain, and the spike responses exhibit higher codingefficiency and information transmission rates, for the 1=f (natural long-term correlation) signals than for1=f0 (no correlation) and 1=f2 (stronger long-term correlation) signals. These results suggest that theintermediate long-term correlation ubiquitous to natural signals may play an important role in shaping andoptimizing the machinery of neurons in their adaptation to the natural environment.
DOI: 10.1103/PhysRevLett.94.108103 PACS numbers: 87.80.Tq, 05.40.–a, 43.50.+y
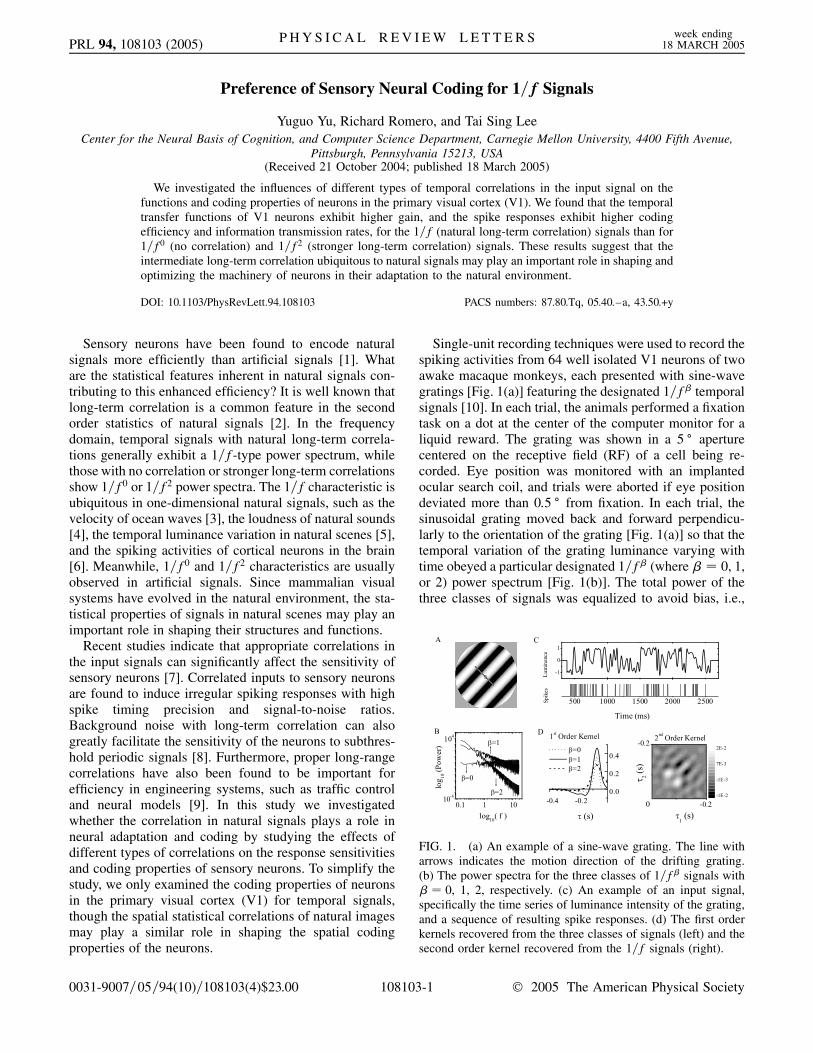
FIG. 1. (a) An example of a sine-wave grating. The line witharrows indicates the motion direction of the drifting grating.(b) The power spectra for the three classes of 1=f� signals with� � 0, 1, 2, respectively. (c) An example of an input signal,specifically the time series of luminance intensity of the grating,and a sequence of resulting spike responses. (d) The first orderkernels recovered from the three classes of signals (left) and thesecond order kernel recovered from the 1=f signals (right).
Sensory neurons have been found to encode naturalsignals more efficiently than artificial signals [1]. Whatare the statistical features inherent in natural signals con-tributing to this enhanced efficiency? It is well known thatlong-term correlation is a common feature in the secondorder statistics of natural signals [2]. In the frequencydomain, temporal signals with natural long-term correla-tions generally exhibit a 1=f-type power spectrum, whilethose with no correlation or stronger long-term correlationsshow 1=f0 or 1=f2 power spectra. The 1=f characteristic isubiquitous in one-dimensional natural signals, such as thevelocity of ocean waves [3], the loudness of natural sounds[4], the temporal luminance variation in natural scenes [5],and the spiking activities of cortical neurons in the brain[6]. Meanwhile, 1=f0 and 1=f2 characteristics are usuallyobserved in artificial signals. Since mammalian visualsystems have evolved in the natural environment, the sta-tistical properties of signals in natural scenes may play animportant role in shaping their structures and functions.
Recent studies indicate that appropriate correlations inthe input signals can significantly affect the sensitivity ofsensory neurons [7]. Correlated inputs to sensory neuronsare found to induce irregular spiking responses with highspike timing precision and signal-to-noise ratios.Background noise with long-term correlation can alsogreatly facilitate the sensitivity of the neurons to subthres-hold periodic signals [8]. Furthermore, proper long-rangecorrelations have also been found to be important forefficiency in engineering systems, such as traffic controland neural models [9]. In this study we investigatedwhether the correlation in natural signals plays a role inneural adaptation and coding by studying the effects ofdifferent types of correlations on the response sensitivitiesand coding properties of sensory neurons. To simplify thestudy, we only examined the coding properties of neuronsin the primary visual cortex (V1) for temporal signals,though the spatial statistical correlations of natural imagesmay play a similar role in shaping the spatial codingproperties of the neurons.
05=94(10)=108103(4)$23.00 10810
Single-unit recording techniques were used to record thespiking activities from 64 well isolated V1 neurons of twoawake macaque monkeys, each presented with sine-wavegratings [Fig. 1(a)] featuring the designated 1=f� temporalsignals [10]. In each trial, the animals performed a fixationtask on a dot at the center of the computer monitor for aliquid reward. The grating was shown in a 5 � aperturecentered on the receptive field (RF) of a cell being re-corded. Eye position was monitored with an implantedocular search coil, and trials were aborted if eye positiondeviated more than 0:5 � from fixation. In each trial, thesinusoidal grating moved back and forward perpendicu-larly to the orientation of the grating [Fig. 1(a)] so that thetemporal variation of the grating luminance varying withtime obeyed a particular designated 1=f� (where � � 0, 1,or 2) power spectrum [Fig. 1(b)]. The total power of thethree classes of signals was equalized to avoid bias, i.e.,
3-1 2005 The American Physical Society
PRL 94, 108103 (2005) P H Y S I C A L R E V I E W L E T T E R S week ending18 MARCH 2005
Rf2f1P�1=f
0�df�Rf2f1P�1=f
1�df�Rf2f1P�1=f
2�df, whereP�f� denotes the power spectrum of the signal, and f1(0.1 Hz) and f2 (in the range of 18–27 Hz) are the lowand high cutoff frequencies, respectively. A cutoff fre-quency is chosen so that all three classes of signals candrive the cells effectively with roughly the same meanfiring rate. The orientation and spatial frequency of thegrating were chosen according to the optimal spatial tuningof the recorded neuron. For each neuron, we presentedthree classes of 1=f� signals with � � 0, 1, and 2, respec-tively. For each class of signals, 300 trials of randomstimulus sequences and 60 repeated trials of a particularstimulus sequence were presented, with each trial lastingfor 2.2 sec. Figure 1(c) gives an example of an inputstimulus trial and a spike train of a neuron.
We first studied the effects of different types of temporalcorrelation in the signals on the performance functions ofV1 neurons. Using 300 trials of random stimulus sequencesand the output spike trains of each neuron, we recoveredthe temporal transfer function of the neuron in terms of thefirst (linear) and second order (quadratic nonlinear)Volterra kernels [11] [see Fig. 1(d) for an example], whichcapture the main property of the neuron and can be used topredict the neural response to any input signal used in thisstudy. The first order kernel recovered from the 1=f type ofsignal has the highest amplitude gain compared to thekernels recovered from the other two types of signals.The peaks around �80 ms indicate that the neuron ispreferentially sensitive to stimulus components occurringat around 80 ms prior to the spike. The second order kernel[see an example in Fig. 1(d)] depicts the finely correlatedstructures in the stimulus that induce a spike response.These observations suggest that these V1 neurons aresensitive to both the timing of the input signal and thetemporal correlations among the different stimulus com-ponents in the signal.
1000 20001000 20001000 20000.0
0.2
R esponse
Time (ms) Time (ms)
Tria
l
PSTH
Signal
Time (ms)
C β = 2B β = 1A β = 0
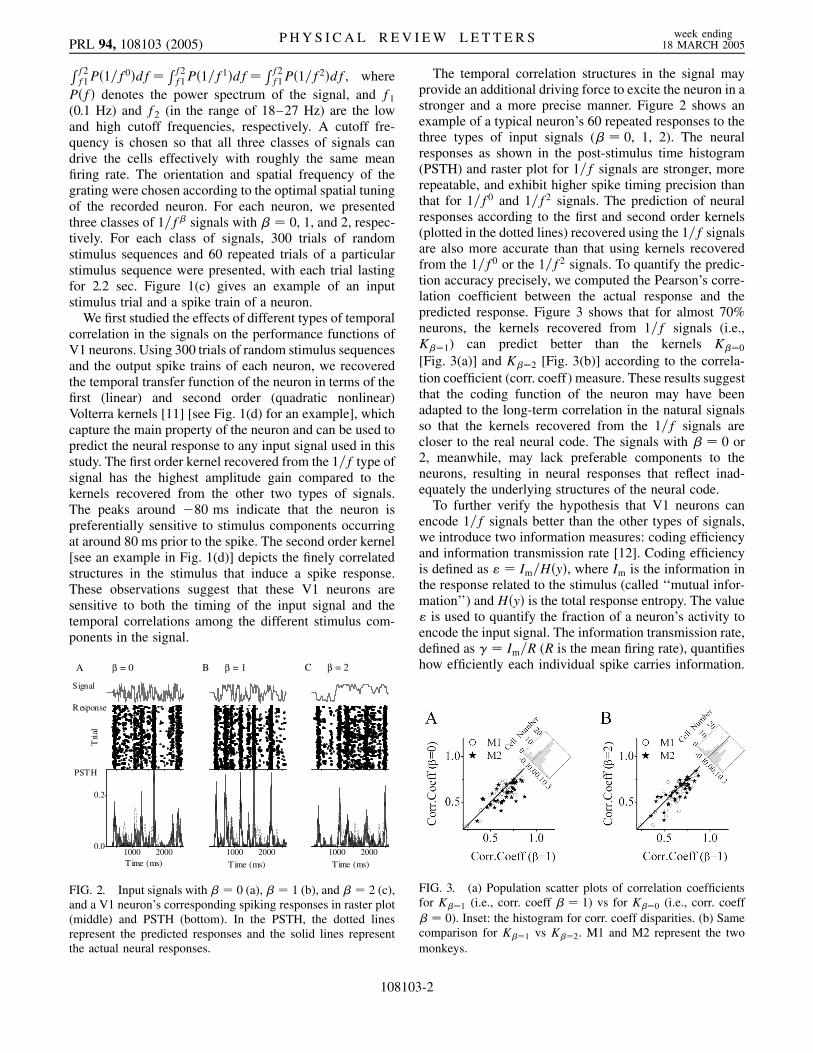
FIG. 2. Input signals with � � 0 (a), � � 1 (b), and � � 2 (c),and a V1 neuron’s corresponding spiking responses in raster plot(middle) and PSTH (bottom). In the PSTH, the dotted linesrepresent the predicted responses and the solid lines representthe actual neural responses.
10810
The temporal correlation structures in the signal mayprovide an additional driving force to excite the neuron in astronger and a more precise manner. Figure 2 shows anexample of a typical neuron’s 60 repeated responses to thethree types of input signals (� � 0, 1, 2). The neuralresponses as shown in the post-stimulus time histogram(PSTH) and raster plot for 1=f signals are stronger, morerepeatable, and exhibit higher spike timing precision thanthat for 1=f0 and 1=f2 signals. The prediction of neuralresponses according to the first and second order kernels(plotted in the dotted lines) recovered using the 1=f signalsare also more accurate than that using kernels recoveredfrom the 1=f0 or the 1=f2 signals. To quantify the predic-tion accuracy precisely, we computed the Pearson’s corre-lation coefficient between the actual response and thepredicted response. Figure 3 shows that for almost 70%neurons, the kernels recovered from 1=f signals (i.e.,K��1) can predict better than the kernels K��0
[Fig. 3(a)] and K��2 [Fig. 3(b)] according to the correla-tion coefficient (corr. coeff) measure. These results suggestthat the coding function of the neuron may have beenadapted to the long-term correlation in the natural signalsso that the kernels recovered from the 1=f signals arecloser to the real neural code. The signals with � � 0 or2, meanwhile, may lack preferable components to theneurons, resulting in neural responses that reflect inad-equately the underlying structures of the neural code.
To further verify the hypothesis that V1 neurons canencode 1=f signals better than the other types of signals,we introduce two information measures: coding efficiencyand information transmission rate [12]. Coding efficiencyis defined as " � Im=H�y�, where Im is the information inthe response related to the stimulus (called ‘‘mutual infor-mation’’) and H�y� is the total response entropy. The value" is used to quantify the fraction of a neuron’s activity toencode the input signal. The information transmission rate,defined as � � Im=R (R is the mean firing rate), quantifieshow efficiently each individual spike carries information.
FIG. 3. (a) Population scatter plots of correlation coefficientsfor K��1 (i.e., corr. coeff � � 1) vs for K��0 (i.e., corr. coeff� � 0). Inset: the histogram for corr. coeff disparities. (b) Samecomparison for K��1 vs K��2. M1 and M2 represent the twomonkeys.
3-2

PRL 94, 108103 (2005) P H Y S I C A L R E V I E W L E T T E R S week ending18 MARCH 2005
The direct method [13] is used to compute Im and H�y�from the spike trains.
Figures 4(a) and 4(b) compare the coding efficiency (")of the 64 V1 neurons to 1=f signals (� � 1) relative to1=f0 (� � 0), and 1=f2 (� � 2) signals, respectively. Thescatter plots show that, as a population, V1 neurons encodethe 1=f signals with higher efficiency " than the � � 0 and� � 2 signals. The statistical analysis on the " disparityhistogram demonstrates that the preference for 1=f signalsis statistically significant [see insets of Fig. 4(a) and 4(b)].Figures 4(c) and 4(d) show that the information transmis-sion rate (�) was also significantly higher for the 1=fsignals as well. This means that each spike of the neuroncan carry more information in the 1=f signal context thanin the other types of signal contexts. The population meanof coding efficiency (h"i) is around 0.42 [Fig. 5(a)], and thepopulation mean of information transmission rate (h�i) isaround 1:6 bits=spike for 1=f signals [Fig. 5(b)]. These arecomparable with other observed experimental results onneural coding of natural signals [1]. For the 1=f0 and 1=f2
signals, the mean coding efficiencies are significantlylower, at 0.38 and 0.3, respectively; the mean informationtransmission rates are around 1.42 and 1:28 bits=spike,respectively. These results provide strong evidence that
FIG. 4. (a) The coding efficiency " of the 64 neurons inresponse to the signals with � � 1 vs � � 0. (b) Similar com-parison for � � 1 against � � 2. Inset: the histograms forcoding efficiency disparity "�� � 1� � "�� � 0� (a) and "�� �1� � "�� � 2� (b). (c) The information transmission rate � ofthe neurons for signals with � � 1 vs � � 0. (d) Same com-parison for � � 1 against � � 2. Inset: the histograms forinformation transmission rate disparity ��� � 1� � ��� � 0�(c) and ��� � 1� � ��� � 2� (d).
10810
the visual neurons can encode 1=f signals more efficientlythan 1=f0 and 1=f2 signals.
The different classes of 1=f� signals are characterizedby different mean temporal frequencies (12, 8,3 cycles= sec). Could the better performance be a resultof the temporal frequency tuning of the cells? Classically,the frequency tuning of the cells is determined by theaverage firing rates of the neurons to signals of differentfrequencies. Figure 5(c) shows that the mean firing rate hRifor 1=f0 signals was higher than that for 1=f and 1=f2
signals. Nevertheless, the coding performance of neuronsfor 1=f0 signals, however, was lower than for 1=f signals,as shown in Fig. 4. Therefore, the better coding perform-ance of V1 neurons in the 1=f context is not purely aconsequence of the tuning properties as measured by firingrates. This can be seen clearly in Fig. 5(d), which showsthat the differences in coding efficiency for the threeclasses of signals ("��1 � "��0 and "��1 � "��2) areuncorrelated with the differences in firing rates �R (corre-lation coefficient <0:001). Although the differences in theinformation transmission rates (��) are inversely propor-tional to �R [Fig. 5(e)], the mean � is always higher for the1=f signals than for the other signals at each firing rate R[Fig. 5(f)]. These results suggest that the temporal corre-lation inherent in a signal’s energy distribution, rather thanthe mean temporal frequency, is a key feature in thestimulus responsible for the higher efficiency in neuronalcoding.
While recent theoretical and experimental studies haveshowed that 1=f background noise could enhance thesensitivity of neurons to subthreshold signals better thanwhite noise [8], ours is the first to demonstrate experimen-
FIG. 5. The population means of coding efficiency h"i (a),information transmission rate h�i (b), and the spiking rate hRi(c) for the three classes of signals. Population scatter plots of �"vs �R (d) and �� vs �R (e). (f) Population scatter plot of � forthe three classes of signals as a function of R; the colored linesare the exponential curves fitted by regression. Fitting functionsare 0:8� 1:7e��x�4:5�=24 for � � 0, 0:9� 2e��x�4:5�=25 for � �1, and 0:5� 1:6e��x�4:5�=20 for � � 2, respectively.
3-3

PRL 94, 108103 (2005) P H Y S I C A L R E V I E W L E T T E R S week ending18 MARCH 2005
tally that the 1=f signals themselves can be encoded andtransmitted by sensory neurons with higher efficiency. Thepower distribution of the 1=f0 and 1=f2 signals is domi-nant at high frequencies and low frequencies, respectively,while the 1=f signal power is the same in each frequencydecade throughout the whole frequency range. Thus, the1=f0 and 1=f2 signals might not be able to stimulate the V1neurons fully, resulting in lower coding efficiency andinformation transmission rate. The fractal structures ofnatural signals generate many self-similar, irregular, andcomplex fluctuations at multiple time scales, resulting inthe specific long-term correlations that are ubiquitous innatural signals. These fine correlational fluctuations likelymodulate neural plasticity during evolution and develop-ment, resulting in higher coding efficiency and informationtransmission rates of neurons when exposed to naturalsignals. While other statistical features like phase or higherorder statistics in natural signals might also influenceneuronal coding, our results provide evidence that the1=f characteristic may be a key feature in natural signalsthat the neurons adapt to, resulting in many of the recentexperimental observations on efficient coding of naturalsignals in neural systems [1,14].
We thank Hans van Hateren, Robert Kass, ValerieVentura, Greg Hood, Brian Potetz, and Matthew A.Smith for helpful discussions and advice. This research issupported by NSF CAREER 9984706, NSF Grant No. IIS-0413211, a NIH 2P41PR06009-11 for biomedical super-computing, and NIH MH64445.
[1] E. Simoncelli, Current Opinion in Neurobiology 13, 144(2003); F. Rieke, D. A. Bodnar, and W. Bialek, Proc. R.Soc. London B 262, 259 (1995); Y. Dan, J. J. Atick, andR. C. Reid, J. Neurosci. 16, 3351 (1996); R. Baddeley,L. F. Abbott, M. C. A. Booth, F. Sengpiel, T. Freeman,E. A. Wakeman, and E. Rolls, Proc. R. Soc. London B264, 1775 (1997); G. D. Lewen, W. Bialek, and R. R. de
10810
Ruyter van Steveninck, Netw., Comput. Neural Syst. 12,317 (2001); S. V. David, W. E. Vinje, and J. L. Gallant, J.Neurosci. 24, 6991 (2004).
[2] B. J. West and M. Shlesinger, Am. Sci. 78, 40 (1990).[3] B. A. Taft, B. M. Hickey, C. Wunsch, and D. J. Baker,
Deep-Sea Res. 21, 403 (1974).[4] R. F. Voss and J. Clarke, Nature (London) 258, 317 (1975).[5] J. H. van Hateren, Vision Research 37, 3407 (1997).[6] M. Yamamoto, H. Nakahama, K. Shima, T. Kodama, and
H. Mushiake, Brain Research 366, 279 (1986); M. C.Teich, in Single Neuron Computation, edited by T.McKenna, J. Davis, and S. F. Zometzer (AcademicPress, Boston, 1992).
[7] C. F. Stevens and A. M. Zador, Nat. Neurosci. 1, 210(1998); J. Feng and D. Brown, Neural Comput. 12, 671(2000); E. Salinas and T. J. Sejnowski, J. Neurosci. 20,6193 (2000); J. W. Middleton, M. J. Chacron, B. Lindner,and A. Longtin, Phys. Rev. E 68, 021920 (2003); S. Wang,F. Liu, W. Wang, and Y. G. Yu, Phys. Rev. E 69, 011909(2004).
[8] D. Nozaki, J. J. Collins, and Y. Yamamoto, Phys. Rev. E60, 4637 (1999); D. Nozaki, D. J. Mar, P. Grigg, and J. J.Collins, Phys. Rev. Lett. 82, 2402 (1999); R. Soma, D.Nozaki, S. Kwak, and Y. Yamamoto, Phys. Rev. Lett. 91,078101 (2003).
[9] L. B. Kish and S. Bezrukov, Phys. Lett. A 266, 271 (2000);P. Ruszczynski, L. B. Kish, and S. M. Bezrukov, Chaos 11,581 (2001).
[10] B. B. Mandelbrot and J. M. van Vess, SIAM Rev. 10, 422(1968).
[11] M. J. Korenberg and I. W. Hunter, Ann. Biomed. Eng. 24,250 (1996).
[12] F. Rieke, D. Warland, R. de Ruyter van Steveninck, and W.Bialek, Spikes: Exploring the Neural Code (MIT Press,Cambridge, MA, 1997).
[13] S. P. Strong, R. Koberle, R. R. de Ruyter van Steveninck,and W. Bialek, Phys. Rev. Lett. 80, 197 (1998).
[14] Recently, Jan W. H. Schnupp, Jose A. Garcia-Lazaro, A. J.King, and B. Ahmed at Oxford University, inspired by ourstudy, found that neurons in the auditory cortex alsoexhibited tuning to 1=f signals (unpublished results).
3-4