preference of fsc-certified paper in georgia
TRANSCRIPT
Georgian Opinion Research Business International (GORBI)
Tbilisi 2015
Preference of FSC-Certified Paper in Georgia
This publ ication has been produced with the assistance of the European Union. The content, f indings, interpretations, and
conclusions of this publication are the sole responsibil i ty of the FLEG II (ENPI East) Programme Team (www.enpi -fleg.org) and can
in no way be taken to reflect the views of the European Union. The views expressed do not necessari ly reflect those of the
Implementing Organizations.
2
Table of Contents
1 INTRODUCTION AND METHODOLOGY ....................................................................................... 3
2 SUMMARY OF KEY FINDINGS ................................................................................................... 4
2.1 Key findings ................................................................................................................................ 4
3 SAMPLE DESCRIPTION ............................................................................................................ 5
4 DETAILS OF THE ANALYSIS ..................................................................................................... 7
4.1 Introduction to analysis ............................................................................................................... 7
4.2 Questions about paper use (B1-B4) ........................................................................................... 7
4.3 Average order amounts (B5-B7) ............................................................................................... 12
4.4 Questions about FSC-certified paper (B8-B15) ..................................................................... 22
4.5 Estimated price – willingness to pay (B16-20B) ....................................................................... 27
4.6 Environmental Policies (B21-B25) ............................................................................................ 28
3
1 INTRODUCTION AND METHODOLOGY
The aim of the study was to reveal the willingness of paper-consuming companies and
organizations to purchase FSC-certified paper. The survey also contained an informational
component as all the respondents were provided with information about FSC-certified paper.
Respondents were also asked if they agreed to be contacted regarding FSC-products.
Of the 147 entities contacted by GORBI (Georgia Opinion Research Business International), 102
agreed to be surveyed. The fieldwork was conducted by GORBI’s professional field staff. A total of 11
interviewers participated in the fieldwork which was carried out from the 9th to the 30th of January,
2015. Only five of the interviews were conducted over the phone. All remaining interviews were
conducted face-to-face.
Our target entities were large organizations and companies operating in Georgia which are
substantial consumers of paper products. This included domestic and international organizations,
both public and private. The initial list of target companies, provided by WWF, contained 43 large
organizations. The types of organizations that were targeted included supermarkets, banks,
distributors, fast food restaurants, publishing houses, advertising companies, government ministries,
state agencies, and NGOs.
We used the snowball methodology for selecting the remaining eligible companies. This means
that at the end of each interview we asked respondents to recommend other companies or
organizations operating on Georgian territory that are also heavy consumers of paper. Using this
method we built up the sample size to 102 entities.
Within each organization our target respondent was the individual responsible (i.e., the decision
maker) for purchasing paper in the company. All governmental (public) organizations and a few large
private companies, however, procure their paper via tender announcements.
It is important to remember that these results are not based on a statistically representative
sample. Thus, we cannot make claims about the entire population of paper consuming companies
and organizations in Georgia. Rather, these data give us an idea of the consumption patterns of a
large number of organizations in Georgia and their willingness to adopt, or at least consider adopting,
FSC-certified products.
4
2 SUMMARY OF KEY FINDINGS
2.1 KEY FINDINGS
Georgian organizations have an extremely low awareness of FSC-certified products. Without
prompting, only 13 of the 102 organizations surveyed were aware of the FSC certification. Of these 13 organizations, just 5 reported using FSC paper. Interestingly, and perhaps unsurprisingly, all 5 of these organizations have policies that give preference to FSC-certified products.
While there is a low level of awareness of the FSC certification, our data indicate that there is interest in the certification. Only a handful of organizations said that they would not be interested in purchasing FSC-certified paper if it was comparably priced with non-FSC paper. Understandably, the price of FSC-certified products will appear to have a large effect on an organizations willingness to purchase them.
In order to create an estimate of a price range of a box of FSC-certified A4 paper, we asked questions that allowed us to create a van Westerndorp price sensitivity meter. Our data indicate that the ideal price range for a box of A4 paper should be between 25 and 37 GEL. Because this range is very close to the price range of a box of non-FSC A4 paper, this result similarly confirms that organizations are very sensitive to price.
5
3 SAMPLE DESCRIPTION
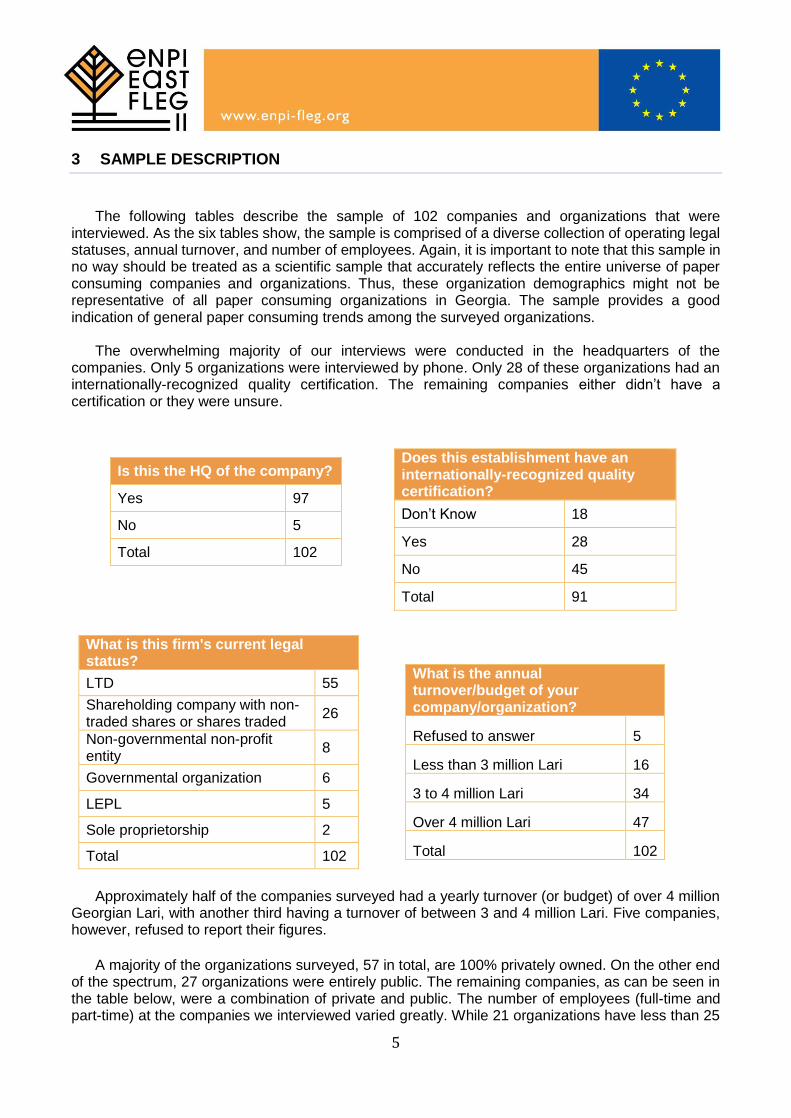
The following tables describe the sample of 102 companies and organizations that were
interviewed. As the six tables show, the sample is comprised of a diverse collection of operating legal statuses, annual turnover, and number of employees. Again, it is important to note that this sample in no way should be treated as a scientific sample that accurately reflects the entire universe of paper consuming companies and organizations. Thus, these organization demographics might not be representative of all paper consuming organizations in Georgia. The sample provides a good indication of general paper consuming trends among the surveyed organizations.
The overwhelming majority of our interviews were conducted in the headquarters of the
companies. Only 5 organizations were interviewed by phone. Only 28 of these organizations had an internationally-recognized quality certification. The remaining companies either didn’t have a certification or they were unsure.
Is this the HQ of the company?
Yes 97
No 5
Total 102
Does this establishment have an internationally-recognized quality certification?
Don’t Know 18
Yes 28
No 45
Total 91
What is this firm's current legal status?
LTD 55
Shareholding company with non-traded shares or shares traded
26
Non-governmental non-profit entity
8
Governmental organization 6
LEPL 5
Sole proprietorship 2
Total 102
What is the annual turnover/budget of your company/organization?
Refused to answer 5
Less than 3 million Lari 16
3 to 4 million Lari 34
Over 4 million Lari 47
Total 102
Approximately half of the companies surveyed had a yearly turnover (or budget) of over 4 million
Georgian Lari, with another third having a turnover of between 3 and 4 million Lari. Five companies, however, refused to report their figures.
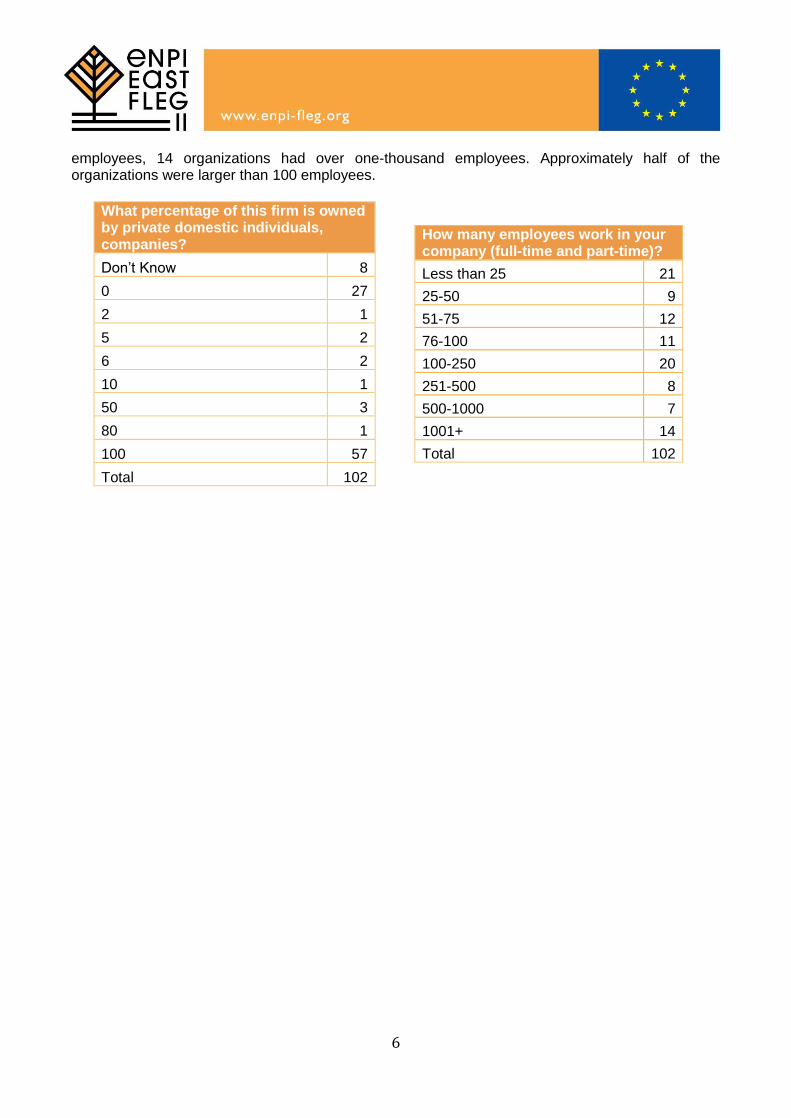
A majority of the organizations surveyed, 57 in total, are 100% privately owned. On the other end
of the spectrum, 27 organizations were entirely public. The remaining companies, as can be seen in the table below, were a combination of private and public. The number of employees (full-time and part-time) at the companies we interviewed varied greatly. While 21 organizations have less than 25
6
employees, 14 organizations had over one-thousand employees. Approximately half of the organizations were larger than 100 employees.
What percentage of this firm is owned by private domestic individuals, companies?
Don’t Know 8
0 27
2 1
5 2
6 2
10 1
50 3
80 1
100 57
Total 102
How many employees work in your company (full-time and part-time)?
Less than 25 21
25-50 9
51-75 12
76-100 11
100-250 20
251-500 8
500-1000 7
1001+ 14
Total 102

7
4 DETAILS OF THE ANALYSIS
4.1 INTRODUCTION TO ANALYSIS
This section of the report analyzes each question of the survey. The majority of these tables are simply tabulations that present the raw results from each question. Unless otherwise noted, the sample size for each question is 102 companies.
4.2 QUESTIONS ABOUT PAPER USE (B1-B4)
Table 1
Who makes the decision in your company about the purchase of paper?
I do (respondent) 100
Somebody else 2
Total 102
Table 2
Do you procure paper for all of your locations?
Does not apply (COMPANY HAS ONLY ONE LOCATION) 40
Yes, for all the locations 41
No, I make decisions only for the current location 21
Total 102
Almost all of the individuals interviewed in our sample are the very people who control the
purchase of paper for their organization (Table 1). Overwhelmingly, this was the only individual who makes paper purchases for the company (either because he or she is the only purchaser or because the company has only a single location). Thus, we can be more confident that our sample really does represent the opinions of those individuals who exert significant influence on paper purchases.
Table 3
What kind of paper does your company use and purchase?
Office paper for printing A4 97
Toilet paper 88
Napkins 84
Office paper for printing A3 29
Packing paper 25
Wrapping paper 5
Coated paper 3
Cash ribbon 2
Toilet hygiene pads - dispenser 2
Pampers, hygiene products 1
Cardboard paper 1
Newspaper paper 1

8
What kind of paper does your company use and purchase?
Chrome paper 1
Offset paper 1
A5 1
A1 1
Test liner and Fluting paper 1
A great variety of paper types are ordered by the companies in our sample (Table 3).
Respondents were not limited in the number of choices they could report and, thus, the number is higher than the number of companies. As is clearly seen in the table, nearly all companies purchase and use A4 office paper (nearly 97%). Toilet paper and napkins, unsurprisingly, are the next two most frequently purchased paper products in our sample with well-over 80% of respondents reporting that they purchase such products. Around a quarter of respondents further reported purchasing packing and A3 printing paper. All remaining types of paper were much less frequently purchased and merit no discussion.
Table 3a
Type of Paper Used and Purchased (by organization size)
Number of orgs in category
A4 A3 Packing Toilet Paper
Napkins
less than 25 21 19 7 1 16 16
25 to 100 32 29 9 7 27 26
more than 100 47 47 12 16 44 41
Paper purchases are fairly equally distributed across organization size (Table 3a). A4 paper, as we saw above, is purchased by nearly all the organizations in our sample. A3 paper, however, appears to be more frequently bought by smaller organizations; only about 25% of organizations with more than 100 employees purchase A3 paper, but around a third of companies with less than 25 employees purchase A3 paper. Unsurprisingly, packing paper is more likely to be purchased by larger organizations and companies.
Table 4
Which brand do you usually purchase for A4 FORMAT OFFICE PAPER?
Brand 1 Brand 2
Double A 49 3
Save 8
Copy Power 7
Navigator 6 1
Hi Plus 4 1
Paper Line 3
Lower price 3
DK 3
Excellent Copy 2
Ultra 1
9
Which brand do you usually purchase for A4 FORMAT OFFICE PAPER?
Copy Laser Paper 1 4
Sano 1
Tryon 1
Save 1
April 1 1
Print Copy 1
Matrix 1
Spectra 1 1
Different brands (provided by company that won tender) 1
ZAOR 1
Laser Spam 1
Paper One 1
Xerox Business 1
Total 97 15
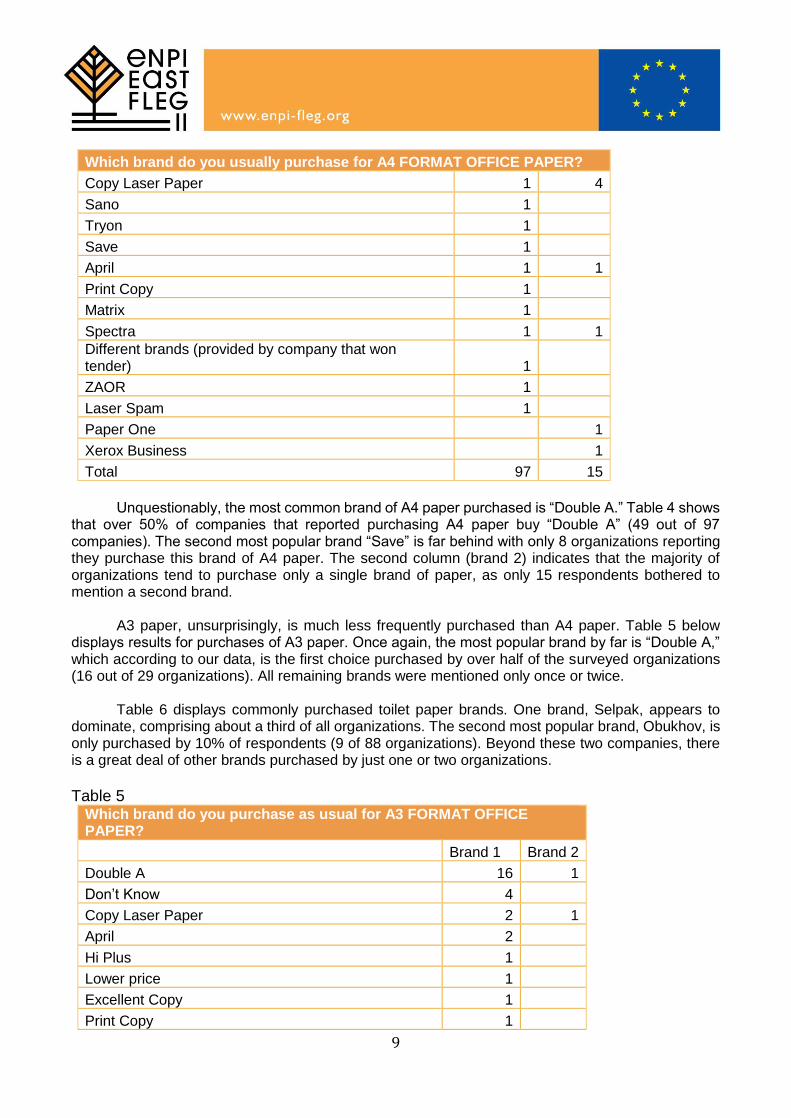
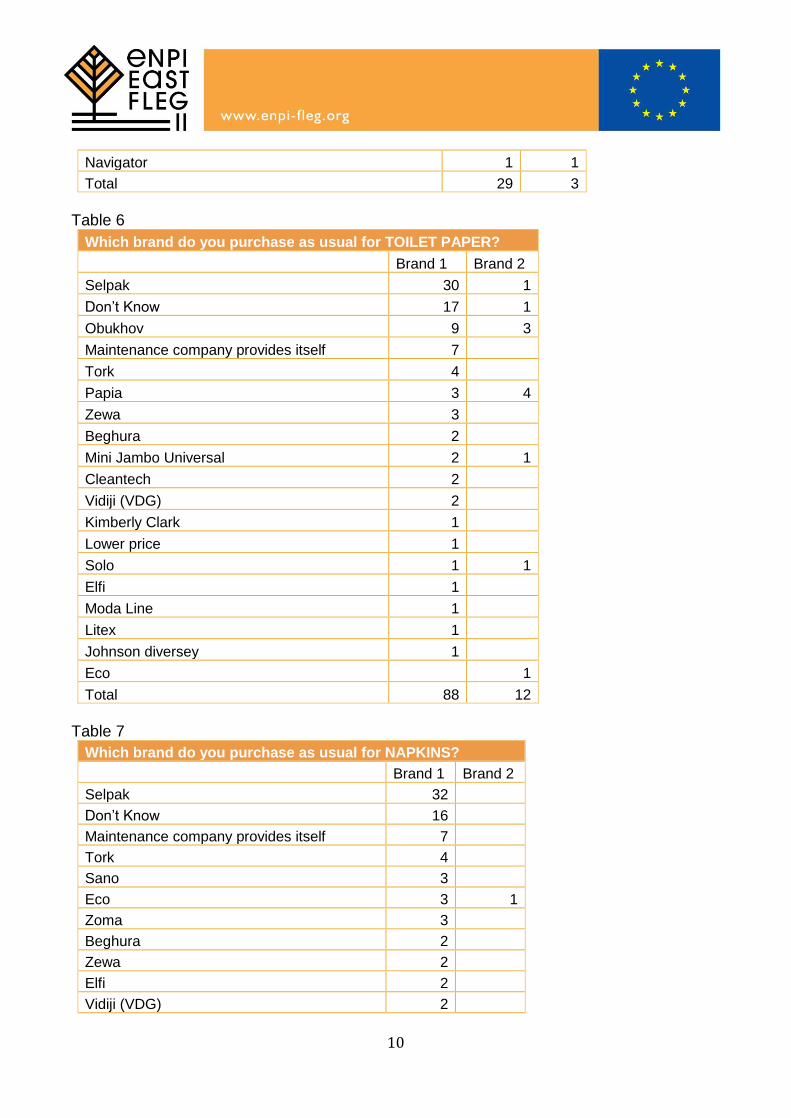
Unquestionably, the most common brand of A4 paper purchased is “Double A.” Table 4 shows that over 50% of companies that reported purchasing A4 paper buy “Double A” (49 out of 97 companies). The second most popular brand “Save” is far behind with only 8 organizations reporting they purchase this brand of A4 paper. The second column (brand 2) indicates that the majority of organizations tend to purchase only a single brand of paper, as only 15 respondents bothered to mention a second brand. A3 paper, unsurprisingly, is much less frequently purchased than A4 paper. Table 5 below displays results for purchases of A3 paper. Once again, the most popular brand by far is “Double A,” which according to our data, is the first choice purchased by over half of the surveyed organizations (16 out of 29 organizations). All remaining brands were mentioned only once or twice. Table 6 displays commonly purchased toilet paper brands. One brand, Selpak, appears to dominate, comprising about a third of all organizations. The second most popular brand, Obukhov, is only purchased by 10% of respondents (9 of 88 organizations). Beyond these two companies, there is a great deal of other brands purchased by just one or two organizations.
Table 5
Which brand do you purchase as usual for A3 FORMAT OFFICE PAPER?
Brand 1 Brand 2
Double A 16 1
Don’t Know 4
Copy Laser Paper 2 1
April 2
Hi Plus 1
Lower price 1
Excellent Copy 1
Print Copy 1
10
Navigator 1 1
Total 29 3
Table 6
Which brand do you purchase as usual for TOILET PAPER?
Brand 1 Brand 2
Selpak 30 1
Don’t Know 17 1
Obukhov 9 3
Maintenance company provides itself 7
Tork 4
Papia 3 4
Zewa 3
Beghura 2
Mini Jambo Universal 2 1
Cleantech 2
Vidiji (VDG) 2
Kimberly Clark 1
Lower price 1
Solo 1 1
Elfi 1
Moda Line 1
Litex 1
Johnson diversey 1
Eco 1
Total 88 12
Table 7
Which brand do you purchase as usual for NAPKINS?
Brand 1 Brand 2
Selpak 32
Don’t Know 16
Maintenance company provides itself 7
Tork 4
Sano 3
Eco 3 1
Zoma 3
Beghura 2
Zewa 2
Elfi 2
Vidiji (VDG) 2
11
Which brand do you purchase as usual for NAPKINS?
Kimberly Clark 1
Lower price 1 1
Solo 1 1
Advance 1
Cleantech 1
Moda Line 1
Litex 1
Gut und gunstig 1
Papia 3
Total 84 6
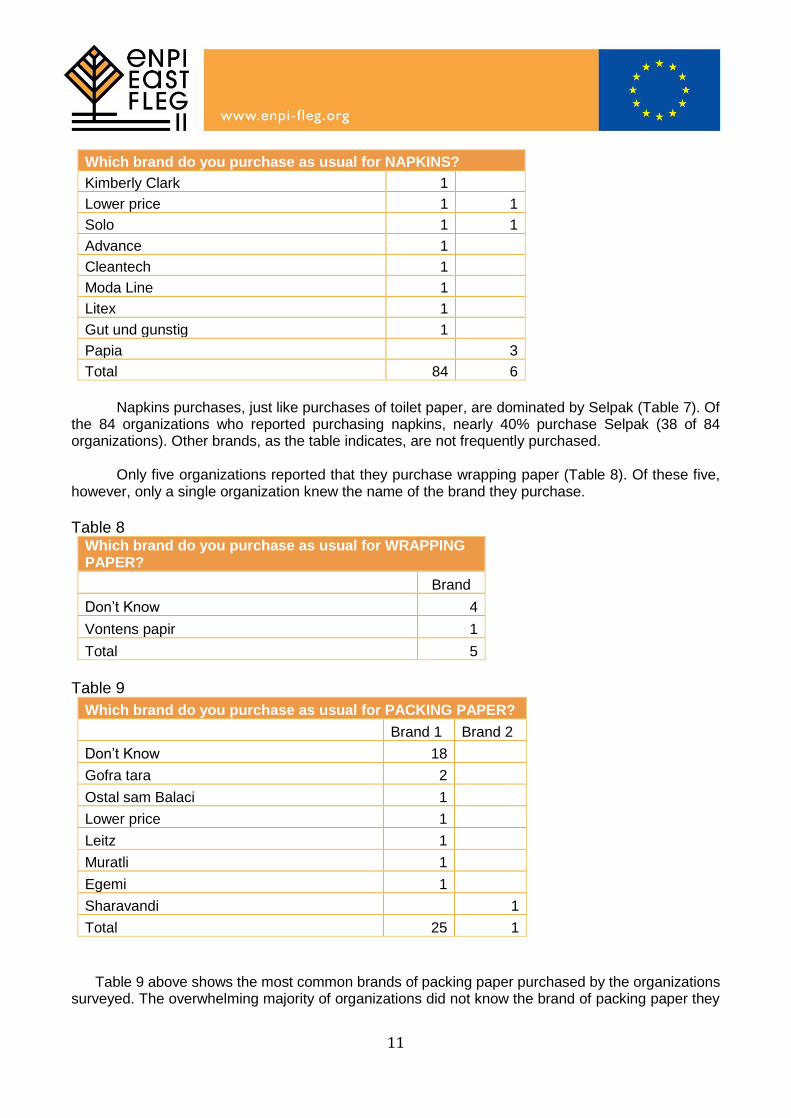
Napkins purchases, just like purchases of toilet paper, are dominated by Selpak (Table 7). Of
the 84 organizations who reported purchasing napkins, nearly 40% purchase Selpak (38 of 84 organizations). Other brands, as the table indicates, are not frequently purchased. Only five organizations reported that they purchase wrapping paper (Table 8). Of these five, however, only a single organization knew the name of the brand they purchase.
Table 8
Which brand do you purchase as usual for WRAPPING PAPER?
Brand
Don’t Know 4
Vontens papir 1
Total 5
Table 9
Which brand do you purchase as usual for PACKING PAPER?
Brand 1 Brand 2
Don’t Know 18
Gofra tara 2
Ostal sam Balaci 1
Lower price 1
Leitz 1
Muratli 1
Egemi 1
Sharavandi 1
Total 25 1
Table 9 above shows the most common brands of packing paper purchased by the organizations surveyed. The overwhelming majority of organizations did not know the brand of packing paper they

12
purchase. In fact, only 7 of the 25 organizations (28%) declaring that they purchase packing paper were able to report the brand name. When asked about the brands that they purchase for “other kinds of paper,” the majority of respondents were unsure (Table 10). Only 5 of the 15 respondents reported a brand name. However, no brand was reported more than a single time. Table 10
Which brand do you purchase as usual for OTHER KIND OF PAPER?
Brand 1 Brand 2
Don’t Know 10 1
Kimberly Clark 1
April 1
Zewa 1
Muratli 1
Billitasha 1
Total 15 1
4.3 AVERAGE ORDER AMOUNTS (B5-B7)
Table 11 through Table 16 indicate the size of the orders the organizations make. Each individual
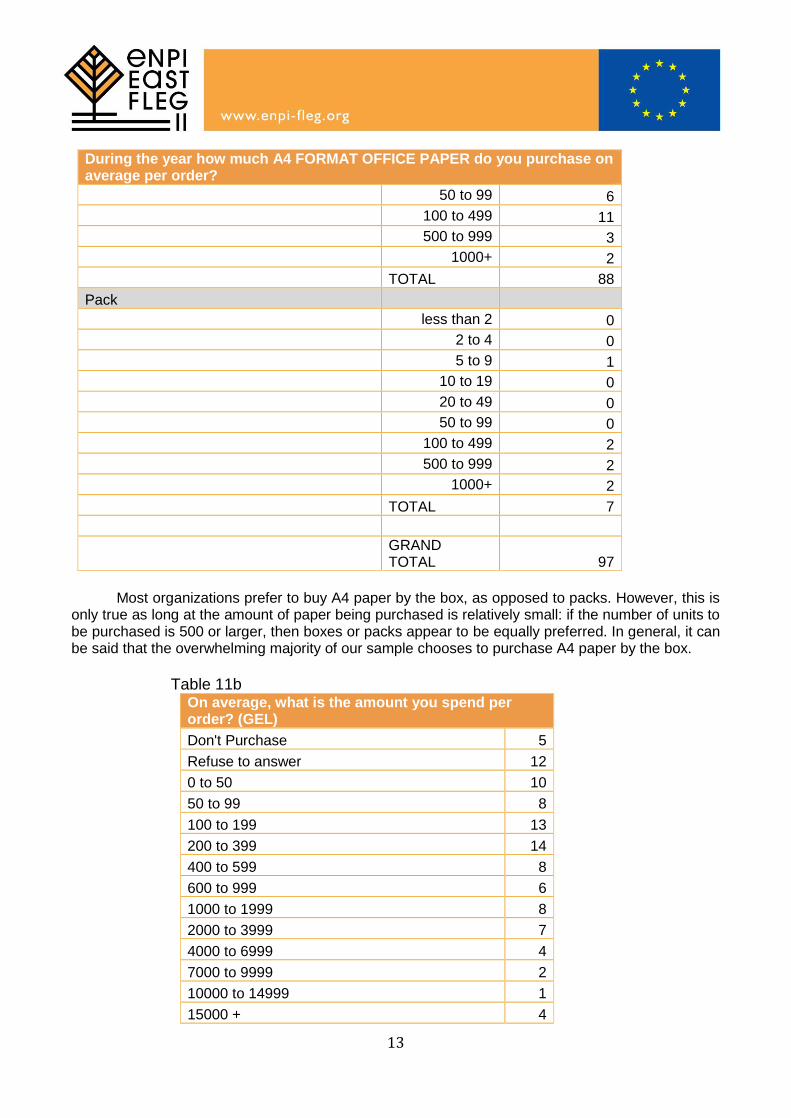
table is organized by type of unit (shaded in grey). Finally, each major table (e.g. Table 11) is accompanied by a secondary table (e.g. Table 11b) that indicates the amount in GEL of each order. Thus, for example, in Table 11 we can see that 14 organizations buy between 5-9 boxes of A4 paper per order. In total, 88 organizations buy paper in boxes (the TOTAL for “Box”), while 97 organizations buy A4 paper (GRAND TOTAL).
There is some difficulty in interpreting these results because of the many different types of measurement by which paper is sold. Thus, in one table there can exist three or four different measurement types that cannot easily be compared. However, these tables do provide an idea of both the types and amounts of paper purchased and consumed.
Table 11 During the year how much A4 FORMAT OFFICE PAPER do you purchase on average per order?
Type of unit Amount Number of orgs.
Refuse to answer
TOTAL 2
Box
less than 2 10
2 to 4 12
5 to 9 14
10 to 19 15
20 to 49 15
13
During the year how much A4 FORMAT OFFICE PAPER do you purchase on average per order?
50 to 99 6
100 to 499 11
500 to 999 3
1000+ 2
TOTAL 88
Pack
less than 2 0
2 to 4 0
5 to 9 1
10 to 19 0
20 to 49 0
50 to 99 0
100 to 499 2
500 to 999 2
1000+ 2
TOTAL 7
GRAND TOTAL 97
Most organizations prefer to buy A4 paper by the box, as opposed to packs. However, this is only true as long at the amount of paper being purchased is relatively small: if the number of units to be purchased is 500 or larger, then boxes or packs appear to be equally preferred. In general, it can be said that the overwhelming majority of our sample chooses to purchase A4 paper by the box.
Table 11b
On average, what is the amount you spend per order? (GEL)
Don't Purchase 5
Refuse to answer 12
0 to 50 10
50 to 99 8
100 to 199 13
200 to 399 14
400 to 599 8
600 to 999 6
1000 to 1999 8
2000 to 3999 7
4000 to 6999 4
7000 to 9999 2
10000 to 14999 1
15000 + 4
14
TOTAL 102
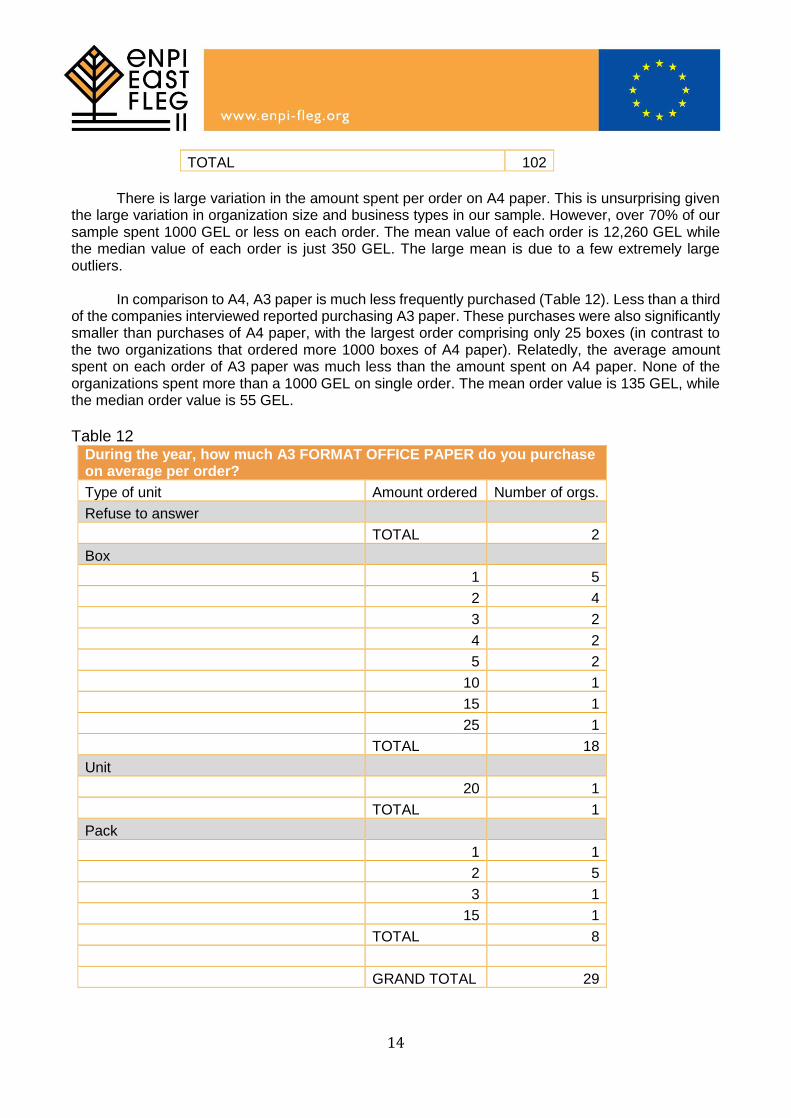
There is large variation in the amount spent per order on A4 paper. This is unsurprising given the large variation in organization size and business types in our sample. However, over 70% of our sample spent 1000 GEL or less on each order. The mean value of each order is 12,260 GEL while the median value of each order is just 350 GEL. The large mean is due to a few extremely large outliers.
In comparison to A4, A3 paper is much less frequently purchased (Table 12). Less than a third of the companies interviewed reported purchasing A3 paper. These purchases were also significantly smaller than purchases of A4 paper, with the largest order comprising only 25 boxes (in contrast to the two organizations that ordered more 1000 boxes of A4 paper). Relatedly, the average amount spent on each order of A3 paper was much less than the amount spent on A4 paper. None of the organizations spent more than a 1000 GEL on single order. The mean order value is 135 GEL, while the median order value is 55 GEL.
Table 12
During the year, how much A3 FORMAT OFFICE PAPER do you purchase on average per order?
Type of unit Amount ordered Number of orgs.
Refuse to answer
TOTAL 2
Box
1 5
2 4
3 2
4 2
5 2
10 1
15 1
25 1
TOTAL 18
Unit
20 1
TOTAL 1
Pack
1 1
2 5
3 1
15 1
TOTAL 8
GRAND TOTAL 29
15
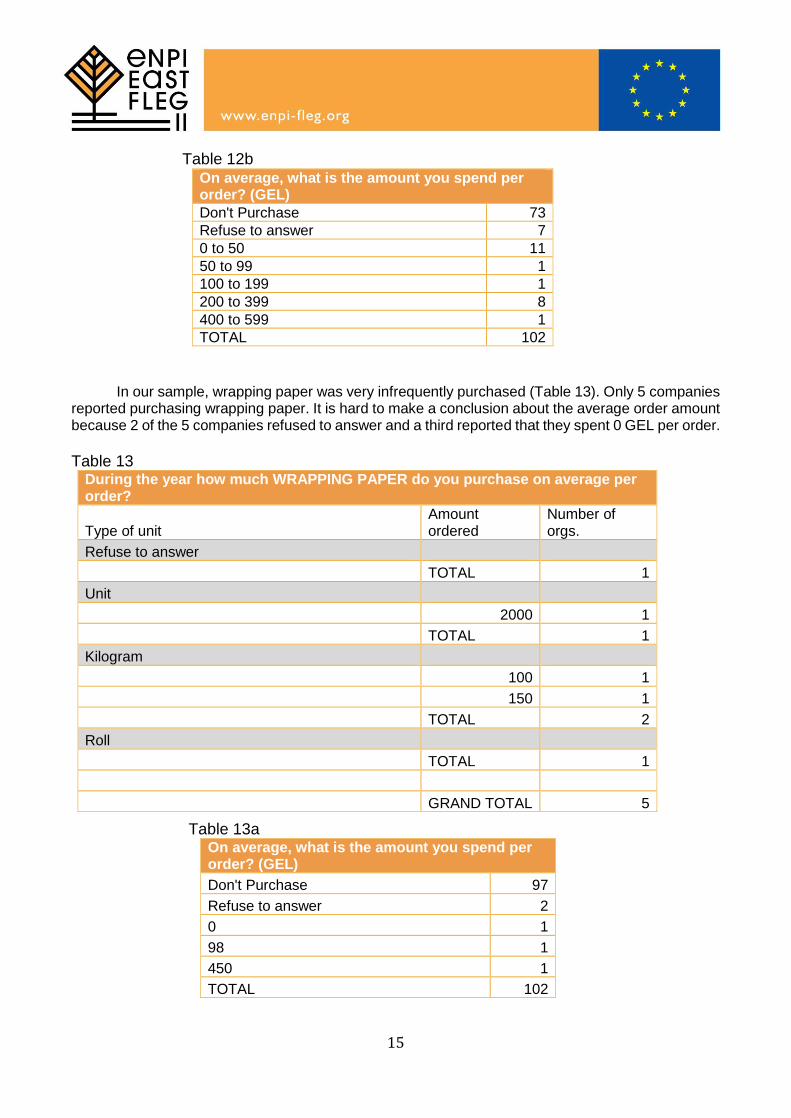
Table 12b
On average, what is the amount you spend per order? (GEL)
Don't Purchase 73
Refuse to answer 7
0 to 50 11
50 to 99 1
100 to 199 1
200 to 399 8
400 to 599 1
TOTAL 102
In our sample, wrapping paper was very infrequently purchased (Table 13). Only 5 companies reported purchasing wrapping paper. It is hard to make a conclusion about the average order amount because 2 of the 5 companies refused to answer and a third reported that they spent 0 GEL per order.
Table 13
During the year how much WRAPPING PAPER do you purchase on average per order?
Type of unit Amount ordered
Number of orgs.
Refuse to answer
TOTAL 1
Unit
2000 1
TOTAL 1
Kilogram
100 1
150 1
TOTAL 2
Roll
TOTAL 1
GRAND TOTAL 5
Table 13a On average, what is the amount you spend per order? (GEL)
Don't Purchase 97
Refuse to answer 2
0 1
98 1
450 1
TOTAL 102

16
In contrast to wrapping paper, packing paper is much more frequently purchased. A total of 25
companies reported purchasing packaging paper, as can be seen in Table 14. There is extremely large variation in the amount ordered by each company: from a minimum of a single box to one-million units. Likewise, of course, the amounts spent per order had a similarly large variation, from less than 50 GEL to more than 20,000 GEL. The mean amount spent on each order was 12,570 GEL, while the media value was 285 GEL.
Table 14 During the year how much PACKING PAPER do you purchase on average per order?
Type of unit Amount ordered Number of orgs.
Refused to answer
refused 2
TOTAL 2
Box
refused 1
1 1
2 1
5000 2
TOTAL 5
Unit
50 1
100 1
1000 1
1500 1
3000 1
50000 1
22000 1
50000 1
60000 1
70000 1
100000 1
1000000 1
TOTAL 12
Ton
15 1
TOTAL 1
Pack
5 1
10 1
50 1

17
During the year how much PACKING PAPER do you purchase on average per order?
TOTAL 3
Kilogram
100 1
150 1
TOTAL 2
GRAND TOTAL 25
Table 14a
On average, what is the amount you spend per order? (GEL)
Don't Purchase 77
Refuse to answer 7
0 to 50 5
50 to 99 3
100 to 199 1
200 to 499 1
500 to 999 1
1000-4999 0
5000-9999 3
10000-19999 2
20000 + 2
TOTAL 102
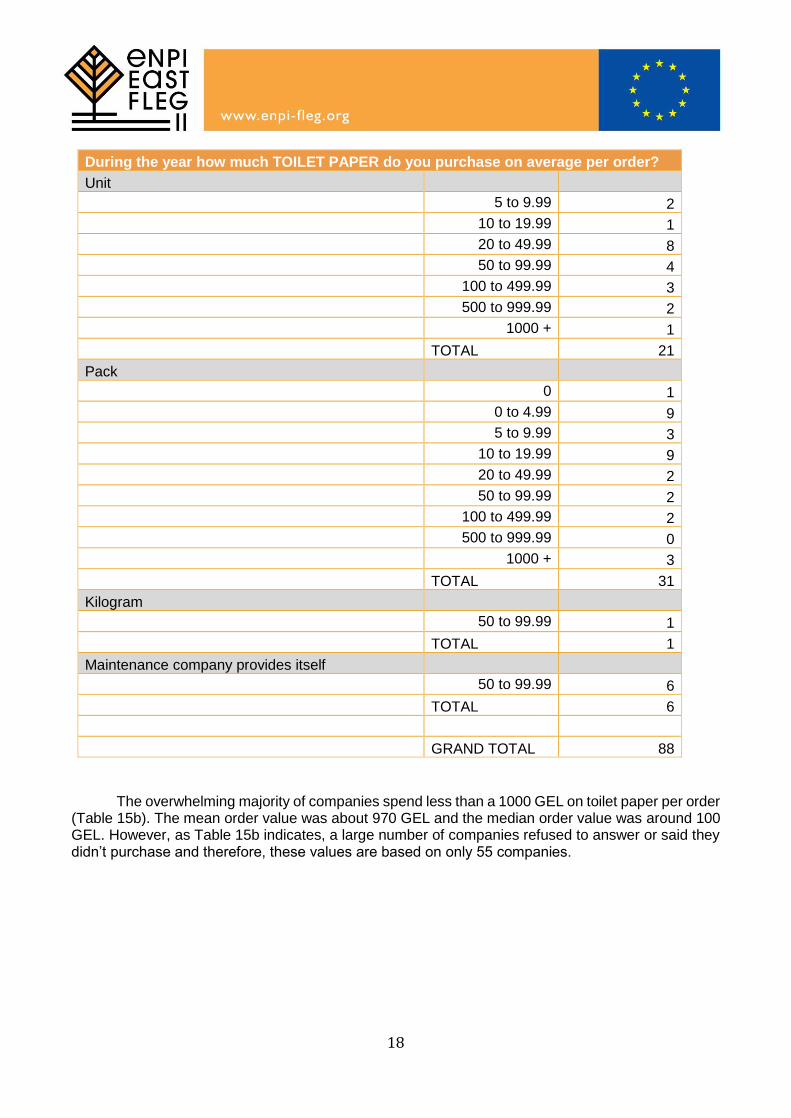
Toilet paper (Table 15) and Napkins (Table 16) are very commonly purchased products by the companies in our sample. As we can see in Table 15, toilet paper is purchased in many different types of measurement, with no unit type dominating entirely. A small number of companies are ordering very large amounts (1000+ units or packs) of toilet paper. Six organizations don’t purchase their own toilet paper directly, but rely on a maintenance company.
Table 15
During the year how much TOILET PAPER do you purchase on average per order?
Type of unit Amount ordered Number of orgs.
RA
TOTAL 14
Box
0 3
0 to 4.99 8
5 to 9.99 2
10 to 19.99 1
20 to 49.99 1
TOTAL 15
18
During the year how much TOILET PAPER do you purchase on average per order?
Unit
5 to 9.99 2
10 to 19.99 1
20 to 49.99 8
50 to 99.99 4
100 to 499.99 3
500 to 999.99 2
1000 + 1
TOTAL 21
Pack
0 1
0 to 4.99 9
5 to 9.99 3
10 to 19.99 9
20 to 49.99 2
50 to 99.99 2
100 to 499.99 2
500 to 999.99 0
1000 + 3
TOTAL 31
Kilogram
50 to 99.99 1
TOTAL 1
Maintenance company provides itself
50 to 99.99 6
TOTAL 6
GRAND TOTAL 88
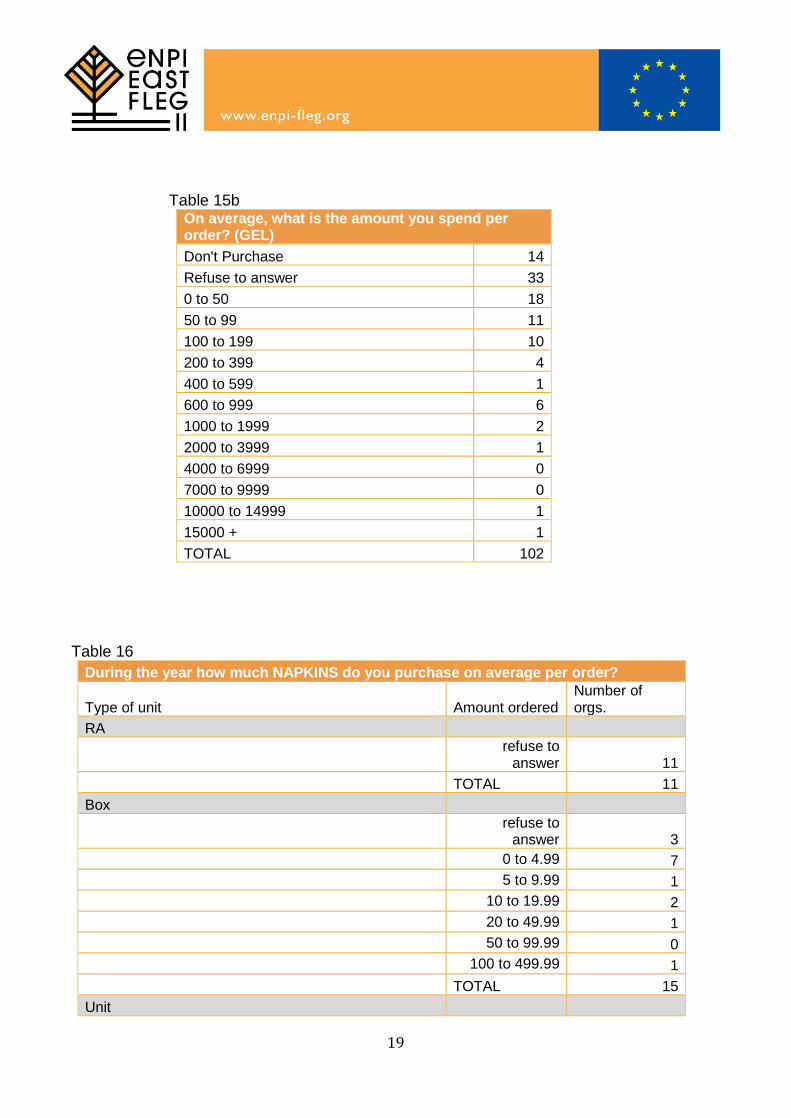
The overwhelming majority of companies spend less than a 1000 GEL on toilet paper per order (Table 15b). The mean order value was about 970 GEL and the median order value was around 100 GEL. However, as Table 15b indicates, a large number of companies refused to answer or said they didn’t purchase and therefore, these values are based on only 55 companies.
19
Table 15b
On average, what is the amount you spend per order? (GEL)
Don't Purchase 14
Refuse to answer 33
0 to 50 18
50 to 99 11
100 to 199 10
200 to 399 4
400 to 599 1
600 to 999 6
1000 to 1999 2
2000 to 3999 1
4000 to 6999 0
7000 to 9999 0
10000 to 14999 1
15000 + 1
TOTAL 102
Table 16
During the year how much NAPKINS do you purchase on average per order?
Type of unit Amount ordered Number of orgs.
RA
refuse to
answer 11
TOTAL 11
Box
refuse to
answer 3
0 to 4.99 7
5 to 9.99 1
10 to 19.99 2
20 to 49.99 1
50 to 99.99 0
100 to 499.99 1
TOTAL 15
Unit

20
During the year how much NAPKINS do you purchase on average per order?
refuse to
answer 0
0 to 4.99 0
5 to 9.99 2
10 to 19.99 4
20 to 49.99 8
50 to 99.99 3
100 to 499.99 3
500 to 999.99 2
1000 + 1
TOTAL 23
Pack
refuse to
answer 1
0 to 4.99 7
5 to 9.99 4
10 to 19.99 8
20 to 49.99 1
50 to 99.99 2
100 to 499.99 3
500 to 999.99 0
1000 + 2
TOTAL 28
Roll
50 to 99.99 1
TOTAL 1
Maintenance company provides itself
50 to 99.99 6
TOTAL 6
GRAND TOTAL 84
21
Table 16b
On average, what is the amount you spend per order? (GEL)
Don't Purchase 18
Refuse to answer 33
0 to 50 23
50 to 99 10
100 to 199 6
200 to 399 4
400 to 599 1
600 to 999 3
1000 to 1999 1
2000 to 3999 1
4000 to 6999 0
7000 to 9999 0
10000 to 14999 1
15000 + 1
TOTAL 102
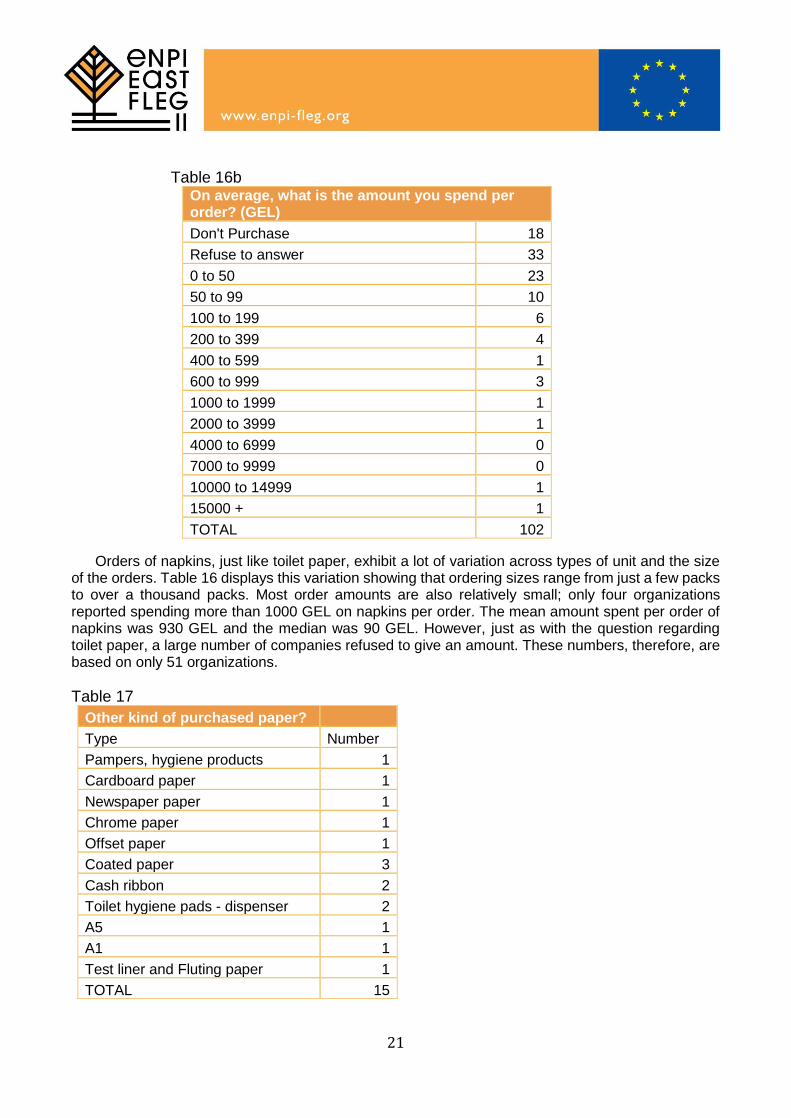
Orders of napkins, just like toilet paper, exhibit a lot of variation across types of unit and the size of the orders. Table 16 displays this variation showing that ordering sizes range from just a few packs to over a thousand packs. Most order amounts are also relatively small; only four organizations reported spending more than 1000 GEL on napkins per order. The mean amount spent per order of napkins was 930 GEL and the median was 90 GEL. However, just as with the question regarding toilet paper, a large number of companies refused to give an amount. These numbers, therefore, are based on only 51 organizations.
Table 17
Other kind of purchased paper?
Type Number
Pampers, hygiene products 1
Cardboard paper 1
Newspaper paper 1
Chrome paper 1
Offset paper 1
Coated paper 3
Cash ribbon 2
Toilet hygiene pads - dispenser 2
A5 1
A1 1
Test liner and Fluting paper 1
TOTAL 15
22
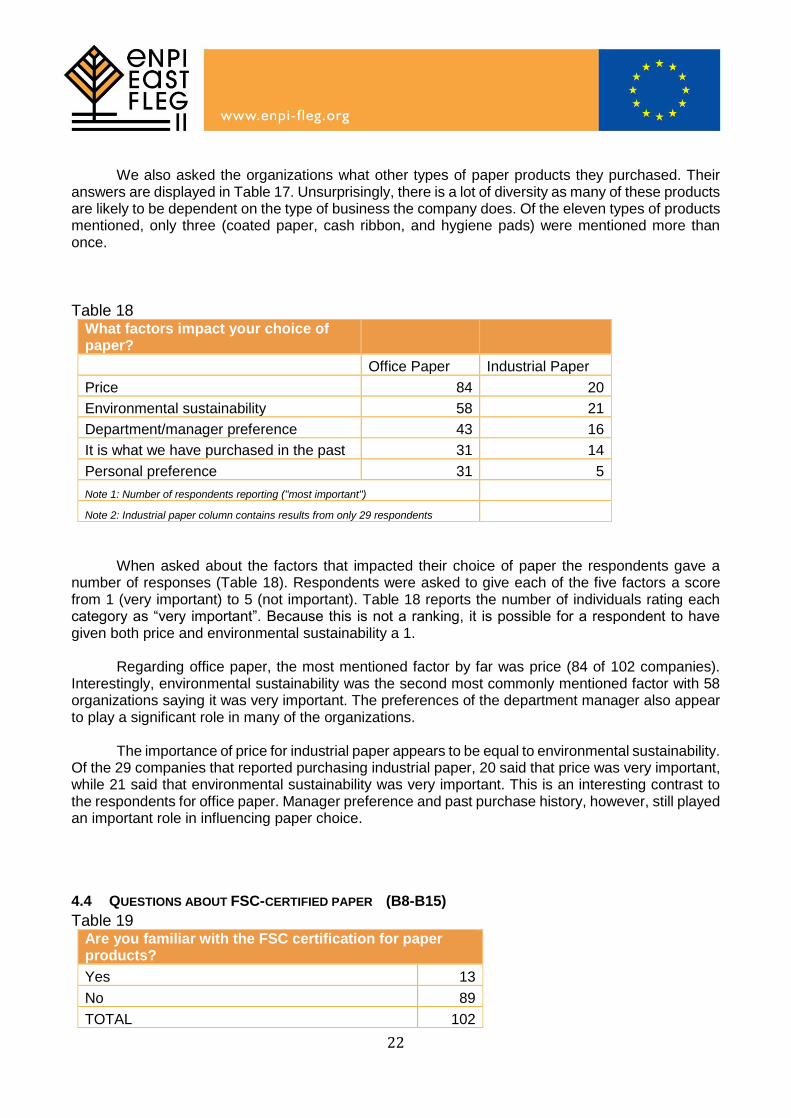
We also asked the organizations what other types of paper products they purchased. Their answers are displayed in Table 17. Unsurprisingly, there is a lot of diversity as many of these products are likely to be dependent on the type of business the company does. Of the eleven types of products mentioned, only three (coated paper, cash ribbon, and hygiene pads) were mentioned more than once.
Table 18 What factors impact your choice of paper?
Office Paper Industrial Paper
Price 84 20
Environmental sustainability 58 21
Department/manager preference 43 16
It is what we have purchased in the past 31 14
Personal preference 31 5
Note 1: Number of respondents reporting ("most important")
Note 2: Industrial paper column contains results from only 29 respondents
When asked about the factors that impacted their choice of paper the respondents gave a
number of responses (Table 18). Respondents were asked to give each of the five factors a score from 1 (very important) to 5 (not important). Table 18 reports the number of individuals rating each category as “very important”. Because this is not a ranking, it is possible for a respondent to have given both price and environmental sustainability a 1.
Regarding office paper, the most mentioned factor by far was price (84 of 102 companies). Interestingly, environmental sustainability was the second most commonly mentioned factor with 58 organizations saying it was very important. The preferences of the department manager also appear to play a significant role in many of the organizations.
The importance of price for industrial paper appears to be equal to environmental sustainability. Of the 29 companies that reported purchasing industrial paper, 20 said that price was very important, while 21 said that environmental sustainability was very important. This is an interesting contrast to the respondents for office paper. Manager preference and past purchase history, however, still played an important role in influencing paper choice.
4.4 QUESTIONS ABOUT FSC-CERTIFIED PAPER (B8-B15)
Table 19 Are you familiar with the FSC certification for paper products?
Yes 13
No 89
TOTAL 102
23
Table 19b
If yes, does your company consume FSC-certified paper products?
Yes 5
No 8
TOTAL 13
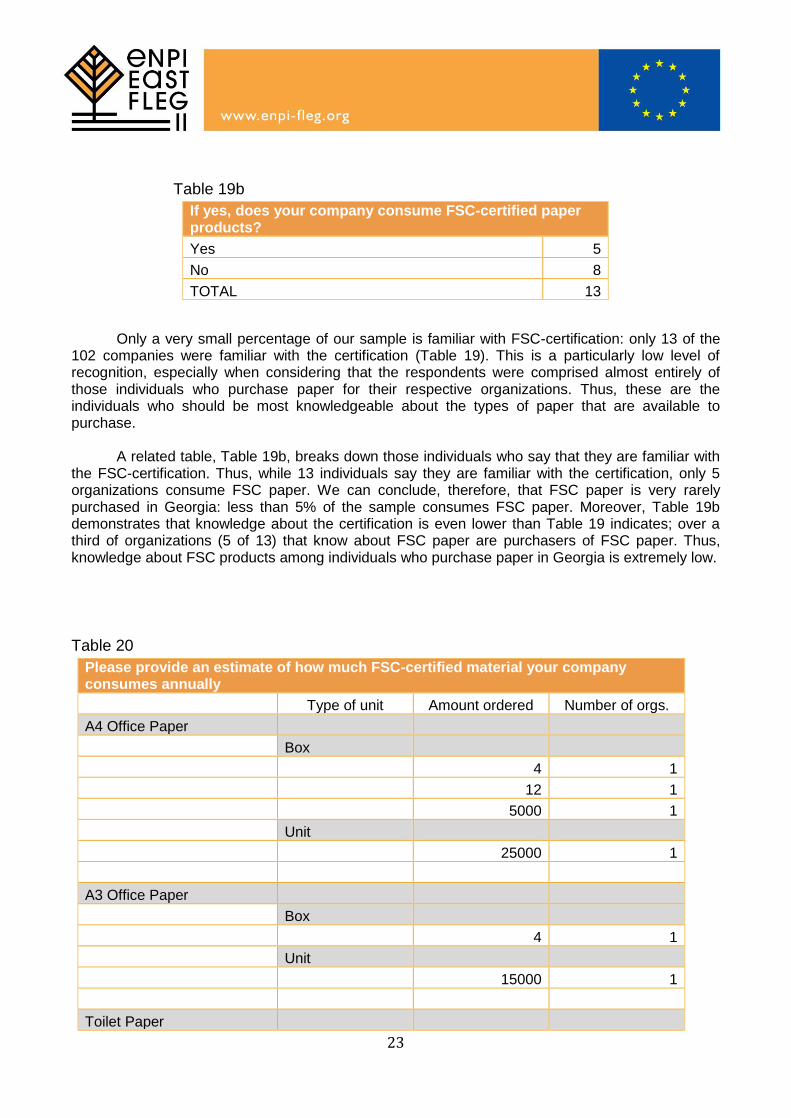
Only a very small percentage of our sample is familiar with FSC-certification: only 13 of the 102 companies were familiar with the certification (Table 19). This is a particularly low level of recognition, especially when considering that the respondents were comprised almost entirely of those individuals who purchase paper for their respective organizations. Thus, these are the individuals who should be most knowledgeable about the types of paper that are available to purchase.
A related table, Table 19b, breaks down those individuals who say that they are familiar with the FSC-certification. Thus, while 13 individuals say they are familiar with the certification, only 5 organizations consume FSC paper. We can conclude, therefore, that FSC paper is very rarely purchased in Georgia: less than 5% of the sample consumes FSC paper. Moreover, Table 19b demonstrates that knowledge about the certification is even lower than Table 19 indicates; over a third of organizations (5 of 13) that know about FSC paper are purchasers of FSC paper. Thus, knowledge about FSC products among individuals who purchase paper in Georgia is extremely low.
Table 20
Please provide an estimate of how much FSC-certified material your company consumes annually
Type of unit Amount ordered Number of orgs.
A4 Office Paper
Box
4 1
12 1
5000 1
Unit
25000 1
A3 Office Paper
Box
4 1
Unit
15000 1
Toilet Paper
24
Please provide an estimate of how much FSC-certified material your company consumes annually
Box
4 1
5 1
Napkins
Box
5 1
Coated Paper
Ton
1000 1
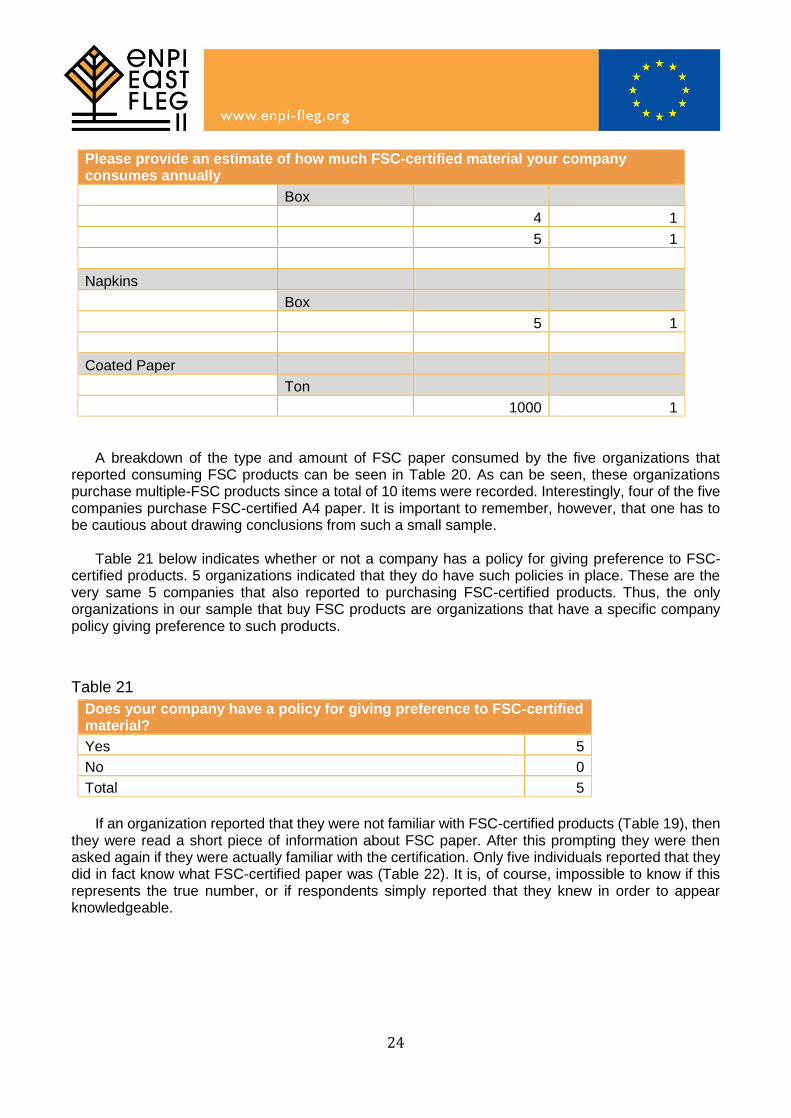
A breakdown of the type and amount of FSC paper consumed by the five organizations that reported consuming FSC products can be seen in Table 20. As can be seen, these organizations purchase multiple-FSC products since a total of 10 items were recorded. Interestingly, four of the five companies purchase FSC-certified A4 paper. It is important to remember, however, that one has to be cautious about drawing conclusions from such a small sample.
Table 21 below indicates whether or not a company has a policy for giving preference to FSC-certified products. 5 organizations indicated that they do have such policies in place. These are the very same 5 companies that also reported to purchasing FSC-certified products. Thus, the only organizations in our sample that buy FSC products are organizations that have a specific company policy giving preference to such products.
Table 21
Does your company have a policy for giving preference to FSC-certified material?
Yes 5
No 0
Total 5
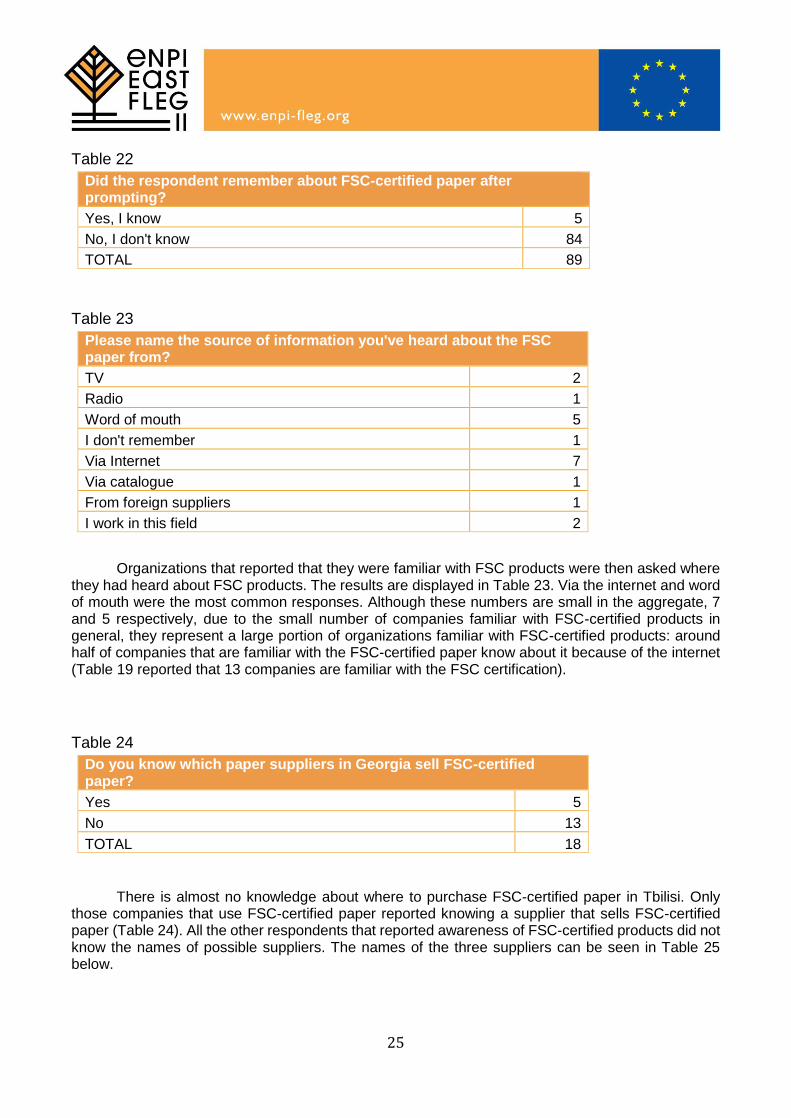
If an organization reported that they were not familiar with FSC-certified products (Table 19), then
they were read a short piece of information about FSC paper. After this prompting they were then asked again if they were actually familiar with the certification. Only five individuals reported that they did in fact know what FSC-certified paper was (Table 22). It is, of course, impossible to know if this represents the true number, or if respondents simply reported that they knew in order to appear knowledgeable.
25
Table 22
Did the respondent remember about FSC-certified paper after prompting?
Yes, I know 5
No, I don't know 84
TOTAL 89
Table 23
Please name the source of information you've heard about the FSC paper from?
TV 2
Radio 1
Word of mouth 5
I don't remember 1
Via Internet 7
Via catalogue 1
From foreign suppliers 1
I work in this field 2
Organizations that reported that they were familiar with FSC products were then asked where
they had heard about FSC products. The results are displayed in Table 23. Via the internet and word of mouth were the most common responses. Although these numbers are small in the aggregate, 7 and 5 respectively, due to the small number of companies familiar with FSC-certified products in general, they represent a large portion of organizations familiar with FSC-certified products: around half of companies that are familiar with the FSC-certified paper know about it because of the internet (Table 19 reported that 13 companies are familiar with the FSC certification).
Table 24
Do you know which paper suppliers in Georgia sell FSC-certified paper?
Yes 5
No 13
TOTAL 18
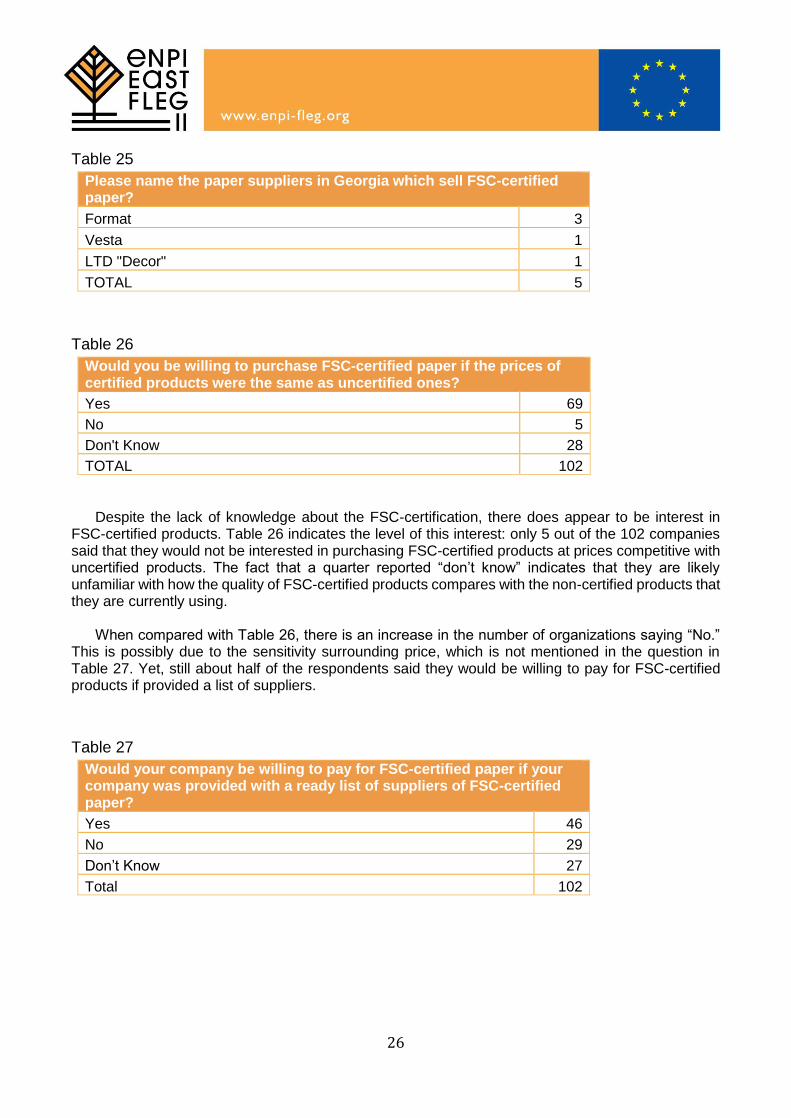
There is almost no knowledge about where to purchase FSC-certified paper in Tbilisi. Only
those companies that use FSC-certified paper reported knowing a supplier that sells FSC-certified paper (Table 24). All the other respondents that reported awareness of FSC-certified products did not know the names of possible suppliers. The names of the three suppliers can be seen in Table 25 below.
26
Table 25
Please name the paper suppliers in Georgia which sell FSC-certified paper?
Format 3
Vesta 1
LTD "Decor" 1
TOTAL 5
Table 26
Would you be willing to purchase FSC-certified paper if the prices of certified products were the same as uncertified ones?
Yes 69
No 5
Don't Know 28
TOTAL 102
Despite the lack of knowledge about the FSC-certification, there does appear to be interest in FSC-certified products. Table 26 indicates the level of this interest: only 5 out of the 102 companies said that they would not be interested in purchasing FSC-certified products at prices competitive with uncertified products. The fact that a quarter reported “don’t know” indicates that they are likely unfamiliar with how the quality of FSC-certified products compares with the non-certified products that they are currently using.
When compared with Table 26, there is an increase in the number of organizations saying “No.”
This is possibly due to the sensitivity surrounding price, which is not mentioned in the question in Table 27. Yet, still about half of the respondents said they would be willing to pay for FSC-certified products if provided a list of suppliers.
Table 27
Would your company be willing to pay for FSC-certified paper if your company was provided with a ready list of suppliers of FSC-certified paper?
Yes 46
No 29
Don’t Know 27
Total 102
27
Table 28
Would your company be willing to pay for FSC-certified paper if your company was provided with training sessions in order to increase paper efficiency free of charge?
Yes 41
No 29
Don't Know 32
Total 102
As indicated in Table 28, there appears to be fairly strong interest in free training sessions to
increase paper efficiency. Only around a third of the organizations (29 of 102) said they were uninterested in such training sessions. Around 40% said they would be willing, with the remainder stating that they didn’t know.
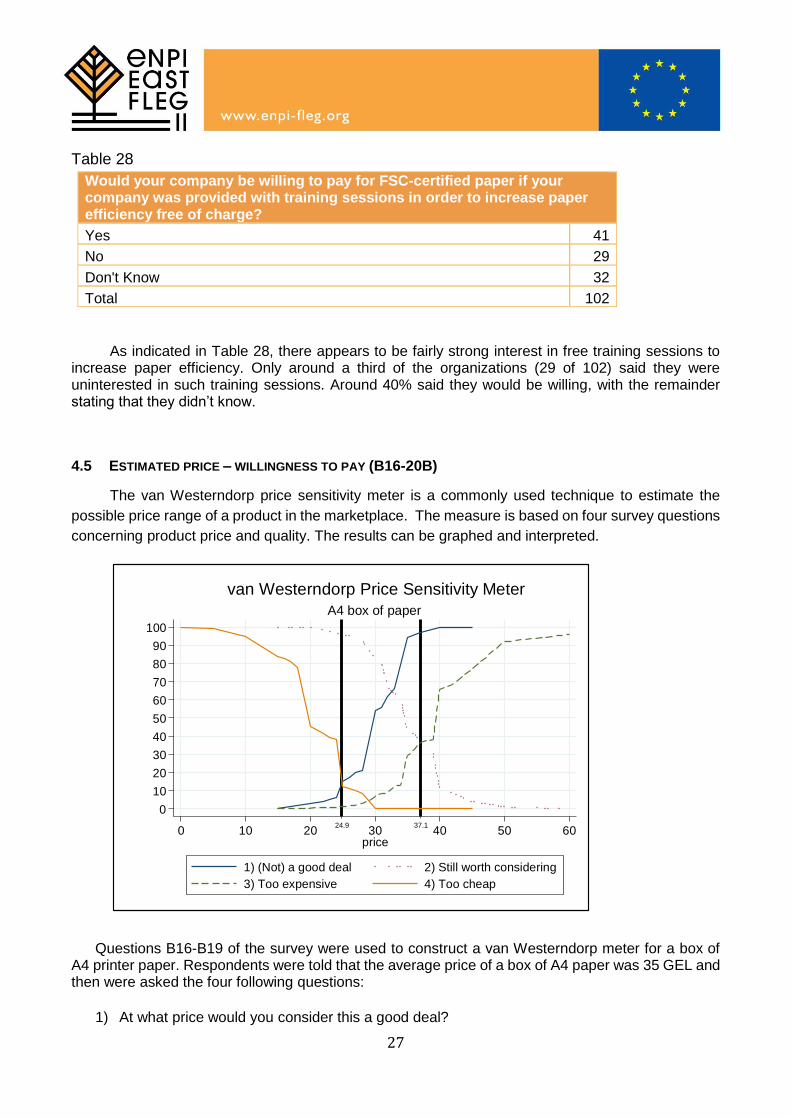
4.5 ESTIMATED PRICE – WILLINGNESS TO PAY (B16-20B)
The van Westerndorp price sensitivity meter is a commonly used technique to estimate the
possible price range of a product in the marketplace. The measure is based on four survey questions
concerning product price and quality. The results can be graphed and interpreted.
Questions B16-B19 of the survey were used to construct a van Westerndorp meter for a box of
A4 printer paper. Respondents were told that the average price of a box of A4 paper was 35 GEL and then were asked the four following questions:
1) At what price would you consider this a good deal?
0
10
20
30
40
50
60
70
80
90
100
cu
mula
tive
perc
enta
ges
24.9 37.10 10 20 30 40 50 60
price
1) (Not) a good deal 2) Still worth considering
3) Too expensive 4) Too cheap
A4 box of paper
van Westerndorp Price Sensitivity Meter
28
2) At what price would it start to get expensive, but still be worth considering?
3) At what price would it be too expensive to consider?
4) At what price would it be so cheap you’d doubt its quality?
The results to the four questions are then graphed with price on the horizontal axis (x-axis) and
the cumulative percent of responses on the vertical axis (y-axis). Two of the cumulative percentages,
questions 1 and 2, are inversed. Thus, for example, line 1 graphs the cumulative percent of
respondents at each price point reporting “not a good deal”. As the price increases, a larger and larger
cumulative percent says that the price is “not a bargain.” At a price of 15 GEL, 100% of respondents
said that a box of A4 FSC-certified paper would be a good deal. At a price of 30 GEL, approximately
46% of respondents said that FSC-certified paper would be a good deal (54%, other the other hand,
say “not a good deal”. This is where line 1 crosses the 30 GEL point). Finally, at a price of 40 GEL,
100% of respondents said that FSC-certified products would not be a good deal.
Line 4, on the other hand, moves in the opposite direction because it asks “At what price would it
be so cheap you’d doubt its quality?” Thus, as the price increases, a smaller percentage of individuals
are likely to doubt the quality. (Ours results show that if the product was free, 100% of respondents
would doubt its quality. At a price of $30, no one doubts the quality.)
When the cumulative percentages of responses to these four questions are graphed, the points
of intersection can give an estimate of a possible price range for the product. The van Westerndorp
Price Sensitivity Measure says that the intersections of lines 1 and 4 produce an estimate of a low-
end price. This value in the graph above is 24.9 GEL. The high end of the price range is found at the
intersection of lines 2 and 3. In the graph above, this value was found to be 37.1 GEL. Thus, the
optimal price range for FSC-certified paper, as measured by the van Westerndorp Price Sensitive
Meter, is between 24.9 GEL and 37.1 GEL.
While the van Westerndorp Price Sensitivity Measure is a commonly used metric in market
research, its results need to be interpreted cautiously. Many factors can influence an individual’s
willingness to pay for a product. For example, in our sample some organizations might stress price
over quality or vice-versa. Thus, while these results can give some insight as to possible market prices
for FSC-certified A4 paper, the price range should not be seen as definitive. This is particularly true if
many of these buyers have price constraints imposed by their organizations.
4.6 ENVIRONMENTAL POLICIES (B21-B25)
Just under a quarter of the organizations in our sample (23 of 102) said that organizations have a
formal environmental policy. Significantly, an even larger number of organizations reported that they didn’t know (26 of 102). This likely means that the companies do not have such a policy or, if they do, it does not have a significant impact on the organization operates.
29
Table 29 Has your company formally adopted environmental policies?
Yes 23
No 53
Don't Know 26
Total 102
Table 30
What kinds of areas are affected by the policies?
Total
Mentioned first
Mentioned second
Mentioned third
Mentioned fourth
Mentioned fifth
Protection of environment 11 8 2 1
Natural resources 3 3
Eco system 3 2 1
Paper processing 3 3
Climate change 2 2
Re-cultivation of forests 2 1 1
Environment protection management 1 1
Energy 1 1
Construction 1 1
Quality of product 1 1
Reduction of CO2 1 1
Cleaning the city adjacent areas 1 1
Hazardous waste disposal 1 1
Eco loans, green funding 1 1
Let's reduce paper consumption 1 1
Installation of waste containment equipment and filters 1 1
Let's switch to the electronic system 1 1
Waste management 1 1
Don't Know 4 4
TOTAL 40 23 9 5 2 1
The 23 companies that reported having a formal environmental policy listed a diverse range of
areas that are covered by the policy. The results can be seen in Table 30 above. The question allowed
30
the respondent to report up to five policies in an open-ended format and, thus, a large variety of responses were recorded. The most commonly reported response was a very vague “protect the environment;” over a quarter of all respondents mentioned this as their first choice and over a third as their second choice. Specific environmental policies were much less frequently mentioned.
Table 31 If your company has not formally adopted environmental policies, do you believe they would be willing to do so?
Yes 44
No 5
Don’t Know 30
TOTAL 79
Of the 79 organizations that reported not having (or not knowing about) company environmental
policies, only 5 mentioned that their company would not be willing to implement such policies. The majority (44 from 79) stated that their organization might be willing to adopt certain policies towards the environment.
Table 32
Would you be interested in learning more about your paper purchasing options?
Yes 91
No 11
Total 102
Table 33
The WWF might be interested in getting in touch with you as the potential buyer of FSC products. Would you agree to us providing them with your contact information?
Yes 68
No 34
Total 102
The majority of companies (91 of 102) unsurprisingly said that they would be interested in learning more about their paper purchasing options. However, only 68 agreed to be contacted by WWF regarding FSC products.
31
About FLEG II (ENPI East) Program The Forest Law Enforcement and Governance (FLEG) II European Neighbourhood and Partnership Instrument (ENPI) East Countries Program supports participating countries’ forest governance. At the regional level, the Program aims to implement the 2005 St. Petersburg FLEG Ministerial Declaration and support countries to commit to a time-bound action plan; at the national level the Program will review or revise forest sector policies and legal and administrative structures; and improve knowledge of and support for sustainable forest management and good forest governance in the participating countries, and at the sub-national (local) level the Program will test and demonstrate best practices for sustainable forest management and the feasibility of improved forest governance practices at the field-level on a pilot basis. Participating countries include Armenia, Azerbaijan, Belarus, Georgia, Moldova, Russia, and Ukraine. The Program is funded by the European Union. http://www.enpi-fleg.org
Project Partner
EUROPEAN COMMISSION The European Union is the world’s largest donor of official development assistance. EuropeAid Development and Cooperation, a Directorate General of the European Commission, is responsible for designing European development policy and delivering aid throughout the world. EuropeAid delivers aid through a set of financial instruments with a focus on ensuring the quality of EU aid and its effectiveness. An active and proactive player in the development field, EuropeAid promotes good governance, human and economic development and tackle universal issues, such as fighting hunger and preserving natural resources. http://ec.europa.eu/index_en.htm
WORLD BANK The World Bank Group is one of the world’s largest sources of knowledge and funding for its 188 member-countries. The organizations that make up the World Bank Group are owned by the governments of member nations, which have the ultimate decision-making power within the organizations on all matters, including policy, financial or membership issues. The World Bank Group comprises five closely associated institutions: the International Bank for Reconstruction and Development (IBRD) and the International Development Association (IDA), which together form the World Bank; the International Finance Corporation (IFC); the Multilateral Investment Guarantee Agency (MIGA); and the International Centre for Settlement of Investment Disputes (ICSID). Each institution plays a distinct role in the World Bank Group’s mission to end extreme poverty by decreasing the percentage of people living on less than $1.25 a day to no more than 3 percent, and promote shared prosperity by fostering the income growth of the bottom 40 percent for every country. For additional information please visit: http://www.worldbank.org, http://www.ifc.org, http://www.miga.org
IUCN IUCN, International Union for Conservation of Nature, helps the world find pragmatic solutions to our most pressing environment and development challenges. IUCN’s work focuses on valuing and conserving nature, ensuring effective and equitable governance of its use, and deploying nature-based solutions to global challenges in climate, food and development. IUCN supports scientific research, manages field projects all over the world, and brings governments, NGOs, the UN and companies together to develop policy, laws and best practice. IUCN is the world’s oldest and largest global environmental organisation, with more than 1,200 government and NGO members and almost 11,000 volunteer experts in some 160 countries. IUCN’s work is supported by over 1,000 staff in 45 offices and hundreds of partners in public, NGO and private sectors around the world. www.iucn.org
WWF WWF is one of the world’s largest and most respected independent conservation organizations, with almost 5 million supporters and a global network active in over 100 countries. WWF’s mission is to stop the degradation of the planet ’s natural environment and to build a future in which humans live in harmony with nature, by conserving the world ’s biological diversity, ensuring that the use of renewable natural resources is sustainable, and promoting the reduction of pollution and wasteful consumption. www.panda.org