predictors for growth mindset and sense of belonging in ... · growth mindset, students make...
TRANSCRIPT

Predictors for Growth Mindset and Sense of Belonging in College Students
Sara L. CookCollege of Education, Science, and
MathematicsViterbo University
Brenda L. MurrayDepartment of Economics
University of Wisconsin – La Crosse
Sloan KomissarovWestern Technical College
James M. Murray1
Department of EconomicsUniversity of Wisconsin – La Crosse
May 31, 2017
Abstract:
Mindset and sense of belonging are important predictors for college student success. Mindsetrefers to beliefs on how or whether intelligence can grow with time and effort. Belonging refersto students' sense of being respected and supported in their college environment. We measureseveral dimensions of mindset and belonging and educational and demographic backgroundinformation for more than 2,000 students at two four-year universities including a public and aprivate university. We estimate factor analysis models to construct measures for mindset andbelonging and we explore predictors for these including educational and demographiccharacteristics and frequency of instructor feedback to students. We find that formativeinstructor feedback on writing leads to improvements in mindset, belonging, perseverance, andconfidence. We also find that frequent feedback on writing improves students’ mindsetregarding mathematics. We also find explanatory power from semesters in college, parents'educational attainment, race, and students' chosen fields of study. Keywords: Mindset, belonging, student writing, feedback, regression
1 Corresponding author. Email: [email protected]. Address: 1725 State St., La Crosse, WI 54601

1 Introduction We explore predictors for attitudes in college students that influence success, including mindset, sense of
belonging, confidence, and perseverance; and we identify an opportunity for all instructors to positively
influence these.
Dweck (1999) defines mindset as one’s “self-theories” or self-perceptions of how learning works
and what it means for their potential. People with a fixed mindset have the attitude that some people are
naturally good at some skills and others are not. People with a fixed mindset fail to appreciate the
potential that expending effort can have for improving or learning new skills. Confronted with challenges,
these people are more likely to fall into a trap of self-defeating helplessness. People with a growth
mindset view intelligence as malleable. They recognize that putting forth effort in the face of challenges
can lead to improvement in their knowledge and skills.
Dweck (1999), Blackwell et al. (2007), and Aditomo (2015), and others find that a growth mindset
helps prevent drops in motivation and leads to an increase in student effort in the face of setbacks.
Aronson et al. (2002) and Dweck (2015) find where classroom interventions are used to encourage a
growth mindset, students make greater gains in academic achievement, especially among students at risk
of lower academic achievement.
Mindset also influences the impact that instructor feedback has on student performance. Mangels
et al. (2006) measure electrophysiological responses in the brain in response to corrective instructor
feedback and finds evidence that individuals with a fixed mindset have less memory-related activity in
response to the feedback than individuals with a growth mindset. They also find that people with a fixed
mindset had feelings of worry regarding proving themselves relative to their peers. Aditomo (2015)
focuses on an undergraduate statistics course and finds that students with growth mindsets were more
likely than those with fixed mindsets to succeed and less likely to lose motivation in the event of a setback
in their exam grades. These findings are consistent with conclusions by Martin (2006) and (2011), and
Martin and Liem (2010) that show students respond positively to performance goals that are framed as
outperforming their own previous efforts.
Sense of belonging can commonly be described as a student’s perception that he or she is
accepted, respected, and encouraged by both peers and faculty in the academic setting. As Goodenow
(1993) describes it, a student that has a strong sense of belonging likely feels that he or she is a member of
a community and feels connected with and supported by others within that community. Strayhorn (2012)
describes having a sense of belonging as a basic human need that must be met before higher order goals
can be achieved, such as attainment of knowledge in an academic setting.
1

Hausmann et al. (2007) demonstrate that sense of belonging in first year college students
influences a number of academic outcomes including retention, persistence, and achievement. Strayhorn
(2012) describes an interdependent relationship between belonging and academic and social involvement,
each enhancing the other, or a lack in each having a detrimental effect on the other. Long and Ostrove
(2007) show that students lacking a sense of belonging are less likely to participate in class and less
willing to seek help from faculty or other resources on campus, which may negatively impact academic
outcomes. However, Carter and Hurtado (1997) find that among Latino students, sense of belonging is not
related to GPA, even though involvement in academic activities such as discussing course content with
others outside of class can improve a student’s sense of belonging.
Multiple demographic factors, including race, gender, and parents’ education, have been shown to
influence sense of belonging among college students. Carteer and Hurtado (1997) find that sense of
belonging is an especially important factor in academic success among students who may perceive
themselves as outside the mainstream student population, such as students of color at predominantly white
institutions, and female students in science, technology, math, and engineering programs. Long and
Ostrove (2007) find that students from working class backgrounds tend to have a lower sense of belonging
that those from higher social class backgrounds where parents have higher levels of both income and
education.
Aside from demographic factors, university-level relationships and interactions can also affect
students’ sense of belonging on campus. Andermann et al. (2007) and Hoffman et al. (2002) find that
instructor support improves students’ sense of belonging. Carter and Hurtado (1997) conclude that
frequency of talking with faculty and others about course content and faculty interest in student
development have positive effects on sense of belonging.
The purpose of this paper is to identify demographic and educational factors that influence
mindset, belonging, and related attitudes on learning including confidence and perseverance. We further
identify whether a common form of student-instructor interaction can improve these this attitudes. We
focus specifically on formative instructor feedback on writing, specifically early drafts of writing before a
grade for the work is assigned. This is one type of instructor-student interaction that is highly
personalized for students, that occurs throughout the curriculum, and that is present in nearly all
disciplines and every level of post-secondary education. The literature above suggests that interactions of
this nature should positively influence both mindset and sense of belonging in college students. Using
results of a survey from approximately 2,000 students at two Midwestern universities, one public regional
comprehensive university and one private liberal-arts university, we find robust evidence that this is true.
Giving feedback on early drafts of writing is a practice that nearly all instructors have some experience
2
with and that many instructors can afford to enhance in their classes. We find strong evidence that this
simple intervention, even if time consuming, can lead to an improvement in many attitudes related to
learning.
The results of the paper are further useful to instructors in identifying sub-populations of students
that are associated with better or worse attitudes to learning. We reach much of the same conclusions as
the literature on belonging that students of color and first generation students have a lesser sense of
belonging than their peers. While we fail to find evidence for a difference between sense of belonging
among students at our public university versus our private university, we do find significant interaction of a
positive effect between the private school and first-generation students. That is, while we find that first-
generation students have a lesser sense of belonging in college than their peers, the sense of belonging
among first-generation students, specifically, is better at the smaller, private university. We find some
mixed evidence that race and parents’ education influence mindset, but rather than finding typically at-risk
student populations at risk for worse attitudes, we find some evidence that first-generation students and
racial minorities mindset that leans more toward growth than their peers.
In the next section of this paper we discuss the survey and sample; the outcome variables related
to mindset, belonging, confidence, and perseverance; and the explanatory variables that may influence
these. We also use the results from our several survey questions related to mindset and belonging to
construct broad measures for underlying factors influencing mindset and belonging. In Section 3 we
estimate and discuss a number of regression models to answer how feedback and demographic and
educational characteristics influence mindset, belonging, confidence, and perseverance. In Section 4 we
conclude.
2 Survey and DataWe measured mindset, belonging, and other attitudes important for learning using a survey administered in
Spring 2017 to all undergraduate students in traditional programs at the University of Wisconsin – La
Crosse (UWL) and Viterbo University. UWL is a public, regional comprehensive university comprised of
approximately 10,000 undergraduate students and 800 graduate students. Viterbo University is a smaller,
private, Catholic university with a liberal arts tradition with approximately 2,000 undergraduate students
and 800 graduate students. Both universities are in La Crosse, Wisconsin and serve the predominately the
same geographical area, with a large portion of students at both Universities coming from the state of
Wisconsin. In addition to being a smaller university, Viterbo University enjoys a smaller student-faculty
ratio (Viterbo is 11:1 vs UW La Crosse is 19:1) and smaller average class size (Viterbo is 16 vs UWL is
3
28). We expect these institutional differences may lead to differences in learning and attitudes, and we
investigate some of these possibilities below.
The survey included questions on attitudes related to mindset, belong, confidence, and
perseverance; educational and demographic background; and a question relating to instructor feedback on
writing. There were 2,305 survey submissions with complete responses to questions nine questions on
attitudes related to mindset, belonging, perseverance, and confidence, corresponding to an approximately
20% response rate.
2.1 Mindset
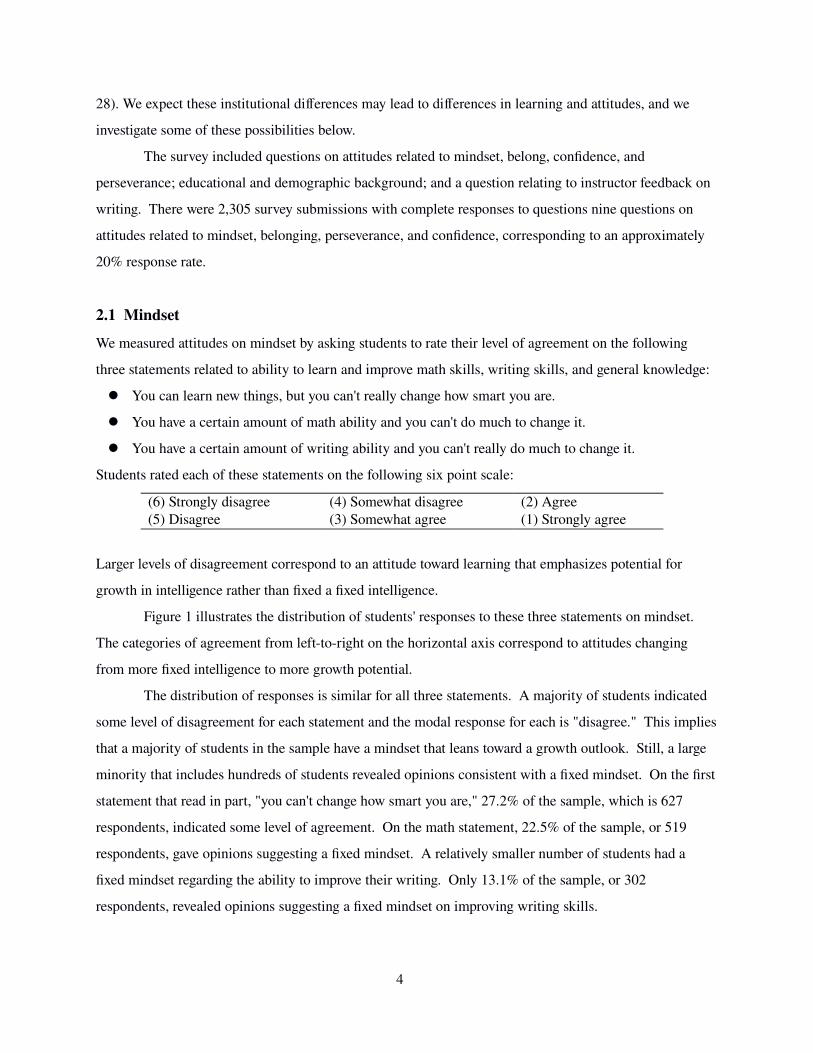
We measured attitudes on mindset by asking students to rate their level of agreement on the following
three statements related to ability to learn and improve math skills, writing skills, and general knowledge:
You can learn new things, but you can't really change how smart you are.
You have a certain amount of math ability and you can't do much to change it.
You have a certain amount of writing ability and you can't really do much to change it.
Students rated each of these statements on the following six point scale:
(6) Strongly disagree (4) Somewhat disagree (2) Agree(5) Disagree (3) Somewhat agree (1) Strongly agree
Larger levels of disagreement correspond to an attitude toward learning that emphasizes potential for
growth in intelligence rather than fixed a fixed intelligence.
Figure 1 illustrates the distribution of students' responses to these three statements on mindset.
The categories of agreement from left-to-right on the horizontal axis correspond to attitudes changing
from more fixed intelligence to more growth potential.
The distribution of responses is similar for all three statements. A majority of students indicated
some level of disagreement for each statement and the modal response for each is "disagree." This implies
that a majority of students in the sample have a mindset that leans toward a growth outlook. Still, a large
minority that includes hundreds of students revealed opinions consistent with a fixed mindset. On the first
statement that read in part, "you can't change how smart you are," 27.2% of the sample, which is 627
respondents, indicated some level of agreement. On the math statement, 22.5% of the sample, or 519
respondents, gave opinions suggesting a fixed mindset. A relatively smaller number of students had a
fixed mindset regarding the ability to improve their writing. Only 13.1% of the sample, or 302
respondents, revealed opinions suggesting a fixed mindset on improving writing skills.
4

[FIGURE 1 ABOUT HERE]
We construct an overall measure of mindset by estimating a factor analysis with one factor. Since
we have ordinal data, we estimate the factor analysis by decomposing the Spearman correlation matrix and
construct the scores using the Bartlett weighted least squares method with the standardized ranks of the
data as the dependent variable. We order the categories so that low ranks are associated with a fixed
mindset and high ranks are associated with a growth mindset. The common factor is normalized to have
zero mean and unit standard deviation.
[TABLE 1 ABOUT HERE]
[FIGURE 2 ABOUT HERE]
The results of the factor analysis are presented in Table 1. The factor loadings for all three
variables are between 0.7 and 0.87 indicating a high degree of correlation between the three mindset
variables and the common factor. The percentage of variability in the three mindset variables that is
explained by the single common factor is 62.2%. The uniqueness statistics describe the percentage of the
variability in each individual mindset variable that is not explained by the common factor. With values for
uniqueness between 0.24 and 0.51, between 50%-75% of the variability in individual mindset variables is
explained by our common measure for mindset.
Figure 2 illustrates the relationship between each of the individual mindset variables and the
common factor. The visual confirms that the individual mindset variables are highly correlated with our
constructed single measure for growth mindset.
2.2 Belonging
We measured attitudes on belonging by asking students to rate their level of agreement on the following
four statements:
I belong in college.
I can be myself in college.
I am supported by my peers.
I am respected by faculty.
Students rated each of these statements on the following five point scale:
(1) Not at all true (3) Somewhat true (5) Completely true(2) A little true (4) Mostly true
Figure 3 illustrates the distribution of responses to these statements of belonging. Regarding every
statement, a majority of students indicated a high sense of belonging. Especially high is the feeling that
5

students are respected by faculty. There is the most variability in students' responses to feeling supported
by their peers. Still, a sizable minority that includes hundreds of students gave responses that indicate
feelings of not belonging. Approximately 23.9% of the sample, or 550 students, responded with one of the
lower levels of agreement to the question of being supported by their peers. For the most general
statement on whether the student feels they belong in college, 19.4% of the sample, or 447 students,
responded with one of the lower levels of agreement.
[FIGURE 3 ABOUT HERE]
Like in the previous subsection, we construct a common measure of belonging by estimating a
factor analysis allowing for one common factor to explain these four belonging variables. Again, because
the variables are measured on an ordinal scale, we use the decomposition of the Spearman correlation
matrix and estimate the common factor by Bartlett weighted least squares of the factor loadings on the
standardized ranks.
[TABLE 2 ABOUT HERE]
Table 2 shows the results of the factor analysis. Approximately half of the variability in responses
to the four belonging questions can be explained by a single common factor. The factor loadings reveal the
common factor best explains reactions to the statements on being supported by peers and ability to be
oneself. The likelihood ratio goodness of fit test is statistically significant. The null hypothesis is that the
one common factor explains all of the variability of all four variables. This implies that while the estimate
for common factor is a useful overall metric for sense of belonging, it fails to fully incorporate all of the
variability in the various aspects of belonging. In the analysis below, we examine predictors for both the
common factor for belonging and the individual belonging variables.
[FIGURE 4 ABOUT HERE]
Figure 4 illustrates the relationship between the individual belonging variables and the common
factor. The visual confirms that there is a high degree of correlation of the belonging variables to the
common factor, and also that there is some variability in the responses to the individual belonging
questions which is not completely explained by the one common factor.
2.3 Confidence and Perseverance
We also measured attitudes on confidence and perseverance by asking students to rate the following two
statements:
6
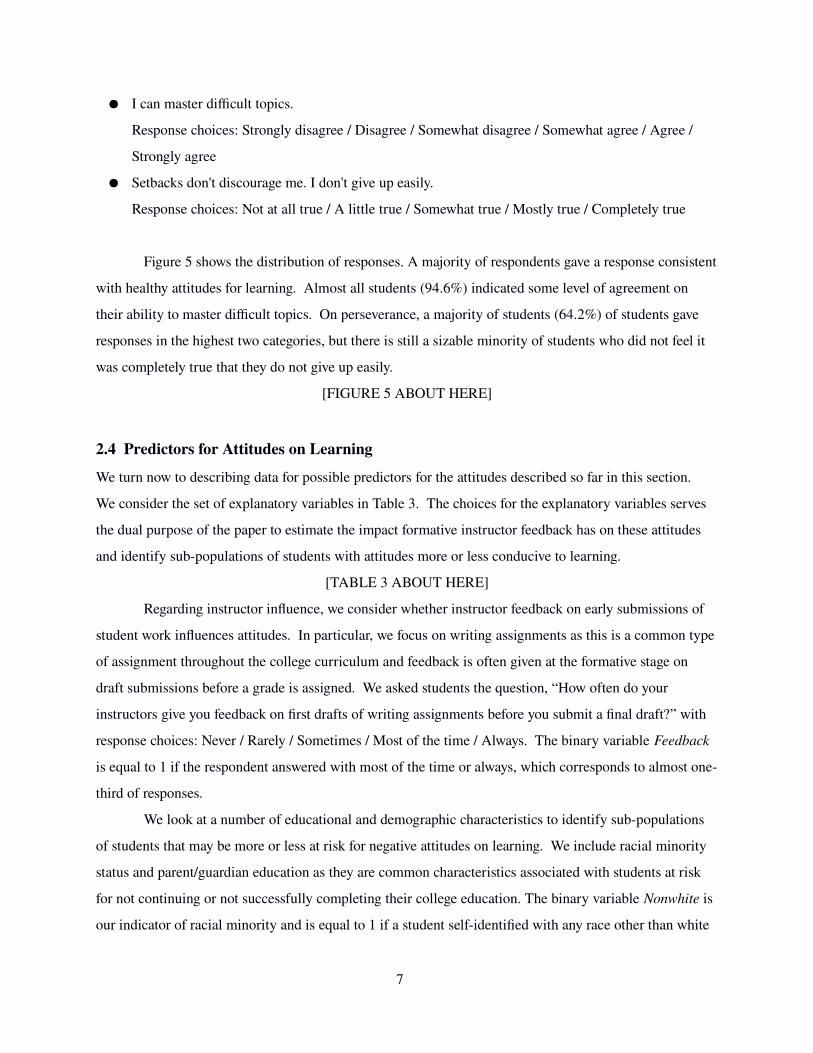
● I can master difficult topics.
Response choices: Strongly disagree / Disagree / Somewhat disagree / Somewhat agree / Agree /
Strongly agree
● Setbacks don't discourage me. I don't give up easily.
Response choices: Not at all true / A little true / Somewhat true / Mostly true / Completely true
Figure 5 shows the distribution of responses. A majority of respondents gave a response consistent
with healthy attitudes for learning. Almost all students (94.6%) indicated some level of agreement on
their ability to master difficult topics. On perseverance, a majority of students (64.2%) of students gave
responses in the highest two categories, but there is still a sizable minority of students who did not feel it
was completely true that they do not give up easily.
[FIGURE 5 ABOUT HERE]
2.4 Predictors for Attitudes on Learning
We turn now to describing data for possible predictors for the attitudes described so far in this section.
We consider the set of explanatory variables in Table 3. The choices for the explanatory variables serves
the dual purpose of the paper to estimate the impact formative instructor feedback has on these attitudes
and identify sub-populations of students with attitudes more or less conducive to learning.
[TABLE 3 ABOUT HERE]
Regarding instructor influence, we consider whether instructor feedback on early submissions of
student work influences attitudes. In particular, we focus on writing assignments as this is a common type
of assignment throughout the college curriculum and feedback is often given at the formative stage on
draft submissions before a grade is assigned. We asked students the question, “How often do your
instructors give you feedback on first drafts of writing assignments before you submit a final draft?” with
response choices: Never / Rarely / Sometimes / Most of the time / Always. The binary variable Feedback
is equal to 1 if the respondent answered with most of the time or always, which corresponds to almost one-
third of responses.
We look at a number of educational and demographic characteristics to identify sub-populations
of students that may be more or less at risk for negative attitudes on learning. We include racial minority
status and parent/guardian education as they are common characteristics associated with students at risk
for not continuing or not successfully completing their college education. The binary variable Nonwhite is
our indicator of racial minority and is equal to 1 if a student self-identified with any race other than white
7

or identified with multiple races, possibly also including white, and 0 otherwise. Both institutions in this
study have a large majority white / Caucasian population, with only 7.7% of students identifying with
another race.
Parent or guardian education is split into two binary variables, ParentNoCollege and ParentGrad.
ParentNoCollege is equal to 1 if the highest level of education of the any of the student's parents or
guardians is at most high school diploma or equivalent and is equal to 0 otherwise. ParentGrad is equal to
1 if the same response for parent or guardian education includes a graduate degree (Master degree or
above) and is equal to 0 otherwise. The baseline category, when both of these are equal to zero,
corresponds to students that have parents or guardians with some college education experience, including
those with or without a college degree and may include a two- or four-year degree. About 11% of the
sample are first-generation students whose parents or guardians have no college experience. About 24%
of the sample are students whose parents or guardians have graduate degrees.
We measure prior educational success with two variables, ACT and HSBelowAvg. ACT is equal to
the student's score on the ACT College Readiness Exam2. The average response for this test score, 25.2, is
slightly higher than the populations of the two schools. The average ACT score of all students at Viterbo
is 21 and of all students at UWL is 24. HSBelowAvg is a binary variable equal to 1 if a student identified
themselves as having performed below average in high school compared to their peers.
Other educational characteristics we consider is how much college experience the students had at
the point of completing the survey, what field their major or intended major is in, and which institution the
student is attending. CreditCat is equal to the number full-time equivalent semesters (15 credits = 1
semester) the student has already completed. Field of study is measured with three binary variables that
identify students with a major in education (EduMajor); majors in the related to liberal studies, arts, or
social sciences (LiberalStudMajor); and majors related to science, mathematics, or technology
(ScienceMajor). The baseline category, when all three of these binary variables are equal to zero, is the
major related to business administration. The binary variable Private is equal to 1 if the student is
attending the private institution, Viterbo University, and is equal to 0 if the student is attending the public
institution, UWL. Since Viterbo University has a smaller population of students, it is a smaller proportion
of our sample (18.2%).
Finally, we consider two additional demographic characteristics, gender (Female) and age (Age).
While both institutions have larger proportions of females than males (57% at UWL and 75% female at
2 As is true at many Midwestern universities, most students have taken the ACT exam rather than the College Board's SAT exam. In the present study, 1,904 respondents gave non-empty responses for the ACT question.
8

Viterbo), females responded to the survey in higher proportions leading to 73.4% of respondents
identifying as female.
3 ResultsWe turn now to estimate the prediction power that the instructional, educational and demographic
variables have on students attitudes regarding mindset, sense of belonging, perseverance, and confidence.
3.1 Mindset
Table 4 presents regression results for the mindset common factor and the individual mindset questions
regarding ability to learn new things, improve in math, and improve in writing. The first pair of columns
correspond to estimates from ordinary least squares on the common factor, since this dependent variable is
constructed as a ratio variable with zero mean and unit standard deviation. The next three pairs of
columns are results from ordinal regressions with the ordinal dependent variables that measure level of
agreement on statements suggesting a fixed mindset. For all models, positive coefficients correspond to
attitudes that lean more toward a growth mindset.
[TABLE 4 ABOUT HERE]
In all the regressions, we include all the explanatory variables from the previous subsection and
consider also the interaction effect of the private institution and the binary variable identifying students
whose parents have no college education experience. There are multiple reasons why this interaction
could be important. First, Stewart and Ostrove (1993) suggests that students from a less-privileged
background may be more likely to suffer from a poor sense of belonging at private institutions, whose
student populations may be from primarily middle- to upper-class. It is also possible the interaction effect
works in the opposite direction. Viterbo University is a smaller institution with smaller class sizes. There
is also a widespread and deliberate effort by instructors and administrators to instill a sense of identity
consistent with the Catholic Franciscan values on which the school was founded, which may influence
attitudes on learning and sense of belonging.
We also examined several other possibilities for interaction effects among Feedback, Private,
Nonwhite, and ParentNoCollege, but these other interaction effects were not statistically significant for any
of the dependent variables considered in this paper.
The two non-binary explanatory variables, ACT and Age, are expressed in logs and standardized,
so that the coefficients on the regressions on the mindset and belonging common factors can be interpreted
as the marginal effect of a one-standard deviation increase in the log transformed variable.
9

The Feedback variable is statistically significant and positive in all models. When instructors give
frequent feedback, students’ attitudes improve regarding the potential for growth in learning. It is
particularly interesting that the coefficient on Feedback is even positive and statistically significant for the
ordinal regression on math ability (at the 10% level). When students receive more feedback on their
writing, they even develop attitudes towards growth potential regarding their ability to improve their math
knowledge and skills. The impact that instructor feedback has on mindset goes beyond their courses or
their fields. Simple instructor feedback can instill a healthy belief in students they are capable of learning
and improvement in even unrelated courses and fields.
Parents’ level of education has an interesting impact on belonging. The binary variables,
ParentNoCollege and ParentGrad are each equal to 1 if the highest level of education by either parent
includes no college and graduate degrees, respectively. The comparison group (when both binary
variables are equal to zero) is parents with some college education, including possibly a four year college
degree. The coefficients on both of these variables are positive in all regression models, and statistically
significant at the 10% level for the ordinal outcome variables regarding opinions on being able to learn
new things (Intelligence) and improve math skills (Math ability).3 Relative to students whose parents’
education is limited to undergraduate college experience, students have more of a growth mindset if their
parents either have no college experience, or advanced college experience. While there is evidence that
first generation students are at risk for lower college performance and lower retention rates (see for
example Ishitani (2002) and (2006)), we find that first generation students have on average a mindset that
leans more toward growth than many of their peers. It is also true that students whose parents have
completed graduate degrees have on average more of a growth mindset than their peers whose parents
educational experience is limited to undergraduate school.
The coefficient on ACT is positive and statistically significant in three of the four regressions, so
students who performed better on the college entrance exam are likely to have attitudes leaning more to a
growth mindset. Age is also positive and statistically significant in three of the four regressions which
implies that as students mature they are likely to have attitudes leaning more to a growth mindset.
Students’ chosen field is a significant predictor for mindset. We categorized students’ majors into
four fields: business (the baseline case), education, liberal studies, and science and health. The
coefficients on EduMajor and ScienceMajor are both positive and statistically significant across all
regressions meaning these students have attitudes that lean more toward growth mindset than business
3 When the interaction effect of ParentNoCollege x Private is excluded from the regressions, the coefficient on ParentNoCollege is positive and statistically significant at the 5% level for the regressions on Common Factor, Intelligence, and Math Ability.
10

majors. The coefficient on LiberalStudMajor is positive and statistically significant only in the ordinal
regression on writing ability, indicating that relative to business majors, liberal studies majors have a
healthier attitude on their ability to improve writing skills, though not necessarily other skills.
We find statistical evidence that race influences mindset only regarding writing. The coefficient
on Nonwhite in the regression on Writing Ability is positive and statistically significant, meaning that
nonwhite students lean more toward a growth mindset for the potential to improve their writing than their
white peers. In all other regressions on mindset, Nonwhite is not statistically significant. While several
other studies reveal that minority students are at risk for lower rates of retention (see for example,
DeAngelo et al. (2010) and Change et al. (2014)) and another study prescribes educational interventions to
improve mindset focusing mostly on minorities (Blackwell et al. (2007)), we do not find that racial
minorities are at an advantage in terms of mindset, and at least regarding writing potential, they may be at
an advantage.
[TABLE 5 ABOUT HERE]
3.2 Belonging
Table 5 presents regression results for the belonging common factor and the individual belonging
questions. We estimate the impact of the same set of explanatory variables on our constructed common
factor for belonging and on the responses for the individual questions on sense of belonging, including an
overall sense (agreement to statement ‘I feel like I belong in college), comfort in being oneself, feeling of
supported by peers, and feeling of being respected by faculty. The regression results for the common
factor are from ordinary least squares and all other regressions are results ordinal logistic regressions.
Feedback is positive and statistically significant in all regressions, which again implies that all
instructors have the power to positively influence students’ students attitudes and morale by simply
enhancing part of their regular job: giving students feedback on early drafts of work. We find that giving
students early feedback on writing improves their sense of belonging in college, their sense of being
supported by their peers, and not surprisingly, their sense of being respected by faculty.
Nonwhite and ParentNoCollege are both negative and statistically significant in all regressions,
implying that these traditionally at-risk populations for low retention suffer from lower sense of belonging
than their peers.
CreditCat is positive and statistically significant in three of the five regressions (and not
statistically significant in the others) revealing that overall sense of belonging and feeling of support by
peers improves as students accumulate more college experience. There is not evidence, though, and
11

students’ comfort in being themselves and feeling of respect by faculty change as students progress in their
college careers.
Finally, the interaction term between Private and ParentNoCollege is positive and statistically
significant for the regressions on the common factor for belonging and the sense of support from peers.
This implies we have some limited evidence that first-generation students have a higher sense of belonging
and peer support at the smaller, private, liberal arts university than the relatively larger, public university.
[TABLE 6 ABOUT HERE]
3.3 Confidence and Perseverance
Table 6 presents ordinal logistic regression results for the questions on confidence (level of agreement with
‘I can master difficult topics’) and perseverance (level of agreement on ‘I don’t give up easily’). Again,
feedback is positive and statistically significant in both regressions, indicating yet more dimensions where
instructor feedback positively influences students attitudes on learning.
Female is negative and statistically significant in both regressions. While we failed to find
evidence that gender was related to mindset or sense of belonging, we do find evidence that female college
students have on average less confidence than males in their ability to master difficult subjects, and they do
not agree as much with the statement that they do not give up easily.
Regarding parent education and confidence the coefficient on ParentGrad is positive and
statistically significant, which ParentNoCollege is not statistically significantly different from zero, which
implies that students with parents that have advanced degrees display more confidence than their peers,
but there is no difference between students whose parents have no college education and those with some
college education (including undergraduate degrees)
ACT and HSBelowAvg are both positive and statistically significantly explain confidence.
HSBelowAvg is equal to one when students believe they under-performed their peers in high school. Both
of these coefficients positive implies that students that performed better on the ACT college readiness
exam have relatively higher confidence, but it is also true, that holding ACT scores constant, students that
under-performed relative to their peers in high school have greater confidence in college. It is admittedly
difficult to understand what explains these relationships or what use this information could have for
instructors and administrators to identify students with low confidence.
HSBelowAvg is negative and statistically significant for perseverance, which indicates that
students who feel like they under-performed relative to their peers are more likely to give up on time
consuming or difficult tasks.
12

4 ConclusionUsing a survey of more than 2,000 undergraduate students at public and private Midwestern universities,
we find robust evidence that instructor feedback on student writing has a positive impact on students’
mindset, sense of belonging, confidence, and perseverance; all which are important attitudes toward
learning that others have shown lead to better academic performance and retention. We specifically focus
on instructor feedback on early drafts of writing assignments, before grades are assigned, to focus on the
impact of formative, rather than summative, feedback. This is also a type of feedback that is used by
instructors throughout the college curriculum.
We also find useful evidence for instructors identifying demographic and educational
characteristics that are associated with mindset, belonging, confidence, and retention. We confirm much
of the results in the belonging literature that first-generation students and racial minorities suffer from a
lower sense of belonging. Regarding mindset, we fail to find evidence that racial minorities or first-
generation students are at a disadvantage, and actually find cases where these typically at-risk populations
have more positive attitudes toward learning than their peers.
The findings of the paper should be immediately useful for instructors to inform them of the
benefits that formative feedback on writing can have on student attitudes and help them identify sub-
populations that may be in greater need of this kind of intervention.
13

ReferencesAditomo, A. (2015). Students’ response to academic setback: “Growth mindset” as a buffer against demotivation. International Journal of Educational Psychology,4(2), 198-222.
Anderman, L.H., Freeman, T.M., Jensen, J.M. (2007) Sense of Belonging in College Freshmen at the Classroom and Campus Levels. The Journal of Experimental Education 75(3), 203-220.
Carter, F.C., Hurtado, S. (1997). Effects of College Transition and Perceptions of the Campus Racial Climate on Latino College Students’ Sense of Belonging. Sociology of Education, 70(4), 324-345.
Blackwell, L., Trzesniewski, K., & Dweck, C. S. (2007). Implicit theories of intelligence predict achievement across an adolescent transition: A longitudinal study and an intervention. Child Development, 78, 246–263.
Chang, M. J., Sharkness, J., Hurtado S., and Newman, C. B. (2014). What matters in college for retaining aspiring scientists and engineers from underrepresented racial groups. Journal of Research in Science Teaching. 51(5):555-580.
DeAngelo, L., Franke, R., Hurtado, S., Pryor, J. H., and Tran, S. (2011). Completing college: Assessing graduation rates at four-year institutions. Los Angeles: Higher Education Research Institute, UCLA.
Dweck, C. S. (1999). Self-theories: Their role in motivation, personality, and development. Philadelphia, PA: Taylor & Francis.
Dweck, C.S. (2015). Growth. British Journal of Educational Psychology (2015), 85, 242–245.
Good, C., Aronson, J. A., and Inzlicht, M. (2003). Improving adolescents’ standardized test performance: An intervention to reduce the effects of stereotype threat. Journal of Applied Developmental Psychology, 24, 645–662.
Good, C., Rattan, A., & Dweck, C. S. (2012). Why do women opt out? Sense of belonging and women’s representation in mathematics. Journal of Personality and Social Psychology, 102, 700–717.
Goodenow, C. (1993). The psychological sense of school membership among adolescents: Scale development and education correlates. Psychology of Schools 30(1). 79-90.
Hoffman, M., Morrow, J., Richmond, J., and Salomone, K. (2002). Investigating “sense of belonging” in first-year college students. Journal of College Student Retention 4(3). 227-256.
Hausmann, L.R.M., Schofield, J.W., and Woods, R.L. (2007). Sense of belonging as a predictor of intentions to persist among African American and White first-year college students. Research in Higher Education 48(7), 803-839.
Ishitani, T. T. (2002). A longitudinal approach to assessing attrition behavior among first-generation students: Time varying effects of pre-college characteristics. Research in Higher Education. 44(4): 433- 449.
Ishitani, T. T. (2006). Studying attrition rates and degree completion behavior among first-generation college students in the United States. Journal of Higher Education. 77(5): 861-885.
Long, S.M. and Ostrove, J.M. (2007). Social class and belonging: Implications for college adjustment. The Review of Higher Education 30(4), 363-389.
14
Mangels, J. A., Butterfield, B., Lamb, J., Good, C., & Dweck, C. S. (2006). Why do beliefs about intelligence influence learning success? A social cognitive neuroscience model. Social Cognitive and Affective Neuroscience, 1(2), 75-86.
Martin, A. J. (2006). Personal bests (PBs): A proposed multidimensional model and empirical analysis. British Journal of Educational Psychology, 76, 803–825.
Martin, A. J. (2011). Personal best (PB) approaches to academic development: Implications for motivation and assessment. Educational Practice and Theory, 33, 93–99.
Martin, A. J., and Liem, G. A. (2010). Academic Personal Bests (PBs), engagement, and achievement: A cross-lagged panel analysis. Learning and Individual Differences, 20, 265–270.
Ostrove, J. M. (2003). Belonging and wanting: Meanings of social class background for women’s constructions of their college experience. Journal of Social Issues, 59, 771–784.
Stewart, A. J., and Ostrove, J. M. (1993). Social class, social change, and gender. Psychology of Women Quarterly, 17, 475–497.
Strayhorn, T.L. (2012) College students’ sense of belonging: A key to educational success for all students. New York: Routledge.
15
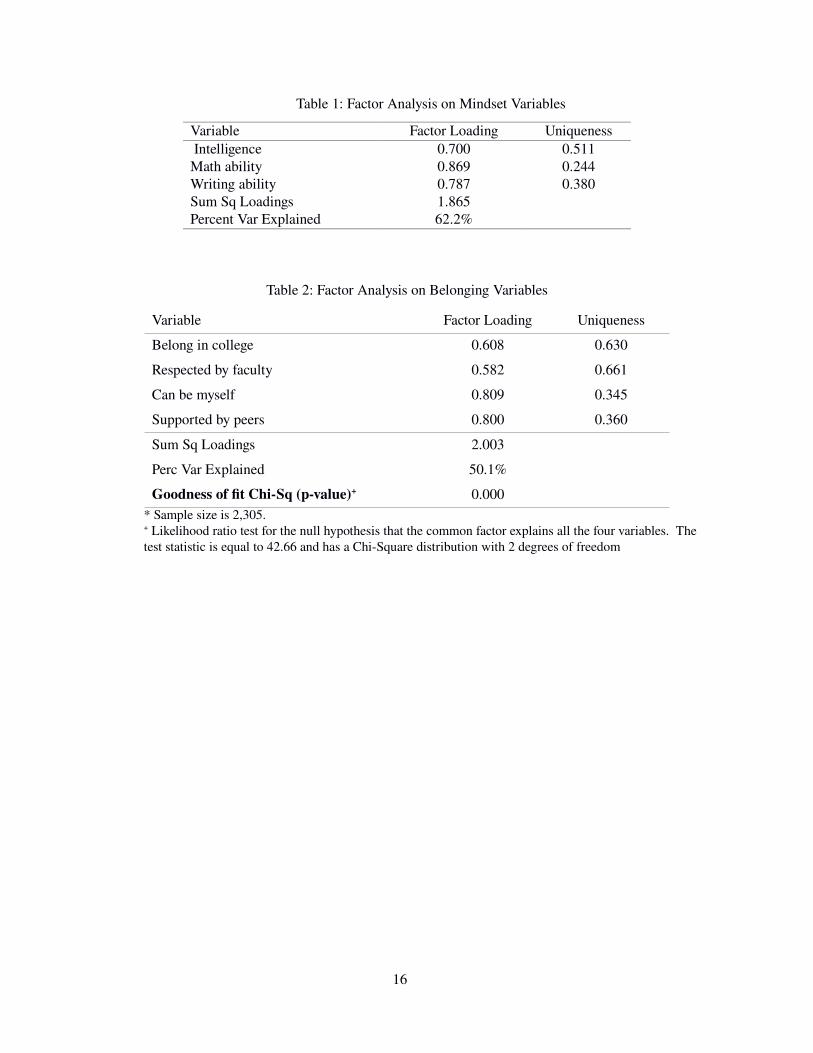
Table 1: Factor Analysis on Mindset Variables
Variable Factor Loading Uniqueness Intelligence 0.700 0.511Math ability 0.869 0.244Writing ability 0.787 0.380Sum Sq Loadings 1.865Percent Var Explained 62.2%
Table 2: Factor Analysis on Belonging Variables
Variable Factor Loading Uniqueness
Belong in college 0.608 0.630
Respected by faculty 0.582 0.661
Can be myself 0.809 0.345
Supported by peers 0.800 0.360
Sum Sq Loadings 2.003
Perc Var Explained 50.1%
Goodness of fit Chi-Sq (p-value)+ 0.000* Sample size is 2,305.+ Likelihood ratio test for the null hypothesis that the common factor explains all the four variables. The test statistic is equal to 42.66 and has a Chi-Square distribution with 2 degrees of freedom
16

Table 3: Explanatory Variables
Variable Scale Description Descriptive StatisticFeedback Binary Equal to 1 if instructors give feedback on writing
most of timeProportion = 29.8%
Nonwhite Binary Equal to 1 is student identified their race as including any race besides white / Caucasian
Proportion = 7.7%
ParentNoCollege Binary Equal to 1 if highest education of any of student's guardians is high school or less
Proportion = 11.3%
ParentGrad Binary Equal to 1 if highest education of any of student's guardian is a graduate degree
Proportion = 24.2%
ACT Interval Student's score on the ACT college readiness exam Mean = 25.2HSBelowAvg Binary Equal to 1 if student had opinion that their high
school performance was on average less than peersProportion = 1.8%
CreditCat Ratio Number of semesters of college credits accumulated, where 15 credits = 1 semester
Mean = 5.1
EduMajor Binary Equal to 1 if student major is related to K-12 education
Proportion = 9%
LiberalStudMajor Binary Equal to 1 if student major is in liberal arts or social sciences
Proportion = 22.7%
ScienceMajor Binary Equal to 1 if student major is in science, math, health, or technology
Proportion = 47%
Private Binary Equal to 1 if corresponding to a student at the smaller, private university
Proportion = 18.2%
Age Ratio Age of the student Mean = 20.5Female Binary Equal to 1 if student identified as female, 0 if
student identified as maleProportion = 73.4%
17
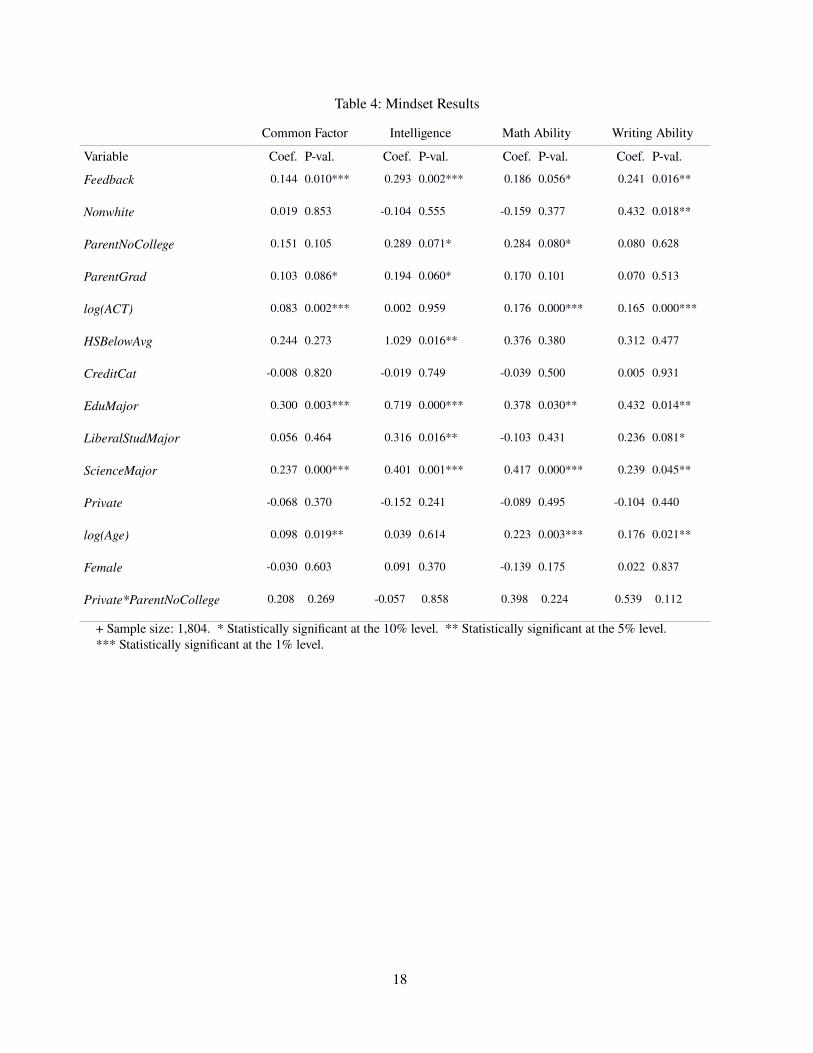
Table 4: Mindset Results
Common Factor Intelligence Math Ability Writing Ability
Variable Coef. P-val. Coef. P-val. Coef. P-val. Coef. P-val.
Feedback 0.144 0.010*** 0.293 0.002*** 0.186 0.056* 0.241 0.016**
Nonwhite 0.019 0.853 -0.104 0.555 -0.159 0.377 0.432 0.018**
ParentNoCollege 0.151 0.105 0.289 0.071* 0.284 0.080* 0.080 0.628
ParentGrad 0.103 0.086* 0.194 0.060* 0.170 0.101 0.070 0.513
log(ACT) 0.083 0.002*** 0.002 0.959 0.176 0.000*** 0.165 0.000***
HSBelowAvg 0.244 0.273 1.029 0.016** 0.376 0.380 0.312 0.477
CreditCat -0.008 0.820 -0.019 0.749 -0.039 0.500 0.005 0.931
EduMajor 0.300 0.003*** 0.719 0.000*** 0.378 0.030** 0.432 0.014**
LiberalStudMajor 0.056 0.464 0.316 0.016** -0.103 0.431 0.236 0.081*
ScienceMajor 0.237 0.000*** 0.401 0.001*** 0.417 0.000*** 0.239 0.045**
Private -0.068 0.370 -0.152 0.241 -0.089 0.495 -0.104 0.440
log(Age) 0.098 0.019** 0.039 0.614 0.223 0.003*** 0.176 0.021**
Female -0.030 0.603 0.091 0.370 -0.139 0.175 0.022 0.837
Private*ParentNoCollege 0.208 0.269 -0.057 0.858 0.398 0.224 0.539 0.112
+ Sample size: 1,804. * Statistically significant at the 10% level. ** Statistically significant at the 5% level.*** Statistically significant at the 1% level.
18

Table 5: Belonging Results
Common Factor Belong in College Be Myself Supported by Peers Respected by Faculty
Variable Coef. P-val. Coef. P-val. Coef. P-val. Coef. P-val. Coef. P-val.
Feedback 0.269 0.000*** 0.296 0.003*** 0.389 0.000*** 0.373 0.000*** 0.456 0.000***
Nonwhite -0.268 0.009*** -0.366 0.038** -0.500 0.006*** -0.317 0.070* -0.344 0.065*
ParentNoCollege -0.290 0.002*** -0.442 0.008*** -0.355 0.032** -0.508 0.002*** -0.307 0.071*
ParentGrad 0.069 0.259 0.264 0.013** 0.066 0.531 0.080 0.444 0.087 0.421
log(ACT) -0.011 0.697 0.162 0.001*** -0.035 0.456 -0.094 0.041** 0.058 0.221
HSBelowAvg -0.101 0.657 -0.840 0.034** -0.248 0.521 0.284 0.468 -0.362 0.358
CreditCat 0.098 0.004*** 0.192 0.001*** 0.085 0.146 0.233 0.000*** -0.010 0.874
EduMajor 0.026 0.801 -0.002 0.992 -0.089 0.607 0.188 0.282 0.090 0.612
LiberalStudMajor -0.086 0.274 -0.210 0.119 -0.129 0.336 -0.203 0.126 0.138 0.124
ScienceMajor 0.071 0.306 0.171 0.154 0.070 0.557 0.091 0.435 0.176 0.149
Private -0.061 0.429 -0.108 0.419 -0.205 0.126 0.010 0.941 -0.057 0.677
log(Age) -0.080 0.060* -0.064 0.397 -0.079 0.282 -0.172 0.020** -0.110 0.151
Female 0.071 0.237 0.117 0.261 0.158 0.127 0.010 0.923 0.186 0.079*
Private*ParentNoCollege 0.324 0.093* 0.429 0.214 0.306 0.360 0.759 0.027** 0.108 0.748
+ Sample size: 1,804. * Statistically significant at the 10% level. ** Statistically significant at the 5% level.*** Statistically significant at the 1% level.

Table 6: Confidence and Perseverance Results
Confidence Perseverance
Variable Coef. P-val. Coef. P-val.
Feedback 0.448 0.000*** 0.401 0.000***
Nonwhite -0.186 0.315 0.261 0.145
ParentNoCollege -0.207 0.209 -0.093 0.572
ParentGrad 0.208 0.055* 0.107 0.301
log(ACT) 0.488 0.000*** 0.051 0.261
HSBelowAvg 0.879 0.044** -0.820 0.028**
CreditCat 0.085 0.157 -0.003 0.952
EduMajor 0.221 0.214 0.213 0.22
LiberalStudMajor -0.032 0.812 -0.166 0.214
ScienceMajor 0.216 0.071* 0.062 0.597
Private 0.098 0.475 0.124 0.346
log(Age) 0.040 0.598 0.153 0.038**
Female -0.338 0.001*** -0.630 0.000***
Private*ParentNoCollege 0.194 0.574 -0.103 0.766
+ Sample size: 1,804. * Statistically significant at the 10% level. ** Statistically significant at the 5% level. *** Statistically significant at the 1% level.
20
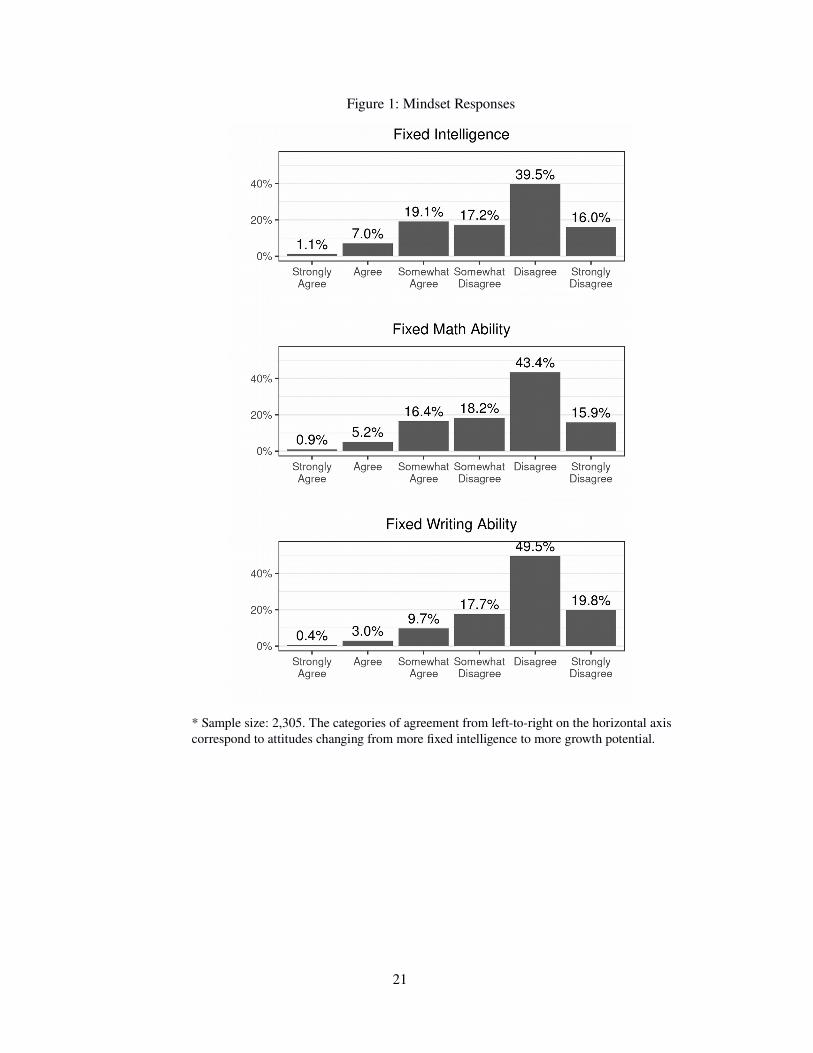
Figure 1: Mindset Responses
* Sample size: 2,305. The categories of agreement from left-to-right on the horizontal axis correspond to attitudes changing from more fixed intelligence to more growth potential.
21

Figure 2: Scatterplots of Mindset Variables with Their Common Factor
* Sample size is 2,305. To avoid overplotting, the horizontal scale for level of agreement includes jittering on a uniform scale with width equal to 0.3 times the width of the categories.
22

Figure 3: Belonging Responses
* Sample size: 2,305. Categories from left to right indicate higher levels of belonging.
23

Figure 4: Scatterplots of Belonging Variables with Their Common Factor
* Sample size is 2,305. To avoid overplotting, the horizontal scale for level of agreement includes jittering on a uniform scale with width equal to 0.3 times the width of the categories.
24

Figure 5: Distribution of Responses on Confidence and Perseverance
* Sample size: 2,305. Categories from left to right indicate attitudes thatare more conducive to learning.
25