predictive toxicology modeling: protocols for exploring
TRANSCRIPT
Predictive Toxicology Modeling: Protocols for Exploring hERGClassification and Tetrahymena pyriformis End Point PredictionsBo-Han Su,†,# Yi-shu Tu,‡,# Emilio Xavier Esposito,§,# and Yufeng J. Tseng*,†,‡,#
†Department of Computer Science and Information Engineering, National Taiwan University, No.1 Sec.4, Roosevelt Road, Taipei,Taiwan 106‡Graduate Institute of Biomedical Electronics and Bioinformatics, National Taiwan University, No.1 Sec.4, Roosevelt Road, Taipei,Taiwan 106§exeResearch, LLC, 32 University Drive, East Lansing, Michigan 48823, United States
ABSTRACT: The inclusion and accessibility of different methodologies to explore chemical data sets hasbeen beneficial to the field of predictive modeling, specifically in the chemical sciences in the field ofQuantitative Structure−Activity Relationship (QSAR) modeling. This study discusses using contemporaryprotocols and QSAR modeling methods to properly model two biomolecular systems that have historicallynot performed well using traditional and three-dimensional QSAR methodologies. Herein, we explore, analyze, and discuss thecreation of a classif ication human Ether-a-go-go Related Gene (hERG) potassium channel model and a continuous Tetrahymenapyriformis (T. pyriformis) model using Support Vector Machine (SVM) and Support Vector Regression (SVR), respectively. Themodels are constructed with three types of molecular descriptors that capture the gross physicochemical features of thecompounds: (i) 2D, 2 1/2D, and 3D physical features, (ii) VolSurf-like molecular interaction fields, and (iii) 4D-Fingerprints.The best hERG SVM model achieved 89% accuracy and the three-best SVM models were able to screen a Pubchem data set withan accuracy of 97%. The best T. pyriformis model had an R2 value of 0.924 for the training set and was able to predict thecontinuous end points for two test sets with R2 values of 0.832 and 0.620, respectively. The studies presented within demonstratethe predictive ability (classification and continuous end points) of QSAR models constructed from curated data sets, biologicallyrelevant molecular descriptors, and Support Vector Machines and Support Vector Regression. The ability of these protocols andmethodologies to accommodate large data sets (several thousands compounds) that are chemically diverse − and in the case ofclassification modeling unbalanced (one experimental outcome dominates the data set) − allows scientists to further explore aremarkable amount of biological and chemical information.
■ INTRODUCTIONThe field of toxicology modeling, and in general predictivemodeling, borrows heavily from nonphysical science basedresearch areas such as statistics, psychology, sociology, andcomputer science. Thus, the field of predictive modelingbenefits from a cornucopia of methodologies and protocols thatis adept at managing data that is unbalanced, diverse, andcorrelated due to hidden factors. Like most areas of chemistryand biology, or any active research area, there are some systems(data sets) that have yet to be adequately described or analyzedbecause satisfactory methods and protocols have not beendiscovered.The recently published article by Huang and Fan1 explores
two notoriously difficult systems to adequately model: theinhibition of the human Ether-a-go-go Related Gene (hERG)potassium channel and the toxicity and mutagenesis ofTetrahymena pyriformis (T. pyriformis). A genetic algorithm2
was used to select molecular descriptors that were thenprovided to a support vector machine (SVM)3−5 to constructthe models; the importance of each molecular descriptor wasdetermined by the SVM. Unfortunately the work presented byHuang and Fan1 did not take advantage of protocols ormethodologies that would have improved the predictiveabilities of their models. Using the hERG and T. pyriformisdata sets and a universal protocol that is similar to the one
implemented in the Huang and Fan’s article,1 the predictivemodels discussed herein are markedly better at discerning if acompound is hERG active or toxic to T. pyriformis for theirrespective data set. The presented protocols take advantage ofknown physical properties to analyze and focus the data sets,while commonly employed protocols are used to constructsound models. The protocols are presented in a straightforwardmanner that can be easily adapted and used to constructpredictive models for other data sets.The human Ether-a-go-go Related Gene potassium channel
is considered a critical and major component associated withQT interval prolongation and development of arrhythmia calledTorsades de Pointes (TdP). When the corresponding hERGpotassium channel is inhibited, a fatal disorder called long QTsyndrome6−9 occurs. Development of robust, sound, andexpandable in silico models for predicting hERG potassiumchannel affinity is high on the list of current computationalADMET goals. Many in silico hERG models, using QuantitativeStructure−Activity Relationship (QSAR) approaches, havebeen published to predict if a drug candidate has the inclinationto block the hERG channel.10−13 Among the appliedclassification methodologies14,15 are Bayesian,16 decision
Received: January 31, 2012Published: May 29, 2012
Article
pubs.acs.org/jcim
© 2012 American Chemical Society 1660 dx.doi.org/10.1021/ci300060b | J. Chem. Inf. Model. 2012, 52, 1660−1673

tree,17 neural network,15 support vector machine,18−21 andpartial least-squares (PLS).22 A PLS classification hERG modelbuilt by Keseru22 had an accuracy of 85% for a training set of 55compounds and an accuracy of 83% for a test set of 95compounds. Sun16 published a Bayesian-based classificationmodel using a training set of 1979 in-house compounds and atest set of 66 compounds. Sun’s hERG classification model hada receiver operating characteristic (ROC) accuracy of 87% forthe training set and a ROC accuracy of 88% for the test set.Gepp and Hutter17 reported a decision tree hERG classificationmodel with an accuracy of 92% for a training set of 264compounds and an accuracy of 76−80% for a test set of 75compounds. Roche et al.15 implemented supervised neuralnetworks to construct a hERG classifying model with anaccuracy of 93% for a 244 compound training set and anaccuracy of 82% for a test set comprised of 72 compounds. Li etal.23 published a hERG classification model that employed aSVM and achieved an overall classification accuracy of 74% forthe training set of 495 compounds and an accuracy of 73% for atest set of 1877 compounds from a PubChem data set (AID376).24 Overall, a sampling of successful hERG models fromthe literature has mostly used machine-learning methods toachieve high accuracy for the training set compounds. Amongthe studies presented above, only the model built by Li et al.resulted in a lower accuracy for the training and test sets thanthe other studies, but they used a considerably larger trainingset of 495 samples (compounds) and a test set with close to1800 more compounds than the other models (72 to 95compounds). Moreover, the previously presented modelconstructing methods − with the exception of Li et al.’sprotocol − lacked sufficient model validation because they wereonly applied to small test sets containing between 72 and 95compounds. Huang and Fan1 used Li et al.23 hERG training setof 495 compounds to construct SVM classification modelswhose descriptors were selected by a genetic algorithm2,25,26
(GA). The classification model was applied to an external testset of 1948 compounds from the PubChem bioassay database(AID 376). The best resulting model had an accuracy near 87%for the training set and 82% for the test set.1
For better predictive accuracy and mechanistic understandingof the system of interest, it is preferred that only a singlechemical mechanism is being captured within the QSAR model.In the field of toxicology predictive modeling, however, it ishard to confirm the detailed chemical mechanism beingmeasured in the toxicological experiment. Moreover, manytoxicological experiments are comprised of complicatedchemical reactions, but effective predictive models are stillneeded to represent these toxicological experiments.27 Addi-tionally, the risk of overfitting or construction of models bychance is reduced due to the structural diversity of the trainingset and the use of a multiclass trial descriptor pool. Thus thesemodels can be incorporated into a toxicology screen and havethe potential to reduce the need for bioassays.The Tetrahymena pyriformis assay was developed for
predicting the aqueous toxicity of a compound as it relates tofish lethality.28 Schulz and co-workers have analyzed more than2,400 compounds and constructed the TETRATOX database29
that is not publicly available. The Schulz and Cronin’sgroup30−34 have published many T. pyriformis QSAR studiesand models that explore subsets of the compounds based onfunctional groups. For these sets of QSAR models, the authorsapplied linear regression to a set of physicochemical moleculardescriptors, such as HOMO and LUMO energies and logP (the
octanol−water partition coefficient), to construct the QSARmodels. Although these QSAR models had regressioncoefficient of determination values that indicate statisticalsignificance (R2 > 0.8), the predictive abilities of these QSARmodels was tuned for compounds that are similar to those usedto build the model, i.e. the training set compounds.Zhu and colleagues35 built a general QSAR model to predict
the T. pyriformis toxicity of compounds, collected 983compounds from Schultz’s publication, and randomly dividedthe compounds into a training set (644 compounds) and a testset (339 compounds). To validate the training set models, Zhuet al. collected an additional 110 compounds that werepublished more recently by Schultz et al.,34 as a secondarytest set. In the study by Zhu and co-workers, they appliedseveral commonly used model construction methods toconstruct discrete QSAR models. Specifically, individualQSAR models were constructed using k-nearest neighbors(kNN), support vector machine (SVM), machine-learnedranking (MLR), ordinary least-squares (OLS), partial least-squares, associative neural network (ASNN), and artificialneural network (ANN); the optimal model from each methodwas combined to form a consensus model. The consensusmodel returned an R2 value of 0.94 for the training set, 0.88 fortest set 1, and 0.77 for test set 2. The individual modelscomprising the consensus model possessed a mean Q2 value of0.85 for the training set, and these values ranged from 0.72 to0.95 for the individual models. Additionally, the mean R2 valuefor the individual models applied to test set 1 was 0.75 (rangingfrom 0.49 to 0.85) and 0.51 for test set 2 (ranging from 0.37 to0.66). The best performing individual model not included inthe consensus model was constructed using ASNN; this modelhad an R2 value of 0.85 and a Q2 value of 0.83 for the trainingset and R2 values of 0.85 and 0.66 for test sets 1 and 2,respectively.In the study by Huang and Fan,1 the authors used a GA2,25,26
to select the molecular descriptors and a SVM to construct acontinuous model for the T. pyrifomis data set. However, theGA descriptor selecting protocol made it difficult to findimportant descriptors that influence the model and was mostlikely the rational for Huang and Fan to suggest that moleculardescriptors are not important when building a QSAR model.The best T. pyrifomis SVM-GA model in the Huang and Fanstudy had a Q2 of 0.86 and coefficient of determination (R2)values of 0.88 and 0.60 for test sets 1 and 2, respectively.Additionally, the data sets of Zhu and co-workers have beenused to explain factors that might influence a QSAR model. Inthe study of Tetko et al.,36 the T. pyriformis data set was used todemonstrate that the applicability domain of a QSAR model isdetermined by the distance (molecular similarity) between thecompound whose end point is being predicted (commonly thetest set compound) and the training set.The training set is the cornerstone of a sound and robust
predictive or QSAR model. Constructing a training setcomprised of diverse and unique compounds that are withinknown physicochemical limits aids the predictive ability ofmodels. To improve the accuracy of the SVM-based hERGmodel, compounds for the training set were carefully selectedin an effort to filter out redundant information. In a previousstudy, we reported a hERG binary classification QSAR model37
constructed using the genetic function approximation38 (GFA)methodology, and this model was better at predicting acompound’s propensity to be a hERG channel blocker thanother published classification models.15,22,23,39−42 The training
Journal of Chemical Information and Modeling Article
dx.doi.org/10.1021/ci300060b | J. Chem. Inf. Model. 2012, 52, 1660−16731661
set was constructed from a set of 250 structurally diversecompounds obtained from the literature with known hERGactivity and a condensed version of the PubChem bioassay(AID 376) containing 876 compounds. This hERG classi-fication model achieves 91% accuracy for the training set and83% accuracy for the test set. Furthering our work in the area ofhERG blocking classification modeling, we published anotherstudy43 addressing the active-versus-inactive imbalance typicallyseen in high-throughput screening results. The PubChemhERG Bioassay data set (AID 376; 163 active and 1505 inactivecompounds) was used as the training set after it was pruned ofcompounds violating Lipinski’s Rule-of-Five and those that didnot fall within the specified logP range.43 To avoid overfittingthe SVM model, the linear SVM modeling and deletionprocedure was applied to reduce the size of the training setdescriptor pool used to construct the model and thenjudiciously selected molecular features from the reduceddescriptor pool. This is the preferred approach and maximizesthe correct classification of compounds for hERG toxicity. Anexternal data set (the test set) consisted of 356 compoundscollected from available literature data and was comprised of287 actives and 69 inactives; this collection of compounds wasused to validate the models. The accuracy, sensitivity, andspecif icity of our best model determined from 10-fold cross-validation were 95%, 90%, and 96%, respectively; the overallaccuracy was near 87% for the external test set. The knowledgegained from our previous hERG studies is applied to the dataset used by Huang and Fan1 along with the descriptor selectionand model construction methods presented here to constructrobust predictive models.
■ MATERIAL AND METHODS
hERG Data Sets. The hERG training set used in this studywas derived from the one used in the study by Huang and Fan.1
Huang and Fan combined the 495 training set compounds andthe 66 external compounds collected by Li and co-workers23
and designated this as their training set. In this study, Huangand Fan’s initial training set of 561 compounds was cleaned toremove compounds complexed with metal ions along withthose that sampled unstable conformations during themolecular dynamics simulation for the calculation of 4D-Fingerprints (4D-FPs). A total of 546 compounds remainedand our training set consisted of 210 active and 336 inactivecompounds. Initially, the hERG test set contained 1948compounds obtained from the PubChem BioAssay AID376.24 The hERG test set was reduced to 1795 compounds(220 active and 1575 inactive) in the study by Huang and Fan,1
because the molecular descriptors for 153 compounds couldnot be calculated by the chosen molecular descriptorapplication; DRAGON.2 It is not uncommon for severalcompounds of a large data set to have difficulties whencalculating their molecular descriptors. We used the samecleaning protocol for the hERG test set− as for the training set− and compounds with metal ions, structurally ambiguouscompounds (an SDfile entry with two or more compounds),hERG activators, and compounds also present in our trainingset were removed. The cleaned test set contained a total of1668 PubChem compounds comprised of 163 active and 1505inactive compounds. The hERG data set compounds fromPubChem AID 376 and the literature compounds wereobtained as 2D molecular structures, converted into 3Dstructures using HyperChem 7.044 and geometry optimized
using HyperChem 7.0s MM+ force field (based on the AllingerMM2 force field45).
The Tetrahymena pyriformis Toxicity Data Set. TheTetrahymena pyriformis toxicity data set was retrieved from thearticle published by Zhu et al.35 This data set provided thecompounds as SMILES strings along with each compound’sbiological end point as the negative logarithm of theconcentration required to inhibit growth by 50% (pIGC50).The data set was separated by Zhu et al.35 into a training set of644 compounds and two external validation sets (test sets) with339 and 110 compounds, respectively. The Zhu et al. T.pyriformis data set has also been used to explore the domainapplicability of QSAR models36 and factors influencing thereliability of QSAR models.1 The 3D conformation of thecompounds in the T. pyriformis data set were constructed andenergy minimized using the MMFF94x force field and atomicpartial charges46 with Born solvation (MOE 2010.10software46).
Molecule Descriptors. The molecular descriptors used toconstruct the QSAR models for the hERG and the T. pyriformisdata sets were obtained from two sources. The 2D, 21/2D, 3D,VolSurf-like, and Semi-Empirical molecular descriptors of eachcompound were calculated with Molecular Operating Environ-ment (MOE) 2010.10 software46 using MMFF94x force fieldwith the Born solvation model. To capture high-dimensionaldynamic molecular information, 4D-Fingerprints47 of eachcompound were calculated and used as molecular descriptors.
Semi-Empirical Molecular Descriptors. Seven AM1 Semi-Empirical molecular descriptors, calculated with MOE 2010.10,are part of the trial descriptor pool. These molecular descriptorsvalues capture the electronic physicochemical properties of thecompounds, specifically the dipole moment, total SCF energy,electronic energy, heat of formation, the HOMO and LUMOenergies, and the ionization potential.
2D and 21/2D Molecular Descriptors. Adding to the trialdescriptor pool are 228 MOE 2D and 21/2D moleculardescriptors. The 2D molecular descriptors are the numericalproperties evaluated from the connection tables representing amolecule and include physical properties, subdivided surfaceareas, atom counts, bond counts, Kier & Hall connectivity andkappa shape indices, adjacency and distance matrix descriptorscontaining BCUT and GCUT descriptors, pharmacophorefeature descriptors, and partial charge descriptors (PEOEdescriptors). A 21/2D molecular descriptor is defined here as a3D molecular property represented as an individual (singular)numerical value and included measures of the conformationalpotential energy and its components, molecular surfaces,volumes and shapes, and conformation dependent chargedescriptors. These descriptors are dependent on the con-formation of the molecule.
VolSurf Molecular Interaction Fields. The VolSurf48,49
descriptor set contains 76 molecular features based onmolecular interaction fields. These descriptors are alignmentindependent and are not strongly dependent on eachcompound’s molecular conformation; the 3D molecularinteraction fields are represented as a single numerical value.The compound is placed in a grid (with the exception of fourVolSurf descriptors that measure the molecular volume, surfacearea, globularity, and rugosity), a hydrophobic (dry) andhydrophilic (wet) probe visits each grid point, and theinteraction energy between the probe and the compound iscalculated. The grid points within an interaction energy rangeare considered an iso-contour (iso-surface), and the volume is
Journal of Chemical Information and Modeling Article
dx.doi.org/10.1021/ci300060b | J. Chem. Inf. Model. 2012, 52, 1660−16731662
calculated. The combinations of interaction energies andmolecular volumes are used as molecular descriptors.Universal 4D Fingerprints. The 4D-Fingerprints (4D-FP)
were developed to model47 and classify50 compounds using theconformation information of a compound from a moleculardynamic (MD) simulation. With a compound samplingmultiple conformations during a MD simulation, the problemthat too few conformations are analyzed in traditional 3Dfingerprints is alleviated. The descriptor size of 4D-FP variesrelated to the number of atoms within a molecule. A total of613 4D-FPs were calculated and used for T. pyriformis data set,and 5271 4D-FP descriptors were calculated for the hERG dataset. The difference in the number of 4D-FPs between thehERG and T. pyriformis data set is due to the physical size ofthe compounds in each data set. The largest compound in thehERG data set contains more atoms than the largest compoundin the T. pyriformis data set, thus the hERG data set requiredmore 4D-FPs to capture the molecular information containedin the hERG compounds. The time to compute the 4D-FPsfeatures of hERG data set and T. pyriformis data set areapproximately 850 and 490 s (or 14 and 8 min), respectively.These durations are acceptable for the number of compoundsof interest, and inclusion of these descriptors with those ofstandard molecular calculation packages is reasonable.Support Vector Machine (SVM) and Support Vector
Regression (SVR). A support vector machine (SVM)4,5 is asupervised machine-learning technique that applies a hyper-plane within the descriptor space in an attempt to separate(classify) the samples, whereas support vector regression(SVR)3 applies cost functions to the support vectors and issuitable for regression model building when the samples havecontinuous end points. The end points for each compound(sample) of the hERG data set are binary − the compounds areclassified as active (1s) or inactive (0s) − while the end pointsfor the T. pyriformis data set are continuous (the logarithm of50% growth inhibitory concentration, pIGC50, values rangingfrom −2.67 to 3.05). Thus, the hERG classification modelswere constructed using a SVM, and the T. pyriformis continuousmodels were constructed using a SVR. Models wereconstructed and validated using the LIBSVM v2.8851
application and interfaced to R v2.12.252 using the e1071package v1.6.53
Partial Least Squares (PLS). To identify importantmolecular descriptors that accurately represent the pIGC50end points of the T. pyriformis data set, the PLS loading matrixwas used to assist in the selection of descriptors. PLS appliesprincipal component analysis and regression methods tohighlight important features and suggests approximate modelsusing the descriptors and activity values. The pls package v2.254
in R v2.12.252 was used to calculate the PLS loading matrix.Evaluation of the Classification Model’s Predictive
Ability. To provide a broader understanding of theclassification model’s performance, the accuracy (Acc; correctlypredicted active and nonactive compounds; eq 1), sensitivity(Sen; correctly predicted active compounds; also referred to asRecall; eq 2), specif icity (Spe; correctly predicted nonactivecompounds; eq 3), and the Geometric-Mean (G-mean; thesquare-root of the sensitivity multiplied by the specif icity; eq 4)are important model evaluation criteria that should beconsidered when examining models. When accuracy is theonly evaluation measure of a classification model reported, thetrue predictive nature of the model for the active and inactiveentities can be biased because all of the compounds (entities)
are included in the accuracy measure and inaccuracies in theprediction of the actives (positives) or the inactives (negatives)are diminished. Calculating the G-mean value − taking intoconsideration the sensitivity and specif icity − provides a singlevalue (like accuracy) that provides a realistic predictive abilityvalue of the model (unlike accuracy)
=+
+ + +accuracy
tp tntp fn tn fp (1)
=+
sensitivitytp
tp fn (2)
=+
specificitytn
tn fp (3)
‐ = ×Geometric Mean sensitivity specificity (4)
where tp is the number of correctly predicted positives (truepositives; actives), tn is the number of correctly predictednegatives (true negatives; inactives), fp is the number ofincorrectly predicted positives (false positives; negativesincorrectly predicted to be positives; inactives predicted to beactives), and fn is the number of incorrectly predicted negatives(false negatives; positives incorrectly predicted to be negatives;actives predicted to be inactives). A fifth method to analyzeclassification models is Cohen’s kappa (κ), and it measures theagreement between classification models or predicted andknown classifications.55 It is defined as
κ = −−
a ee
Cohen’sPr( ) Pr( )
1 Pr( ) (5)
where Pr(a) is relative observed agreement between thepredicted classification of the model and the knownclassification, and Pr(e) is the hypothetical probability ofchance agreement. The Pr(a) and Pr(e) values are calculatedfrom a confusion matrix. Cohen’s kappa analysis returns valuesbetween −1 (no agreement) and 1 (complete agreement).Predictive models, when compared to the known classificationof the data set, with Cohen’s kappa values between −1.0 and0.4 indicate that the model is a poor predictor, values between0.4 and 0.6 indicate that the model is average, values between0.6 and 0.8 imply that the model is acceptable, and valuesbetween 0.8 and 1.0 denote that the model is highly predictive.While G-mean is the primary model evaluation method for thisstudy, this quintet of classification model evaluation measuresare included to determine the full abilities of the classificationmodel.
Distance to Model Calculation. Tetko and colleaguessuggested that the descriptor distances between the testcompounds and the training set influence the predictability ofQSAR models.36 To remove potential outliers from test set 2 ofthe T. pyriformis data set, the overall and 3-nearest-neighbor (3-NN) mean Euclidean distance between the training set andeach test set compound was calculated using the scaleddescriptors from the 204-term SVR model.
■ RESULTS AND DISCUSSIONhERG Data Set. SVM Model Building Using the Raw hERG
Training Set. The complete hERG training set (the rawtraining set) contains 210 hERG blocking compounds and 336hERG inactive compounds resulting in a ratio of 5:8, actives toinactives. All 4D-FPs and MOE descriptors were used to build
Journal of Chemical Information and Modeling Article
dx.doi.org/10.1021/ci300060b | J. Chem. Inf. Model. 2012, 52, 1660−16731663

the classification SVM model. The best raw training set SVMmodel was selected based on the G-mean metric (eq 4), and thetraining and test set performances are listed in the third row ofTable 1. The accuracy, sensitivity, specif icity, and G-mean valuesfor the training set are listed in the first four columns, while thelast four columns provide these same measures for the test set.The G-mean value for the raw training set SVM with 10-foldcross-validation was 81% along with an accuracy of 81%. The G-mean when applying the model to the external test set was 62%with an accuracy of 61%. This illustrates that the “best”classification SVM model built from a raw training set withoutlimitations applied to the selection of descriptors produces anoverfit model with poor performance when classifying thehERG test set. Constructing a SVM model using 5577descriptors (5271 4D-FPs and 306 MOE descriptors) couldreduce the performance of the model’s predictive power sincethere is the possibility that a majority of the moleculardescriptors are intercorrelated, and therefore it is harder tointerpret the molecular features associated with a compoundthat exhibits hERG blocking behavior.SVM Model Building Using “F-Score” Filter for Feature
Selection. A simple and effective “F-score” technique forfeature selection was adopted to identify the influential modelfeatures (molecular descriptors) and reduce the need to use alarge descriptor set during SVM model construction.56 F-scoreis a simple method that evaluates the discriminative nature ofpositive and negative instances. The larger the F-score, themore likely the molecular feature is especially discriminative.Used as a criterion to identify if a feature is important for aSVM model, the F-score was used to explore the impact oflimiting the number of molecular descriptors (features) used toconstruct a classification SVM for the hERG data set. Thevalues of calculated F-scores of the 5577 molecular descriptorsranged from 0.0 to 0.27. Most of the F-score values for themolecular descriptors were 0.0 (no significant influence), andonly 200 descriptors had F-score values greater than 0.1. Thisindicates that most of the descriptors have small F-scores, andnone of the descriptors have especially discriminative character-istics based on the F-scores evaluation. Therefore, three F-scorethreshold values of 0.0, 0.001, and 0.01 were applied to retainmolecular descriptors with F-score values greater than thedefined thresholds. Trial descriptor pools containing 1289,1000, and 900 descriptors were used to construct and evaluateSVM models. The performance of the best SVM model builtusing these three feature sets are listed in the fourth to sixthrows of Table 1. The accuracy, sensitivity, specif icity, and G-meanvalues for the training set are listed in the first four columns,while the last four columns provide these same classificationmodel evaluation measures for the test set.The 1289 most influential features based on the largest F-
score values, from the set of 5577 molecular features, were
selected. The best training set SVM model built with 1289features and subjected to 10-fold cross-validation has a G-meanvalue of 80% along with an accuracy of 81%. Applying thismodel to the hERG test set resulted in a G-mean value of 61%and an accuracy of 68%. Compared to the SVM modelconstructed for the raw training set with all of the molecularfeatures, the 1289-feature classification model had approx-imately the same accuracy for the training set and a pronouncedimprovement with respect to the accuracy for the test set. The1000-feature SVM model for the training set − again evaluatedwith 10-fold cross-validation − returned a G-mean value of 82%with an accuracy of 81%. The G-mean value of the test set whenevaluated with the 1000-feature model was 58% with anincreased accuracy of 74%. The best 900-feature SVMclassification model for the training set with 10-fold cross-validation had a G-mean value of 81% along with an accuracy of79%. The G-mean value for the classification of the test setusing the 900-feature SVM model was 59% with an accuracy of82%. By constructing classification SVM models using the mostprominent molecular descriptors (features) the accuracy of thepredictions for the test sets is improved (the training setaccuracy remains constant), whereas the G-mean score is steadyfor the training set while decreasing for the test set. The G-mean score for the test set is reduced in concert with thereduction of the number of features used to construct the SVMmodels. This is most likely due to the reduction in the numberof molecular features − removal of descriptors that add noise tothe model − while preserving the important informationcontained within the subset of molecular descriptors used toconstruct the model.
SVM Model Building by Adopting the logP Filter andReduced 4D-FPs. Implementing a logP filter to focus thetraining set, as carried out in our previous hERG blocking GFAmodeling study,37 combined with the Lipinski’s Rule-of-Five57
filter reduced the size of the training set to 206 compounds (37active and 169 inactive compounds) and a test set of 876compounds (29 active and 847 inactive compounds). TheLipinski’s Rule-of-Five is a well-known filter used to classifycompounds as drug-like or not and can be used as a high-throughput screening protocol to partition the compounds ofinterest. Compounds considered to be nondrug-like, based onLipinski’s Rule-of-Five, might have unreliable experimental endpoints and were considered noisy data, thus they discarded. It iswell-known that there is a direct correlation between acompound’s hydrophobic nature and its propensity to inducehERG blockage; increasing the hydrophobic nature of acompound increases the hERG blocking effect and viceversa.20,23,58,59 Thus, compounds were removed from thetraining set based on calculated logP values. Specifically, activecompounds with a logP value less than 4.1 and inactivecompounds with a logP value greater than 2.8 were removed to
Table 1. Prediction Performance Measures for the hERG Data Set from the Raw Training and Test Set SVM ModelsDetermined Using All MOE and 4D-FPs Descriptors (Name raw in the Third Row), 1289 Selected Features (Name select1289in the Fourth Row), 1000 Selected Features (Name select1000 in the Fifth Row), and 900 Selected Features (Name select900 inthe Sixth Row)
training set percentage (number correct/total number) test set percentage (number correct/total number)
model accuracy sensitivity specif icity G-means accuracy sensitivity specif icity G-means
raw 81 (440/546) 85 (179/210) 78 (261/336) 81.4 61 (1015/1668) 64 (105/163) 60 (910/1505) 62.0select1289 81 (440/546) 76 (159/210) 84 (281/336) 79.9 68 (1136/1668) 53 (87/163) 70 (1049/1505) 60.9select1000 81 (444/546) 85 (179/210) 79 (265/336) 81.9 74 (1231/1668) 43 (71/163) 77 (1160/1505) 57.5select900 79 (430/546) 90 (188/210) 72 (242/336) 80.5 82 (1365/1668) 41 (67/163) 86 (1298/1505) 59.4
Journal of Chemical Information and Modeling Article
dx.doi.org/10.1021/ci300060b | J. Chem. Inf. Model. 2012, 52, 1660−16731664
match the mean logP value of active and inactive compoundsfrom our previous binary classification GFA-QSAR model forhERG blockage prediction.37 Applying the logP constraintresulted in training sets that were focused toward thephysicochemical requirements of the hERG receptor. Thethree-best performing classification SVM models derived fromthis data set are listed in Table 2 and ranked by their G-meanvalues. The training set values for accuracy, sensitivity, specif icity,and G-mean are on the left, and the test set values are on theright, respectively. The best SVM model constructed by thisprotocol and validated with 10-fold cross-validation achieved89% accuracy and a G-mean value of 79%. The three-best SVMmodels were used to evaluate the pruned test set (constructedfrom the PubChem data set; AID 376). The resulting accuracyand G-mean values for applying the best SVM model to the testset are 97% and 80%, respectively. This finding demonstratesthat the best SVM model built from this data set is reliable androbust for classifying the hERG toxicity of drug-likecompounds. The removal of “noisy compounds” from thetraining set, by employing the physical property logP filter inaddition to the Lipinksi’s Rule-of-Five filter, effectively “cleans”the data sets and correspondingly increases the classificationperformance of the models, especially when employing SVMstrategies.
Based on the results and success of our previous study,43
combining the descriptors pool for the training set to consist ofall of the MOE descriptors and a selection of the 4D-FP descriptorsresults in the construction of a well-performing hERGclassification SVM model. The “select” set of 4D-FPs containsthe hydrogen bond acceptor (HBA), polar-positive (PP), andpolar-negative (PN) interaction pharmacophore elements(IPEs) that have been shown to contain important molecularinformation needed for hERG blockage classification. Toconfirm that a specific IPE is significant for any hERG dataset, a SVM model based on the filtered hERG data set isconstructed using the selected 4D-FPs minus the IPE of interestand all the MOE descriptors; the results are listed in Table 3.The top three hERG classification models from the training setare ranked by their G-mean values, and the accuracy, sensitivity,specif icity, G-means, and kappa60 values are listed in the first fivecolumns while the last five columns provide these samemeasures for the test set. For the best SVM model, the overallaccuracy is near 90%, with a sensitivity value of 65%, a specif icityvalue of 95%, and a G-mean value of 79%. Moreover, the G-mean value for the top three models constructed from all theMOE and the selected 4D-FPs descriptors are all near 78%.The predicted accuracy, sensitivity, and specif icity values for thetest set using the top three models range from 89% to 97%,
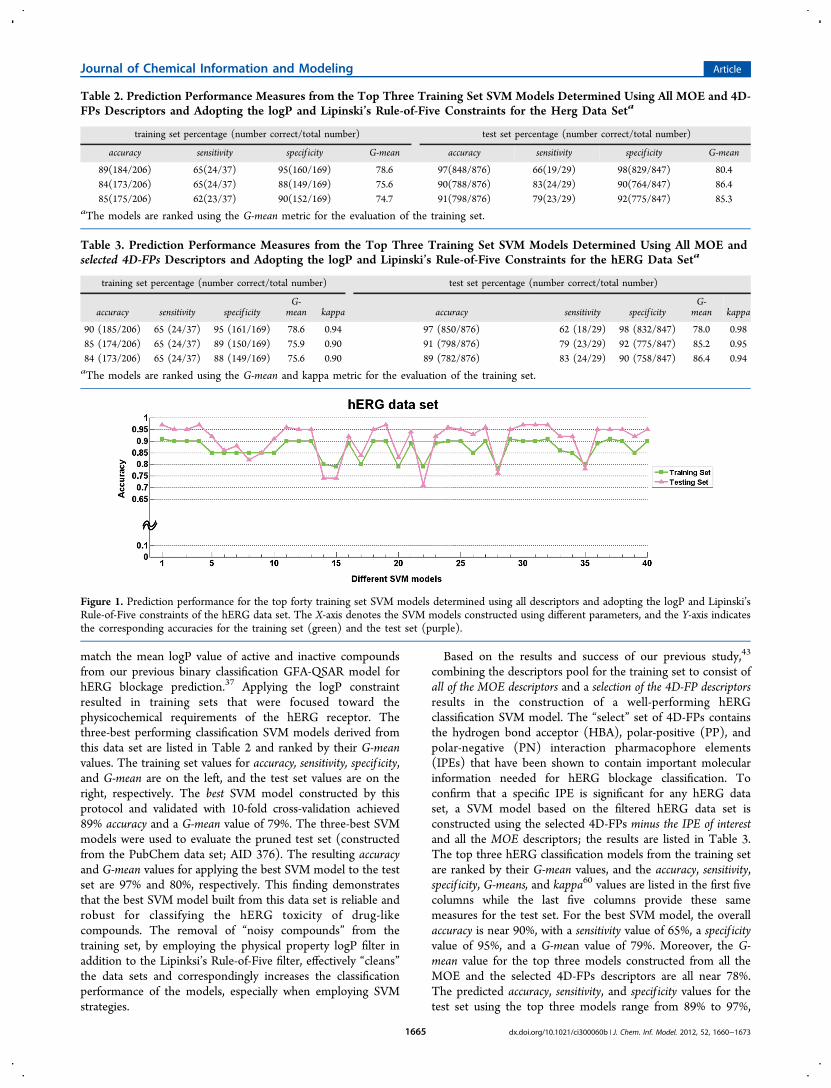
Table 2. Prediction Performance Measures from the Top Three Training Set SVM Models Determined Using All MOE and 4D-FPs Descriptors and Adopting the logP and Lipinski’s Rule-of-Five Constraints for the Herg Data Seta
training set percentage (number correct/total number) test set percentage (number correct/total number)
accuracy sensitivity specif icity G-mean accuracy sensitivity specif icity G-mean
89(184/206) 65(24/37) 95(160/169) 78.6 97(848/876) 66(19/29) 98(829/847) 80.484(173/206) 65(24/37) 88(149/169) 75.6 90(788/876) 83(24/29) 90(764/847) 86.485(175/206) 62(23/37) 90(152/169) 74.7 91(798/876) 79(23/29) 92(775/847) 85.3
aThe models are ranked using the G-mean metric for the evaluation of the training set.
Table 3. Prediction Performance Measures from the Top Three Training Set SVM Models Determined Using All MOE andselected 4D-FPs Descriptors and Adopting the logP and Lipinski’s Rule-of-Five Constraints for the hERG Data Seta
training set percentage (number correct/total number) test set percentage (number correct/total number)
accuracy sensitivity specif icityG-
mean kappa accuracy sensitivity specif icityG-
mean kappa
90 (185/206) 65 (24/37) 95 (161/169) 78.6 0.94 97 (850/876) 62 (18/29) 98 (832/847) 78.0 0.9885 (174/206) 65 (24/37) 89 (150/169) 75.9 0.90 91 (798/876) 79 (23/29) 92 (775/847) 85.2 0.9584 (173/206) 65 (24/37) 88 (149/169) 75.6 0.90 89 (782/876) 83 (24/29) 90 (758/847) 86.4 0.94aThe models are ranked using the G-mean and kappa metric for the evaluation of the training set.
Figure 1. Prediction performance for the top forty training set SVM models determined using all descriptors and adopting the logP and Lipinski’sRule-of-Five constraints of the hERG data set. The X-axis denotes the SVM models constructed using different parameters, and the Y-axis indicatesthe corresponding accuracies for the training set (green) and the test set (purple).
Journal of Chemical Information and Modeling Article
dx.doi.org/10.1021/ci300060b | J. Chem. Inf. Model. 2012, 52, 1660−16731665

62% to 83%, and 90% to 98%, respectively, with the G-meanvalues between 78% and 86%. In Table 3, Cohen’s kappa valuesare also provided as another measurement of the classificationaccuracy. Similar to the G-mean values calculated for our hERGclassification models, the kappa analysis also highly ranked thetop three models with values between 0.90 and 0.98. Thisindicates that these models are highly effective for predicting ifa compound is hERG active. These findings illustrate that theSVM models constructed using the selected 4D-FPs and all of theMOE descriptors improves the predictive ability of the modelsfor the training and test sets.Comparison of Model Building Methods. Since Huang and
Fan1 only provide accuracy values, we will also focus on theaccuracy values within our discussion. In Figure 1, theperformance of our top 40 SVM models using the logP andLipinski’s Rule-of-Five constraints and constructed along withthe classification SVM models constructed with all of themolecular descriptors for the hERG data set are plotted (the X-axis denotes the top 40 SVM models and the Y-axis denotes theaccuracy for the corresponding SVM models). The green linewith squares shows the accuracy values for the training set,while the purple line with the triangles denotes the accuracyvalues for the test set. The training set accuracy ranges from78% to 90% and from 73% to 97% for the test set. The topSVM model based on training set accuracy, with a value of 90%,has an accuracy of 97% for the test set. In the study by Huangand Fan,1 the best SVM model had a training set accuracy near100%, yet the test set had an accuracy of 77%.1 Selecting thebest hERG classification SVM model from the Huang and Fanstudy based on the accuracy of the test set highlights a modelwith an accuracy of 83% for the test set and an accuracy near87% for the training set. The performance of our modelsobviously outperforms the models of Huang and Fan (andother hERG classification studies), and this can be credited tothe use of Lipinski’s Rule-of-Five and logP constraints to focusand balance the numbers of active and inactive hERGcompounds comprising the training set.Interpretation of Key Descriptors. In addition to improving
the screening ability, sound predictive models provide theability to interpret key molecular descriptors related to hERGcardiotoxicity. These descriptors can then be visualized oncompounds known to participate − and those known not toparticipate − in hERG blockage, providing scientists withinsight to the structural and physicochemical aspects ofmolecules that are hERG active and inactive. Since the sameprotocols from our previous SVM models43 were applied toHuang and Fan’s data set to construct improved hERGblockage predictive models, the important molecular descrip-tors are the same as those identified in our previous hERGblockage model. The seven structural features identifiedincluded five positive terms that increase the predicted valuefor hERG blockage, logP(o/w), b_ar, a_nCl, SlogP_VSA6, andε*(np,np), and two negative terms that reduce the predictedvalue for hERG blockage, ε1(np,hba) and ε4(np,hbd). Tovisually investigate the contribution of these seven descriptorsto hERG blockage, projecting the structural characteristics ontomolecules from the Huang and Fan data set is helpful. A stronghERG blocker, Wombat_64, has been selected and depicted inits 2D chemical structure and 3D ball-and-stick rendering(lowest energy conformation), Figure 2. All structural featurescolored red represent constructive descriptor terms that resultin an increase in predicted hERG activity; the darker theshading the more influence the descriptor and thus structural
feature imparts. Wombat_64 does not have any structuralfeatures that contribute to the reduction of a compound’spredicted tendency for hERG blockage. The physical character-istics (properties) of logP(o/w) and SlogP_VSA6 arecombined and correspond to the effective solvent accessiblesurface area for the compound’s nonpolar atoms. The red dotsrepresent the nonpolar solvent accessible surface area, andthese regions significantly increase hERG affinity and blockage.Additionally, Wombat_64 has many nonpolar atoms that are inclose proximity to one another and satisfy the significantconstructive (increase the likelihood of hERG blockage)descriptor ε*(np,np) along with containing many aromaticatoms to satisfy another positive descriptor, b_ar (number ofaromatic bonds). The atoms associated with these moleculardescriptors are colored red, while atoms that represent onehERG blocking descriptor − to increase hERG blockage − arecolored pink. A molecular characteristic that increases thepotential for a compound to block the hERG channel is thenumber of chlorine atoms, a_nCl, and Wombat_64 alsocontains a single chlorine atom. Thus, Wombat_64 −containing the five molecular descriptors [logP(o/w), b_ar,n_aCl, SlogP_VSA6, and ε*(np,np)] that are instrumental to acompound’s ability to block the hERG channel − is an excellentexample of the molecular descriptors that contribute to a stronghERG channel blocker.
T. pyriformis Data Set. The PLS Descriptor Selection of T.pyriformis Data Set. To focus the molecular descriptors andretain those that are closely correlated with the continuousbiological end points, we used the PLS loading matrix to rankthe descriptors. Analyzing the loadings of the first threecomponents (Figure 3), we highlight six descriptors (Table 4)that are highly related to the pIGC50 end points. In theloadings comparison of components 1 and 2 (Figure 3a), theindicated descriptors were related to the Semi-Empiricalcalculated total energy (AM1_E) and electrostatic energy(AM1_Eele). Principal Moments of Inertia (PMI; pmi, pmi2,and pmi3) and hydrophobic surface descriptors (vsurf_D1; aVolSurf-like molecular interaction field 3D molecular descriptor
Figure 2. Wombat_64 (2D depiction and lowest energy conforma-tion). The structural features that contribute to the compound’sincreased hERG blockage are shown in red. The descriptors thatincrease hERG activity are depicted in varying shades of red to reflecttheir relative importance; dark red represents the most significantmolecular descriptor. The red dots illustrate the surface regions of thenonpolar atoms. The biological end point for Wombat_64 is IC50 = 7μM.
Journal of Chemical Information and Modeling Article
dx.doi.org/10.1021/ci300060b | J. Chem. Inf. Model. 2012, 52, 1660−16731666

that describes the hydrophobic volume around a molecule) areindicated as molecular descriptors that are strongly correlatedwith the biological activity of the compounds (Figure 3b and c).These results may imply that T. pyriformis toxicity of thesecompounds is related to electrostatic energy, the ability of the
compound to rotate around an axis, and the hydrophobicnature of the compound.To investigate the relationship between the biological end
points (pIGC50) and the six most influential descriptors, thetwo most and least active compounds and their associateddescriptors of interest were selected for analysis, Table 5. Thedescriptor values of the toxic compounds (most active) arebetween four- and eight-times greater in numerical valuecompared to the nontoxic compounds (least active). The valuesfor the pmi-related descriptors of active compounds areapproximately 100-times greater than for the inactivecompounds. Although the molecular similarity and molecularsize are significantly different between the most and least toxiccompounds displayed in Table 5, the existence of a relationshipbetween the activity and these descriptors is still apparent fromthe constructed predictive models.
Figure 3. The PLS loadings for the first three components of the PLS preliminary T. pyriformis data set model. (a) Component 1 versus Component2. (b) Component 2 versus Component 3. (c) Component 1 versus Component 3. (d) Percent variance explained by each PLS component.Important descriptors are labeled.
Table 4. Six Descriptors Distinguished by Loadings of the 3PLS Components of the T. pyriformis Data Set
symbols description
AM1_E total energy applying AM1 semi-empirical parametrizationAM1_Eele electrostatic energy applying AM1 semi-empirical
parametrizationpmi principal movement of inertiapmi2 second component of principal movement of inertiapmi3 third component of principal movement of inertiavsurf_D1 descriptor related to the hydrophobic surface volume
Journal of Chemical Information and Modeling Article
dx.doi.org/10.1021/ci300060b | J. Chem. Inf. Model. 2012, 52, 1660−16731667

We built a SVR regression model using these six moleculardescriptors (Figure 4), and the coefficient of determination
(R2) for the training set and two test sets were 0.731, 0.695, and0.552, respectively (Table 6). A reason for the low R2 valuesmight be the insufficient amount of information containedwithin the initial six descriptors, thus we selected moredescriptors by considering the significant descriptors in thefirst-seven loading matrices, PLS components 1 through 7.The most significant descriptors from the first-seven PLS
components were selected using the maximum-absolute loadingvalue as a method to rank each descriptor, and the thresholds ofthe loading values were set to 0.01 and 0.001, respectively. Anabsolute loading threshold value greater than 0.01 resulted inthe identification of 102 descriptors, while an absolute loading
value of 0.001 resulted in 204 descriptors being highlighted.The results of these two SVR models are shown in Figure 5 andTable 6, compared with the original 6-term SVR model.Increasing the number of terms in the SVR model from six to102 increased the R2 of the training set from 0.731 to 0.912 and
Table 5. T. pyriformis Compounds with Highest and LowestpIGC50 Values (Most and Least Active) in the Training Setand Their Corresponding Descriptor Values for the 6-TermModel
Figure 4. The predicted pIGC50 value (X-axis), compared withexperimental pIGC50 value (Y-axis), of the SVR Model usingdescriptors selected by the loadings of the first three components ofthe PLS model constructed from the T. pyriformis data set. Thetraining set and the test sets 1 and 2 are represented respectively asgreen circles, blue triangles, and cyan diamonds.
Table 6. Leave-One-Out R2 Validation of SVM Models withDifferent Number of Terms Selected by the Preliminary PLSModel for the T. pyriformis Data Set
trainingset
testing set#1
testing set#2
6 terms 0.731 0.695 0.552102 terms max(abs(loadings)) >0.01
0.912 0.817 0.613
204 terms max(abs(loadings)) >0.001
0.928 0.832 0.620
Figure 5. The predicted pIGC50 value (X-axis) of the T. pyriformisdata set, compared with experimental pIGC50 value (Y-axis), of theSVR Models of (a) the 102-term model (maximum abs(loading) >0.01) and (b) the 204-term model (maximum abs(loading) > 0.001).The training set and the test sets 1 and 2 are represented respectivelyas green circles, blue triangles, and cyan diamonds.
Journal of Chemical Information and Modeling Article
dx.doi.org/10.1021/ci300060b | J. Chem. Inf. Model. 2012, 52, 1660−16731668

resulted in test sets 1’s and 2’s R2 increasing from 0.695 to0.817 and 0.552 to 0.613, respectively. Increasing the numberof descriptors available to 204, and thus constructing a 204-term SVR model, increased the R2 of the training set and testsets 1 and 2 to 0.924, 0.832, and 0.620, respectively. The testset validation results for the 204-term SVR model isapproximate to the models reported by Huang and Fan1 andZhu and co-workers.35
To determine if the prediction performance would improvewith additional descriptors, SVR models were built by addingdescriptors based on the order of their maximum absolute PLSloading values (score). In an iterative fashion, a SVR model wasbuilt with the most important molecular descriptor followed bythe creation of another SVR model built with the two mostimportant descriptors. This process was continued until all 719molecular descriptors were used to construct a SVR model. Thecoefficient of determination (R2) is plotted in Figure 6 for the
training and test sets. As illustrated in Figure 6, the R2 values oftest sets 1 and 2 start to decrease once the SVR model isconstructed with more than approximately 300 of the mostimportant molecular descriptors − based on PLS loadingvalues. A reason the predictive ability of the models’ decreasedwith each additional descriptor (for models with greater thanapproximately 300 molecular descriptors) for each of the testsets is most likely that the models are exhibiting signs ofoverfitting. Therefore, the 204-term SVR model was selectedfor the following outlier removal experiments because of itspredictive abilities for the training and test sets.Outlier Removal Using “Distance to Model” Methods.
Tetko et al. suggested that within a QSAR model the distancebetween the descriptor values of the training set and the testset, or the compound(s) of interest, influences the error in thepredicted activity.36 The descriptor space − the numericalrange that each descriptor in the model (training set) covers −directly impacts how well the model will predict compoundsthat were not used to construct the model, commonly referredto as the “Applicability Domain” of a model. In the studies
relating to the T. pyriformis data set,1,35,36 the R2 values of testset 2 were below 0.70. Typically, R2 values below this valueindicate that a QSAR model was not very adept at predictingthe bioactivity for a series of compounds, and, in this example,the model is not able to adequately predict the experimentalbioactivity values for test set 2 of the T. pyriformis data set. Apossible reason for the low predictive performance of themodels when applied to test set 2 is that there were somecompounds outside of the “Applicability Domain” as defined bythe training set compounds. To explore the applicabilitydomain of our 204-term SVR model, the descriptor distancebetween each test set compounds and the training set wascalculated; this is commonly referred to as the “Distance toModel”.We compared the “Distance to Model” to the prediction
error (Figure 7) and calculated the Pearson’s correlationcoefficient (R; Table 7) between the two values. The trainingset’s correlation coefficient between the error of prediction andthe “Distance to Model” was 0.100, while the correlationscoefficients for test sets 1 and 2 were 0.273 and 0.215,respectively. A test set compound might only need a smallportion of the compounds in the training set to adequatelydescribe its activity. To explore this concept the distancebetween the nearest neighbor distances were explored.Accordingly, the pairwise distances between all of the trainingset and test set compounds were calculated to determine the 3-nearest-neighbor (3-NN) distances. Using the 3-NN method,the training set R increased to 0.118, and the correlationcoefficients of the two test sets increased to 0.368 and 0.316,respectively. Reducing the number of neighboring compoundsfrom “all compounds” to “three compounds” for the correlationbetween the error of prediction and the “Distance to Model”evaluation resulted in a “stronger” correlation. These results canbe interpreted in several ways; the first is that more than threecompounds are needed to sufficiently predict the end point forthe compounds in the training and test sets, the second is thatthe prediction error cannot be estimated by calculating the 3-NN distance, and the third is that it can be determined if a testset compound fits the model and thus can aid in removingoutliers.Using the 3-NN criteria to filter outliers from the test set was
explored by restricting the “distance” between the test setcompound and its three nearest-neighbors of the training set;the 3-NN distance was bound to less than or equal to 20, 15,and 10. Investigating the effects of outlier removal was focusedon test set 2 due to the poor performance of the QSAR modeland to provide insight regarding the removal of test setcompounds that are not similar to training set compounds(outliers). The R2 (predicted versus experimentally determineend points) for the complete version of test set 2 was 0.620 andis not as impressive as test set 1’s R2 of 0.832. Using the 3-NNdistance as a filter, test set 2 compounds with a distance greaterthan 20, 15, and 10 were removed, and the R2 was recalculatedfor each remaining allotment of test set 2 compounds.Including only test set 2 compounds with a “Distance toModel” less than 20 from the training set slightly improved theR2 to 0.621. Reducing the distance threshold to 15 increases theR2 value to 0.675, while further reducing the threshold to 10caused the R2 value to decrease to 0.645. The decrease in the R2
value when reducing the threshold value from 15 to 10 mightbe due to compounds that fit within the applicability domain −and helps to explain the important physicochemical propertiesof the test set 2 compounds − were filtered out. While the R2
Figure 6. The R2 of SVM models built by descriptors added to themodel by sorting of the maximum of absolute value of loadings of theT. pyriformis data set. The training set and the test sets 1 and 2 arerepresented respectively as green, blue, and cyan lines.
Journal of Chemical Information and Modeling Article
dx.doi.org/10.1021/ci300060b | J. Chem. Inf. Model. 2012, 52, 1660−16731669
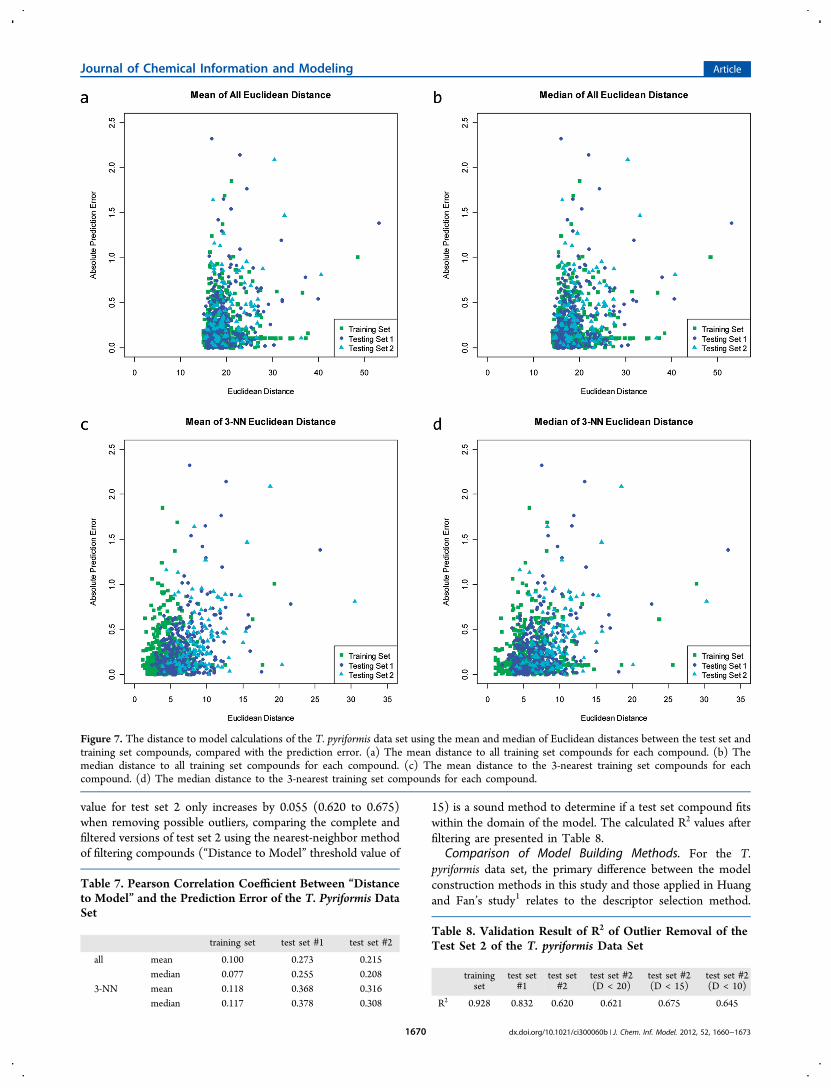
value for test set 2 only increases by 0.055 (0.620 to 0.675)when removing possible outliers, comparing the complete andfiltered versions of test set 2 using the nearest-neighbor methodof filtering compounds (“Distance to Model” threshold value of
15) is a sound method to determine if a test set compound fitswithin the domain of the model. The calculated R2 values afterfiltering are presented in Table 8.
Comparison of Model Building Methods. For the T.pyriformis data set, the primary difference between the modelconstruction methods in this study and those applied in Huangand Fan’s study1 relates to the descriptor selection method.
Figure 7. The distance to model calculations of the T. pyriformis data set using the mean and median of Euclidean distances between the test set andtraining set compounds, compared with the prediction error. (a) The mean distance to all training set compounds for each compound. (b) Themedian distance to all training set compounds for each compound. (c) The mean distance to the 3-nearest training set compounds for eachcompound. (d) The median distance to the 3-nearest training set compounds for each compound.
Table 7. Pearson Correlation Coefficient Between “Distanceto Model” and the Prediction Error of the T. Pyriformis DataSet
training set test set #1 test set #2
all mean 0.100 0.273 0.215median 0.077 0.255 0.208
3-NN mean 0.118 0.368 0.316median 0.117 0.378 0.308
Table 8. Validation Result of R2 of Outlier Removal of theTest Set 2 of the T. pyriformis Data Set
trainingset
test set#1
test set#2
test set #2(D < 20)
test set #2(D < 15)
test set #2(D < 10)
R2 0.928 0.832 0.620 0.621 0.675 0.645
Journal of Chemical Information and Modeling Article
dx.doi.org/10.1021/ci300060b | J. Chem. Inf. Model. 2012, 52, 1660−16731670

The utilization of a genetic algorithm (GA)25 is a familiarpractice for descriptor selection and the construction of anensemble of QSAR models. Where the GA protocol of Huangand Fan fails is the duration of the GA’s evolutionary growth.1
It is common to terminate a GA after several hundredgenerations (a thousand generations is considered standard)without a change to the surviving population (best models).The GA parameters, as described by Huang and Fan,constrained the number of descriptors in each model tobetween three and ten molecular descriptors − which isacceptable − but the low number of models within thepopulation (50 models) and the extremely short evolutionaryperiod (30 generations) did not allow the GA to adequatelyexplore the descriptor space. The short period of modelcreation might highlight a few influential molecular descriptors,but it is definitely not enough evolutionary time to construct asufficiently sound QSAR ensemble and reveal the trulymeaningful descriptors. An efficient and sound protocol todetermine the most relevant molecular descriptors is theanalysis of a preliminary PLS model. Our final SVR model wasbuilt from approximately 300 molecular descriptors that wereranked using the PLS loading values; this protocol resulted in asuitable SVR model that did not exhibit overfitting.
■ DESIGNING THE PROTOCOLS TO IMPROVE THEMODELS
The protocols used to assemble the training set along with theselection of descriptors and the construction of the model havethe most influence over the models’ robustness and predictiveability. For the hERG data set, the training and test sets werecomprised of compounds that passed the Lipinski’s Rule-of-Five57 and were within a specific relative lipophilicity (octanol/water partition coefficient, logP, values) range (training setcompounds: active compounds with a calculated logP value lessthan 4.1 and inactive compounds with a logP value greater than2.8).37 Additionally, the hERG descriptor trial pool included areduced set of the 4D-FP descriptors based on PLS loadingvalues to ensure the SVM model’s hyperplanes contained(molecular) information that was strongly relevant to thebiological end points. These key features of the hERG data setprotocols resulted in a SVM model with an improved predictivenature for the training set and, most importantly, the test set.The T. pyriformis data set was defined by Zhu et al.,35 thus
the protocol to improve the predictive ability of the models wasfocused on the manner of selecting molecular descriptors forthe SVR model and developing a better understanding of therelationship between the compounds in the training set and testsets. While it can be argued that the models presented hereinare marginally better than Zhu and co-workers,35 the overallknowledge gained by including a mixed-class and biologicallyrelevant set of molecular descriptors provides a bettermolecular understanding of the overall toxicology for the dataset. As noted above, the GA search for collections of importantmolecular descriptors in the Huang and Fan1 study did nothave adequate evolutionary periods, and thus the mostimportant descriptors were not passed on to the SVR models.Instead of using a GA to select the descriptors, the workpresented here used the PLS loadings to determine the set ofdescriptors that relate to the biological end points.The two data sets − hERG blockage (a discrete data set) and
T. pyrifomis (a continuous data set) − were discussed andexplored because they are commonly considered difficult withrespect to constructing practical predictive models. Each data
set presented different hurdles to overcome and provided theopportunity to demonstrate the protocols and methodologiesthat are commonly used in building sound predictive modelsfor discrete and continuous data sets. For example, selectingdescriptors for the hERG data set required the use of the F-score, yet this methodology cannot be applied to continuousdata sets like the T. pyriformis data set, while the PLS loadingscore method used to distinguish important moleculardescriptors in the T. pyrifomis data set is not suitable fordiscrete data sets. However, like all experiments, the protocolsand methodologies must be adapted to suit the data set ofinterest.
■ CONCLUSIONThe ability to construct, evaluate, and apply a QSAR modelusing contemporary methodologies and protocols is not atrivial process and requires attention to detail. The data sets,hERG and T. pyriformis, explored in this work have beenextensively investigated, and each study provides additionalinformation about the overall molecular system and/or insightsto the modeling protocols and methods. The focus of this studywas to provide insight to robust protocols, demonstrate currentQSAR methodologies, and the implementation of theseprotocols and methodology to notoriously difficult data sets.Using various statistical methods, sound predictive models wereconstructed and analyzed. Selecting significant moleculardescriptors using PLS loadings values to construct a SVRmodel reduced the number of weightless molecular descriptors.Harnessing the power of biologically relevant moleculardescriptors across multiple descriptor class improves the overallinterpretability of the models,60 while the combination of soundprotocols and methodologies helps to showcase the possibilitiesof QSAR modeling.Overall, the protocols used for the hERG and T. pyriformis
data sets have common threads that can be applied to anypredictive modeling study: (i) construct the trial descriptorpool from relevant descriptors, (ii) remove the noise from thetraining set (whether this be molecules or other entities), (iii)select descriptors that are strongly related (correlated) to theend points of interest to construct the models, and (iv) analyzeand understand the results for the training and test sets. Whilethese protocols are somewhat apparent and universal, themanner they are applied can vary from system to system, anddiscovering the optimal combination is key to robust andinsightful predictive models.
■ AUTHOR INFORMATIONCorresponding Author*Phone: +886.2.3366.4888 #529. Fax: +886.2.23628167. E-mail: [email protected] Contributions#Equal contribution to this work.NotesThe authors declare no competing financial interest.
■ ABBREVIATIONS:T. pyriformis = Tetrahymena pyriformishERG = Ether-a-go-go Related GeneQSAR = Quantitative Structure−Activity RelationshipSVM = Support Vector MachineSVR = Support Vector RegressionGA = Genetic Algorithm
Journal of Chemical Information and Modeling Article
dx.doi.org/10.1021/ci300060b | J. Chem. Inf. Model. 2012, 52, 1660−16731671

MOE = Molecular Operating Environment4D-FPs = 4D-FingerprintsTdP = Torsades de PointesPLS = partial least-squaresROC = receiver operating characteristicGF = Agenetic function approximationkNN = k-nearest neighborsMLR = machine-learned rankingOLS = ordinary least-squaresASNN = associative neural networkANN = artificial neural networkR2 = coefficient of determinationLOO = leave-one-outQ2 = leave-one-out cross-correlationMD = molecular dynamicIPEs = interaction pharmacophore elementsHBA = hydrogen bond acceptorPP = polar-positivePN = polar-negative
■ REFERENCES(1) Huang, J.; Fan, X. Why QSAR Fails: An Empirical EvaluationUsing Conventional Computational Approach. Mol. Pharm. 2011, 8(2), 600−608.(2) Holland, J. H. Adaptation in Natural and Artificial Systems: anIntroductory Analysis with Applications to Biology, Control, andArtificial Intelligence. University of Michigan, Ann Arbor, MI, 1975.(3) Drucker, H.; Burges, C. J. C.; Kaufman, L.; Smola, A.; Vapnik, V.Support Vector Regression Machines. Adv. Neural Inf. Process. Syst.1997, 155−161.(4) Vapnik, V. N. Statistical Learning Theory; Wiley: New York, 1998.(5) Vapnik, V. N. The Nature of Statistical Learning Theory; 2000.(6) Brown, A. M. Drugs, hERG and Sudden Death. Cell. Physiol.Biochem. 2004, 35, 543−547.(7) Pearlstein, R. A.; Vaz, R. J.; Kang, J.; Chen, X. L.;Preobrazhenskaya, M.; Shchekotikhin, A. E.; Korolev, A. M.;Lysenkova, L. N.; Miroshnikova, O. V.; Hendrix, J.; Rampe, D.Characterization of hERG Potassium Channel Inhibition UsingCoMSiA 3D QSAR and Homology Modeling Approaches. Bioorg.Med. Chem. Lett. 2003, 13, 1829−1835.(8) Recanatini, M.; Poluzzi, E.; Masetti, M.; Cavalli, A.; De Ponti, F.QT Prolongation Through hERG K+ Channel Blockade: CurrentKnowledge and Strategies for the Early Prediction During DrugDevelopment. Med. Res. Rev. 2005, 25, 133−166.(9) Sanguinetti, M. C.; Jiang, C.; Curran, M. E.; Keating, M. T. AMechanistic Link Between an Inherited and an Acquired CardiacArrhythmia: hERG Encodes the IKr Potassium Channel. Cell 1995, 81(2), 299−307.(10) Aptula, A.; Cronin, M. Prediction of hERG K+ BlockingPotency: Application of Structural Knowledge. SAR QSAR Environ.Res. 2004, 15 (5−6), 399−411.(11) Cianchetta, G.; Li, Y.; Kang, J.; Rampe, D.; Fravolini, A.;Cruciani, G.; Vaz, R. Predictive Models for hERG Potassium ChannelBlockers. Bioorg. Med. Chem. Lett. 2005, 15 (15), 3637−3642.(12) Coi, A.; Massarelli, I.; Murgia, L.; Saraceno, M.; Calderone, V.;Bianucci, A. Prediction of hERG Potassium Channel Affinity by theCODESSA Approach. Bioorg. Med. Chem. 2006, 14 (9), 3153−3159.(13) Obrezanova, O.; Csanyi, G.; Gola, J. M. R.; Segall, M. D.Gaussian Processes: A Method for Automatic QSAR Modeling ofADME Properties. J. Chem. Inf. Model. 2007, 47 (5), 1847−1857.(14) Chen, X.; Li, H.; Yap, C.; Ung, C.; Jiang, L.; Cao, Z.; Li, Y.;Chen, Y. Computer Prediction of Cardiovascular and HematologicalAgents by Statistical Learning Methods. Cardiovasc. Hematol. AgentsMed. Chem. 2007, 5 (1), 11−19.(15) Roche, O.; Trube, G.; Zuegge, J.; Pflimlin, P.; Alanine, A.;Schneider, G. A Virtual Screening Method for Prediction of the hERG
Potassium Channel Liability of Compound Libraries. ChemBioChem2002, 3, 455−9.(16) Sun, H. An Accurate and Interpretable Bayesian ClassificationModel for Prediction of hERG Liability. ChemMedChem 2006, 1 (3),315−322.(17) Gepp, M.; Hutter, M. Determination of hERG ChannelBlockers Using a Decision Tree. Bioorg. Med. Chem. 2006, 14 (15),5325−5332.(18) Jia, L.; Sun, H. Support Vector Machines Classification of hERGLiabilities Based on Atom Types. Bioorg. Med. Chem. 2008, 16 (11),6252−6260.(19) Leong, M. A Novel Approach Using Pharmacophore Ensemble/Support Vector Machine (PhE/SVM) for Prediction of hERGLiability. Chem. Res. Toxicol. 2007, 20 (2), 217−216.(20) Song, M.; Clark, M. Development and Evaluation of an in silicomodel for hERG Binding. J. Chem. Inf. Model. 2006, 46, 392−400.(21) Tobita, M.; Nishikawa, T.; Nagashima, R. A Discriminant ModelConstructed by the Support Vector Machine Method for hERGPotassium Channel Inhibitors. Bioorg. Med. Chem. Lett. 2005, 15,2886−2890.(22) Keseru, G. M. Prediction of hERG Potassium Channel Affinityby Traditional and Hologram qSAR Methods. Bioorg. Med. Chem. Lett.2003, 13, 2773−5.(23) Li, Q.; Jørgensen, F. S.; Oprea, T.; Brunak, S.; Taboureau, O.hERG Classification Model Based on a Combination of SupportVector Machine Method and GRIND Descriptors. Mol. Pharmaceutics2008, 5 (2), 117−127.(24) National Center for Biotechnology Information, hERG ChannelActivity (AID: 376, Source: PDSP). In The PubChem BioAssayDatabase; National Center for Biotechnology Information: Bethesda,Maryland, USA, 2009.(25) Hopfinger, A. J.; Patel, H. C. Application of Genetic Algorithmsto the General QSAR Problem and to Guiding Molecular DiversityExperiments. In Genetic algorithms in molecular modeling; Devillers, J.,Ed.; Academic Press: 1996; pp 131−157.(26) Meffert, K.; Meseguer, J.; Martí, E. D.; Meskauskas, A.; Vos, J.;Rotstan, N.; Knowles, C.; Sangiorgi, U. B. JGAP - Java GeneticAlgorithms and Genetic Programming Package.(27) Schultz, T. W. Structure−Toxicity Relationships for BenzenesEvaluated with Tetrahymena pyriformis. Chem. Res. Toxicol. 1999, 12(12), 1262−1267.(28) Schultz, T. W. TETRATOX: Tetrahymena pyriformis PopulationGrowth Impairment Endpoint-A Surrogate for Fish Lethality. Toxicol.Mech. Methods 1997, 7 (4), 289−309.(29) The TETRATOX Database. http://www.vet.utk.edu/TETRATOX/index.php.(30) Cronin, M. T. D.; Aptula, A. O.; Duffy, J. C.; Netzeva, T. I.;Rowe, P. H.; Valkova, I. V.; Wayne Schultz, T. ComparativeAssessment of Methods to Develop QSARs for the Prediction of theToxicity of Phenols to Tetrahymena pyriformis. Chemosphere 2002, 49(10), 1201−1221.(31) Cronin, M. T. D.; Gregory, B. W.; Schultz, T. W. QuantitativeStructure−Activity Analyses of Nitrobenzene Toxicity to Tetrahymenapyriformis. Chem. Res. Toxicol. 1998, 11 (8), 902−908.(32) Cronin, M. T. D.; Schultz, T. W. Development of QuantitativeStructure−Activity Relationships for the Toxicity of AromaticCompounds to Tetrahymena pyriformis: Comparative Assessment ofthe Methodologies. Chem. Res. Toxicol. 2001, 14 (9), 1284−1295.(33) Dearden, J. C.; Cronin, M. T. D.; Schultz, T. W.; Lin, D. T.QSAR Study of the Toxicity of Nitrobenzenes to Tetrahymenapyriformis. Quant. Struct.-Act. Relat. 1995, 14 (5), 427−432.(34) Schultz, T. W.; Hewitt, M.; Netzeva, T. I.; Cronin, M. T. D.Assessing Applicability Domains of Toxicological QSARs: Definition,Confidence in Predicted Values, and the Role of Mechanisms ofAction. QSAR Comb. Sci. 2007, 26 (2), 238−254.(35) Zhu, H.; Tropsha, A.; Fourches, D.; Varnek, A.; Papa, E.;Gramatica, P.; Oberg, T.; Dao, P.; Cherkasov, A.; Tetko, I. V.Combinatorial QSAR Modeling of Chemical Toxicants Tested againstTetrahymena pyriformis. J. Chem. Inf. Model. 2008, 48 (4), 766−784.
Journal of Chemical Information and Modeling Article
dx.doi.org/10.1021/ci300060b | J. Chem. Inf. Model. 2012, 52, 1660−16731672

(36) Tetko, I. V.; Sushko, I.; Pandey, A. K.; Zhu, H.; Tropsha, A.;Papa, E.; Oberg, T.; Todeschini, R.; Fourches, D.; Varnek, A. CriticalAssessment of QSAR Models of Environmental Toxicity againstTetrahymena pyriformis: Focusing on Applicability Domain andOverfitting by Variable Selection. J. Chem. Inf. Model. 2008, 48 (9),1733−1746.(37) Su, B.-H.; Shen, M.-Y.; Esposito, E. X.; Hopfinger, A. J.; Tseng,Y. J. In silico Binary Classification QSAR Models Based on 4D-Fingerprints and MOE Descriptors for Prediction of hERG Blockage.J. Chem. Inf. Model. 2010, 50 (7), 1304−1318.(38) Rogers, D.; Hopfinger, A. J. Application of Genetic FunctionApproximation to Quantitative Structure-Activity Relationships andQuantitative Structure-Property Relationships. J. Chem. Inf. Comput.Sci. 1994, 34, 854−866.(39) Bains, W.; Basman, A.; White, C. hERG Binding Specificity andBinding Site Structure: Evidence from a Fragment-Based EvolutionaryComputing SAR Study. Prog. Biophys. Mol. Biol. 2004, 86, 205−33.(40) Dubus, E.; Ijjaali, I.; Petitet, F.; Michel, A. In silico Classificationof hERG Channel Blockers: a Knowledge-Based Strategy. Chem-MedChem 2006, 1 (6), 622−630.(41) Nisius, B.; Goller, A. H. Similarity-Based Classifier UsingTopomers to Provide a Knowledge Based for hERG ChannelInhibition. J. Chem. Inf. Model. 2008, 49, 247−256.(42) Chekmarev, D. S.; Kholodovych, V.; Balakin, K. V.; Ivanenkov,Y.; Ekins, S.; Welsh, W. J. Shape Signatures: New Descriptors forPredicting Cardiotoxicity In Silico. Chem. Res. Toxicol. 2008, 21 (6),1304−1314.(43) Shen, M.-y.; Su, B.-H.; Esposito, E. X.; Hopfinger, A. J.; Tseng,Y. J. A Comprehensive Support Vector Machine Binary hERGClassification Model Based on Extensive but Biased End Point hERGData Sets. Chem. Res. Toxicol. 2011, 24 (6), 934−949.(44) Hypercube Hyperchem Release 7.0; 2008.(45) Allinger, N. L. Conformational Analysis. 130. MM2. AHydrocarbon Force Field Utilizing V1 and V2 Torsional Terms. J.Am. Chem. Soc. 1977, 99 (25), 8127−8134.(46) Chemical Computing Group Inc. MOE (Molecular OperatingEnvironment), 2010.10; Montreal, Canada, 2010.(47) Senese, C. L.; Duca, J.; Pan, D.; Hopfinger, A. J.; Tseng, Y. J.4D-Fingerprints, Universal QSAR and QSPR Descriptors. J. Chem. Inf.Model. 2004, 44 (5), 1526−1539.(48) Cruciani, G.; Crivori, P.; Carrupt, P.; Testa, B. Molecular Fieldsin Quantitative Structure−Permeation Relationships: the VolSurfApproach. J. Mol. Struct. (Theochem) 2000, 503 (1−2), 17−30.(49) Cruciani, G.; Pastor, M.; Guba, W. VolSurf: a New Tool for thePharmacokonetic Optimization of Lead Compounds. Eur. J. Pharm.Sci. 2000, 11, S29−S39.(50) Iyer, M.; Hopfinger, A. J. Treating Chemical Diversity in QSARAnalysis: Modeling Diverse HIV-1 Integrase Inhibitors Using 4DFingerprints. J. Chem. Inf. Model. 2007, 47 (5), 1945−1960.(51) Chang, C.-C.; Lin, C.-J. LIBSVM: A Library for Support VectorMachines. ACM Trans. Intell. Syst. Technol. 2011, 2 (3), 1−27.(52) R Development Core Team, R: A Language and Environment forStatistical Computing; Vienna, Austria, 2011.(53) Dimitriadou, E.; Hornik, K.; Leisch, F.; Meyer, D.; Weingessel,a. A. e1071: Misc Functions of the Department of Statistics (e1071), TUWien; 2011.(54) Wehrens, R.; Mevik, B.-H.pls: Partial Least Squares Regression(PLSR) and Principal Component Regression (PCR); 2007.(55) Cohen, J. A Coefficient of Agreement for Nominal Scales. Educ.Psychol. Meas. 1960, 20 (1), 37−46.(56) Akay, M. F. Support Vector Machines Combined with FeatureSelection for Breast Cancer Diagnosis. Expert Syst. Appl. 2009, 36,3240−3247.(57) Lipinski, C. A.; Lombardo, F.; Dominy, B. W.; Feeney, P. J.Experimental and Computational Approaches to Estimate Solubilityand Permeability in Drug Discovery and Development Settings. Adv.Drug Delivery Rev. 1997, 23, 3−25.
(58) Thai, K. M.; Ecker, G. F. A Binary QSAR Model forClassification of hERG Potassium Channel Blockers. Bioorg. Med.Chem. 2008, 16 (7), 4107−19.(59) Yoshida, K.; Niwa, T. Quantitative structure-activity relationshipstudies on inhibition of HERG potassium channels. J. Chem. Inf. Model.2006, 46, 1371−8.(60) Tseng, Y. J.; Hopfinger, A. J.; Esposito, E. X. The GreatDescriptor Melting Pot: Mixing Descriptors for the Common Good ofQSAR Models. J. Comput.-Aided Mol. Des. 2012, 26 (1), 39−43.
Journal of Chemical Information and Modeling Article
dx.doi.org/10.1021/ci300060b | J. Chem. Inf. Model. 2012, 52, 1660−16731673