predictive modeling - ohio insurance institute · pdf filesystem, process, behavior, or...
TRANSCRIPT
PREDICTIVE MODELINGCentral Ohio Insurance Education Day –April 15, 2015
Tim Crespin, Ph.D.AVP-Director, Predictive ModelingState Auto Insurance Companies

Organizing Questions• What is Predictive Modeling (PM)? –Part 1• What is Predictive Modeling (PM)? –Part 2• Why is PM of interest?• When did PM come on scene?• Where is PM?• Who works with PM?• How is PM done?• What is Predictive Modeling (PM)? –Part 3• Q & A

WHAT IS PM?Part 1: Logic

Formal symbolic logicGLM with Tweedie distribution in loss cost models
Where
( ) ( ) ( )
= pytpwynawynf ,,exp,;,,;, µϕωϕρϕ
( ) ( )( ) ( ) ( )ynnpp
ywpwynan
αϕϕ α
αα
Γ
−−=
+
!1
21,;,
1
1 2
( , , )1 2
p p
t y p yp p
µ µµ− −
= −− −
)1/()2( −−= ppα
dtetn tn −∞ −∫=Γ0
1)( αα
4
“Beware of geeks bearing formulas” - Warren Buffett
“Because the math is really complicated people assume it must be right”
- Nigel Goldenfeld
"All models are wrong but some are useful" - George E.P. Box
Street logic

Applied Multivariate Statistical Analysis• Mathematical constructs put into symbolic form• Allow us to understand and develop the logic of PM• Advanced, specialized education is required• Most predictive modelers have advanced degrees
(Ph.D.’s or Master’s)• Statistics• Biostatistics• Decision sciences• Econometrics• Social/behavioral sciences• Emerging field: Data Science

WHAT IS PM?Part 2: Real life represented in equations

Intelligent Simplification of Reality

Fundamental Characteristics of PM’s Intelligent simplification of reality Built on specialized theory, technique,
assumptions Dependent on data input, calculations, output Produces a prediction relevant to business
context May greatly increase efficiency and
effectiveness of decision Challenging to understand and communicate

Methodical, Measurable• Conceptual and design soundness• Rigorous technical testing and validation• Interpretability of model content and output• Actionable insight to aid business decision making• Quantifiable improvements over existing operational
processes and business outcomes
00.10.20.30.40.50.60.70.80.9
1
0 1 2 3 4 5 6 7 8 9 10
Model
Auto Mid-Term Cancellation Model ROC

WHY IS PM OF INTEREST?

Necessary and impactful
• Accuracy and efficiency in decision making• Necessary to compete in today’s world• Changes the nature of work• Impact on finances, customers, reputation

Endless possibilities for applicationsTypes of Target
VariablesDichotomous
Categorical
Ordinal
Interval/ratio
Change, trend
Types of Questions
Level, amount
Odds, probability
Frequency
Variability
Duration, latency
Group membership
Types of Applications
Predict
Describe, Explain
Estimate
Prioritize
Optimize, economize
Alert

Developing quantitative vision and insight
Based on: Competing on Analytics, Davenport and Harris, 2007Degree of Complexity
Com
petit
ive
Adva
ntag
e
Standard Reporting
Ad hoc reporting
Query/drill down
Alerts
Simulation
Forecasting
Predictive modeling
Optimization
What exactly is the problem?
What will happen next if …?
What if these trends continue?
What could happen…. ?
What actions are needed?
How many, how often, where?
What happened?
Stochastic Optimization
How to achieve the best outcome?
How to achieve the best outcome including the effects of variability?
Descriptive Analytics
Support ongoing business operations
Meet compliance requirements
Advanced Analytics
Prescriptive and Predictive
Support new business models and opportunities

WHERE IS PM?We touch predictive models and they touch us.

Woven Into the Fabric of Commerce
• Retailers: Product recommendation• Mobile telecom: Cross sell, deep sell, churn,
“savability”.• Search engines: Target advertising and marketing• Banks: Credit risk management• Healthcare: Readmissions case-management and
patient care improvement• Weather service: Weather forecasting

Insurance: Many ways, many uses
Mathematically find best solution
among many options and constraints.
Replicate a system, process,
behavior, or business problem.
Advanced Analytics
Forecasting, data-mining,
econometrics, statistical modeling
Predictive modeling creates/improves business rules. Also, business rules govern the output and
use of predictive models in production.
Improve business processes, decisions.
Uses:
Gain insight by seeing graphical patterns in data and modeling results.
Underwriting
Contact Center
Billing
Profitability
Marketing
Pricing
Risk & Fraud
Claims
Sales & Distribution
Customer
Predictive modeling is critically dependent upon good data sources. Predictive modelers discover errors
and new opportunities for data.
OptimizationSimulationPredictive Analytics
Visualization
Business Rules
ManagementEnterprise Information
Management

Every Phase of the Insurance Policy Lifecycle
• Marketing and customer insight
• Product development and innovation
• Risk selection and pricing
• Expense management and profitability
• Business process optimization
• Agency relations / distribution management

Example 1: Knowing our customers
Acquisition and relationship
management
• Target campaigns for products/features to relevant segments of population.
Target Marketing
• Estimate renewal probability, longevity of ongoing customer relationship.
Retention
• Lower costs of conversion by targeting customers most likely to respond.
Response Models
Example Applications
• Identify products most likely purchased / bundled by similar customers.
Cross-Sell

Example 2: Claims Fraud Analytics
Underwriting Intake / Triage Adjudication Optimization Monitoring
Prevention Alerts Identifi-cation Discovery
Investi-gation Monitoring
Identify fraud risks at policy
submission
Preventive Underwriting
• Number of Claims within 30 days of Eff Date from this Agent
Flag & route fraudulent
claims at intake
Anomaly DetectionFraud Schema
LibraryPredictive Models
• Claimant, police officer, and body shop seen 5 times previously
Help Adjuster ID fraud during
adjudication
Identity ResolutionSocial Network
AnalysisText / Content
• Twitter post identified and reported to Adjuster
Perpetually analyze loss
data to ID fraud
Patterns/ClustersSocial Data
• New pattern of data discovered -applied to entire claims book
Investigate, prosecute &
recover fraud
Unstructured dataEntity Link Analysis
Social Network Visualization
• Productivity increase as more pattern detection is automated
Report claim fraud outcomes
and statistics
Geo-SpatialTrend Analysis
• Geo-spatial analysis of ratio of BI claims in specific area
•Address fraud and abuse throughout the claims lifecycle.

WHEN DID PM APPEAR?Introduction and proliferation within insurance
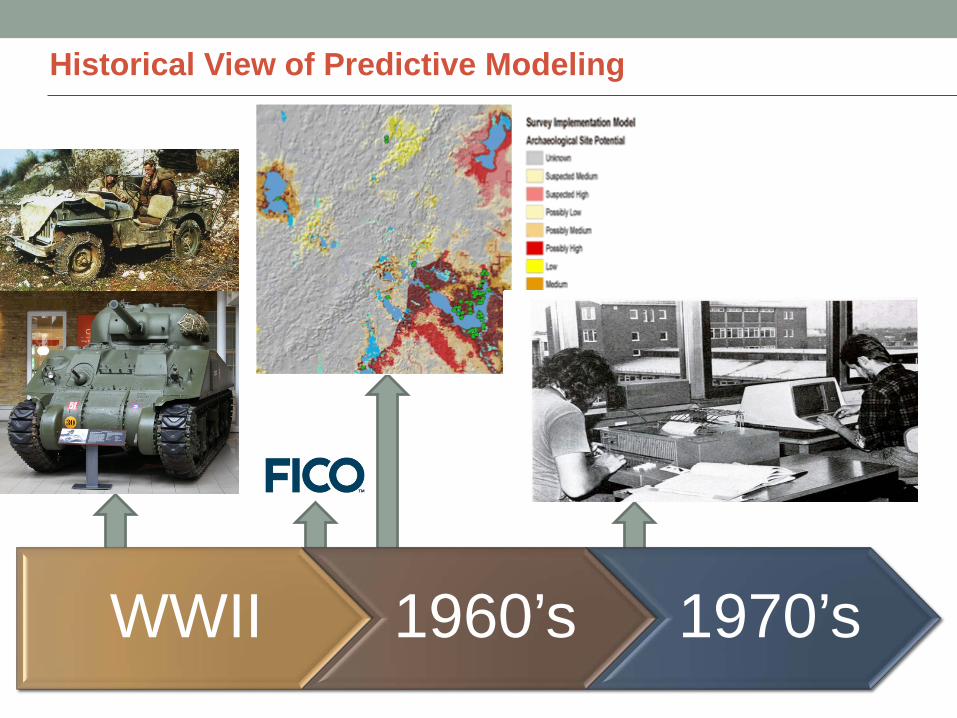
Historical View of Predictive Modeling
WWII 1960’s 1970’s

Insurance risk scores based on credit data
• Introduced early 1990’s• Not the same as credit worthiness score in banking• Related to personal financial management
and condition• Future insurance losses
correlate with credit attributes.

Current issues and influences
• Big data: Volume, variety, velocity
Margin
Elasticity highlow
high
low
Reduce prices to gain profitable market share
Raise pricesto take more profit
Target Market
• Integrated (aka “optimized”?) pricing:

WHO WORKS WITH PM?Hint: Just about everyone

Modeling lifecycle: interdisciplinary!
Conceptualiz-ation
Business Strategy
Modeling Objectives
Dependen-cies
Specification
Analytic Strategy
Data Sourcing
Model Building
Validation
Implement-ation
Business Process
Design, control
Production infra-
structure
Application
Adoption, Dissemin-
ation
Interpret-ation,
Reliance
Monitoring, Control
Versioning
Refresh Frequency
System Updates
Next Generation

HOW DO WE DO PM?How predictive modeling is accomplished

Multivariate model building process Pare down large collection of predictive variables to a
manageable set Examine correlations among the variables Weed out redundant, weak, poorly distributed variables Build candidate models using various techniques
• Regression/GLM• Decision Trees/MARS• Neural Networks
Analytically derive optimum weighting of predictors Validate/compare models Select final model

Business understanding is primary• Business Understanding
– Determine business objectives– Determine analytic strategy– Develop project plan
• Data Understanding– Collect initial data– Describe and explore data– Verify data quality
• Data Preparation– Select data– Clean and derive data– Integrate and format data
• Analysis– Select modeling technique(s)– Build model(s)– Assess model(s)
• Evaluation– Assess results against objectives– Review process– Determine next steps
• Deployment– Plan deployment– Produce final report– Review ProjectSource: “CRISP-DM”

Model performance is measurable
Scoring engines• Assign a “predictive score” to each unit…
Lift curves• How much [riskier] than average are the policies
with the [highest] scores?
Out-of-sample tests• How well will the model work in the real world?• Un-bias the estimate of predictive power
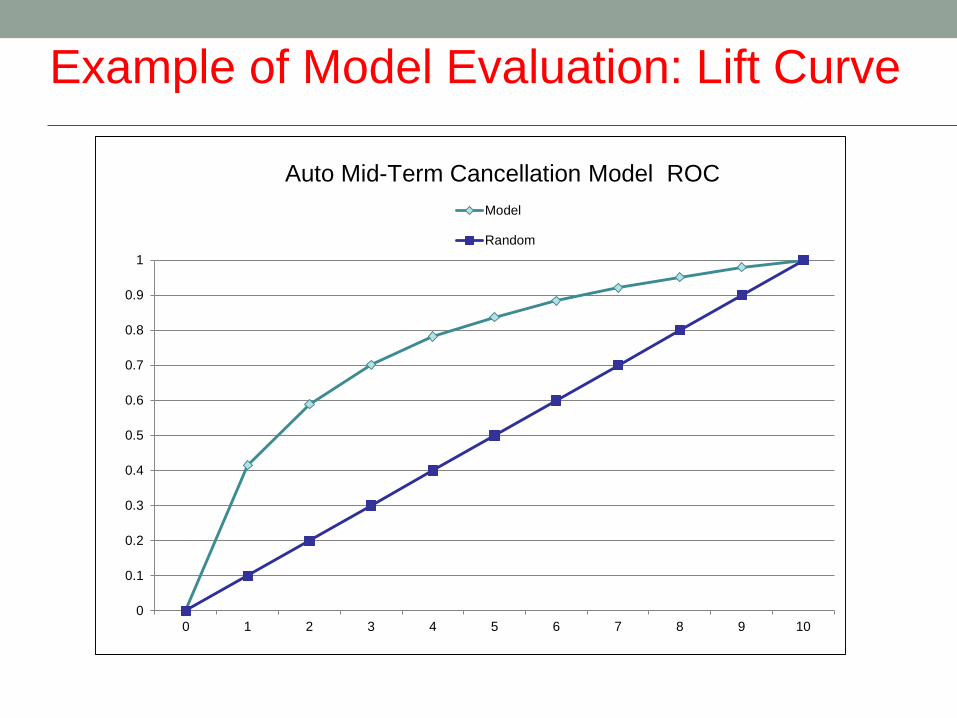
Example of Model Evaluation: Lift Curve
0
0.1
0.2
0.3
0.4
0.5
0.6
0.7
0.8
0.9
1
0 1 2 3 4 5 6 7 8 9 10
Model
Random
Auto Mid-Term Cancellation Model ROC

Analytics of implementation
Perform model description analytics• Necessary for comfort using the model
Calibrate Models• Create user-friendly “scale” – client dictates
Implement models• Programming, process design, system integration
Monitor performance• Distribution of scores over time, predictiveness,
usage of model• Plan model maintenance, versioning

Business considerations for rating models
So our predictive models show our pricing can be improved by adding a new rating component… What else do we consider before implementing?
Impact to agents Competitor Pricing Regulatory approval IT & Data Costs Will we be better positioned for profitable
growth?

WHAT IS PM?Part 3: Metaphors help/hurt our understanding of new things

Most Understanding is Implicit

Silly Metaphor: “Mathe-magic”

Helpful Metaphor: Rear View Mirror

Silly Metaphor: Rocket Science

Helpful Metaphor: Betting system

Silly Metaphor: Alien Crew Member

Helpful Metaphor: Factory Automation

Helpful Metaphor: Power tool

Silly Metaphor: “Numerati”

Helpful Metaphor: Uphill Earns DownhillProfiling
Context, scopeSelectionDefinitionsAcquisitionInterpretationValidation
Preparation
Primary Key AnalysisAggregationDe-duplicationDerived DataMapping
Integration
Merge/ConcatenateData Integration TestingQuality TestingReconciliation
Reconditioning
NormalizingImputationsTranslationsCleaningMapping

Q & A

PREDICTIVE MODELINGCentral Ohio Insurance Education Day –April 15, 2015
Tim Crespin, Ph.D.AVP-Director, Predictive ModelingState Auto Insurance Companies