predictive analytics - lityxlityx.com/wp-content/uploads/2016/05/predictive-analytics-ebook.pdf ·...
TRANSCRIPT
Predictive Analytics:Opportunities, Challenges
and Use Cases
Sponsored by:

PAGE 2
Table of Contents:Page 3 An Introduction to Predictive Analytics
Page 8 Traditional BI and the Analytics Progression
Page 14 Predictive Analytics & Big Data — A Real Power Couple
Page 17 Ensemble Modeling: Get More Out of Your Predictive Modeling
Page 21 Use Predictive Analytics to Improve the Customer Experience
Page 24 Orlando Magic Applies Analytics to Retain Season Ticket Holders
Page 27 Use Behavioral Insights to Develop Better In-Store Promotions
Page 30 Use Predictive Modeling for Back-to-School Retail Success
Page 33 Use Data-Driven Segmentation to Find Your Target Audience
Page 36 How to Get Sales Reps to Adopt and Crave Predictive Analytics
Page 39 Translate Business Talk into Predictive Analytics Projects
Page 41 Machine Data Worth a Pound of Cure for Systems
Page 44 How to Ensure Predictive Models Actually Work in the Business World

PAGE 3
An Introduction to Predictive Analytics
By Eric Smalley
People have used computers to forecast aggregate behavior like that of markets for almost as long as there have been computers. Making predictions about individuals is a much more difficult matter. The focus of predictive analytics is rapidly shifting to gazing at—and betting on—the future of individuals.
“It’s not forecasting how many ice cream cones you’re going to sell next quarter; it’s which individual person is likely to be seen eating ice cream,” said Eric Siegel, author of Predictive Analytics: The Power to Predict Who Will Click, Buy, Lie, or Die.
Today’s analytics technologies and ample sources of data have made making predictions about probable individual behaviors and many other potential outcomes more practical.
“Predictive analytics is, by definition, the most actionable form of analytics,” said Siegel. “Instead of just predicting the future, you can influence it.”
A growing number of vendors, anchored by heavyweights IBM (through its acquisition of SPSS in 2010) and SAS, supply predictive analytics software. The statistical analysis algorithms these companies offer have been around for years, but two important elements have changed how they are used. First, there’s a lot more data beyond traditional relational databases with corporate data for the algorithms to use, among them weblogs tracking online user behavior; the text, audio and video musings of millions; email messages; IT system data, such as application performance logs and security intrusions; and sensors measuring location, time, temperature and wear on machines.
The second change is technological. Distributed architectures have enabled Hadoop, an open source software library, and NoSQL databases, a class of database management systems that do not use the relational database model, to attack very large datasets. These innovations and others, like in-memory databases, have ushered in a wave of innovation and a proliferation of use cases for predictive analytics.

PAGE 4
An Introduction to Predictive Analytics
Use CasesPredictive analytics is useful in any circumstance where you need to make a decision based on the likelihood of an individual unit of focus—like a person, retail outlet, or product—behaving in a certain way. Is Sam likely to buy the latest fashion? Is Juan inclined to vote Libertarian? Does Julie pose a risk to the community? Is WonderWidget going to go viral? The potential applications are growing. Here are some snapshots:
Marketing and sales. A marketing use case is churn modeling: identifying which customers are likely to leave. This helps businesses target offers like heavy discounts or free phones that would be too expensive to offer in a less targeted way. Call center operations can identify the best response to a customer request or complaint to retain that customer and identify new opportunities for a sale. Another example: recommendation engines from social networks and e-commerce companies (think Facebook, Amazon, Netflix, and others) that make automated suggestions based on your online behavior and that of customers making similar choices.
Health care. Providing doctors with insights on how an individual’s condition compares to that person’s history and the outcomes of other patients is one use case. For example, researchers at Memorial Sloan-Kettering Cancer Center are experimenting with IBM analytics to scan historical data about cancer case outcomes and assess patient treatment options, with expectations that the system’s results will improve over time.
Manufacturing. Predictive analytics has the potential to sharpen forecasts about customer demand by rapidly harvesting new data sources, thus making for more efficient supply chains. Analytics applied to sensor data can detect the wear on factory equipment, jet engines, and other mechanical devices, alerting operators about maintenance or replacement needs.
Human resources. By combining data about employee performance, personality tests about worker potential, data from office applications about employee contributions, and traditional metrics about compensation, human resources executives are engaging in more sophisticated approaches to workforce management. Companies can project top performers among existing workers, and predict a job candidate’s suitability for a role like customer service or sales.
Politics. A striking illustration of the power of predictive analytics comes from President Obama’s 2012 campaign. The re-election team used analytics to identify which undecided voters were inclined to vote for Obama and then determined which of those could be persuaded by contact from the campaign as well as those who might be put off by contact. They also used analytics to decide how to campaign to individual voters: whether to send a volunteer to the door, make a phone call, or send a brochure, said Siegel.
PAGE 5
An Introduction to Predictive Analytics
Law enforcement. Another use case that has been getting attention is predictive policing. Rather than predicting when a person will commit a crime as in science fiction’s “Minority Report,” predictive policing identifies when a particular place is likely to experience a rash of break-ins or other crimes. Los Angeles; Santa Cruz, Calif.; Memphis; and Charleston, S.C., have lowered their crime rates by using the technology to increase patrols in the right places at the right times.
The legal profession. Civil litigation, with its mountain ranges of text documents and other data, represents another ripe field, both for those seeking to avoid court and those in court already. Lex Machina, a startup out of Stanford University, has developed a tool to identify the risk of patent lawsuits in situations where executives are evaluating corporate acquisition targets. Meanwhile, in a legal dispute involving the sale of a national restaurant chain, a Delaware judge last year ordered the use of predictive coding, a data analysis technique that would accelerate the process of identifying relevant documents, instead of using phalanxes of junior lawyers to do the work.
Interestingly, not all use cases require accuracy. Predictive analytics can help direct marketing campaigns boost response rates. The technology doesn’t provide much confidence that any individual will make a purchase, but it can boost response rates from, say, one percent to three percent, said Siegel. “That’s an example where it’s really not about accurate prediction; it’s about tipping the balance and playing the numbers game better,” he said. “And you can make a dramatic improvement on the bottom line by playing the numbers game better.”
How Predictive Analytics WorksPredictive analytics is driven by machine-learning algorithms, principally decision trees, log linear regression, and neural networks. These algorithms perform pattern matching. They determine how closely new data matches a reference pattern. The algorithms are trained on real data and then compute a predictive score for each individual they analyze. This way, the systems learn from an organization’s experience, said Siegel.
The current trend is to use multiple predictive analytics models. Ensembles of models perform better than any individual model. “It turns out that if you have a bunch of models come together and vote—anywhere between several and several thousand—you get the wisdom of the crowd of models; you get the collective intelligence of the models,” said Siegel.

PAGE 6
An Introduction to Predictive Analytics
Challenges in ImplementationThe technology is innovative and the use cases have provoked a lot of interest—but making predictive analytics work in business is a challenging process that requires a serious assessment of an enterprise’s strategic goals, its appetite for investment, and a willingness to experiment.
The first challenge in using predictive analytics is determining what technology and level of resources to deploy. This requires assessing the size of the problem an organization is trying to solve, said Omer Artun, CEO and Founder of AgilOne, a cloud-based predictive marketing analytics company.
Projecting potential ROI is essential. For example, a large financial institution aiming to improve performance in a multi-billion-dollar market by a few percentage points stands to gain several hundred million dollars, so it can afford to spend a couple of million dollars a year on an analytics team and custom modeling, Artun said. Conversely, a retail company looking to improve sales by a few percentage points might stand to gain a few million dollars, and therefore should probably spend less than six figures and buy a commercial analytics package, he said.
Other challenges in implementing predictive analytics are cultural and organizational, said Siegel. It’s important that the analytics are clearly connected to business goals and are aligned with business processes, particularly when the technology introduces operational changes. “It’s easy to make a model that’s cool and predicts well, but doesn’t necessarily provide organizational value,” he said.
That means figuring out how the results of predictive analytics fit into existing business processes.
Organizations need to avoid what Artun calls “the last mile problem.” Sometimes a company will develop the right model and it will perform beautifully, but the results end up sitting in a file on a computer somewhere. The key is making sure results are delivered to the point in a business process where decisions are made, he said. People developing predictive analytics systems should take an API-first approach, meaning results should flow from the model to the point of execution in a seamless and real-time or near real-time manner, said Artun. “That makes a huge difference in the outcome.”
These issues all point to the significance of the people who do the work. It’s also important for analytics teams to understand the business problems they’re tackling. Oftentimes, data scientists over-optimize or pay attention to the wrong aspects of a business problem, Artun said. “It’s an art and a science,” he said.

PAGE 7
Scott Nicholson, who left LinkedIn to become chief data scientist at Accretive Health, said in a recent presentation at a predictive analytics conference that it is particularly challenging to find people, and that he looks to build a team with members from diverse backgrounds, such as biology, physics, computer science, and electrical engineering. They have to be familiar with analytical models, but possessing an investigative zeal is more important.
The right people are those “who think about problems and then are excited about going out and finding data to answer questions,” he said. “This is not about algorithms. It’s not about industries. It’s just about being curious about data.”
With the continued spread of predictive analytics, it also pays to monitor public perceptions of its applications. Privacy is a concern with predictive analytics because data drives accuracy and the focus is on individuals. The more you know about someone, the better you can predict his or her behavior. In 2012, these concerns prompted members of Congress and the Federal Trade Commission to ask questions about businesses’ use of consumer data, and policy debates are likely to continue both in the United States and in other countries. There are also legal questions when predictive analytics play a role in police stops, sentencing, and parole decisions.
From Prediction to PersuasionThe future of predictive analytics is persuasion. Organizations are beginning to tune their predictive analytics efforts to go beyond just assessing whether and how to take action. They are now also using their systems to predict whether their actions will have a significant impact. “There’s a difference between predicting behavior and predicting whether you’ll influence that behavior, which is persuasion,” said Siegel.
Persuasion analytics borrows the concept of a control group from medical research to assess action versus inaction. Persuasion is more difficult analytically than prediction, but it more directly informs decisions, Siegel said. Persuasion was the essence of the Obama campaign’s highly successful analytics effort. Persuasion techniques are also used in targeted marketing, online ad selection, dynamic pricing, credit risk assessment, social services, and personalized medicine.
Eric Smalley is a freelance writer in Boston. He is a regular contributor to Wired.com. Follow him on Twitter at @ericsmalley.
An Introduction to Predictive Analytics

PAGE 8
Traditional BI and the Analytics Progression
By Scott Etkin
Traditional business intelligence (BI) tools have served companies well for many years, explaining why events they were seeing in the market were taking place. But as the ability to collect and store larger and larger amounts of data has grown, so has interest in using that data for much more than looking backward.
The rise of big data means that advanced analytics is no longer the exclusive domain of statisticians and research scientists. Many organizations are advancing beyond traditional BI, applying advanced analytics to their most difficult business challenges and mining their data for insights that set them apart from their competition.
Data Informed spoke with Paul Maiste, President and CEO at Lityx, about advanced analytics and how companies can step up from traditional BI and take advantage of all the value that advanced analytics has to offer.
Data Informed: Gartner identifies four main types of business analytics: descriptive, diagnostic, predictive, and prescriptive. Can you discuss these and what each type means for businesses?
Paul Maiste: I do like the way Gartner distinguishes the types of business analytics. It also serves as a good model for an organization’s progression toward more sophisticated analytics and more automation. They begin with descriptive analytics as the organization’s starting point, and this can be described as the ability to report on past business results. Descriptive analytics typically takes the form of reports, charts, and dashboards. It often starts as a high level, one-dimensional view of history, for example sales by region. But even within the category of descriptive analytics, an organization can achieve more sophistication by progressing toward what historically is referred to as Business Intelligence. BI tools allow drill-down, multi-dimensional views of historical results, for example, sales by region, SKU, and time of day. This is often the jumping-off point to the next area of progression.

PAGE 9
Gartner then identifies diagnostic analytics. Beyond simply reporting what happened, this level of analytics attempts to analyze why it happened so action can be taken. As I mentioned, BI tools often are a starting point for going down this path, as are classic statistical tools that can identify patterns and correlations in data. For example, perhaps a descriptive analysis identified sales of a particular SKU in a region to be lagging behind other regions. That’s interesting in itself, but diagnostic analytics asks the questions, “What happened?” and “How can we fix it?” Further analysis of additional metrics, such as on-hand inventory and warehouse shipments, may find, for example, that on-hand inventory was zero on many days in the region. Further drill down might show that shipments to the regional warehouse were not being made for a two-week period. Now we have some root causes and can fix them. Notice that the amount of effort to drill down and identify an issue in this way can range from simple and quick to long and pain-staking. Generally, you have to know where to look — a lot of hunting and pecking. However, there are a myriad of BI tools available to help with the task.
Tying the first two areas of analytic progression together, I often think of the move from descriptive analytics to diagnostic analytics as somewhat natural and obvious. It’s not often that an organization will report metrics without looking further into root causes. The big difference to me is the tools involved, and the willingness to look deeper and deeper into multi-dimensional views, as is often necessary in diagnostic analytics. In fact, sometimes — perhaps even mostly, the root cause of business results can be very complex and not even easily found simply through diagnostic analytics. This can be
Traditional BI and the Analytics Progression

PAGE 10
thought of as the “so-what” problem, where you end up with a lot of insights but are left without any clear conclusions from which to take action.
This leads to the next area of progression: predictive analytics. Predictive analytics attempts to find the complex reasons that a business result has happened in the past, translate those reasons into a concise mathematical model, and then use that model to accurately predict the result in the future. In my view, the level-of-sophistication leap from descriptive and diagnostic into predictive analytics is large. There are two main reasons for this additional sophistication: the complexity of the data and the complexity of the tools and skills required to manage them. If these can be managed, however, the added value and ROI in moving to predictive analytics can be substantial.
The last step in Gartner’s view of analytic progression is prescriptive analytics. I like to think of this as a closely related follow-on to predictive analytics. It is the ability of an organization to create a detailed, optimal plan to execute against that accounts for all known business factors and constraints. In fact, I often use the phrase “Business Optimization” as an analog to prescriptive analytics. The leap in sophistication, again, can be great, as the techniques, tools, and skills required are often quite technical and require complex mathematical modeling. This level of progression is rare at this stage in the evolution of business analytics.
Tying it all together, it is important to note that no organization, whether large or small, makes the jump through this progression immediately or easily. It takes dedication from the organization at each step to become proficient at the current stage and to prepare for the next. But the value that can be gained along the progression grows exponentially, and that is the carrot that pushes an organization down the path.
Traditional BI and the Analytics Progression
PAGE 11
Does the Gartner view tell the whole story about analytics progression?
Maiste: As I mentioned, I do like the Gartner view. But I think it’s missing an understanding of the inputs necessary for an organization to make progression, or even do any level of analytics in the first place. While there are a lot of inputs, three key ones are data, tools, and skills. You can imagine these as overlays on the Gartner chart, essentially the fuel that feeds the ability to progress. They are organizational assets that drive analytics.
As an example from the perspective of data, predictive analytics often requires much more granular data to be effective. Datasets that drive descriptive and diagnostic analytics are often high level, rolled-up views of history. For predictive analytics, as an example, large databases of transaction-level data with accompanying databases describing products, customers, locations, and so on are all joined together to create a highly multi-dimensional, detailed view of history. The amount of effort to create such a view that is ready for predictive tools cannot be understated. It’s not easy and often requires outside assistance for an organization to get there.
Examples related to Tools and Skills are similar. Each leap in analytic progression can require new tools and techniques, and new skills to manage those new tools and techniques.
How is each of these types of business analytics reflected in Lityx’s product offerings?
Maiste: We offer a cloud-based analytics platform called LityxIQ, which addresses the entire range of analytic progression mentioned by Gartner, as well as the additional overlays related to data, tools, and skills that I had mentioned. It was built with both the business user and the advanced statistician in mind. It also is meant to be a consistent environment to accomplish all levels of analytics. A user can build analytic datasets from source data, generate insights that can drive descriptive and diagnostic analytic outputs, build and deploy predictive models, and create optimized campaign plans all under one roof. It doesn’t require programming, and non-technical users are guided through more sophisticated analytics in an easy-to-understand fashion.
How are organizations limited if they stop somewhere along the continuum? Say an organization determines that the expense and/or the complexity of predictive or prescriptive is beyond their ability? What are they losing in terms of ROI or business value, and what can they do to put these advanced capabilities within reach?
Maiste: Any level of analytics is important to achieve, so first let me say that any progression, even one or two stages, is to be commended. But to restate an earlier point, the complexity and difficulty to progress grows exponentially as a company moves along the continuum. This is why we created LityxIQ. It reduces this complexity significantly and makes the achievement of higher levels of analytics so much easier. This is especially
Traditional BI and the Analytics Progression

PAGE 12
important for many organizations that would be unlikely or unable to move beyond diagnostic analytics. It has been well established that value increases as you move up into predictive and prescriptive analytics.
There is very strong evidence for the ROI of predictive and prescriptive analytics. As a normal matter of course, when we work with new clients, we help measure the potential ROI before they fully invest and make the leap, and then we re-measure it when they are more fully down the path. We have found ROI for our clients, using the LityxIQ platform, to be consistently at least 10x, and not uncommon to be closer to 20x.
Regarding putting the capabilities within reach, any organization can get there, and they can get there at a scale appropriate to their size. In other words, the cost of getting to and implementing, say, predictive analytics, is not a fixed number. A smaller organization can get there at a cost commensurate with their needs and size. In any case, however, it does require a commitment to maintaining the data necessary to support the level of analytics desired, and acquiring the appropriate tools and skills, or outside assistance, to get them there as efficiently as possible.
Can you share some examples of how real-world organizations are putting these advanced analytics capabilities to use and the results they are seeing?
Maiste: One example of a client of ours is a mid-size retailer. We began working with them as they were in the infancy of even descriptive analytics, but had made some small steps into diagnostic analytics as well. The competitive environment was becoming more challenging, and it became clear that even these levels of analytics were not going to cut it much longer. They needed better ways to respond to the market — and specifically to their prospects and customers — much more nimbly and using a data-based approach.
This is a good example of what I had mentioned earlier, namely that a mid-size organization can take mid-size steps into more advanced analytic progression. It doesn’t require a Fortune 500-level investment. We helped them organize data resources in a way that could support predictive and even prescriptive analytics. We started them off with a simple predictive model or two to help predict which prospects were more likely to respond to their offer, based on demographics, distance to retail, and prior response history. They could then market much more efficiently, not wasting effort on low-likelihood prospects and focusing on the “cream of the crop.” The results were tremendous and quick. Their total revenue grew by 20 to 30 percent within a month of implementing their first model and grew even more with a second predictive model a few months later. We also helped them move into prescriptive analytics by integrating business constraints with predictive outputs into their campaign planning. Overall ROI has been near 20x.
Traditional BI and the Analytics Progression

PAGE 13
As another example, a national organization with a very large, mature, and successful direct marketing program was using a predictive response model crossed by a wide variety of audience segments to perform their monthly targeting selection. Key to understanding their situation is that the model they were using was not equally effective for each of the audience segments and so the marketing team was always required to review recent performance by model decile and by audience segment, and make section decisions that over-rode the model’s predicted performance. This was extremely manual and time-consuming work, with results that were good, but still felt sub optimal. They desired a better approach that would provide the same level of confidence in predicted performance across each of their audience segments so they could then just select the highest expected performers within their budget. There are many ways one can envision to solve this. The approach that was chosen involved, one, running a decision-tree model on response across the audience segments to collapse the number of audience segments down to a more manageable and valuable number; two, updating the response model to include a couple of segmented models; and three, adding an automated model score adjustment step by decision-tree segment using recent performance to further improve the accuracy of the model score. This approach turned out to be highly successful, eliminating the lengthy manual review process while lifting response by 10 percent, which was about a $1.6 million in-year revenue increase.
What advice would you offer to those who think the analytic progression is just too daunting?
Maiste: An organization should move into and through new types of analytics in steps instead of all at once so that their investment comes over time. Importantly, the ROI that is achieved does not have to wait until the end though. It can be achieved at each progressive step so that the payback period isn’t a long-term proposition. A thoughtful progression can achieve strong ROI at each baby step along the way.
Scott Etkin is the managing editor of Data Informed. Email him at [email protected]. Follow him on Twitter: @Scott_WIS.
Traditional BI and the Analytics Progression
PAGE 14
Predictive Analytics & Big DataA Real Power Couple
Value of TargetingWhat would it be worth to your organization to know more accurately which of your customers was going to leave you in the next 6 months or how much they would spend over the next year or what products they are likely to buy or which marketing communications would be most effective for them? Predictive Analytics specializes in answering these types of questions. One of the biggest levers you can pull to improve performance is to improve the targeting of your CRM strategies. We all know that not all customers and prospects are alike. The more you can understand the differences and align your strategies and tactics around this knowledge the better decisions you will make and better able you will be to maximize performance and minimize cost.
BI vs. Predictive AnalyticsThe proliferation of Business Intelligence (BI) tools demonstrates the demand that exists for this type of insight. BI tools offer a wonderful way to visualize your data and better understand your customers and prospects. However, they fall short in their ability to take all of the information at once and determine the most effective way to weave it together. Generally with BI tools you are looking at one piece of information at a time, perhaps two, maybe even three but then things start to get too complex for a visual representation. Predictive Analytics uses modeling algorithms to examine data and come up with the best fitting representation of that data by determining the combined relationships of the data to the behavior of interest. For example if you desired to improve sales to a marketing campaign you could use a BI tool to examine various segments of the campaign to see where the campaign worked and didn’t work and then make adjustments for the next campaign. You may come up with a half-dozen or more changes of how you would target differently. Determining the changes to make would have been somewhat time consuming requiring a lot of “hunting and pecking” to find the underperforming segments. Predictive Modeling on the other hand can in one fairly quick step examine all of the data and return back segments of size you can control that will rank order performance so you can see what’s not working. The segments will be composed of many pieces of information, typically 10-20 working together. It is the optimal use of a combination of the information that makes Predictive Analytics such a powerful tool. The use of BI and Predictive Analytics is complementary as they both bring insight but in different ways and with different strengths.
PAGE 15
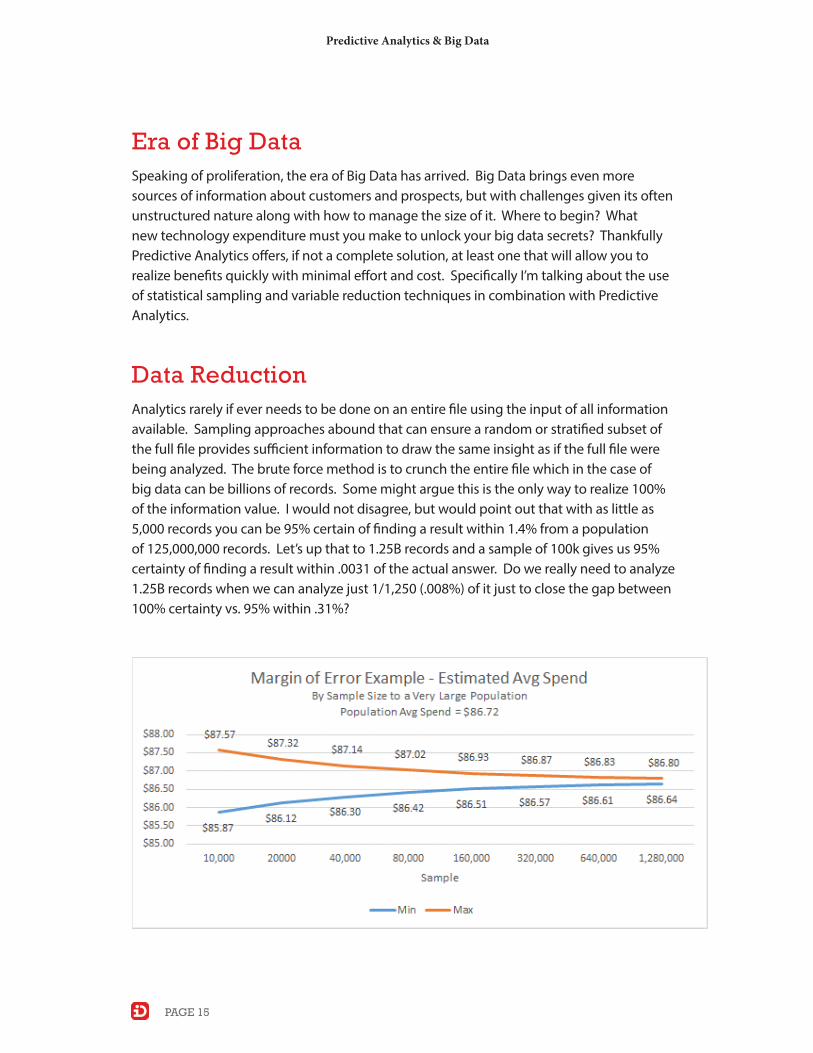
Era of Big DataSpeaking of proliferation, the era of Big Data has arrived. Big Data brings even more sources of information about customers and prospects, but with challenges given its often unstructured nature along with how to manage the size of it. Where to begin? What new technology expenditure must you make to unlock your big data secrets? Thankfully Predictive Analytics offers, if not a complete solution, at least one that will allow you to realize benefits quickly with minimal effort and cost. Specifically I’m talking about the use of statistical sampling and variable reduction techniques in combination with Predictive Analytics.
Data ReductionAnalytics rarely if ever needs to be done on an entire file using the input of all information available. Sampling approaches abound that can ensure a random or stratified subset of the full file provides sufficient information to draw the same insight as if the full file were being analyzed. The brute force method is to crunch the entire file which in the case of big data can be billions of records. Some might argue this is the only way to realize 100% of the information value. I would not disagree, but would point out that with as little as 5,000 records you can be 95% certain of finding a result within 1.4% from a population of 125,000,000 records. Let’s up that to 1.25B records and a sample of 100k gives us 95% certainty of finding a result within .0031 of the actual answer. Do we really need to analyze 1.25B records when we can analyze just 1/1,250 (.008%) of it just to close the gap between 100% certainty vs. 95% within .31%?
Predictive Analytics & Big Data

PAGE 16
Sampling reduces the number of records needed to be examined. Next, to reduce the number of pieces of information, we can employ variable reduction techniques that quickly analyze records for correlations and identify information that is redundant. Hundreds or thousands of different data points typically only result in a fraction of data that offers truly unique insights. Again we do not need an enormous amount of data to determine where the important correlations are. Pulling a sample that includes ample representation of all the data points combined with variable reduction results in a final analytic dataset that is both manageable in number of records as well as number of predictors. Then Predictive Analytics tools can interrogate the data looking for the multi-dimensional relationships of value. This may include new methods such as machine learning algorithms along with traditional statistical algorithms like regression and decision trees. It is this interrogation and identification of the valuable nuggets within the data that creates the computational complexity. Through the use of sampling and variable reduction you can greatly reduce the computational demands. Further once the data “nuggets” have been found to then pull them out of the full universe even though dealing with a very big file, the complexity is not great because you know specifically what you want and can focus your computing resources on performing only the more simplified tasks needed.
This article has attempted to draw your attention to the power and value of Predictive Analytics while at the same time discuss how it can be used to help you take advantage of your Big Data without necessarily having to invest in new Big Data tools.
Originally published in CIO STORY (http://ciostory.com/magazine/September-2014/BigData20/).
Predictive Analytics & Big Data

PAGE 17
Ensemble Modeling: Get More Out of Your Predictive Modeling
By Gary Robinson
Just as an ensemble is a collection of parts that contribute to a single effect, ensemble modeling is multiple models used together to outperform any single one of the contributing models. It is based on the philosophy that, “Together, we are better.” Do you recall the Netflix Prize from a few years ago, when Netflix offered $1 million to anyone who could improve their movie recommendation algorithm by 10 percent? After three years of competition, the prize was awarded to a team that formed from other teams and combined their thinking and models into a single model. Their approach really shined a light
on the power of ensemble modeling. Ensemble modeling can get very complex, but you can benefit from this approach by beginning very simply.
We all know that models use current and past information about customers and prospects to predict a future behavior such as buying, opening, responding, churning, charging off, etc. There is a wide variety of appropriate techniques to choose from when you build a predictive model but, generally, they produce similarly effective results. The majority of modelers use a well-known, preferred technique for most business problems, but other techniques might get used, depending on the modeler’s experience and personal preference.
For example, logistic regression is the technique most often used to solve business problems that can be viewed in a binary manner — things such as click (yes/no), churn, (yes/no), buy product A vs. B, etc. However, other techniques can solve these types of problems just as effectively, most notably decision trees such as CART and CHAID, neural networks, and machine learning algorithms like SVM, to name a few.
The different techniques produce similarly effective results, but they go about their jobs in very different ways. For example, a regression-based approach seeks to find the set of predictors that collectively minimize the sum of the squared differences between actuals and predicted. A decision tree, on the other hand, chooses predictors one at a time, independently selecting the next one that provides the biggest statistically
Gary Robinson, Chief Operating Officer, Lityx

PAGE 18
Ensemble Modeling: Get More Out of Your Predictive Modeling
significant split in performance. In some situations, one technique is more appropriate than another, but often any one of a handful of techniques can be appropriate.
On their own, each technique can provide the business a lift that drives thousands or millions of dollars in performance benefits. But why do we have to choose only one?
Like in the Netflix challenge, when you have many points of view, you not only have a better chance of finding a solution, but also are often able to come up with an even better solution using parts of multiple ideas. This, in essence, is what an ensemble model is: combining multiple — or an ensemble of — techniques to arrive at a solution that outperforms any of the solutions derived from a single technique.
Building an Ensemble ModelThe approach I use for building ensemble models is as follows: First, build a variety of models, each using a different technique but all trying to predict the same business outcome. Then use the output scores from each of the models as predictors for a second round of modeling, this time using only your preferred modeling technique. Consider the following example.
For a typical classification model, say response, we might prefer the use of logistic regression on behavioral and demographic data to best predict responders from non-responders. The validation results in Figure 1 show a nice rank order of the deciles, with decile 1 most responsive, at 27 percent, and decile 10 least responsive, at 4 percent.
Now let’s test the use of a decision-tree approach and build a CHAID model. In Figure 2, we see the logistic and CHAID model validation performance side by side, and that the CHAID model does not rank order as well as the logistic model, going from 23 percent to 5 percent.
h Figure 1

PAGE 19
Ensemble Modeling: Get More Out of Your Predictive Modeling
Next, we will try an ensemble model built using a logistic regression approach on only the predicted scores of the logistic and CHAID models as inputs. Figure 3 validation results show us that by combining the logistic and CHAID approaches, we are able to get a slightly improved model over the initial logistic model only, with the deciles of the ensemble model going from 28 percent to 3 percent.
h Figure 2
h Figure 3
PAGE 20
Ensemble Modeling: Get More Out of Your Predictive Modeling
An ensemble model is not guaranteed to outperform its component models, but when it does it’s because there is some incremental insight that one approach was able to capture that the other was not. The effect is sort of like filling in the small cracks of missing explanation that a single-model approach leaves behind. Small improvements in large volumes can generate substantial gains.
Ensemble modeling approaches can become very involved, but hopefully the approach presented here is simple enough to warrant a review the next time you are looking to try and get more out of your predictive modeling.
Gary Robinson is Chief Operating Officer of Lityx. He is a 20-year veteran of marketing analytics and CRM, having most recently worked at Merkle Inc., where he was Vice President in the Quantitative Marketing Group overseeing analytic engagements for some of Merkle’s top clients. Prior to Merkle, Gary was an SVP at Bank of America, where he held various positions including marketing director and head of database marketing, as well as running strategy, analytics, and list procurement. Gary has a master’s degree in Statistics and a bachelor’s degree in Psychology from Arizona State University.

PAGE 21
Use Predictive Analytics to Improve the Customer Experience
by Steven J. Ramirez
To win and retain customers, companies will have to assess their competencies in using data and advanced analytics to develop actionable insights. Data science and predictive analytics can help organizations synthesize data sources across multiple channels to better target the right customer with the right offer at the right time. Advanced segmentation strategies that help to identify niches based on consumer behavior will also significantly boost marketing effectiveness. Companies that deploy these techniques will accelerate past the rest of the pack in developing and deepening customer relationships.
Using techniques from data mining and text mining, predictive analytics lets executives look at historical patterns and make predictions about future behavior for specific individuals. By taking customer data that is held internally and adding what people have said and done, companies can map out what customers are likely to do next.
Deeper Understanding, Better EngagementBuilding a stronger customer experience can help you gain a deeper understanding of your customers to more effectively engage them, increasing retention and loyalty. This translates to a more profitable business.
In a recent customer experience report, the Tempkin Group noted, “Customer experience leaders have a more than 16 percent advantage over laggards in consumers’ willingness to buy more, their reluctance to switch business away and their likelihood to recommend.”
Before a company begins making improvements, the first step is to ensure that everyone understands the context and goals that will generate actionable insights. You must make sure you truly understand your customers’ experience with your business as a whole. Customers see one company. They don’t care if there are different divisions or departments that operate in silos. They want a seamless experience from one touch point to the next.

PAGE 22
The best place to start any predictive analytics program is to take the time to define the objectives. Is the goal to decrease regulatory risk? Launch a new product? Reduce customer complaints?
To set the stage for successfully implementing predictive models across an organization, it’s also critically important to involve all relevant stakeholders early. It is important to build buy-in and collaboration, as well as determine whether existing resources will suffice or if there is a need to build new systems. By laying this foundation, executives have a clearer path for putting data-driven models to work.
Collect Data Across All ChannelsOnly after the objectives are defined should data collection begin. Predicting customer issues requires a palette of data sources and analytical approaches. Companies should collect data from internal sources, social media, and regulatory or government bodies.
Internal data sources include everything from customer feedback to transactional data. Many companies already collect this information but may struggle with how to analyze and use unstructured data, such as calls to customer support.
Social media is potentially the most important and unfiltered way to gain access into consumers’ thoughts and experiences. An important benefit of establishing a strong social media connection with customers is that they may be more likely to remain loyal to the business and open to growing their relationship. That digital experience is a key part of the overall customer experience. But let’s not forget why people engage in social media: to share their opinions.
Many industries also collect complaints via governmental bodies. In the financial industry, it may be the Consumer Financial Protection Bureau, which publicly releases all consumer complaints made about banks, credit card companies, and lenders. Other industries may need to deal with the Better Business Bureau or other regulatory bodies that collect consumer complaints.
Build a New Generation of Customer Experience AnalyticsInstead of looking at the past and reacting to issues as they arise, predictive analytics uses all of the data available to predict how consumers are likely to respond. Once the data has been collected across internal, social, and regulatory sources, companies begin sorting the data to determine where the most valuable information lies.
Use Predictive Analytics to Improve the Customer Experience

PAGE 23
Analysts can characterize the data and provide preliminary assessments of how suitable each data source is to the desired goal. Once the decision has been made on which sources to leverage, the analytics work begins.
Traditionally, segmentation has been used to divide customers into groups based on their demographics, attitudes, or buying behaviors. This helps in trying to target specific groups with the message that will best resonate with them. Utilizing predictive analytics, previously hidden patterns in the data help organizations generate more in-depth customer segments. The resulting segmentation is more precise and nuanced, and is ultimately based on the likelihood that a consumer will accept a given offer. The result is a win-win situation, as customers are offered more relevant products and services, leading to a more profitable relationship for the company.
Beyond segmentation, there are several other ways that predictive analytics can positively impact success. Advanced customer experience analytics techniques can help companies leverage data for more profitable outcomes across the organization, including:
• Identifying strategies to reduce attrition
• Targeting improvements at key touch points to accelerate issue resolution
• Increasing cross-sell rates with sophisticated customer segmentation
• Boosting the value of your Voice of the Customer program
Whatever the most important objectives, predictive modeling can help any company transform mountains of customer data into valuable insights that can make a powerful difference for both key customers and the business.
Steven J. Ramirez is CEO of Beyond the Arc, Inc., a firm that combines data science and customer experience strategy to help clients deepen customer relationships and differentiate themselves in the marketplace. The company’s social media data mining helps clients improve their customer experience across products, channels, and touch points. Follow Beyond the Arc on Twitter: @beyondthearc.
Use Predictive Analytics to Improve the Customer Experience

PAGE 24
Orlando Magic Applies Analytics to Retain Season Ticket Holders
by Mindy Charski
One of the best assets a professional basketball organization can have these days is big data analytics. Sure, much of today’s chatter about it focuses on what granular information teams can learn about their players, prospects and competitors—15 NBA teams are using STATS’ SportVU, for instance, which captures stats like how fast a player runs, his number of sprints per game, and where on the court he gets his rebounds. But analytics tools can be used to score in other ways, too.
The Orlando Magic, in fact, is gaining a reputation for being at the forefront of using data analytics to retain season ticket holders. It’s studying the behavior of these valuable customers this year—based largely on their ticket usage—to determine who is likely to renew for next year, who is not, and who could go either way. The Magic can then tailor its communications to help retain those it projects might leave.
The team began using a predictive renewal model during the 2010-2011 season, but it significantly ramped up those efforts the next season when it consolidated its customer data in a data warehouse, began using advanced analytics tools from SAS, and started issuing digital tickets instead of mailing physical ones.
“We’ve always had a lot of data available to us through our ticketing system and in the past we haven’t had a great way of leveraging it,” says Anthony Perez, the Orlando Magic’s vice president of business strategy. “Now we’re using a lot more sophisticated tools to do that and one of the things we’re trying
to do is use that data to really identify the different segments of our customers that need a certain type of attention or a certain type of interaction from a service rep.”
Delving into Customers’ MotivationsPerez says the team doesn’t need to treat every customer the exact same way, and that’s useful because its season ticket holders have different reasons for purchasing tickets for
Anthony Perez, Orlando Magic vice president of business strategy

PAGE 25
45 home games. Some may buy them for their personal use, for instance, while others intend to resell them on the secondary market.
The team can create action plans for accounts based on how they’re using their tickets and how often. That information can guide conversations from service representatives. If someone hasn’t had much luck reselling the tickets, for instance, the rep can offer tips for being more successful, Perez says.
Utilization of tickets is just one variable in the predictive model the Magic is using; it also considers factors like tenure, feedback from customer satisfaction surveys, and whether or not the account holder personally attended the game.
Digital ticketing has helped give the Magic visibility on that personal utilization piece. Now plan holders can currently get into Amway Center by using a special card with the tickets loaded on or by printing the digital tickets. “If you didn’t forward your tickets and you didn’t print them, we feel like that means the primary account holder came to the game and that’s been a significant variable in our model that we didn’t have until last season,” Perez says.
The new investments are producing new efficiencies. Compiling datasets used to take two to three weeks and involved tasks like exporting data from different areas into Excel and combining five spreadsheets into one.
“Now with some of the tools we use, with the data warehouse we have where we’ve consolidated all this data into one place, it takes two minutes to generate a dataset,” Perez says. “We’ve essentially automated the process, and that’s why I think we’ve seen huge benefits. Now this information can be actionable a lot closer to the point in time when we want it to be.”
That’s key because there’s not a lot of time on the clock. The regular season starts in November and the Magic asks season ticket holders to renew for the next season in January or February. If they aren’t using their tickets early in the season, the team quickly wants to help change that course. If someone’s tickets go unused for two games, for instance, the team will send an email asking if he or she needs assistance from a service rep, or the Magic will send a reminder about reselling tickets on the secondary market.
Perez declines to share specific business results about overall renewal rates but says, “We’ve done some analysis and experiments to measure the impact of our data-driven strategies and have seen significant lift in the impact on renewal rates.”
Orlando Magic Applies Analytics to Retain Season Ticket Holders

PAGE 26
Using Customer Data to Enhance the Fan ExperienceMeanwhile, the Magic is exploring other, related ways to use analytics. The team offers visitors a chance to win courtside seats when they swipe their card or scan their ticket while purchasing at a concession stand or retail shop.
That means the team can link transactions to tickets—or in the case of season ticket holders, it may be able to link transactions to accounts. (This is challenging because the purchaser may be the account holder, someone he or she brought to the game, or someone who came to the game without the holder; the Magic is working on models to refine the analysis.)
Merging ticketing data and account-level purchases presents the Magic with many potential applications to enhance the customer experience of its season ticket base and ultimately build loyalty. Perez shares four examples of what he calls “surprise and delight” opportunities:
• If an account regularly purchases ice cream during halftime, a service rep can surprise those in the plan holder’s seats with the cold treat.
• If the account always buys certain types of retail items, the Magic can send an email about new arrivals in that category.
• If an account regularly buys youth jerseys for a particular player, the organization can send an invite to an event that player will be attending.
• If an account spends a lot on retail or concessions, the team can send the plan holder a coupon or credit.
The team is thinking through these kinds of overtures as it evolves its capabilities. “Now we’re trying to determine when we attribute purchases to accounts and the next step is how do we use it in terms of our process flows for email campaigns and also how do we make it available in the most consumable way to our service teams,” Perez says. “What we don’t want to do is within our CRM system, just start dumping every transaction that we attribute to an account so that when somebody goes in it starts to become something they can’t make actionable.”
Mindy Charski (email: [email protected]) is a Dallas-based freelance writer. Follow her on Twitter @mindycharski.
Orlando Magic Applies Analytics to Retain Season Ticket Holders

PAGE 27
Use Behavioral Insights to Develop Better In-Store Promotions
by Jamie Rapperport
Each year, the consumer packaged goods (CPG) industry spends $300 billion on trade promotions. That’s over 17 percent of revenue at an average CPG and nearly twice what they spend on marketing, and the number is only growing. Despite this high level of investment, any consumer goods leader will tell you that more than half of all promotions fail to deliver a positive ROI, and many lose 50 cents on the dollar.
Most in-store promotions are ineffective because there is no effective method of finding new, winning promotions without
taking big risks. In a world in which missing a promotion week can mean missing your volume target for the year, who can afford to take a risk on something without knowing it’s a winner? So CPG companies recycle the same old promotions week after week, year after year. Inevitably, shoppers get used to them, and the promotions become stale and ineffective.
Looking Backward Instead of Moving ForwardToday, most CPG companies use “post event analysis” software, commonly known as Trade Promotion Optimization (TPO), to track their trade promotions. TPO software helps companies measure the results of their promotions after the event is complete, relying on econometric regression analysis to sort through large volumes of aggregated point-of-sale data.
These systems are helpful for tracking how well you did after the fact, but they aren’t designed to help you identify new promotions to run next. This existing approach is, at the very best, 20-20 hindsight. It’s good for seeing where you’ve been, but it can’t tell you where you ought to go. It’s about reporting, not innovating.
In the last 15 years, a new field, called Behavioral Economics, has come to prominence. It seeks to understand people’s economic decision-making by looking to psychology rather than traditional economics. And it brings an exciting message: Consumers are
Jamie Rapperport, co-founder and CEO of Eversight

PAGE 28
much more complicated than previously thought, and they’re moved by many things other than money. This is welcome news for brands—it means a straight discount isn’t the only way to drive response and lift. But this new view also highlights what a complex world we live in: There are an infinite number of ways to frame an offer. How can we possibly know which one is best?
It’s useful here to look to e-commerce retailers, who have used online testing—aka A/B testing—for years to collect data to help drive higher online sales. This approach enables digital marketers to run balanced experiments to test the effectiveness of ads or website design and, based on the resulting data, to swap out less effective parts (text fonts, colors, etc.) for more effective ones. Recently, armed with knowledge of how behavioral economics works, several leading CPG companies have started moving toward a similar testing approach for in-store promotions.
Called “offer innovation,” this new method of digital testing enables companies to test offers by experimenting with different offer structures, depth of discounts, images, products, quantity, calls-to-action, etc., and collect data on all of it. The test promotions are served to small, balanced groups of real shoppers through digital platforms such as social, print-at-home coupon sites, and email, and can be redeemed in store. To shoppers, these “micro-tests” are simply promotions, but to companies they are a valuable source of customer behavior data. By testing a large number of offer variants with shoppers online, companies can get insights into which promotions drive the most consumer engagement.
Most micro-test “campaigns” are executed in about a week, delivering results with high levels of statistical significance. For example, a leading consumer goods manufacturer found that for one of its most popular products, 4 for $5 was, surprisingly, more appealing than the $3 for 3 promotion, which it had been running for years. Similarly, a national retailer found the demand for a grocery item found in every supermarket dropped 43 percent when price was raised by just one cent above a seemingly arbitrary threshold. These insights are then used to inform broad in-store promotions, including end-cap displays and promotional newspaper inserts, across brick-and-mortar retailers.
Digital testing works best in concert with existing systems and processes, injecting much-needed forward-looking insights—insights that are critical to knowing which in-store promotions will maximize volumes, trips, basket size, and ROI. Once proven through digital testing, “optimal” promotions can be added to the promotional calendar and managed through existing promotion systems. And once a promotional event is complete, post-event analysis can reveal how a promotion performed on a number of key in-store measures, potentially providing additional guidance for future testing.
However, today what we see is a process that starts where it should end. Rather than putting consumers at the center when developing new promotions, promotion
Use Behavioral Insights to Develop Better In-Store Promotions
PAGE 29
discussions at CPGs have been too focused on what was run last year. Using aggregated, noisy point-of-sale data fails to take into account the nuances of consumer behavior. Two economically identical offers—such as $1 off a $4 item and Buy 3, Get 1—are combined into a single 25 percent off data point. We now know that consumer response to different offer structures such as this can vary by 200 percent or more. So which offer would you run?
Jamie Rapperport, co-founder and CEO of Eversight, has 25 years of experience as a software entrepreneur. Prior to founding Eversight, Jamie was co-founder and EVP at Vendavo, the leading B2B pricing technology company. Prior to Vendavo, he served as a founder and vice president of marketing and sales at VXtreme, which was acquired by Microsoft and became the core of “Windows Media Player.” Jamie has a B.A. from Harvard University and an MBA from Stanford.
Use Behavioral Insights to Develop Better In-Store Promotions

PAGE 30
Sid Banerjee, CEO and Co-Founder, Clarabridge
Use Predictive Modeling for Back-to-School Retail Success
by Sid Banerjee
Back-to-school season is here and, thanks to a weak first half of the year for retailers, it’s holding a little extra significance. A harsh winter cooled off retail sales early on in 2014 and caused the National Retail Federation to lower its full-year forecast. Still, the second half is supposed to regain some strength—thanks in part to an increase in back-to-school shopping. According to the NRF’s annual survey, total spending on back-to-school items is expected to reach $74.9 billion—up from $72.5 billion in 2013.
To be successful in this crucial and competitive period, retailers must make sure they are up to date with the latest analytics technology. Making customers happy—and, in turn, making them buy—is obviously key to a successful back-to-school season. Luckily, data about social media sentiment, call center feedback, buyer behavior, survey responses, sales, and more all hold clues as to what’s needed for a successful back-to-school season, from the right marketing campaigns to the right product mixes and everything in between.
Of course, there are different types (or levels) of retail analytics to this end. The most basic type is a simple volume assessment of your data, which involves counting the occurrences of issues and taking action as the volume and importance increases. The next progression is change analysis—that is, looking at the rate of change in the data, including spikes, and then determining the next best action based on dramatic increases.
But the most effective and advanced analytics—and those that have the most impact on back-to-school success—use all your data sources for predictive modeling.
By using retail analytics for predictive modeling, companies can actually see and understand how sentiment, emotion, and actions have changed; determine what is influencing that change; and make adjustments as needed (preferably in real time). This can take place at both a trend level and an individual level.

PAGE 31
With that in mind, let’s take a look at four specific ways that this advanced level of retail analytics can be employed this back-to-school season.
1. Perfecting promotions. Customers are constantly giving feedback—in the actions they take, in the words they use to describe a store or company on social media and review sites, and in the words used in survey responses and call center interactions. By pairing data on customer behaviors with feedback, retailers can understand the root causes of buyer behavior.
For example, let’s say a retailer noticed that fewer customers were talking about their coupons and redeeming them less during this back-to-school season than in previous years. The basic level of retail analytics would alert the company to this difference. But by digging deeper into the data, the retailer could figure out exactly why—whether it was because of the checkout process, or because the coupons were expiring too quickly, and so on. Armed with this data, the company can then make an adjustment to make the coupons more effective for the remainder of the shopping season.
2. Preventing showrooming. Retailers know that customer loyalty is important and listen very carefully to loyal customers. But many retailers don’t understand why certain shoppers don’t buy their products and why showrooming occurs. Once again, this data can be found on Twitter, Facebook, and fan forums. When monitored in real-time, retailers can determine if there is a problem with the product, the staff at a location, the pricing, or even the merchandising—and then make the necessary adjustments to solve the problem.
3. Adjusting the product mix. Another key part of retail analytics involves looking at historical customer feedback, whether from recent months and campaigns or from previous back-to-school seasons, to plan product mixes and pricing, anticipate changing customer demand, and more. To dive a bit deeper, this kind of predictive modeling means comparing historical trends with current trends and looking for changes in rate, or the standard deviations. This is especially the case as the back-to-school shopping season starts earlier and earlier each year. As that trend takes place, retailers can analyze sales of specific products and adjust their orders as necessary. For example, let’s say Target notices that its sales of glue sticks were trending up early in the month. It can use that information to adjust its plan and determine which stores need re-orders.
4. Real-time response. Once again, predictive modeling can take place at a more individual level, allowing retailers to target specific customers in real time to improve sales. For example, retailers can use data to identify upsell opportunities or predict (and hopefully prevent) churn. And online retailers also use predictive modeling on a more individual level. They can use a combination of demographic data and activity to help the shopper to have a better omni-channel experience. For example, demographic data may show the retailer that a woman is a mother living in the suburbs, and her
Use Predictive Modeling for Back-to-School Retail Success

PAGE 32
search activity may show that she is looking for kids’ shoes. Online retailers can use that information to predict that the mom also might need school uniforms and make those easier to find on the website. Similarly, real-time response and predictive modeling includes monitoring for abandoned online carts and comparing abandonment rates to previous rates — and then, of course, figuring out why the rate has changed.
Predictive modeling can play a key role in retail analytics, allowing companies to detect changes, model trends, and act on that information to improve the customer experience and customer loyalty and, in turn, improve sales.
Sid Banerjee is the CEO and Co-Founder of Clarabridge. Over his career, Sid has amassed nearly 20 years of business intelligence leadership experience. Prior to Clarabridge, he co-founded Claraview, a leading BI strategy and technology consultancy firm. A founding employee at MicroStrategy, he held Vice President-level positions in both product marketing and worldwide services. Before joining MicroStrategy, Sid held management positions at Ernst & Young and Sprint International. Sid has a B.S. and M.S. in Electrical Engineering from the Massachusetts Institute of Technology.
Use Predictive Modeling for Back-to-School Retail Success
PAGE 33
Use Data-Driven Segmentation to Find Your Target Audience
by Adam Paulisick
Earlier this year, Columbia University Press released The Insect Cookbook: Food for a Sustainable Planet, which it touts as “The Definitive Guide to Insects as a Sustainable Food Source.” While the thought of munching on a beetle or a grasshopper is likely to turn the stomach of most people socialized in Western culture, insects are, in fact, a primary source of protein in many cultures, particularly in Africa, Asia, and South America.
While it is unlikely that entomophagy—the consumption of insects as food—is going to take off in America any time soon, there are some compelling benefits to eating bugs: they are high in protein, low in fat, and eco-friendly to farm. It’s not hard to imagine the possibility of a niche market developing among more adventurous, health-conscious consumers—and there are a lot of hipsters in Brooklyn and San Francisco.
So let’s assume you are a more adventurous marketer, or have a more adventurous client. Marketing insects as food to Americans presents an interesting conundrum: How do you find the most receptive audience for such a radical message? Segmenting consumers by age and gender or other demographics is inefficient at best, even for more traditional marketing campaigns because there are no hard and fast rules anymore for what a man or a women will intuitively buy (with few exceptions). The ability to purchase just about anything advertised has virtually no barriers except preference. Furthermore, there simply isn’t a demographic for bug consumers in our culture. So what’s a marketer to do?
The good news is that you don’t have to guess. Data-driven segmentation can be the key to identifying an audience you are trying to reach.
Here’s a quick guide to what types of data tend to inform audience segments:
Store-level: Derived from credit cards, loyalty cards, and other retailer-centric data, spend levels help an advertiser understand the locations where consumers are likely to interact with the product in addition to price point, selection, and the competitive landscape to which they could be exposed. Store data is often used when seeking the heaviest retailer-specific buyers: heavy shoppers of Best Buy to present Black Friday

PAGE 34
deals, for instance, or perhaps heavy Target shoppers if the retailer wanted to alert their most loyal audience that a new department, event, or offering was coming.
Cart/Basket-level: Again, typically derived from payment method, cart/basket-level data allows an advertiser or retailer to better understand the department in which the shopper spends regularly. This would be an opportunity for someone to be placed in a “heavy cookware/accessories” segment in addition to retailer preference. Basket-level data is especially helpful for mass merchandisers (online or brick and mortar) that offer an almost endless selection of products across hundreds of categories.
SKU-level (Stock Keeping Unit): A reference that allows a retailer to keep track of groups of items independent of the universal way the manufacturer references them across retailers. In this case, someone who had access to the retailer’s inventory or point-of-sale information would be able to add a consumer to a segment such as “buyer of exotic cookbooks” in addition to retailer type and category information.
UPC-level (Universal Product Code): A reference so specific that a retailer can understand the exact type of grooming product, gaming console, or exotic cookbook (such as protein from creepy crawlers) purchased, or other specific variants that align to the most surgical advertisements.
No matter what type of data, the concept of historical purchase affords the advertiser confidence in not wasting impressions on someone who isn’t interested in the subject matter. It’s worth noting, however, that it doesn’t make it any easier to find the perfect creative fit, message, or tone in isolation.
So in the case of our cookbook, being integrated closely to a retailer’s point-of-sale system, you can glean endorsements, ingredients, and other factors in your consideration of how to construct the perfect audience segment. Don’t worry if you don’t foresee yourself advertising bug sandwiches anytime soon. In more traditional terms, marketers are constantly building campaigns around factors such as ingredients, heart health factors, packaging, fair trade, or quite literally anything else listed on or about the product.
Moving beyond just collecting the right data, here are a few ways to use consumer retail sales data to find that insect-receptive audience:
Use companion products to identify American bug eaters. Because health and ecology are at the center of the entomophagy value proposition, marketers could serve their campaigns to audiences that are predisposed to low-fat, high-protein foods such as soy, black beans, and lean meats. I see this approach frequently. For example, brands that provide allergy remedies look for consumers who are heavy buyers of tissues when the direct knowledge of a consumer’s allergy condition is less than clear.
Use Data-Driven Segmentation to Find Your Target Audience

PAGE 35
Avoid the non-category buyers. Because eating bugs would (initially) be considered completely outrageous in Western society, it’s all the more likely to become a fad among the trendy and health conscious. Nothing screams trendy and health conscious more than heavy buyers of the trendiest produce of the last five years, such as kale and acai. So, clearly, these are consumers to target with the insect-eating message.
But this principle also works in reverse. Frozen food or travel-size product companies would likely avoid those same consumers, as they know that items that expire frequently are clearly not the ideal indicator of consumers who are on the go or are less concerned with fresh products. Although it’s tempting to look at what someone does as the only indicator in addressable media, eliminating the very unlikely buyers might actually be a better way to increase the efficiency of the media spend.
Use lifestyle elements to enhance your purchase-based audience segment. In addition to nutrition, advocates of bug-eating cite the ecological benefits of consuming insects, pointing to the low carbon footprint of farming bugs. Another segment of consumers that may be receptive to the idea of crunching crickets could be households that purchase organic, earth-friendly food, household products, and health and beauty aids.
When attempting to market an unusual or niche product, use your data to segment the audience to identify customers who might be most receptive to your message and eliminate those who would not. Find the companion products, avoid the non-category buyers, and remember that lifestyle can complement past purchase history.
Adam Paulisick is the head of marketing and brand at Nielsen Catalina Solutions (NCS), a joint venture between The Nielsen Company and Catalina. In this role, Adam helps advertisers, agencies, and publishers utilize offline purchase data to increase effectiveness throughout online, mobile, print, radio, and TV media campaigns. Prior to his time at NCS, Adam served as senior director of commercial operations for Nielsen’s Emerging Media division, where he was responsible for driving growth within Europe, the Middle East and Africa.
Adam has a degree in Management from Case Western Reserve University in Cleveland, Ohio, and a minor in Information Systems and Data Structures. He resides in Pittsburgh, Pennsylvania, where he is an Adjunct Professor of Entrepreneurship at Carnegie Mellon University’s Tepper School of Business.
Use Data-Driven Segmentation to Find Your Target Audience

PAGE 36
How to Get Sales Reps to Adopt and Crave Predictive Analytics
by Javier Aldrete
Business intelligence alone is no longer good enough to boost company performance. As such, many companies are moving to analytics, particularly when it comes to trying to help their sales teams sell more. But despite managers’ best efforts, it is unlikely that sales reps will ever really adopt analytics — at least the way analytics is most commonly deployed within organizations.
For the majority of companies, their first step into the world of analytics is with descriptive analytics, or hindsight analytics. By definition, descriptive analytics is inherently backward-looking and provides little to no value other than reporting on what happened
in the past. It gives no indication of how to improve performance in the future.
Predictive analytics, on the other hand, promises many benefits to B2B sales organizations.
As the market shifts to a more progressive form of intelligent guidance, the success of predictive analytics will hinge on the approach companies take to encourage adoption by sales reps. Like any new technology roll-out, if sales reps don’t buy in to the change, the deployment is likely to fall flat. Yet, providing sales reps with tools and reports actually hinders adoption rather than encouraging it. What most companies don’t realize is that sales reps don’t need access to the analytics, they simply need the guidance generated by it.
Why Sales Reps Abandon AnalyticsB2B sales organizations are faced with massive decision complexity. Tens of thousands of customers, hundreds of thousands of products, and mercurial factors such as new products, new markets, and competitive pressures result in hundreds of decisions for one sales rep to make each day about which customers to call on, what products to sell, and what price to quote.
Javier Aldrete, Senior Director of Product Management, Zilliant

PAGE 37
Company leaders are well aware of this decision complexity. In an attempt to help, they provide reps with extensive reports that contain customer-spend analysis, customer churn trends, and high-level price guidance about margin targets. While this effort is well-intentioned, adoption rates are still abysmal and initiatives typically fail, primarily for these three reasons:
Salespeople aren’t analysts. They don’t like or read reports. Sure, your top reps may use the reports, but most salespeople simply ignore them.
Reports are backward-looking. The reports can tell reps what their customers purchased in the past, but they don’t provide explicit guidance as to where reps should spend their time in the future. It’s certainly helpful to understand historical customer data, but a backward-looking report won’t help employees make better decisions in the future.
Manual approaches can’t scale. To manage the complexity and perform thorough analysis on each customer and product in the entire book of business on a weekly or even monthly basis, you would need an army of analysts. As a result, most companies are able to address only the top 20 percent of customers and products, leaving the remaining long tail to guesswork.
Sales reps don’t want to spend their time sifting through reports. They want to spend their time doing what they do best: selling. They crave the answers to their questions, not just the data and analytics behind the answers. Reps need sales guidance that’s immediately actionable and tells them explicitly where to find the opportunities most likely to result in a win.
How to Give Reps the Guidance They CraveIt’s possible to deliver analytics-based guidance to sales reps that they will actually use. The data to generate that guidance already exists. By applying predictive science and algorithms to transaction data and delivering the output as actionable guidance to sales reps, you can halt customer defection, grow organic revenue, hit or exceed margin targets and gain share. In essence, it’s all about the leads and the quality of pricing guidance delivered to the reps.
For example, to keep and expand wallet share with existing customers, predictive models can find the purchase patterns in the data and uncover the retention and cross-sell opportunities for each account. These actionable opportunities can be delivered to sales reps to help them understand what each customer should be buying from them.
A predictive model also can help set specific, market-aligned prices that account for every selling circumstance. The model allows you to understand how those pricing
How to Get Sales Reps to Adopt and Crave Predictive Analytics

PAGE 38
strategies will impact future P&L performance before prices are put in-market. You can then deliver market-aligned price guidance directly to your sales reps in the quoting systems they use today.
If predictive analytics are leveraged this way, it removes the need to ask sales reps to decipher reports and gives them specific answers about where to spend their time and how to quote a price that won’t lose the deal while achieving the company’s P&L objectives.
How to Tackle Adoption ChallengesGenerally speaking, this type of approach to deploying predictive analytics helps to minimize adoption challenges. However, sales reps still have to trust and use the guidance. The first step to aid in adoption is to ensure the guidance is easily accessible to sales reps in the systems and tools they already use today: e-mail, mobile devices, CRM, etc.
Sales reps might believe their “gut feeling” is more reliable than the sales guidance, so expect them to be resistant at first. Here are a few tips to help with adoption:
• Clearly articulate the benefit to them as individuals as well as to the organization. Address the “what’s in it for me?” question
• Consider using rewards and recognition programs to drive adoption of the guidance.
• Ensure that sales managers are engaged and incorporate the guidance into the overall sales process.
• Communicate early and often about quick wins and successes.
The sales reps’ experience is still highly valuable, and they should view the predictive guidance as a “personal analyst” that simply helps them be more effective, ultimately helping them and the company make more money. Analytics can boost company performance, but only when deployed in a manner that is actionable for employees making decisions on the front line.
Javier Aldrete has more than 16 years of experience applying advanced business intelligence and predictive analytics to solve business problems in multiple industries. As senior director of product management at Zilliant, Aldrete is responsible for the company’s sales optimization product offerings’ vision and road map.
How to Get Sales Reps to Adopt and Crave Predictive Analytics

PAGE 39
Translate Business Talk into Predictive Analytics Projects
by James Drew
We are living in a golden age of predictive analytics and its constituent techniques of data mining and machine learning. New and ever-more clever algorithms are being invented by researchers from a diversity of backgrounds, and they are made available in software packages that have a variety of options, interfaces, and costs. Instruction in the methods and software is also available through formal degrees and short courses, as well as various Internet videos and other resources.
Modern Predictive Analytics (MPA—the “Modern” refers to the use of automated methods) is thus an eminently viable basis for the practice of data science, which combines techniques, software, and data acquisition with domain-specific knowledge to help real people—not just analysts—solve real-world problems.
And therein lies a major difficulty of data science practice. Not everyone in the MPA loop is up-to-date on the new vocabulary and capabilities of predictive analysis. A business executive with a numerical problem is unlikely to specifically ask for a regression or tree, preferring to describe the operational or marketing aspects of her problem. (“I need to find a cause for this uptick in cellular handset problems. I don’t care exactly how you do this, just make sure it’s useful and I can sell it to my boss.”) And sometimes when such executives do incorporate MPA ideas in their narrative, they are often dated, simplistic, or irrelevant. (“Do a linear regression of Overall Satisfaction on Customer Service Satisfaction in this survey, and make sure its R2 is 90 percent!”)
Therefore, perhaps the single most important aspect of the MPA/Data Mining process is not automated and perhaps not automatable: the intelligent translation of the narrative of a business problem into an analyzable project. The technical MPA requirements for this can be quite modest: a few regression, tree, and association tools go a long way in problem solving when the provisional goal is to get to, “Yes, I can help you.” Of course, an ultimately good solution may well involve complicated, perhaps dirty data and an array of sophisticated algorithms, but the hard part is getting the project started so all parties are comfortable with its initial direction.

PAGE 40
The translation part is akin to literary criticism in the sense that we are constantly asking why our business narrator uses certain sets of words, and what they evoke in her and in us. For example, in trying to calculate a customer’s Tier—a desirability index—from just his monthly payment rather than the more complicated notion of profit, consider this quote from a business speaker: “Profit depends on many accounting assumptions and is hard to convincingly calculate. We think that profit is closely related to revenue alone and using only this information to calculate the threshold for a customer’s Tier would save my department a lot of money and time every month.” The attentive data scientist would likely downplay the first sentence, focus on the phrase “closely related,” and visualize a simple scatterplot of revenue versus profit color coded by Tiers, from which several quantitative solutions (as suggested by the word “calculate”) would present themselves.
Some experienced analysts, of course, perform this translation naturally, but for others I have found it helpful to develop the two sides of the needed translation. Listening for words and phrases and their careful consideration is one side. The other side is to build, or reinforce, images and other thought fragments of what a predictive solution would look like: a scatterplot, low-dimensional function, or concise rule, for example. If the translation process is having someone “ring a bell” in your mind, then the bell must be made to produce its sound, and we have to find a context in which the sound is meaningful.
Both the listening and the application of MPA techniques can be fun, but is there any financial value to these complementary exercises? A few years ago, a landline phone company president asked how to identify electrical cable that was anecdotally thought to be trouble-prone, with the words, “When does this stuff go bad?” With a scatterplot of repairs as a function of cable age and a logistic regression-like model, we found that the existing cable did not, in fact, go bad with age and that most of the troubled cable had long-since been replaced. Consequently, the president got to use his replacement money on other projects more important to both he and his customers. The savings: $30 million, at a cost of a few days of analyst’s time and a few hundred dollars of software.
The golden age of MPA, indeed.
Dr. James Drew teaches data mining at Worcester Polytechnic Institute and has been an internal statistics and data mining consultant at Verizon Communications for 30 years. Jim holds two post-graduate degrees in mathematics from Cambridge University and a Ph.D in statistics from Iowa State.
Translate Business Talk into Predictive Analytics Projects

PAGE 41
Machine Data Worth a Pound of Cure for Systems
by Puneet Pandit
There’s a lot to dislike about winter—Arctic blasts, short days, and post-holiday blues, to name a few. But what might be the worst thing about winter is flu season.
The U.S. Centers for Disease Control and Prevention urges three actions to guard against influenza: Be proactive (get a flu vaccine); preventive (take everyday precautions like covering your nose and mouth when you cough or sneeze) and prescriptive (take anti-viral drugs if a doctor directs).
You might be asking: What does this have to do with data and analytics?
The same “three P’s” we hear about during flu season apply to machines. Technology is getting smarter about leveraging machine data to predict failures and proactively take action to stave them off or solve them. An increasing number of savvy companies are relying on this technology to anchor what amounts to a digital good-health strategy.
Machine data is just what it sounds like. Many of the devices and objects all around us—from cars and smart phones to entire computer networks—are instrumented these days to self-generate an enormous, constant stream of data. When properly collected, stored, and analyzed, machine data can provide insights into how products are being used, where potential problems might arise and how to avert them, and how the user experience can be enhanced.
Volumes of machine data are exploding at a scale never before seen in human history as sensors get embedded in just about everything, giving rise to the state of pervasive connectedness—enter the Internet of Things (IoT).
Gartner forecasts that 4.9 billion connected things will be in use this year, up 30 percent from 2014, and that the number of connected things will reach 25 billion—three for every person on the planet—by 2020. Cisco’s Internet Business Solutions Group goes even further, predicting that some 25 billion devices will be connected by this year, and 50 billion by 2020.
Puneet Pandit, co-founder and CEO, Glassbeam

PAGE 42
The kind of data we’re talking about here is the log data that all manner of devices, systems, and networks constantly generate. The type of information typically includes configuration (data that represent the current operational state or characteristics of a system), statistical (operational data critical to problem diagnosis and predictive analysis), and system messages (events and alerts that are logged at regular intervals).
These logs are a rich source of information on product usage, performance, feature popularity, and other key metrics. But until recently, properly analyzing them to gain actionable insight was not easy or even possible.
Most traditional log analytics tools were built to analyze time-series event data, which is heavy on systems messages, for narrow operational analysis. In today’s world, companies need more sophisticated and powerful tools to make sense of the full range of modern log data.
Fortunately, technology has a habit of solving the challenges that technology creates, and such is the case with the latest tools for gaining deep insight from the ever-growing torrent of machine data. These tools are able to do the following:
• Quickly and accurately pinpoint the root cause of any issue.
• Use system alerts to get out advanced notification of any impending problem so it can be addressed proactively.
• Better understand product usage by filtering the data by selected parameters.
• Offer to end users diagnostics of how a system is performing in the form of continuous “Health Check” services.
• Parlay machine data into detailed insights on almost any operational parameter.
• Integrate with other relevant applications, such as CRM and bug databases, via the cloud.
As a practical example, a manufacturer of data-storage products has a large installed base of systems that constantly gather information about product performance and customer usage. Thanks to the advances in analytics for machine data, the company can identify any issue that might affect product performance—such as running out of disk space or the impending failure of a disk spindle—and alert customers in advance. The same capabilities can be used to monitor the amount of storage space in use, then alert sales personnel to the opportunity for selling upgrades.
Another example of how advanced log analytics can significantly reduce device failures is in a place that truly can ill afford them—hospitals. State-of-the art analytics
Machine Data Worth a Pound of Cure for Systems

PAGE 43
are able to combine data from a variety of sources and intelligently detect patterns that could, for example, signal the impending failure of a patient’s pacemaker while he’s shopping in the supermarket.
Though humans invented machines, the amount of data being generated by machines has become absolutely impossible for humans to analyze by themselves. This is why the new IoT analytics capabilities have become so essential, and why Gartner has written that, “machine learning, already one of the most versatile technologies of the past decade, will gain even more traction in a digital business.”
It’s nothing to sneeze at.
Puneet Pandit is co-founder and CEO of Glassbeam, a Santa Clara, Calif.-based machine data analytics company focused on the Internet of Things.
Machine Data Worth a Pound of Cure for Systems

PAGE 44
How to Ensure Predictive Models Actually Work in the Business World
by Paul Maiste
Another predictive model successfully built and deployed into production to support an upcoming email campaign. That’s a few models deployed within the last couple of weeks. Mike’s client, the CMO of a large organization that generates leads online, is ecstatic as another 5 million records are scored, and the campaign is out the door and optimized. Recent results have been better than ever. Response rates and lead conversions are both up more than 15 percent.
We must be telling the story of an experienced modeler who has been doing this for 20 years, right?
Well, not exactly. Mike is CTO of a marketing services organization and has been providing client services to businesses for a dozen years. He is also a client of mine. But he had never built a predictive model himself. To satisfy his client’s needs, he had researched and even tried to use some statistical modeling tools in the past. But he found that the requirement to be a statistical programmer—as well as an algorithm expert—to use those tools was a burden.
Classic modeling tools weren’t the answer for him. But now, a year later, he is churning out complex, accurate models at more than one a week.
What made the difference? Mike turned to a new breed of advanced modeling software that takes the grunt work and technical jargon out of the modeling process. What used to be a back room process performed solely by mathematical geeks—not Mike’s forte—is now available to a much broader audience.
But it would seem that software such as this must have been around for quite a while. With all of the advances in data and technology in recent years—petabytes of data being analyzed by companies like Facebook and Twitter—and with predictive modeling being as hot as it is, one must figure that easier-to-use modeling tools must be ubiquitous. Surprisingly, this is a new frontier. But let me step back and explain where things have been, and where they are going.
Paul Maiste of Lityx

PAGE 45
How to Ensure Predictive Models Actually Work in the Business World
Heavy Lifting in the Data WarehouseAs a Ph.D. statistician, consultant, and developer of predictive models at PricewaterhouseCoopers in the 1990’s, I directed analytic staff on many client engagements. We would gather in a corner and do the heavy lifting for our clients. We were statisticians and mathematicians with a business edge. We happily requested and retrieved data from our clients, cleaned it, complained to our clients about how bad their data was, then cleaned it again. Eventually, after what was often many months of struggle, we would have a model built. If we were lucky, we could get our clients to test and implement the model, but even that was not a guarantee. Putting advanced analytics into production was a chore: re-coding the model into SAS or SQL, having IT connect customer databases to that code, and ensuring data was cleaned on their side was not a straightforward process.
Those were the days when data warehousing was king. Summary data, allowing managers and directors to track sales and inventory by region, was the focus. More detailed data—transaction or customer-level data—was not a priority. My clients back then weren’t necessarily happy with the slow pace of advanced analytic results, but they figured that was the way things were. Anyway, they had their data warehouses and could at least track sales trends and get other high-level reports out.
Over the next decade, as data warehouses became commoditized, marketers and other business domains demanded more from their internal IT departments and analytic teams. To keep up, modelers required more data to meet the ever-increasing demand from these business clients for predictive models. IT began to oblige, and modelers got to work. The unsteady triangle connecting the business to IT to analysts was becoming less fragile. Instead of one model per year, the teams delivered a couple of models per quarter. Modelers like me were busy, and happy to be doing our thing. My clients were happy to see these long-promised models put into practice.
But there were rumblings. All good things in the ever-changing world of business have a shelf life. My clients’ demands continued to rise. Two or three models weren’t enough. They wanted each of those models built for each of their eight regions. And it wasn’t just response models anymore. They wanted to decrease customer churn, estimate the future value of their customers, and predict the next best offer. And, as the marketing world went digital, this understanding of the customer was no longer restricted to mailings and catalogs; we entered a complex, multi-channel world and the models needed to keep up.

PAGE 46
How to Ensure Predictive Models Actually Work in the Business World
The Need to Automate the Modeling Process The surging workload sounds like a consultant’s dream. What could be wrong with this picture? Two issues: scalability, and a lack of organizational support for the analytic development process.
The first challenge was an issue of scalability and resources. The problems to be solved were orders of magnitude bigger and more complex, but the standard tools modelers used over the last two decades required lots of care and feeding. Effective modeling had always required a myriad of skills: data analysis, data planning and design, programming (often in multiple languages), and technical knowledge of mathematical and statistical algorithms. That doesn’t even touch on the need to coordinate with IT to retrieve data and later put models into production. Who had all of these skills?
The answer: not too many, and those who did were expensive. Only the largest of companies could afford to staff up or hire teams of consultants to handle the onslaught of business demands. The software and supporting hardware were expensive too, often six or seven figures. For anything less than the Fortune 500, there just weren’t enough people, time, or budget to reap the potential benefits of predictive analytics.
Support—internal support of the analytic process—was a problem as well. IT departments had become overwhelmed with the need to address security, enterprise software integration, regulatory, and other modern technology concerns. My business clients often reported requesting software and hardware implementation, or even simply data access, from their IT departments, only to get pushed to the bottom of the priority list. Their well-laid plans for building and implementing models were delayed or shelved. This is not old news; it is commonplace even as we sit here about to enter 2014.
Stories like this tend to be an inflection point for technology. A different approach has been needed for a long time now. Technology is supposed to make things simpler and not hinder progress, so why can’t it do so in the world of predictive analytics? Why must it take so long, and cost so much, to build a model? Why can’t a smart business person do it herself? For example, data warehouses used to take tens of millions of dollars to implement and required armies of computer geeks. Now they can be bought off the shelf by even the smallest of businesses, and implemented with relatively little work or cost.
Thankfully, we as an industry are finally moving in that direction and technology is beginning to catch up. Automation of iterative, labor intensive processes has begun to take shape. And the technology is moving to the cloud, allowing business users to prioritize themselves first and not wait for their IT departments to finish their never-ending “more important” work.

PAGE 47
How to Ensure Predictive Models Actually Work in the Business World
These technologies generally require little or no programming and can be implemented in minutes in the cloud instead of taking months on-premise. People like Mike, smart but making no claims to be a statistician, are able to build and implement bi-weekly email campaigns that require near-real time scoring, and execute frequent model refreshes. His clients reap the benefits of better response rates, more targeted messaging, and greater profitability.
Understanding the Business Implications of Predictive Models The technology for doing predictive analytics has begun to catch up with the demand. But Mike’s experience in adopting new technologies to implement analytic models should not obscure the need to address the challenges that continue to daunt businesses. Interpretation of results, and their implications for the business, is just as important as automating the modeling process.
People often think that a predictive model is just a mathematical equation: nothing more, nothing less. That’s why modelers and their tools were historically relegated to the back room. But they are much more than that, and the real learning here is that, in the business world, predictive models exist for the sole reason of improving a business function. We can build models faster than ever before, but nothing will replace the need to ensure the impact on the business is well-understood and managed properly.
I like to break down the post-model-building-process into three components: estimating the impact, integrating into existing systems, and changing existing processes.
Estimating the model’s impact. A model exists to improve a business function. But not all models are equal, and to be honest, not all models are worthwhile. But they all have a quantifiable value, and it’s not just technical metrics like lift and sum of squared errors. How much will it help improve response rates? How many more prospects will we convert through our new online channel? How many more customers will we retain compared to last year, and what is their projected value? And, importantly, how much will it cost to build and implement the model? We can boil metrics like this down to the model’s projected ROI. Some models are worth the work, others aren’t. But the business user needs a good projection of ROI before they can make a decision to implement it or not.
Integrating the models into existing systems. The second aspect of model implementation gets to the question: What do I do with the model outputs? Generally, model outputs come in the form of scores, perhaps a likelihood of churn or estimated number of purchases a customer will make. Those scores, in a vacuum, are fairly useless. They need to be integrated with other platforms that enable business decisions.
PAGE 48
How to Ensure Predictive Models Actually Work in the Business World
Examples include integrating the model output into a call center database so that a call center representative can make more intelligent upsell recommendations, or integrating the output into a campaign management database so that marketers can focus efforts on the best customers. The work of integrating multiple, complex systems tends to be one of the more difficult aspects of model implementation. But without this step, the model is dormant and won’t achieve its impact.
Changing existing business processes. In many cases, a model’s impact on the business goes beyond ROI. It impacts people and processes as well. For example, a new lead scoring model is likely to affect the timing, number, and type of leads passed on to individuals on a sales team. Or perhaps a new channel optimization model assigns an optimal channel and marketing approach to each individual to maximize their likelihood to respond. Generating these scores and optimal channel assignments is easy for the model to do—it’s just math. But the implication on people and processes may require new training for the sales team, or hiring a new vendor to create marketing materials to support new channels. Models fail without proper attention to the people and processes they affect, so we have to ensure that our resources are given the support they need to embrace the changes the model will bring.
These three steps have way too often gone overlooked because so much focus has historically been on the lengthy process to develop and build a model. It was already a months-long, expensive process, so the thinking was: There couldn’t be much to do once we have the model, right? The technology advances help build more models faster and better than ever before. And because these software advances mean we spend less time on the mundane tasks of building models, they also allow us to pay more attention to ensuring the model’s potential is realized.
Mike, my client who is now building and deploying multiple models in short time, is a testament to how advances in predictive modeling technology can streamline and automate the process of building models. Of course, I am thrilled to see his success with his clients. But, even more exciting is that he can now spend 90 percent of his time ensuring models are deployed correctly and generating value for his clients, instead of spending that time learning complex statistical software and writing code with little to show for it.
Paul Maiste is president and CEO of Lityx, an analytics services and solutions firm that serves clients in a wide array of industries. He has over 20 years of experience providing business intelligence, analytics and management consulting services. He has a Ph.D. in statistics from North Carolina State University. Reach him via email: [email protected].

Find other articles like these and more at Data Informed:
www.data-informed.com
Data Informed gives decision makers perspective on how they can apply big data concepts and technologies to their business needs. With original insight, ideas, and advice, we also explain the potential risks and benefits of introducing new data technology into existing data systems.
Follow us on Twitter, @data_informed
CHECK OUT DATA INFORMED
Data Informed is the leading resource for business and IT professionals looking for expert insight and best practices to plan and implement their data analytics and management strategies. Data Informed is an online publication produced by Wellesley Information Services, a publishing and training organization that supports business and IT professionals worldwide. © 2015 Wellesley Information Services.