predictive analysis presented by: thomas solosky & syd pope 10 aug 04
TRANSCRIPT
Predictive Analysis
Presented By: Thomas Solosky & Syd Pope10 Aug 04

Span of Control- 11,000 Professionals- Over 800 Locations Worldwide- 50 Major Field Commands- $1.1B Budget Authority- $81M Reimbursable/Foreign Military Sales-Combat Support Agency
Scope of work- All major weapons system programs- $1,173B in Contract “Face Value”- $129B Unliquidated Obligations- 335,000 Contracts- 16,000 Contractors- Flight Operations (1200 Aircraft/yr)- $86B Government Property- $8B Progress Payments- $12B Performance Based Payments- $37B in Small Business subcont. plans
Full Service Acquisition Impact Full Service Acquisition Impact

ReadinessDriver NSN
DelinquentBackorder
NMCS
TheCritical
FewInformed
Engagement on Spares
Depot MaintenanceTimely Return to Mission
Capable Status
The Full Spectrum
• Combat Support AgencyCombat Support Agency• Focus on Customer’s ReadinessFocus on Customer’s Readiness• Portals to Customer’s Supply Chain Portals to Customer’s Supply Chain
Readiness and Combat SupportReadiness and Combat Support
The ApparentBig Items - Big $ - High Attention
The Less ApparentSmall Items - Small $ - High Importance
DCMAcovers…

Predictive Analysis is:
the collection, examination and synthesis of information and data from our on-site presence which states (in terms of future cost, schedule and performance) what we forecast will happen based on our special knowledge of the supplier and program
Predictive Analysis - What it is?
• Wild Guess
• Throwing Darts
• Unsupported opinion
• Shot in the dark
• It is not a certainty - our goal is to inform the right people early, which may prevent the event!
Predictive Analysis - What it is NOT
6
Why Predictive Analysis?

Customer Issues & Concerns?
More Predictive Insight into:• Systems & Software Engineering – Technical
Risk• Schedule Surveillance – Critical Path• Quality – Product/Process impact• Direct/Indirect Cost Visibility - Rates• Total Ownership Cost- Sustainment • Change Management – Configuration• EVM – Cost & Schedule integrated with
Technical Performance
7
Tell Customers what they don’t already know!
Program Manager already has:
• Technical Data• Status Reports & Plans• Integrated Master Schedule• Full Technical and Business Staff• Cost Performance Report (CPR)• wInsight (or some other software tool)
Predictive Analysis

Predictive Analysis
Underlying Premise
“The quality of a product is largely determined by the quality of the process that is used to develop and maintain it.”
Based on TQM principles as taught by Shewhart, Juran, Deming and Humphrey
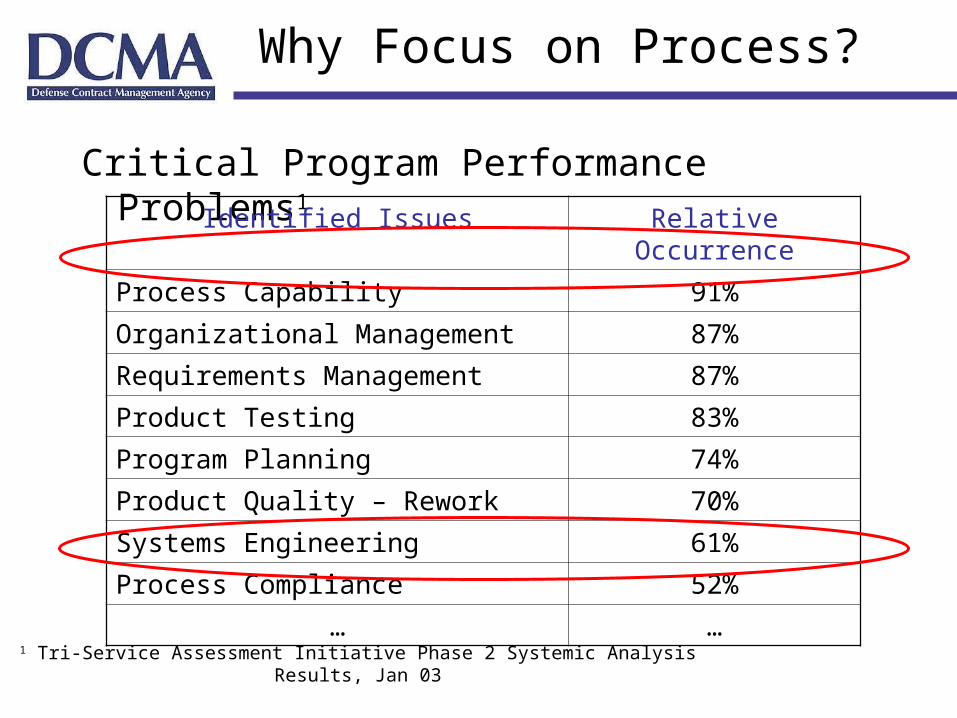
Why Focus on Process?
Critical Program Performance Problems1
Identified Issues Relative Occurrence
Process Capability 91%
Organizational Management 87%
Requirements Management 87%
Product Testing 83%
Program Planning 74%
Product Quality – Rework 70%
Systems Engineering 61%
Process Compliance 52%
… …
1 Tri-Service Assessment Initiative Phase 2 Systemic Analysis Results, Jan 03
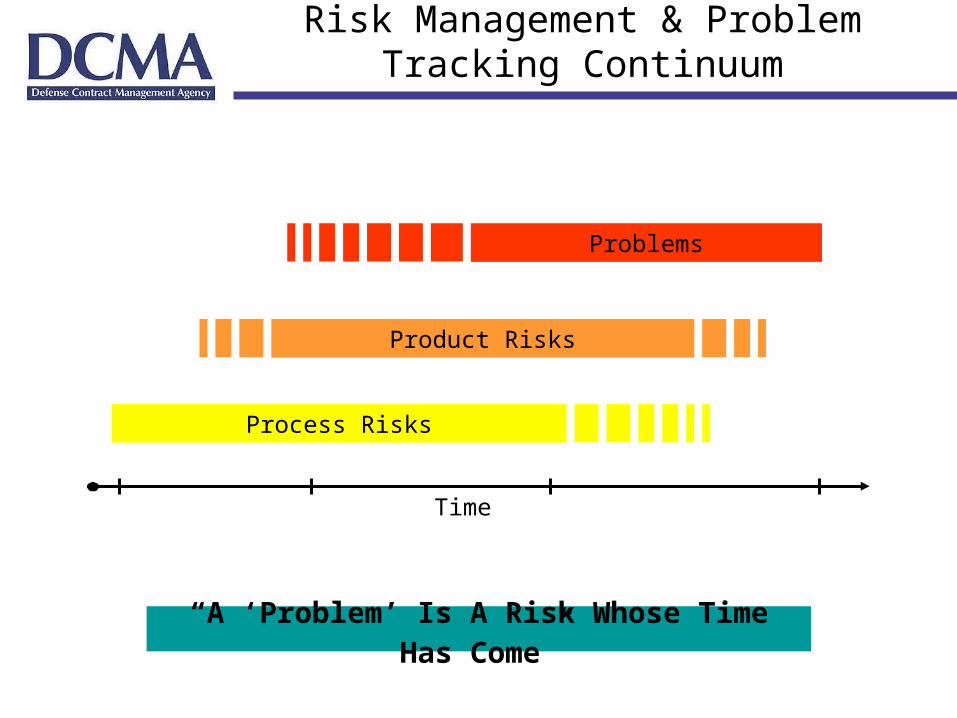
Process Risks
Product Risks
Time
Problems
“A ‘Problem’ Is A Risk Whose Time Has Come”
Risk Management & Problem Tracking Continuum
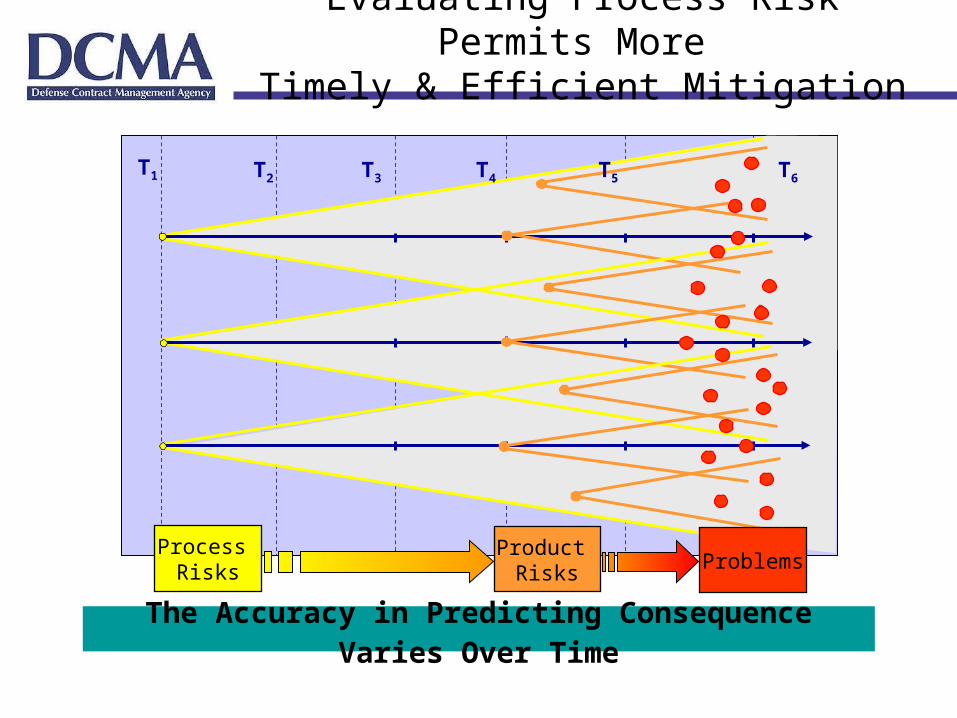
The Accuracy in Predicting Consequence Varies Over Time
Process Risks Problems
Product Risks
T1 T2 T3 T4 T5 T6
Evaluating Process Risk Permits More Timely & Efficient Mitigation
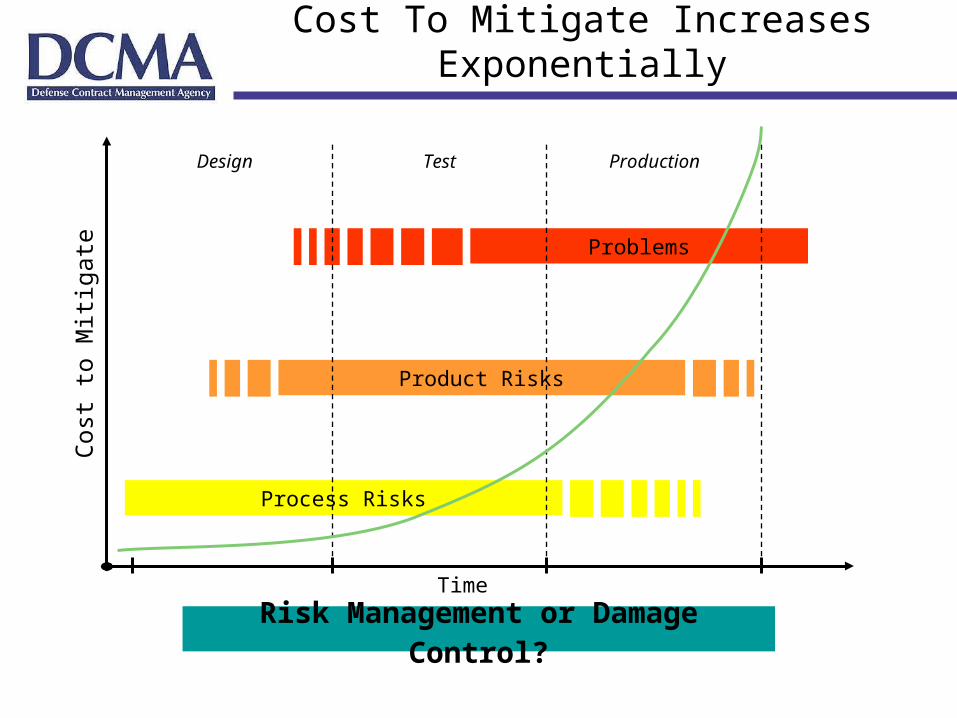
Process Risks
Product Risks
Problems
Risk Management or Damage Control?
Cost To Mitigate Increases Exponentially
Time
Cos
t to
Miti
gate
Design Test Production
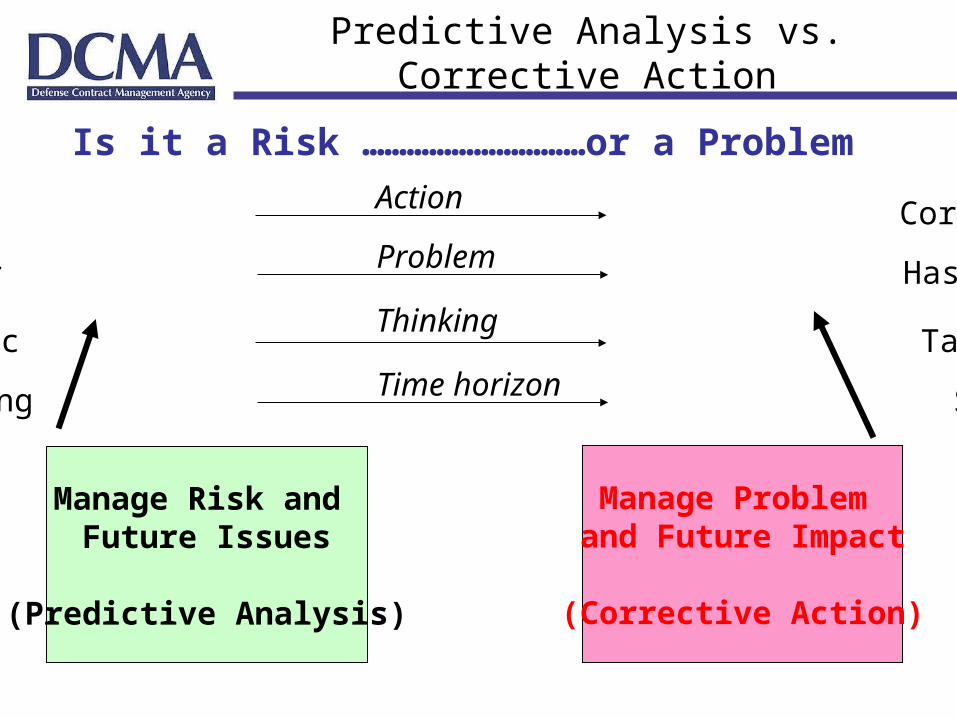
Preventive Corrective Action
May occur Has occurred
Problem
Strategic Tactical Thinking
Long Short
Time horizon
Manage Risk and Future Issues
(Predictive Analysis)
Is it a Risk …………………………or a Problem
Manage Problem and Future Impact
(Corrective Action)
Predictive Analysis vs. Corrective Action
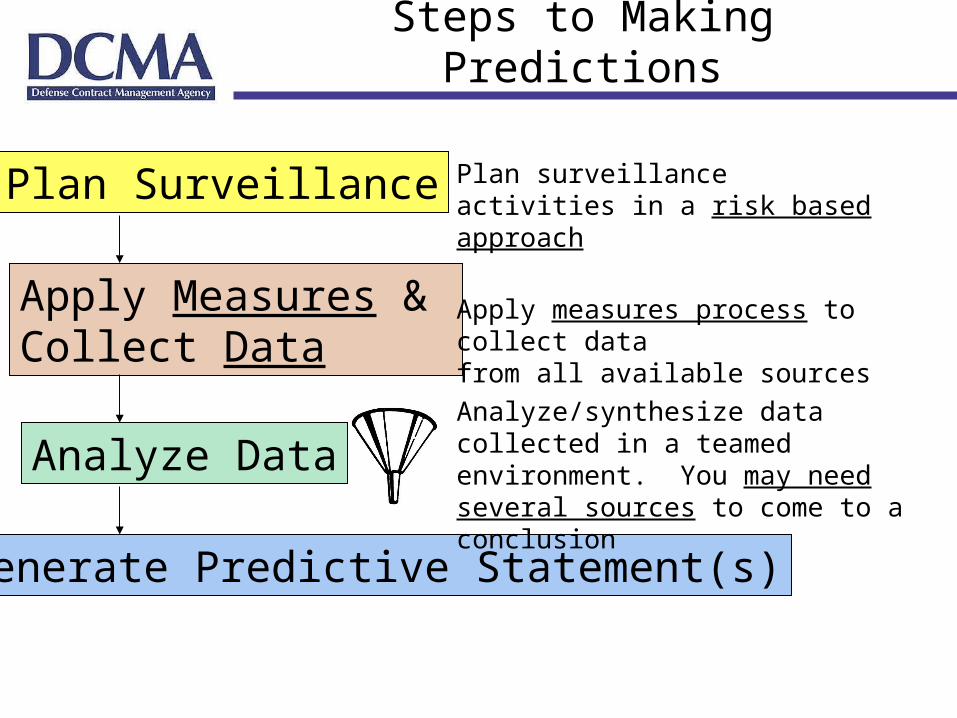
Steps to Making Predictions
Plan Surveillance
Apply Measures & Collect Data
Analyze Data
Generate Predictive Statement(s)
Plan surveillance activities in a risk based approach
Apply measures process to collect data from all available sources
Analyze/synthesize data collected in a teamed environment. You may need several sources to come to a conclusion
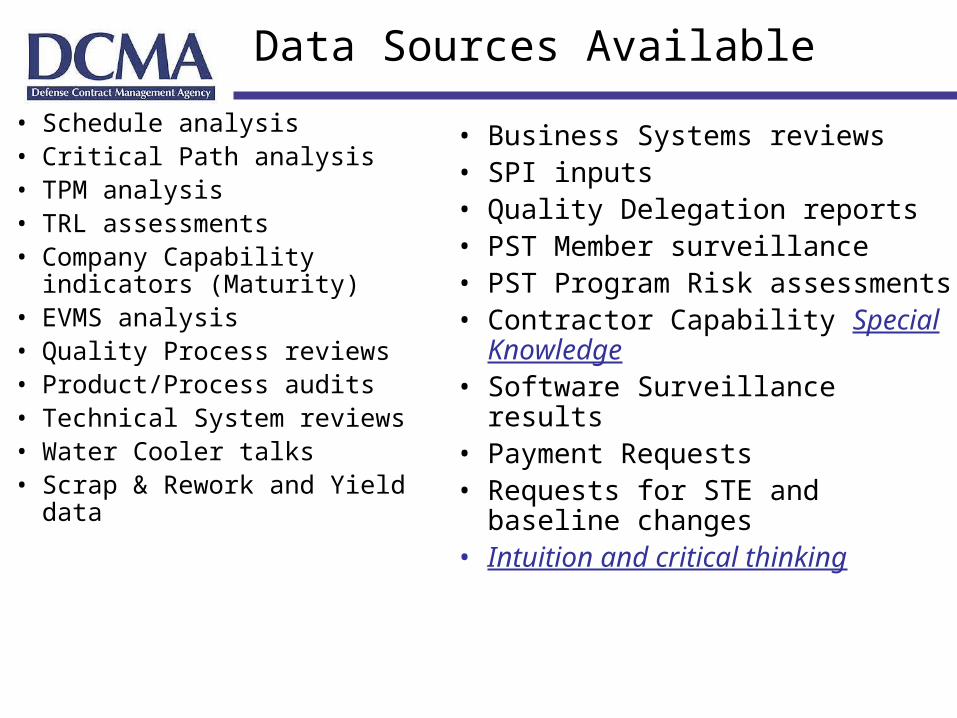
• Schedule analysis• Critical Path analysis• TPM analysis• TRL assessments• Company Capability indicators
(Maturity)• EVMS analysis• Quality Process reviews• Product/Process audits• Technical System reviews• Water Cooler talks• Scrap & Rework and Yield data
Data Sources Available
• Business Systems reviews• SPI inputs• Quality Delegation reports• PST Member surveillance• PST Program Risk assessments• Contractor Capability Special
Knowledge• Software Surveillance results• Payment Requests• Requests for STE and baseline
changes• Intuition and critical thinking
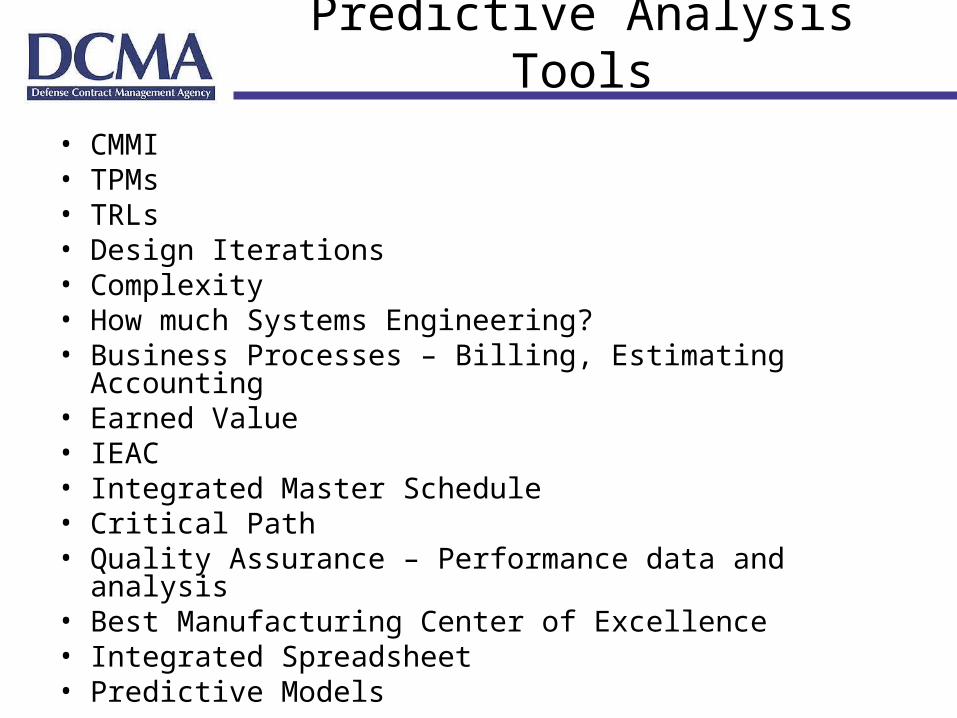
Predictive Analysis Tools
• CMMI• TPMs• TRLs• Design Iterations• Complexity• How much Systems Engineering?• Business Processes – Billing, Estimating Accounting• Earned Value• IEAC• Integrated Master Schedule• Critical Path• Quality Assurance – Performance data and analysis• Best Manufacturing Center of Excellence• Integrated Spreadsheet• Predictive Models

Summary
• Customers want Predictive Analysis
• Need to forecast future problems
• To be truly predictive, one needs to look at the processes used to create the various products
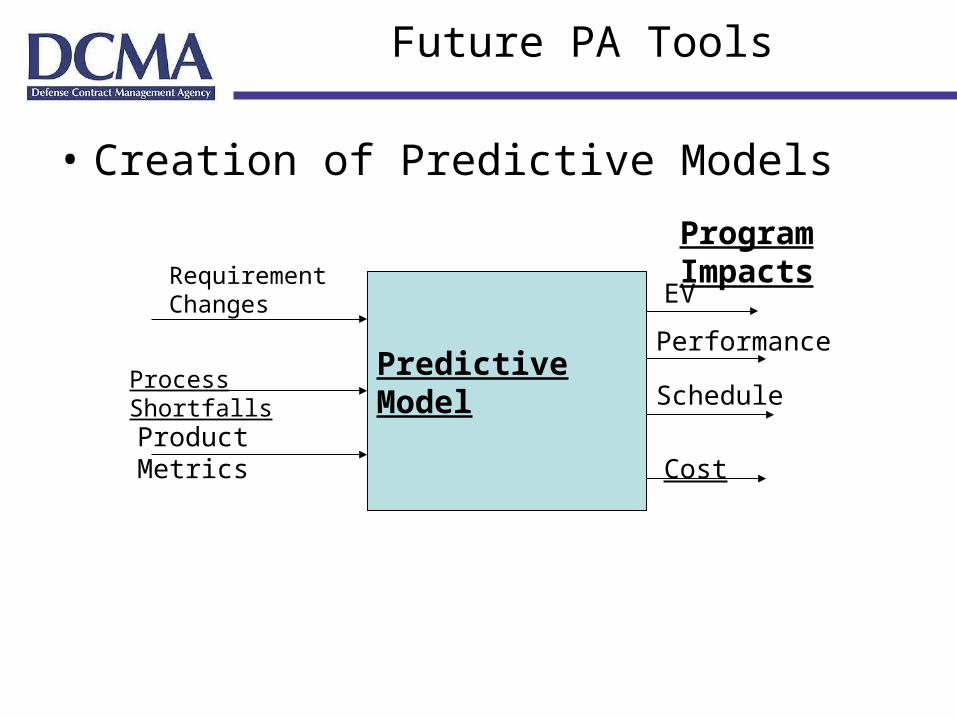
Future PA Tools
• Creation of Predictive Models
Predictive Model
Requirement Changes
Process Shortfalls
Product Metrics
Program Impacts
EV
Performance
Schedule
Cost
Capability Maturity Model Integrated
(CMMI)

Relative Value ofPredictive Analysis
At contract award:• Little known about
product…BUT can:- Estimate
“capability” of supplier
- Identify & assess risks
- Identify process improvement opportunities
• People• Process• Technology
• Contractual Compliance• Product Quality
TIME
As contract is executed:• Emphasis changes from
“capability” to “performance”
CAPABILITY vs PERFORMANCE!
• Contract Surveillance needs to reflect this by:- Evaluating actual process
“performance”- Monitoring achievement of
process improvement objectives
- Identifying new process improvement opportunities
CMMICAN
SUPPORT
BOTH!

What Does the CMMI Cover?
Requirements ManagementRequirements DevelopmentTechnical SolutionProduct IntegrationVerificationValidation
Engineering
ProjectManagement
Project PlanningProject Monitoring and ControlSupplier Agreement ManagementIntegrated Project ManagementIntegrated Supplier ManagementIntegrated TeamingRisk ManagementQuantitative Project Management
Organizational Process FocusOrganizational Process DefinitionOrganizational TrainingOrganizational Process PerformanceOrganizational Innovation and Deployment
ProcessManagement
Configuration ManagementProcess and Product Quality AssuranceMeasurement and AnalysisCausal Analysis and ResolutionDecision Analysis and ResolutionOrganizational Environment for Integration
Support
Category Process Area
Systems Engineering and Software
• Is Systems Engineering applicable to the program?
• Does the program include Software Engineering?
• Does the supplier have any process weaknesses?
• Are the Requirements stable?
• How Complex is the program?
• What is the Technology Readiness Level?
• Are there numerous Design iterations?
• Do the Technical Performance Measures (TPMs) have
a planned profile?
Can you be predictive?
Questions to consider on your program
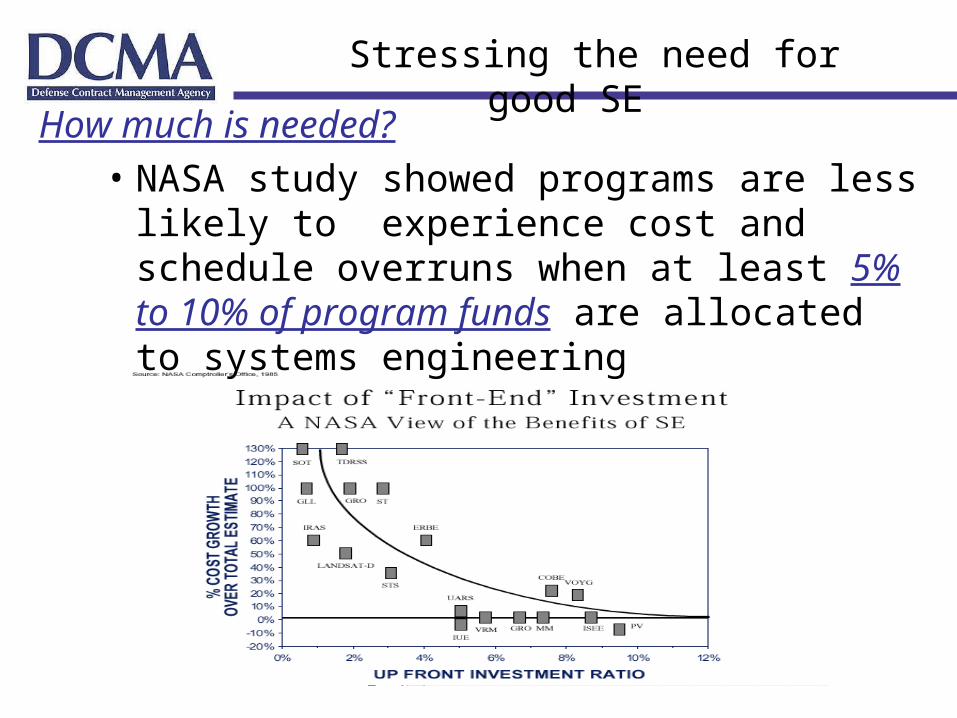
Stressing the need for good SE
How much is needed?• NASA study showed programs are less likely to
experience cost and schedule overruns when at least 5% to 10% of program funds are allocated to systems engineering

Module 3.5
Earned Value Management
Program Support Team (PST) Role in EV
• The PST should use EV as a tool for making predictions, not simply repeating the Cost Performance Report (CPR) data
• The PST report should provide an independent estimate at complete (IEAC)
• The IEAC should include supporting rationale
• The PST’s report should relate variances with analysis results (e.g. floor findings, critical path, TPMs, TRLs, etc)

• IEAC= ACWP + (work remaining) + (cost growth) (performance factor)
• Cost growth due to:• Schedule slip• Added labor• Added requirements• Supplier delays and cost growth• Redesign • etc.
IEAC can be predictive
Rememberyour
contributionto this effort
is your special
knowledge
Special KnowledgePMO Has Formula
IEAC
Summary
• Each member of the PST plays an important role in the
• Analysis of EV data• Predictions of future status• Programmatic risk mitigation efforts
• EV is just one of multiple sources of data synthesized by the PST in predictive analysis
• Predictive analysis should be the objective for all EVMS analysis

Integrated Master Schedule

The IMS should be the framework for program reviews and assessments
• Are the schedules shown during the review representative of what is happening on the program?
• Are problem areas identified and discussed?
Predictive Analysis
• By viewing the dependencies identified on the IMS, you can forecast how schedule problems on one WBS will impact other WBS elements
IMS Analysis
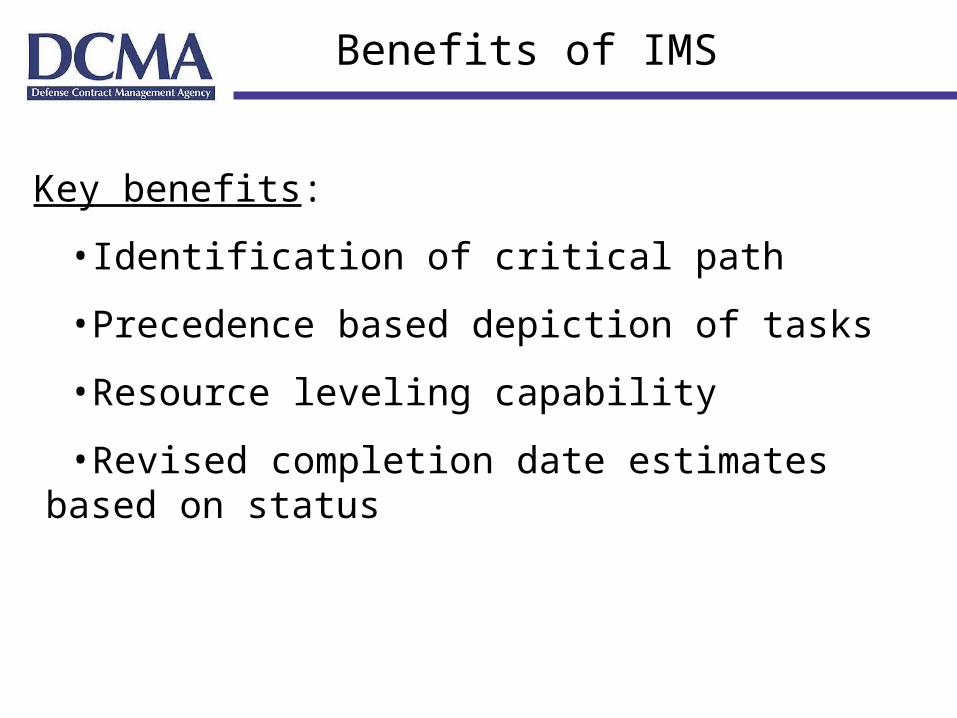
Benefits of IMS
Key benefits:
•Identification of critical path
•Precedence based depiction of tasks
•Resource leveling capability
•Revised completion date estimates based on status
The Critical Path

• Know which WBS elements are on or near the Critical Path
• Compare them with the actual performance
• If tasks are delayed and near/on CP, then this is a high risk area that must be managed
• If tasks are shown as ‘on schedule’ yet you are aware of performance issues, investigate why CP does not reflect delay
• Do you think the planned Corrective Action will have the desired effect on the Critical Path schedule?
• Has the Corrective Action that was taken last month and this month had the intended impact?
Critical Path Analysis
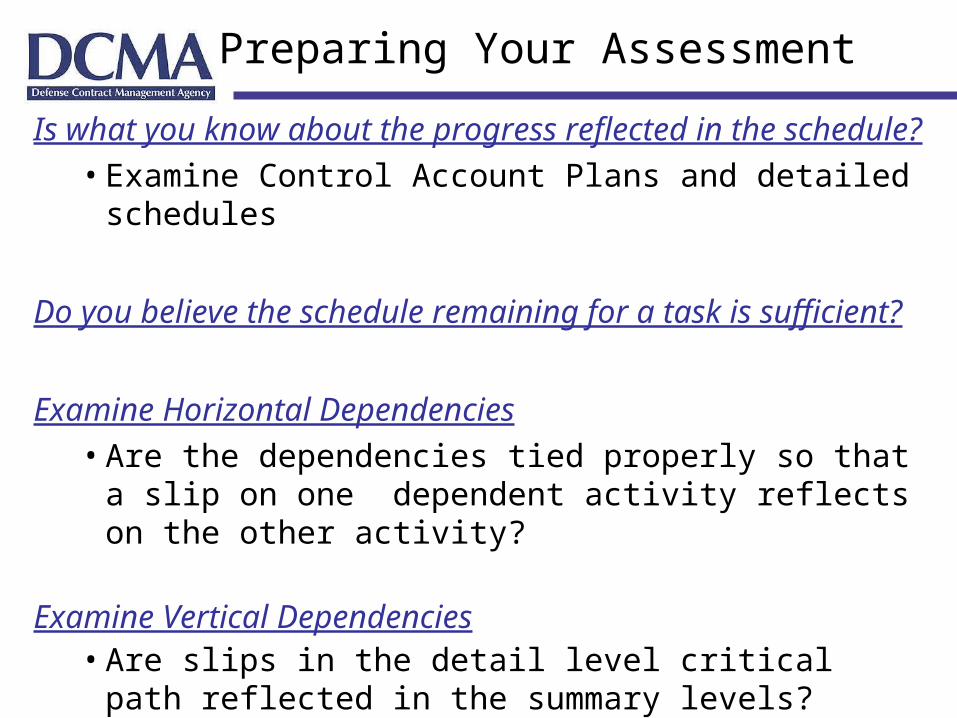
Is what you know about the progress reflected in the schedule?
• Examine Control Account Plans and detailed schedules
Do you believe the schedule remaining for a task is sufficient?
Examine Horizontal Dependencies• Are the dependencies tied properly so that a slip on one
dependent activity reflects on the other activity?
Examine Vertical Dependencies• Are slips in the detail level critical path reflected in the
summary levels?
Preparing Your Assessment
Module 3.7
Quality Assurance

QAS Inputs to PST
What can the QAS provide to the PST?• Performance Data and Analysis • Test information/results• Trends• Bottlenecks *• Scrap/Rework• Subcontracting effort/issues• Contractor Personnel Skill Levels• Management/Labor Insights
* QAS sometimes acts as a production specialist

Predictive Analysis takes under consideration what is strong or weak about a contractor’s process
Predictions should trace directly to: • Strengths & Weaknesses of the contractor’s process
and the words used in our predictions should effectively communicate Strengths and Weaknesses as the rationale for such a prediction
• Similarly…Changes or Adjustments to our in-plant activities should be based on the same observed strengths and weaknesses -- with a customer centered focus on working with the contractor to improve
PA Statements – Positive & Negative

ExperienceExperience InsightInsight
KnowledgeKnowledge
Program Manager’s WorkStation
Your Electronic Consultant!
PMWS is...
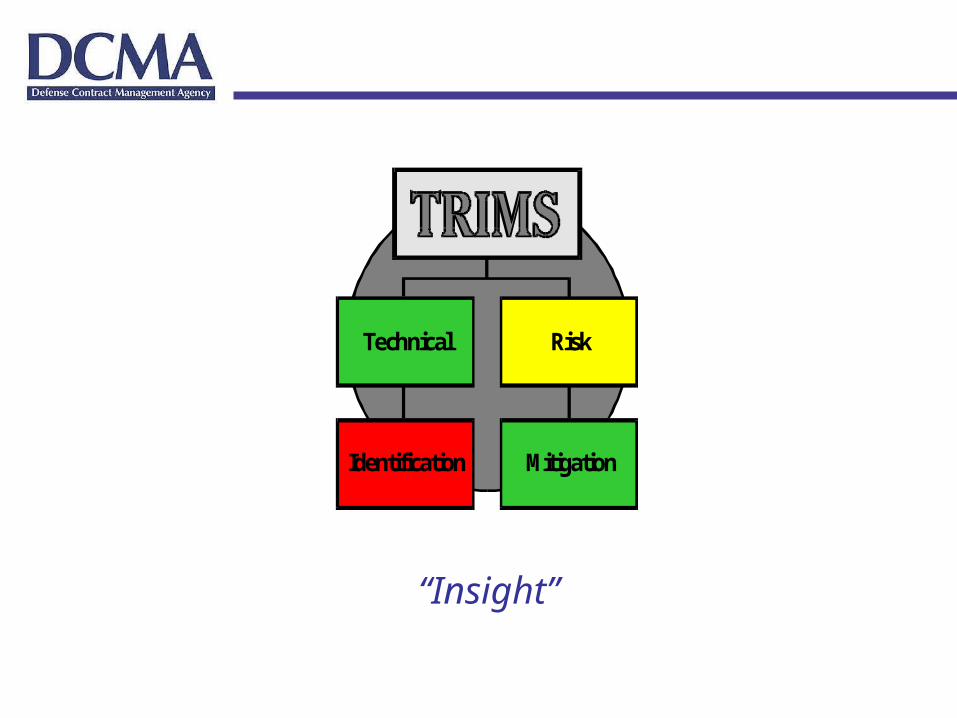
“Insight”
Technical Risk
Identification Mitigation
Tailoring TRIMS To Your Needs
• Identify Risks Before they Become Problems
• Build YOUR Knowledge into TRIMS– Use the Systems Engineering Knowledge Base as a Starting Point for A
Good Engineering Process
• Create a Concrete, Repeatable Process for Evaluating & Comparing Programs & Contractors
• Ease the Learning Curve for New Employees
• Retain Knowledge of Lost Employees
• Share Knowledge
• To Maximize Benefits of Using TRIMS– Apply as Early as Possible in Program Life– Apply to All Subcontractors, Divisions & Vendors Involved– Use Tool Regularly to Prioritize Resources & Make Decisions

Other Measurements
• Major milestone exit criteria (e.g. PDR, CDR)
• If these slip, all subsequent events are impacted
• Drawing release
• This is an excellent early indication of schedule validity
• Number of changes per drawing
• If the drawing change rate exceeds the planned change rate, then the amount is design effort will be higher than budgeted
• Dependency
• Number of sub-contracted items and their complexity
• Stability
• Anticipated changes due to external or internal factors

How Does it All Fit Together?
L1 L2 L3 L4 L5
100000
120000
122000
122100
122110 Y 1 3 H 1.13 1.00 1 week122120 N 2 3 H 0.74 1.00
122130 Y 1 3 H 1.68 0.84
122140 N 2 3 H 4 weeks122150 Y 1 3 H 1.03 1.02
122170 N 2 3 H 0.90 0.95 2 weeks122180 Y 2 3 H 0.98 0.96 3 weeks122190 N 3 3 H 1.21 1.00
122200 N 3 4 M 1.00 1.00 1 week122400 N 3 5 M 1.10 1.00
123000 N 2 6 L
0 0 0 0 0 0 0 0 0 0 0 0 0 0
0 0 0 0 0 0 0 0 0 0 0 0 0 0
MetricsWBS Number
Process Area Hits
Weighted PA Priority= SUM(WBS Priority x PA Influence)
CMMI Appraisal Results
CMMI PAs
Prototype Integrated Spreadsheet

Synthesis/Analysis
Synthesis/Analysis
Tying it All Together
Systems Engineering
Blending
Manufacturing
Predictions Customer
Business
QAProcess Info.
EVMS
Examples of Surveillance Applied