predictions of pulp and paper properties based on fiber ...898813/fulltext01.pdf · predictions of...
TRANSCRIPT

MASTER THESIS IN MACROMOLECULAR MATERIALS
STOCKHOLM, SWEDEN, 2015
1 (36)
Predictions of pulp and paper properties based on fiber morphology
Sara Sundblad

2 (36)
Abstract
The aim is to investigate models that predicts the potential of pulp and evaluate the relevance of the
zero-span tensile index within these. Two chemical pulps made from softwood and eucalyptus were
refined in a Voith-beater with different energy input in order to study the change of fiber morphology
signals and other pulp and paper properties. Chemical, THP pulp from Södra Värö is also used as an
initial analysis for morphological connections to Zero-span tensile index.
The L&W Fiber Tester Plus is used in order to study the pulps fiber morphology and Pulmac 2000 for
zero span. Handsheets are made for mechanical tests such as tensile properties, ZD-strength and
optical properties.
Many of the given signals change according to clear patterns with increasing refining energy. Using
least square methods, formulas describing the development with high adaptation could be formulated.
Many of the measured aspects changes over already known patterns. These are then applied in the
models.
Three possible models is tested: linear regression, Shear-Lag and Page. Of the three, only the two first
ones where able to produce reliable models, whereas the third required data that was difficult to
acquire at the same time as the adaptation was very low. The only model that use exclusively
morphology data is linear regression.

3 (36)
Acknowledgements
There are a lot of people that I would like to thank and acknowledge due to their contributions to my
work and this study. First of all I would like to thank all the people at Lorentzen & Wettre, a part of the
ABB group and Södra Cell Värö that have allowed me to finish my degree with this thesis.
My supervisor Anna Schärman at Lorentzen & Wettre for the support and feedback during my time.
My examinator Michael Lindström at KTH for the feedback, support and inspiration.
Per-Ivar Fransson at Lorentzent & Wettre for the instructions and inspiration.
Gunvor, Lina and Charlotta for the company and laughs during long office days.
Lastly, I want to thank my fiancé Pontus, for tolerating and taking care of me during the days when the
stress gets the best of me.

4 (36)
Contents
1. Introduction ............................................................................................................................................. 6
1.1 Background ..................................................................................................................................... 6
1.2 Aim .................................................................................................................................................. 6
2 Theory ...................................................................................................................................................... 7
2.1 The wood fiber ................................................................................................................................ 7
2.2 The pulping process ....................................................................................................................... 9
2.3 Refining ......................................................................................................................................... 10
2.4 Forming a paper ............................................................................................................................ 11
2.5 Pulp characterization .................................................................................................................... 11
2.5.1 Fiber Morphology ...................................................................................................................... 11
2.5.2 Schopper-Riegler and Canadian Standard Freeness ............................................................. 13
2.5.3 Water Retention Value, WRV .................................................................................................. 13
2.6 Mechanical properties of paper ................................................................................................... 14
2.6.1 Tensile Properties .................................................................................................................... 14
2.6.2 Z-directional strength .............................................................................................................. 14
2.6.3 Optical properties ..................................................................................................................... 14
2.6.4 Zero-Span ................................................................................................................................. 15
2.7 Previous research on paper prediction ....................................................................................... 15
2.7.1 Statistical model ....................................................................................................................... 16
2.7.2 Shear-Lag ................................................................................................................................... 17
2.7.3 Page´s Tensile Equation .......................................................................................................... 18
3 Experimental ......................................................................................................................................... 19
3.1 Instruments .................................................................................................................................. 19
3.1.1 L&W Pulp Tester and the corresponding table top instruments........................................... 19
3.1.2 Pulmac Z-span 2000 ................................................................................................................ 20
3.2 Pulp from Södra Värö .................................................................................................................. 20
3.3 Refining series .............................................................................................................................. 20
4 Results and Discussion ......................................................................................................................... 21
4.1 Morphology and Zero-span ......................................................................................................... 21
4.1.1 Non-morphological alternative signals ................................................................................... 22
4.2 Application of previous models ................................................................................................... 22
4.2.1 Linear Regression .................................................................................................................... 22
4.2.2 Shear- lag .................................................................................................................................. 24
4.2.3 Page’s Tensile equation ............................................................................................................ 25
4.3 Development of properties over refining .................................................................................... 26
4.4 Storage of wet pulp ....................................................................................................................... 27
4.5 Further work ................................................................................................................................. 27
5 Conclusions ............................................................................................................................................ 29

5 (36)
References ..................................................................................................................................................... 30
Appendix 1. L&W Fiber Tester Plus data ................................................................................................. 31
Appendix 2. Graphs with correlated signals. ........................................................................................... 33

6 (36)
1 Introduction
1.1 Background
Today, paper is used for many and varying applications, each with a different set of requirements.
Tissue needs to be soft and flexible, whereas cardboard needs to be stiff and have a high compressive
strength. The paper properties depend on a number of different factors: the chosen method of pulping,
bleaching chemicals or even down to the type of wood used.
Lorentzen & Wettre, a part of the ABB group, produce analytical instruments for the pulp and paper
industry. During recent years the application of online measurements have increased and many mills
depend on them. L&W produce some of the most popular instruments for online measurements, both
for pulp and paper lines. Several of L&Ws customers are now asking to use the obtained data from
L&W Pulp Tester to predict the properties of the formed paper.
Together with Södra Cell, a forest company with three pulp mills in Sweden, different aspects of
external fiber morphology were measured on their kraft pulp. As Södra does not own any paper
machines, it is important for them to supply the right kind of pulp with the right properties, depending
on their customers’ needs. Since a few years back, the use of prediction tools helps them predict a
number of different paper properties using the data provided by L&W Pulp Tester which provides
online fiber morphology measurements, complemented with a Pulmac Zero-Span tensile test. One
problem is that L&W Pulp Tester supplies results every 6 minutes, whereas the Zero-span has to be
measured manually and does so every 8 hours. At the site Värö, they produce softwood kraft pulp, and
about 425,000 tons of pulp is produced each year (Södra, 2015). Six types of pulp are produced, all
intended for different purposes like packaging, tissue, fabrics or printing paper. The pulp is often sold
as dry, bleached sheets, with a dry content of about 90%.
There are many reasons why one would like to predict the paper properties from pulp data. Pulp
variations can result in changes in the paper, which in turn can cause a number of problems. There are
examples where formation in the paper changed after changing from softwood to hardwood, and the
necessary effects from the shorter fibers were not noticed (Fredlund, Grundström, & Vollmer, 1997). If
the fiber properties had been monitored properly, the correct counter measures could have been
implemented. Prediction is though not an easy process, as there are also factors besides pulping that
influence the final product. Refining, fractionation and drying process influence how the fibers interact,
not to mention performance chemicals that are added to improve the desired properties.
1.2 Aim
The aim for this project is to develop a model for predicting tensile properties for chemical pulp. By
identifying a few signals, probably some that already are measured by the online instrument L&W Pulp
Tester, and investigating some additional ones. The L&W Pulp Tester can measure many variables,
such as optical properties, Canadian Standard Freeness, Shopper- Riegler, different aspects of the fiber
morphology and more. Some variables that today are measured by table-top instruments or
instruments that are not produced by L&W, and therefore it would be desirable to develop models
based on the data we are already given. A model for predicting the development of the morphology
during refining is also a goal, in order to provide customers with a tool for optimizing refining energy.

7 (36)
2 Theory
Making a paper requires many steps and along the line there are many factor and choices that can
affect the properties of the final paper product. It all starts at the selection of raw material to the
calendaring of the dried paper. The choice of pulping method and conditions, the amount of refining,
fractionation and of course what type and amounts of additives are added, all matter and influence the
final product. All of this is monitored during the process and evaluated by testing the paper and fibers.
What follows here is a brief summary of what have been found to be the more influential factors that
affect the strength and description of testing methods and what information we get from them.
2.1 The wood fiber
When making paper, it is mostly common to use woody plants, and among them trees dominate. The
wood fiber, or tracheid as it is called in biology, are dead, hollow cells whose main purpose is to
transport water and offer structural support (Ilvessalo-Pfäffli, 1995). They are axially oriented in the
tree, while other cell types manage the radial transports, from the bark towards the center. Tracheid are
formed in the phylem, the layer of the tree stem that lies just inside the bark. The wood fiber can have
different size, proportions and chemical composition depending of species, season and origin. Fibers
that are formed during spring and early summer tend to have thin walls with a large lumen, whereas
those formed during the fall and winter have thick walls (Paavilainen, 1994). The thicker wall makes
the wood darker, and results in the growth rings that one can observe in trees. The thinwalled cells are
called earlywood and the thickwalled latewood. Thickness also gives rigidity and as we will see, the
thickness of the walls have some influence over density. The difference can be seen in Figure 7.
For pulping one mainly uses softwoods and hardwoods. Softwoods are conifers that have longer fibers
and are common for pulping in northern Europe and North America. The wood structure is considered
to be simpler (Ilvessalo-Pfäffli, 1995). The different types of cells are more uniform, although when
growing in areas with great temperature differences between seasons, the difference between
earlywood and latewood becomes more define. Hardwoods are leaf-bearing trees and tends to have
shorter fibers. Although the difference between earlywood and latewood is less distinct, the cell types
differ much more in size. A comparison of fiber length between species can be seen in Figure 2.
Figure 1. The different layers of a fiber. The lines on each layer
illustrates the orientation of cellulose fibrils.

8 (36)
‘
Figure 2: Comparison of fiber size between different wood species.
Hardwoods and softwoods also differ at a molecular level. They both contain cellulose, hemicelluloses,
lignin and extractives, but the different types and structure for these can differ. The celluloses has the
similar hierarchical structure, where long chains (not entirely known how long, but numbers around 10
000 is mentioned in the literature (Ilvessalo-Pfäffli, 1995)) crystallize and form microfibrils that then
build up the walls of the tracheids. The orientation of the fibrils is illustrated in Figure 1. The
hemicelluloses can differ a lot more in both shape and composition. Apart from cellulose that only
contains glucose units, hemicelluloses consists of galactose, mannose, arabinose or xylan as well as
acetyl groups. These variations and the acetyl side groups makes it almost impossible for
hemicelluloses to crystallize in the same manner as cellulose at the same time as they are shorter, ~200
units. Hardwoods contain more xylan-based hemicelluloses (Teleman, 2011) and softwood
hemicellulose have more glucomannan (glucose and mannose units combined). Both types are found in
the matrix between the cellulose fibrils. Lignin is a non-sugar based, hydrophobic polymer that
functions as a cross-link that gives woody plants their stiffness. When pulping this is the main molecule
that one targets. Softwoods contain around 25-35% lignin and in hardwoods it can vary between 18-
25% (Kollmann & l Côté, 1968).
The length of the fiber is as factor that since long have been known to influence tensile properties. Since
softwoods tend to have longer and more uniform fibers, the strongest papers are usually made using a
high content of softwood fibers. Therefore, the key to getting a really strong paper starts already when
choosing your raw material.

9 (36)
Fibers in an environment with very high pH dissociate H+-ions and get negative charges spread over
the surface. The reason for this effect is the acetate and acid groups that some hemicelluloses have, but
also from phenols in lignin or remaining extractives such as fatty acids (Laine, Lövgren, Stenius, &
Sjöberg, 1994). Total charge of the fibers are therefore something that can affect how strongly they are
attracted to each other in a pulp suspension. This measured by titration in order to find the total
charge. Since fibers are small, a lot of surface interaction can occur. In order to lower the surface area
the fibers stick to each other and form clusters. This becomes easier if the fibers are flattened.
Attraction between the fibers can also be indicated by Zeta-potential (Bhardwaj, Kumar, & Bajpai,
2004). Zeta-potential is a concept that originates from colloid chemistry, where is it used as a
measurement of the stability of colloids, in this case the fibers. One measures the electric potential in
interfacial double layer that surrounds and separates the fibers from the surrounding media. A value
close to zero means that the stability is low, and the fibers will flocculate rapidly. A value far from zero,
either positive or negative, indicate stability.
2.2 The pulping process
In the industry, one differ between chemical and mechanical pulping. Chemical pulping methods have
a lower energy consumption although a lower yield. A number of different pulping chemicals are used,
and the cooking is either alkalic or acidic. Independently of the chosen chemicals, the wood logs are
first debarked and chipped in order for cooking chemicals to penetrate the fibers more easily. The
lignin that holds the fiber together and makes them stiff are degraded, resulting in softer and separated
fibers. Mechanical pulping consumes a lot of energy, but have a higher yield. Mechanical pulping
separates the fibers mechanically, resulting in a lot of damaged fibers and smaller fragments, called
fines, and fibrillation is generated. Fibrillation is when the primary wall of the fibers cracks and
separated from the secondary wall, which makes the fibers look “hairy”. These fragments contribute to
a larger surface area among the fibers, and it also tends to contribute to a high brightness. There is also
semi mechanical methods that uses heat and chemical pretreatments of the woodchips before
separating them mechanically.
At Södra Cell Värö, softwood pulp is produced using sulfate as the active cooking chemical. The sulfate
method, or Kraft process, is performed at high temperature with alkalic conditions using sodium
sulphide and sodium hydroxide, and is one of the most widely used in the world. The name Kraft comes
originally from the German word for force, and as the name suggests, the paper made using this
process becomes strong yet flexible. Wood logs are first debarked and chipped, and then put into a
cooker. The chips are first impregnated with the white liquor that contains the active chemicals, and
heated in order to break down the lignin. This can be achieved in both batch and continuous cooking.
The cooked chips become soft and the fibers can be separated from each other. Fiber separations are
further induced with washing where the unused cooking chemicals and the removed lignin and
hemicelluloses are removed. The previous white liquor have now become darker and thicker, and is
therefore called black liquor. The black liquor is then used in a recovery boiler where the black liquor is
ignited and turned into a green liquor, to which burned lime is added. The green liquor slurry is then
washed, and the white liquor can be recovered. The use of the black liquor in the recovery boiler
generated large amounts of heat and energy that can be used to fuel the process, but it is also the most
common bottleneck in a mill.
The chemical mechanisms of Kraft pulping creates a pulp that is darker than the original wood, and
bleaching is therefore required. Bleaching increases the brightness of the pulp, and achieves this by
both removing lignin and destroying colored structures. There are one major way that one separate
bleaching methods, depending on chlorine have been used or not. TCF (total chlorine free) and ECF

10 (36)
(elemental chlorine free) bleaching methods are used, where TCF contains no chlorine containing
chemicals and ECF can include chlorine dioxide. None of the sequences includes chlorine gas, which
have shown to generate harmful byproducts. The bleaching itself is done sequentially, with washing in-
between. There are many alternative bleaching chemicals used, such as oxygen, ozone, peroxide,
enzymes ect. Oxygen delignification is a well proven method that almost always is included, as
dignifying before the actual bleaching.
By removing lignin, hemicelluloses and extractives from the wood, the fibers separate and less rigid.
The flexibility is essential in order to get entanglements and a lot of surface area available for inter-fiber
bonds (Paavilainen, 1994). Attraction between the fibers is important for entanglements to occur, and
this is denoted as fibrillation or fibril index. The fibrillation is an important aspect that recently have
been possible to measure online as well by the L&W Pulp Tester. The fibrillation is also relatable to
WRV (Olofsson, 1997), which is important for predicting the dewatering in the paper machine. Higher
fibrillation correlated with a higher dewatering percentage and the fibril index increases with the
refining, due to the exposure of more surface and generation of fines.
2.3 Refining
Before the pulp is ready to become a paper, some refining is required in order to improve the intended
properties. Industrial refining has two main methods: fibrillating refining and fiber cutting refining.
Fibrillatin refining aims to increase flexibility, flatten and straighten the fibers which gives more
strength to a paper, at the same time as fines and fibrillation are generated. The primary fiber wall is
crushed and the secondary wall of the fiber is partially exposed. The internal walls also form internal
cracks where the cellulose crystals separate, which gives flexibility at the cost of fiber strength
(Thuvander, Gamstedt, & Ahlgren, 2001). Proper refining is one of the key factors if one wants a really
strong paper (Biermann, 1996). The distance between the discs is usually a lot wider that the width of a
fiber, which indicates that the refining is performed by applying shear force on flocks of fibers. The
attractive force between fibers can therefore be of some significance. Refining is very energy
demanding, but it is also important not to put too much energy into it, as it will destroy the fibers.
Prediction of fiber deformation and fines generation is also important in order to refine the fibers to the
right degree. With refining, the attraction between the fibers increases as well, and the fibril index
increases.
Figure 3: Illustration of the two refining sets used in industry.
In lab environment one simulate refining by beating, which is the terminology for the corresponding
process. The beating is a way of simulating the refining, but the results can be difficult to compare to
industrial data. Two types of mills are used in labs, the PFI that has a flat surface instead of the two
shown in Figure 3, and Voith which resembles industrial treatment more closely. It is also difficult to

11 (36)
simulate modifications caused by other steps of the industrial process, such as moving along pipes and
pumps.
2.4 Forming a paper
The main purpose of the paper machine is, besides forming a paper, to remove water. The fiber
suspension that exits the headbox has a dry content of fibers around 0.25%, and therefore, a lot of
water needs to be removed. Initially the pulp suspension is sprayed onto a wire, or between two wires.
The single sided dewatering results in paper that have different roughness of the two sides. Double
sided dewatering gives more similar properties and is more suitable for papers intended for printing.
The soon to be paper is then pressed and heated in order to remove more water. The machine usually
runs as a very high speed, which impedes the drying. The solution is to elongate the machine, and it is
not uncommon for paper machines to be over 100 m long, with the drying section taking up around 4/5
of it. The sections of the procedure is illustrated in figure 4.
Figure 4. Simplified picture of a paper machine. Above the decrease in water content can be observed.
A lot of mechanical paper properties are dependent on the conditions in the paper machine. It starts
already in the headbox, and the width of the opening influences the thickness and therefore indirectly
the tensile strength. Higher thickness means that there are more fibers and more bonding surface. The
headbox also tries to disintegrate flocculated fibers in order to get a more even distribute over the
sheet. The next thing that happens is the dewatering, where a part of fines and smaller particles
disappear though the wire, before larger particles and fibers can cover the holes. The wet pressing that
is a part of the initial water removal, and swelling (indicated by WRV, see 2.5.6) follows as the pressure
from the nip is released. Pressing can only get the moisture content down to around 50%, so after the
pressing section further water removal must be performed by adding heat. This is done by having
steam in the calendar rolls. Heating further contributes to the collapse of fibers (Stenström, 2011), and
result in shrinkage which should be monitored closely.
2.5 Pulp characterization
2.5.1 Fiber Morphology
The shape of the fibers is an important influence over the final paper properties. The morphology is
measured optically using image analysis. To be classified as a fiber, an object must have certain
proportions, and these are different depending on chosen standard. Objects that do not fulfill the
definition are categorized as other categories; fines, vessel cells, rund objects ect. The generated data
includes not only the length and width of fibers, but also information about smaller particles and
12 (36)
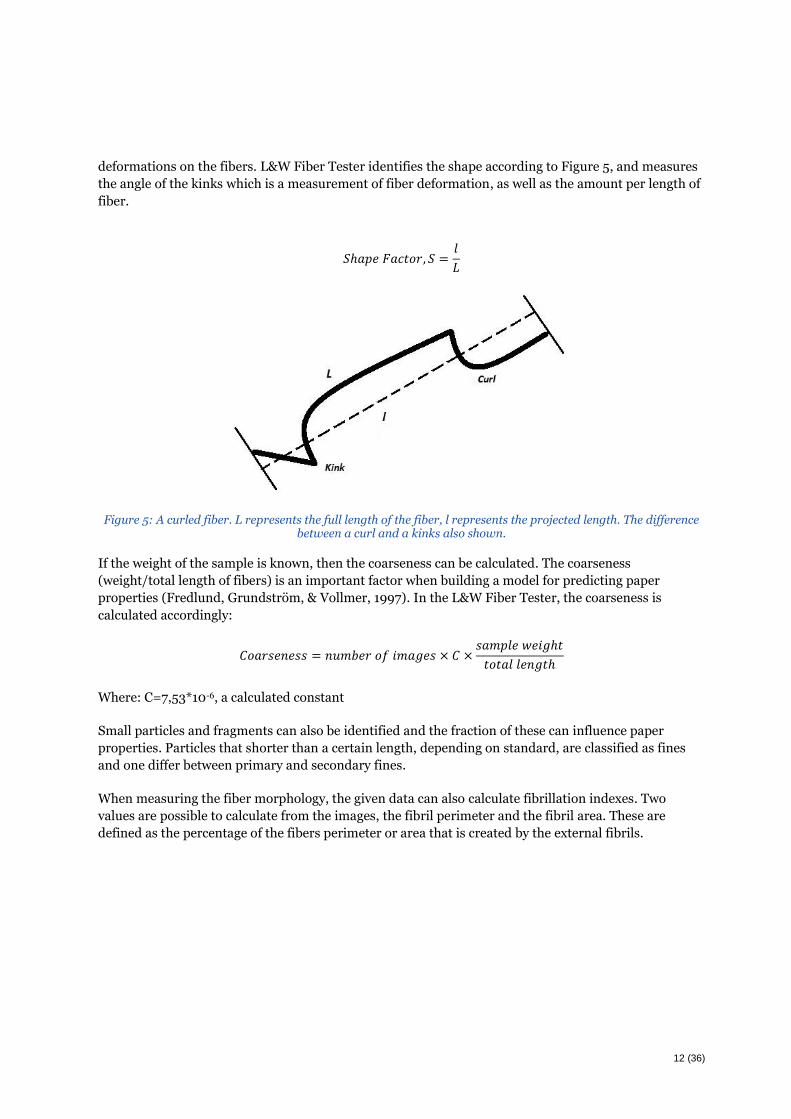
deformations on the fibers. L&W Fiber Tester identifies the shape according to Figure 5, and measures
the angle of the kinks which is a measurement of fiber deformation, as well as the amount per length of
fiber.
𝑆ℎ𝑎𝑝𝑒 𝐹𝑎𝑐𝑡𝑜𝑟, 𝑆 =𝑙
𝐿
Figure 5: A curled fiber. L represents the full length of the fiber, l represents the projected length. The difference between a curl and a kinks also shown.
If the weight of the sample is known, then the coarseness can be calculated. The coarseness
(weight/total length of fibers) is an important factor when building a model for predicting paper
properties (Fredlund, Grundström, & Vollmer, 1997). In the L&W Fiber Tester, the coarseness is
calculated accordingly:
𝐶𝑜𝑎𝑟𝑠𝑒𝑛𝑒𝑠𝑠 = 𝑛𝑢𝑚𝑏𝑒𝑟 𝑜𝑓 𝑖𝑚𝑎𝑔𝑒𝑠 × 𝐶 ×𝑠𝑎𝑚𝑝𝑙𝑒 𝑤𝑒𝑖𝑔ℎ𝑡
𝑡𝑜𝑡𝑎𝑙 𝑙𝑒𝑛𝑔𝑡ℎ
Where: C=7,53*10-6, a calculated constant
Small particles and fragments can also be identified and the fraction of these can influence paper
properties. Particles that shorter than a certain length, depending on standard, are classified as fines
and one differ between primary and secondary fines.
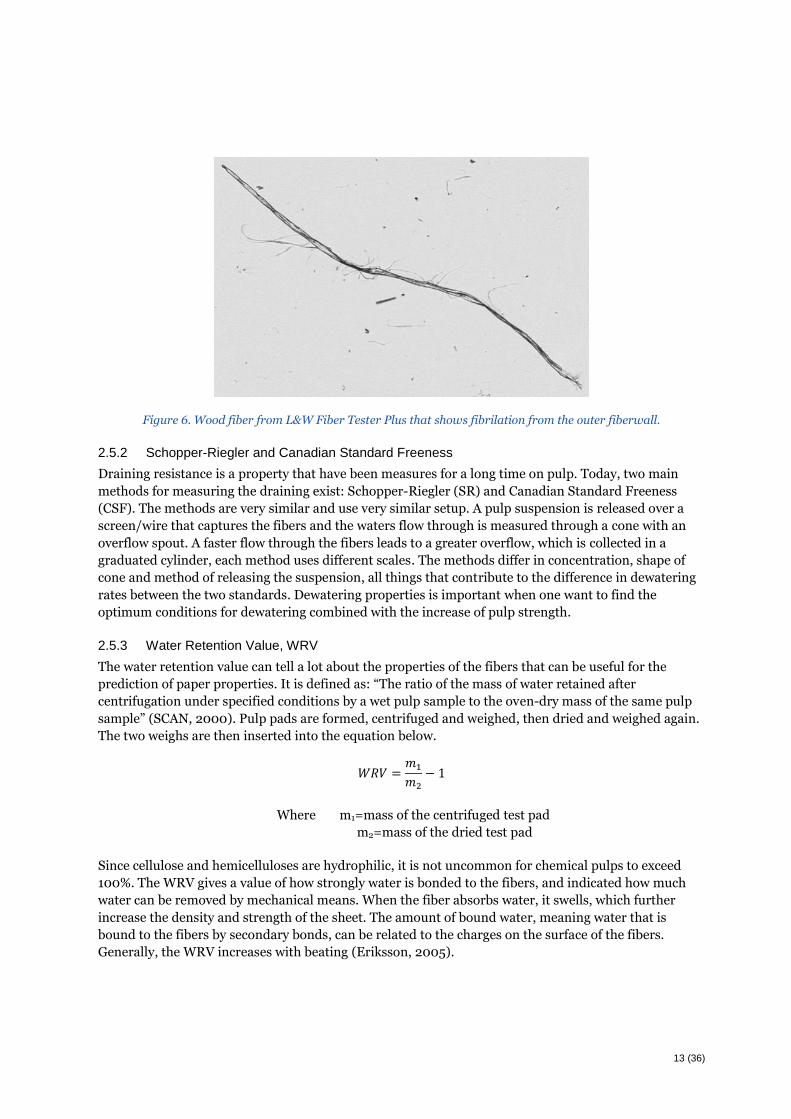
When measuring the fiber morphology, the given data can also calculate fibrillation indexes. Two
values are possible to calculate from the images, the fibril perimeter and the fibril area. These are
defined as the percentage of the fibers perimeter or area that is created by the external fibrils.
13 (36)
Figure 6. Wood fiber from L&W Fiber Tester Plus that shows fibrilation from the outer fiberwall.
2.5.2 Schopper-Riegler and Canadian Standard Freeness
Draining resistance is a property that have been measures for a long time on pulp. Today, two main
methods for measuring the draining exist: Schopper-Riegler (SR) and Canadian Standard Freeness
(CSF). The methods are very similar and use very similar setup. A pulp suspension is released over a
screen/wire that captures the fibers and the waters flow through is measured through a cone with an
overflow spout. A faster flow through the fibers leads to a greater overflow, which is collected in a
graduated cylinder, each method uses different scales. The methods differ in concentration, shape of
cone and method of releasing the suspension, all things that contribute to the difference in dewatering
rates between the two standards. Dewatering properties is important when one want to find the
optimum conditions for dewatering combined with the increase of pulp strength.
2.5.3 Water Retention Value, WRV
The water retention value can tell a lot about the properties of the fibers that can be useful for the
prediction of paper properties. It is defined as: “The ratio of the mass of water retained after
centrifugation under specified conditions by a wet pulp sample to the oven-dry mass of the same pulp
sample” (SCAN, 2000). Pulp pads are formed, centrifuged and weighed, then dried and weighed again.
The two weighs are then inserted into the equation below.
𝑊𝑅𝑉 =𝑚1
𝑚2
− 1
Where m1=mass of the centrifuged test pad
m2=mass of the dried test pad
Since cellulose and hemicelluloses are hydrophilic, it is not uncommon for chemical pulps to exceed
100%. The WRV gives a value of how strongly water is bonded to the fibers, and indicated how much
water can be removed by mechanical means. When the fiber absorbs water, it swells, which further
increase the density and strength of the sheet. The amount of bound water, meaning water that is
bound to the fibers by secondary bonds, can be related to the charges on the surface of the fibers.
Generally, the WRV increases with beating (Eriksson, 2005).

14 (36)
2.6 Mechanical properties of paper
Paper is used for a wide range of applications such as hygiene, printing or packaging. Depending on the
application, different properties are required. In order to find if the paper is suitable for the chosen
application, one has to perform measurements. As with many things in the scientific domain, there are
standards as to how to test these properties in order to get results that can be compared to each other.
ISO (International Standardization Organization) and SCAN (Scandinavian Pulp, Paper And Board
Testing Committee) are common in Sweden where this study takes place. Internationally, there is also
TAPPI (Technical Association of the Pulp and Paper Industry, USA), CPPA-TS (Canadian Pulp and
Paper Association- Technical Section) and APPITA (Australian Pulp and Paper Industry Technical
Association) (Eriksson, 2005). All of these are responsible for developing standards and instructions as
to how to properly perform testing.
One important aspect is also conditioning. Paper is a hydroscopic material and the flexibility of the
fibers can somewhat depend on temperature. Therefore, it is important for the environment to have
constant temperature and humidity, and these are the same when comparing results. It is also
important that the samples are in the environment for a period of a couple of hours before testing.
Mechanical properties depend heavily of the orientation of the fibers and test results can depend on
which direction the paper is tested. In the paper machine, if fibers align along the machine direction,
MD, the paper therefore become stronger in this direction. In the cross direction, CD, there is usually
less alignment and the strength is not as high as for MD, but tearing strength becomes higher. In a lab
environment, paper sheets are usually made by making handsheets (ISO 5269-1) where the fibers
become randomly oriented. Testing these sheets will therefore give different results compared to
machine made paper, and prove somewhat of a hinder when applying lab data to mills.
2.6.1 Tensile Properties
Tensile properties, which is the scientufuc term for strength properties, include tensile strength,
stretching, strain at break, Youngs modulus, stiffness and elongation. The tensile index is also common
when comparing papers, because it includes the grammage of the paper as well. These are all factors
that are used in material mechanics for all materials, and not exclusively for paper. The tensile index is
higher in chemical pulps compared to mechanical, and the theory is that chemical pulp fibers are more
flexible and more easily deformed. With the possibility for the fibers to collapse and entangle, the more
bonding surface becomes available for other fibers to bond onto (illustrated in Figure 7) (Paavilainen,
1994). That is considered to be one of the main contributes to the tensile strength. The strength of the
individual fibers can be considered to be a factor, but if the bonding between the fibers is weaker, then
the fibers will simply be pulled out.
2.6.2 Z-directional strength
The Z-direction, or ZD, is the third dimension of a paper. It is the thickness direction, and it measured
by adding double sided tape to both sides of a strip and pulling. It can be seen as a way of measuring
the bonding strength between the fibers, but there are a lot of sources for error on the method. The
adhesive ability of the tape is of high significance and if the test sheet is a laminate then separation of
these could be the major failure when the force is applied. Any form of paper can be tested, but it is
more common for measuring laminated products such as multi-ply board and cardboards.
2.6.3 Optical properties
The chemical and particle composition affect how light behaves when it hits the paper. Pulp makers
often want to know the brightness of their pulp in order to know how much bleaching is required,
which is given by how much of the light is reflected back. Different wavelengths can also give other

15 (36)
information, as to how much of the light scatters, florescent molecular structures and light absorption.
The light scattering coefficient for instance, can be seen as an indicator as to how much free area is
present in the paper. A high available area gives a lot of surface with different angles that can reflect
light. The area that is not available is bonded to other particles and fibers. Therefore, a linear
relationship between the light scattering coefficient and tensile strength exist, and zero tensile strength
corresponds to the total area of the fibers (Paavilainen, 1994).
2.6.4 Zero-Span
The idea of zero-span is to measure the strength of the individual fibers. Two clamps are positioned
with no or very small distance between them when clamped, hence the zero (Letho, 2004)and then
pulled apart. To use this, one need thin and wet sheets in order to get reliable results. Wet sheets are
required in order to eliminate bonding forces between the fibers. Lab sheets made according to ISO
5269 with a grammage of 60 g/m2 is appropriate according to the standard ISO 15361. The correlation
to paper tensile strength is debated and it is not entirely agreed that it really is the individual fiber
strength that is measured or if it is the bonding between the fibers that is measured. A true zero
distance between the clamps is to start with considered impossible (Mohlin, Jansson, & Miller, 1991). It
could be that the clamps put pressure on two different fibers, and then it would be the bonding strength
that actually is measured. In this case, Z-directional strength could be used as an alternative. Neither
are the fibers always straight when in a paper, and it could be deformation affect the measurement
from the true value of the fiber strength.
2.7 Previous research on paper prediction
The idea of predicting the paper properties by looking at the suspended fibers is hardly a new idea.
Trials and formulation of theories have been attempted since the 70s, and today there are a few factors
that have been determined to be more relevant than others. Kraft pulp produces the strongest papers,
(Biermann, 1996) and it is important to note that the pulping method chosen can be more influential
than any other factors. Other than that, the most important factors for tensile strength have been found
to be the length of the fibers, coarseness and the shape factor.
Coarseness is mass per length of fiber and can be related to both cell wall thickness and stiffness (Lai &
Mohlin, 1998). Chemical pulping methods that have a lower yield have so because of the more specific
removal of lignin and hemicelluloses that stiffen the fiber. With a lower coarseness as a result, the fiber
is more flexible, and can curl, entangle and collapse in a way that gives more possibility for bonding
area. (Paavilainen, 1994)
The shape of the fiber is today considered to be one of the most important factors. The length combined
with the coarseness affects how easily the fiber entangles and form flocks. The length can also influence
the amounts of kinks and curls there are on a fiber, and in tensile testing these fibers tend to straighten
before breaking. The deformation of the fibers can be denoted as the curl index explained below. Other
types of fiber deformation can occur that can affect the tensile strength. The fibers can fold, compress,
have dislocations and twists. All of these deformations mean that the fiber is not necessarily straight in
the paper. Then stress is applied, there is room for straightening of fibers before they are pulled out or
break. (Fredlund, Grundström, & Vollmer, 1997)
The thickness of the cell wall influence the density and the collapsibility of the fibers. Earlywood with
its thinner walls tends to collapse more easily, and the thick walls of the latewood makes them sturdy.
As seen in Figure 7, collapsed fibers gives not only density but also more of the fiber surface is available
for bonding area. Fractionation can be one way of separating the fibers in order to ensure that the
proper fibers are used for the intended product. As illustrated in Figure 7, thinwalled fibers collapse

16 (36)
more easily at the same time as they also are lighter (Paavilainen, 1994) and can then be separated from
the heavier latewood fibers.
Figure 7: Illustrating the difference in collapsing behavior of earlywood and latewood cells.
2.7.1 Statistical model
One method is to gather massive amounts of data and apply statistical evaluations to find relationships.
Such a study was performed at Skogsindustrins Tekniska Forskningsinstitut, STFI (Fredlund,
Grundström, & Vollmer, 1997) where Principal Component Analysis, PCA, was used and it was found
that many factors covariate along either of three axis and therefore the properties could be divided into
three groups and one factor from each group could be chosen to be used in an approximated linear
formula. It could be further improved by adding coarseness. Constants are added using linear
regression in order to adjust the formula for a better fit, and calculated for each pulp type. This study
used cardboard paper from 5 different types of pulp, and the model was partly confirmed at a mill. The
study concluded into the following formula:
𝜎𝑇 = 𝐾 + 𝑐1 ∗ 𝑙 + 𝑐2 ∗ 𝑤 + 𝑐3 ∗ 𝑆 + 𝑐4 ∗ 𝑐
Where: 𝜎𝑇= Tensile Index, Nm/g K= constant
c1, c2, c3= constants l= fiber length, mm
w= fiber width, µm S= shape, %
c=coarseness, mg/m
The study at STFI used Multivariate Data Analysis, or for short MVDA, (also MANOVA, Multivatiate
Analysis Of Variation) which is a method for analyzing large amounts of data, and finding relationships
therein. MVDA can be performed using different methods, all based on the assumption that related
data behave in a similar fashion. The way to illustrate this can be done using different calculations and
visual aids. Principal Component Analysis, PCA, tries to find the principal components that form linear
combinations (Miller & Miller, 2010) of the original variables. By plotting data against each other, one
can visualize if there are any covariance between them and also if there is any points that deviate. For
this to work properly, large amounts of data is needed in order to the pattern to emerge properly. This

17 (36)
is easy to visualize with two or three variables, but with larger samples one require other tools. PCA
identifies the principal components with a covariance matrix (can be performed with Excel), which
gives the constant in the linear function that approximately describes the relationship. The PCA then
provides the eigenvalues, how much each variable contributes to the variation and reduces the
variables that one can plot against each other. These plots can then describe how data may be
separated.
Linear regression is the part of MVDA that finds the constants that best adapts the independent
variables to the dependent one. In this study it is the tensile index or zero-span-tensile index is the
dependent value, and different morphological aspects are the independent value. Linear regression
function constants are calculated using excels Data Analysis Toolpack. The calculation also generates a
measure of adaptation, denoted R2. The closer R2 is to one, the better the adaptaion, because R2 is
calculated by subtracting the quota of the residual mean square over the total mean square. The
smaller the residual, which represents the distance to the function, the smaller the quota. Respectively,
the larger the total mean square, the total of all means squared, the smaller it gets.
𝑅2 = 1 −𝑟𝑒𝑠𝑖𝑑𝑢𝑎𝑙 𝑚𝑒𝑎𝑛 𝑠𝑞𝑢𝑎𝑟𝑒
𝑡𝑜𝑡𝑎𝑙 𝑚𝑒𝑎𝑛 𝑠𝑞𝑢𝑎𝑟𝑒
In this study, and R2-value above 0,9 are considered reliable. Between 0,8-0,9 can be considered
relevant, but below that the correlation is considered too low to act as a replacement. Since the goal is
to replace zero span and/or predict paper properties, the requirement for small deviations is high.
2.7.2 Shear-Lag
When modeling it is necessary to make assumptions about the nature of the material. One could view
the material as a composite, with fibers suspended into a continuous phase of fines and fillers.
Formulas such as the Shear-lag have therefore been applied with modification (Axelsson, 2009) for
mechanical pulps with relative precision. Shear-Lag assumes that there is a critical length of the fibers,
where an ultimate value of the shear stress, σF, applied can either pull out (l<lcrit) or break the fiber
(l>lcrit). The modification consists of dividing the strain into two contributors and the factor of fiber
deformation, FD. Then by adding constants (g) and breaking it down into measurable influences such
as: shape factor (CI), Z-parameter (area of cross sectioned fiber wall/total cross section area), the
slenderness λ (surface area/cross sectional area), and fiber density (ρc).
𝑜𝑟𝑖𝑔𝑖𝑛𝑎𝑙 𝑆ℎ𝑒𝑎𝑟 − 𝐿𝑎𝑔: 𝑙𝑐𝑟𝑖𝑡 =𝜎𝑓𝑑𝑓
2𝜏𝑏
𝑚𝑜𝑑𝑖𝑓𝑖𝑒𝑑 𝑆ℎ𝑒𝑎𝑟 − 𝐿𝑎𝑔: 𝜎𝑇 = 𝜎𝑓𝑠 + 𝜎𝑏𝑠 + 𝐹𝐷 = 𝑔1 × 𝜎𝑍𝑆 + 𝑔2
𝜆𝜎𝑍𝐷
𝜌𝑐
+ 𝑔3
𝐹𝑝
𝑍 × 𝑆
Where: 𝜎𝑇 =Tensile Index, Nm/g g1, g2, g3= constants
𝜎𝑓𝑠 =fiber strength contribution 𝜆= slenderness, %
𝜎𝑏𝑠= bonding strength contribution 𝜌𝑐= density of fibers, g/m3
𝐹𝐷=fiber deformation contribution Z= Z-parameter unit
𝜎𝑍𝑆= zero-span tensile index, Nm/g 𝐹𝑝= Fibril permeter
𝜎𝑍𝐷= Z-directional strength, Nm/g S= Shape, %

18 (36)
In the same way as the linear regression and statistics method, the constants g must be calculated using
linear regression. When performing the calculation in excel, one must remember that no residual
constant should be included.
2.7.3 Page´s Tensile Equation
Models for predicting the tensile strength of paper have been developed for a long time. D.H Page
developed a model as early as 1969 (Page, 1969). The Page tensile strength model uses the dimensions
and density in order to estimate a bonding strength between the fibers that then can be related to the
tensile index. The bonding strength between the fibers is as follows:
1
𝜎𝑇
=9
8 × 𝜎𝑍𝑆
×12 × 𝑐
𝑑 × 𝑙 × 𝑏𝑠 × 𝑅𝐵𝐴
Where: bs=bonding strength, N/m2 c=coarseness, mg/m
𝜎𝑇=tensile index, Nm/g 𝜎𝑍𝑆= zero-span tensile index, Nm/g
d= fiber width, µm RBA= relative bonded area, %
g= gravitational constant

19 (36)
3 Experimental
3.1 Instruments
3.1.1 L&W Pulp Tester and the corresponding table top instruments
L&W Pulp Tester is an online equipment for measuring a number of different properties of the pulp. It
has a module system as seen in figure 8, which means that the customer can choose what parameters
should be monitored. It can measure optical properties, dewatering and fiber morphology depending
on the chosen modules. L&W Fiber Tester is another instrument that measures fiber morphology and
pulp composition. Today, most of the more important parameters of the pulp can be measured as often
as every 6th minute, but not all that can be considered relevant when making a model for predicting
paper properties.
Figure 8. L&W Pulp Tester, the online equipment used to measure pulp properties on an industrial pulp production line. To the right is L&W Fiber Tester, the table top instrument that measures fiber morphology in a
lab environment.
For this study, the fiber morphology is the part of L&W Pulp Tester that is of the most interest when
predicting paper strength. The fibers are analyzed using an optical method, exactly the same that is
used in L&W Fiber Tester. A camera takes photos of the fibers while they flow between two plates. A
narrow distance between these plates forces the fibers to orient themselves and can be approximated to
two dimensional. From the pictures taken, the data can then be calculated by image analysis. The L&W
Pulp Tester and L&W Fiber Tester can both detect the length, width, fraction of primary or secondary
fines, coarseness, shape, mean kink angle, fibril index and the distributions thereof. In order to achieve
sufficient support for the measurement, at least 5000 fibers must be analyzed.
L&W Fiber Tester have a lower limit of 10µm when it comes to identifying extremely small particles.
The Plus edition that uses a camera with higher resolution lowers this limit to 4 µm. Under this limit
one find smaller fibrillary fragments and particles that does originate from the wood, such as fillers,
and these cannot be identified using light in the visible spectra. Other methods for finding these are
required, using shorter wavelengths of light.
The optical properties of the pulp is measured with the L&W Elrepho. This instrument is versatile in
the way that it measures a large variety of different properties. As a spectrometer if combines different
wavelengths and filter in order to measure a papers opacity, brightness, light scattering ect. In the L&W
Pulp Tester, a small pulp pad is made for testing the grammage and concentration of the pulp sample,

20 (36)
but is also utilized in L&W Elrepho unit. The table top version measures paper sheets, both in bulk and
single sheets in order to measure the selected properties. In this study, the light scattering coefficient
was measured in order to get a relative bonded area, and see what types of mechanical properties it can
correlate to.
3.1.2 Pulmac Z-span 2000
Performing according to ISO 15361-2000, the Pulmac Automated Z-span 2000 measures the zero-
span, length and bonding of the fibers. The measuring gap can vary as decided by the user, but the
exact distance it not critical for the measurement, as long as it is shorter than the fibers measured. The
clamping pressure is also adjustable, and more crucial in order to get a correct measurement. The
instrument measures 24 points on the given sample, and then calculates the average value.
3.2 Pulp from Södra Värö
Eight softwood THF pulp samples were given from Södra Värö, where Zero-span was already measured
and the refining energy were known. In order to measure coarseness, the dry weight of the pulp
samples are needed. The water content was estimated to 6%, and from that the dry weight of the
samples was estimated. L&W Fiber Tester Plus has a higher resolution on the camera, and can
therefore detect smaller particles than can be detected than L&W Fiber Tester and L&W Pulp Tester
installed in the Värö mill. From the obtained data from the L&W Fiber Tester Plus, an initial analysis of
the data tried to find relations between the measured factors and Zero-Span.
3.3 Refining series
In order to predict the effects of refining, a series of fully bleached softwood and eucalyptus pulps were
used. The softwood pulp originated from Stora Enso, and the Eucalyptus was provided by Fibria. They
were both refined using a Voith-refiner at Innventia. A number of mechanical properties from
handsheets were also measured there. The pulps were all examined in the L&W Fiber Tester Plus and
hand sheets with a grammage of 60g/m2 were made (without white water circulation) in order to
measure Zero-Span was measured according to ISO 15361.
The three models were applied on these pulps. In order to generate a better adaptation, constants were
adjusted using linear regression for the Shear-Lag and linear regression models.

21 (36)
4 Results and Discussion
4.1 Morphology and Zero-span
If one were to assume that Zero-span is a measure of individual fiber strength, then coarseness would
be a factor that it may correspond to. An initial analysis of the dried pulp given from Södra showed that
this assumption does not hold. The deviation from a linear correlation is too great and the data does
not seem to follow any other functional pattern. The fibril perimeter is a signal that could indicate
attraction between the fibers, and neither this signal seems to correlate. A linear regression using the
coarseness and fibril perimeter generated the highest adaptation, with a R2=0,1252 but still not high
enough.
The model developed at STFI (Fredlund, Grundström, & Vollmer, 1997), linear regression is used to
predict the tensile index sucsessfully. An attempt to recreate the calculation with zero-span tensile
index generated a better adaptation, but not good enough to replace the Pulmac Zero span. The
regression generated the formula 𝜎𝑇 = −1110,03 + 69,188 ∗ 𝑙 + 11,7583 ∗ 𝑤 + 11,75828 ∗ 𝑆 − 0,2655 ∗
𝑐, with an R2-value of 0, 6279, thus rejecting its relevance as a replacement for and actual zero-span
measurement.
Figur 9.Linear regression of pulp samples from Södra.
In a similar way was different aspects of the softwood and eucalyptus chemical pulps measured and compared to measured zero-span tensile index. The resulting formulas and R2-values are presented in Table 1. Table 1. Functions and R2 values for the softwood and eucalyptus pulps.
Correlated properties Softwood Eucalyptus
Equation R² value Equation R² value
Zero span- coarseness y = -4,2646x + 520,09 0,1715 y = 0,7334x + 21,679 0,1346
Zero span- fibril perimeter
y = 0,7397x - 52,438 0,1044 y = -0,5608x + 42,009 0,7865
Zero span- light scattering
y = -15,872x + 1 502,4 0,5123 y = 3,2616x - 152,16
0,8089
Zero span- cellulose y = -0,005x + 826,98 0,0018
Zero span- zeta potential y = -0,903x2 + 155,24x - 6701 0,653
R² = 0,6279
100
110
120
130
140
150
100 110 120 130 140
Ca
lcu
late
d Z
ero
-sp
an
ten
sile
in
dex
, N
m/g
Measured Zero-span tensile index, Nm/g
Södra Pulp
Södra Pulp Linear (Södra Pulp)

22 (36)
4.1.1 Non-morphological alternative signals
As an alternative to the fiber morphology as a correlator for the zero-span tensile strength, the chemical
content of the fibers could be analyzed. Carbohydrate amounts, zeta-potential and total charge of the
fibers was measured on the softwood pulp in order to examine possible correlations to zero-span
tensile index. Cellulose content and degree of polymerization have been shown to correlate with Zero-
span (Gurnagul, Page, & Paice, 1992), and zeta potential and total charge can give indication of
tendency to bond between the fibers. Another indicator of the bonding is the light scattering coefficient,
which depends of the available area between the fibers and have previously shown to have a
relationship to the tensile index (Paavilainen, 1994). Light scattering was the only property that showed
a R2-value above 0.9, but only for the eucalyptus pulp. The reasons for this is discussed in 4,4 Storage
of wet pulp.
Figur 10. Plot over the relationship between the light scattering coefficient and zero span index.
4.2 Application of previous models
The three models mentioned in 2,7, where applied using the generated data and compared to the
measured values.
4.2.1 Linear Regression
The study in 1997 provided several constants for several types of pulp. None of the given constants in
the report gave a result that yielded a R2-value above 0,8 and it was therefore an necessity to generate
new constants for the refined pulp used. The reasons for the lack of adaptation can be many. To start
with, the pulps used in 1997 were unrefined which is something that may alter the fibers properties in
ways that are undetected by image analysis. Secondly, the pulps used in the 1997 study were screened,
and the morphology of the pulps used for sheetmaking was probably more uniform that in this study.
Thirdly, that study did not include eucalyptus. The sheets were made using a different standard, and
pulping methods may have changed.
The values generated by the fiber morphology unit of L&W Pulp Tester and L&W Fiber Tester are given
without ten potentials. This means for instance that length and width is given the value 2, but since
y = -15,872x + 1502,4R² = 0,5123
y = -8,0543x + 246,42R² = 0,9058
0
50
100
150
200
250
300
350
0 20 40 60 80 100
Lig
ht
sca
tter
ing
Zero-span N/m
Light Scattering vs Zero-Span
Softwood Eucalyptus
Linear (Softwood) Linear (Eucalyptus)

23 (36)
length is given in mm and width in μm, the width is really one thousandth of the length. Is this
something that needs to be taken into account or can the linear regression model compensate for that?
The uncorrected values gives a better fit than the ones that have been corrected for the size differences,
which is shown in Table 2. This means that the model will be easier to apply, since the data provided by
the L&W Pulp Tester can be used directly.
Table 2. Constants generated for the linear regression model.
Pulp K C1 C2 C3 C4 R2
Softwood- corrected
-161,479 -100769 15769516 -0,01841 -219,408 0,984935
Softwood- uncorrected
-135,543 -44,8373 20,34532 -3,60849 -0,14832 0,999987
Eucalyptus- corrected
-338,513 -170242 0 5,891404 -244,35 0,982031
Eucalyptus- uncorrected
3237,738 -1101,48 -97,2563 -5,4867 -0,4422 0,988127
Figure 11. Plots that compare the calculated tensile indexes to the measured one.
0,0
50,0
100,0
150,0
0 50 100 150
Mea
sure
d T
ensi
le I
nd
ex,
Nm
/g
Calculated Tensile Index, Nm/g
Linear Model fitting, corrected
Softwood Eucalyptus Linear (One-to-one fit)
0
20
40
60
80
100
120
140
0 50 100 150
Mea
sure
d T
ensi
le I
nd
ex,
Nm
/g
Calculated Tensile Index, Nm/g
Fitting of linear model, uncorrected
Softwood Eucalyptus Linear (One-to-one fit)

24 (36)
Being the most successful model in this study, a linear model may not always be the best alternative
(Miller & Miller, 2010). The values generated measured are length-weighted, which is a non-linear
operation. If one wish to apply this method, it is recommended to try other weighting functions as well.
4.2.2 Shear- lag
The Shear-lag model is very sensitive to the size of the input values and requires some data that cannot
be measured online such as the Zero-span tensile index, the ZD tensile index and the cell wall thickness
of the fibers. The cell wall thickness is especially tricky since the only way to get a reliable value is to cut
the fibers and measure the thickness manually in a microscope. Several attempts have been made to
find signals that correlate accurately, but none that are reliable enough. It is therefore more reliable to
choose an average value from literature for the different wood species. Although reliable, choosing a
value will lead to errors because the cell wall thickness varies a lot, especially for wood grown in the
tempered zones. The mixture of springwood and latewood probably affect the final paper properties so
much that an assumed value is simply not representative of the true average. The lack of a reliable cell
wall thickness is probably the major source for deviation, especially for the softwood pulp.
The Shear-lag formula have earlier been applied on mechanical pulps (Axelsson, 2009). Therefore, the
constants g1, g2 and g3 had to be adjusted for chemical pulps. The shear lag constants have also been
recalculated due to some modifications to the formula. For instance the shape generated in L&W Pulp
Tester is calculated differently than in the equipment previously. The constants was also adjusted for an
easier application, which means that unit conversions was included in them. For instance, the fibers are
measured in millimeter, and instead of dividing the given value with 1000 in order to get it in meter,
the constant is divided by 1000 instead.
Table 3. Adjusted constants for the Shear-Lag formula for application on chemical pulp.
Konstants Value
g1 0,146255
g2 0,000117
g3 29,94526
R2 0,996163
Figure 12. Plot describing the fitting of the calculated tensile index using the Shear-Lag formula, compared to the measured tensile index.
0,0
50,0
100,0
150,0
0 20 40 60 80 100 120 140
Mea
sure
d T
ensi
le i
nd
ex,
Nm
/g
Calculated tensile index Nm/g
Shear-Lag fitting
Softwood EucalyptusLinear (Softwood) Linear (Eucalyptus)

25 (36)
4.2.3 Page’s Tensile equation
Page tensile formula includes factors that are difficult to apply to online measurement. The zero-span
tensile index is included and the slightly arbitrary property bonding strength. The relative bonded area
can be measured with the optical properties module via the light scattering coefficient. The bonding
strength is traditionally calculated by measuring the tensile index and this would be counterproductive
in this case since that is the property that we want. The bonding strength have been assumed to be
4,84N/mm2 (Paavilainen, 1994) which is adapted for softwood. Obviously it is different for eucalyptus
since the generated function gets another gradient than softwood, shown in Figure 13.
The model is seemingly sensitive to unit conversions, since it does not contain any adjusting constants
like the linear regression and Shear-lag does. This makes application slightly more difficult, and
depend on the size of the data generated by L&W Pulp Tester. Another reason for the large deviation is
that the formula is based on the assumption that the fibers are straight and oriented. The handsheets
used in this study are randomly oriented and the fibers are not straight. It is also unclear what is meant
by straight, since chemical pulp fibers are flexible and will rarely be straight in suspension nor in the
paper.
Figure 13. Plot describing the relationship between the tensile index calculated by the Page-formula, and the measured tensile index.
The relationship between the measured and calculated tensile index is linear, even though the slope and intersection if off. This can be adjusted with constants, calculated using linear regression. This generates two adjusted equations with a better R2 value in relationship to the measured tensile index. The new alignment with the adjusted Page tensile equation can be seen in Figure 14. Since the slopes are different, the constants becomes different. These adjusted constats then generates a R2- value of 0,994. Tabell 4. Table of the constants used to adjust the Page tensile equation. The values are inserted into the formula
y=mx+c, where y is the measured value and x is the calculated tensile index.
m c
Softwood 8,194429 41,95982
Eucalyptus 58,44264 24,92714
0,0
20,0
40,0
60,0
80,0
100,0
120,0
0 2 4 6 8 10
Mea
sure
d t
ensi
le i
nd
ex,
Nm
/g
Calculated Tensile Index, Nm/g
Page fitting
Softwood Eucalyptus
Linear (Softwood) Linear (Eucalyptus)
Linear (One-to-one fit)

26 (36)
Figure 14. Plot illustrating the effect of adding constants in order to adjust the model to the measured values of
tensile index.
4.3 Development of properties over refining
Many of the morphological properties measured in on the refining series follows functions with quite
good adaptations. Even zero-span index gives R2- values above 0,9, but only for the eucalyptus. Even
though the development is clear, the information does not fulfill the purpose of replacing zero-span
index measurements simply because one still needs an initial value. Investigating the development of
zero-span is relevant is order to predict how the zero span changes in order to use it in the models.
Refining affect the fibers in more ways than can be detected by L&W Fiber Tester. Internal fibrillation
where the nanofibrills inside the walls of the fibers can separate, leads to lower single fiber strength
(Thuvander, Gamstedt, & Ahlgren, 2001). This occurs on such a small scale that it cannot be detected
with image analysis.
Tabell 5. Functions describing the development of pulp and paper properties over refining energy.
Correlated properties Softwood Eucalyptus
Equation R² value Equation R² value
Refining- Zero span y = -0,0006x2 + 0,1267x + 79,281
0,8313 y = 0,0003x2 - 0,0958x + 72,118 0,9148
Refining- CSF y = -1,5021x + 787,18 0,9373 y = -1,9824x + 591,19 0,9999
Refining- SR y = 0,0006x2 - 0,0202x + 13,841 0,9921 y = 0,0005x2 + 0,0619x + 15,861 0,9991
Refining- length y = -6E-06x2 + 0,0007x + 2,2393 0,9906 y = -0,001x + 0,8178 0,9961
Refining- width y = -6E-05x2 + 0,0244x + 29,823 0,9905 y = 0,0091x + 18,359 0,9986
Refining- fines y = 0,0763x + 17,471 0,9907 y = 0,0691x + 17,232 0,9987
Refining- fines primary y = 6E-05x2 - 0,0035x + 9,4464 0,9982 y = 0,0342x + 8,0289 0,9993
Refining- fines secondary
y = 0,0682x + 8,3101 0,9957 y = 0,0349x + 9,1957 0,996
Refining- shape y = -6E-05x2 + 0,0047x + 83,705 0,9624 y = -0,0001x2 + 0,0262x + 88,778 0,9614
Refining- fibril perimeter
y = 0,0846x + 1,6721
0,998 y = 0,0307x + 1,7566
0,9989
R² = 1
0
20
40
60
80
100
120
140
0 20 40 60 80 100 120 140
Ca
lcu
late
d T
ensi
le I
nd
ex
Measured Tensile Index
Adjusted Page´s Tensile Equation
Softwood Ecalyptus Linear (One-to-one fit)

27 (36)
4.4 Storage of wet pulp
The softwood chemical pulp used in this study was purchased almost a year prior. During this time, the
pulp was stored at 4,5% dry content in a fridge. The effects of swelling and degradation of finer
particles is noticeable when comparing the results obtained in this study to measurements made
shortly after their arrival. An example of this can be observed in the Figure 15 that illustrates the
development of the fibril perimeter over the refining energy for the same pulp with 6 months apart.
These effects will surely had an impact on the paper sheet tensile properties, and the irregular Zero-
span values can be an effect by this.
Figure 15. The effect of wet storage of softwood pulp on the fibril perimeter.
Important to note is that this is a situation that only occurs when doing research. During production,
the pulp is either fed directly to the paper mill or sold in a dried state. There can also be differences in
the image analysis software, as a result of continuous development and improvement by researchers at
L&W.
4.5 Further work
Further testing with refining series with more types of pulp for a larger statistical support is a neccecity.
The assumption that refining affects fibers the same does not hold. Recreating the model with other
weighting alternatives is also required before claiming its reliability.
The light scattering coefficient should be investigated further for a correlation with zero-span tensile
index. Does it only correlate with the eucalyptus pulp or can the signal be used for longer fibers aswell?
Since no measurements of the light scattering coefficient were possible to make on the unrefined Södra
pulps, this area needs further investigation to see if the signal is reliable enough.
The linear regression method provided the best fit with uncorrected values, which means that there will
be less work for the customers. The constants will probably require more calibration in order to provide
customized models for each mill. The problem is with this method is though that one are inserting
0
5
10
15
20
25
0 50 100 150 200 250
Fib
ril
Per
imet
er %
Energy kWt/t
Development of Fibril Perimeter
aug-14 apr-15

28 (36)
length-weighted values, which is a non-linear process. Recalculation the constants using different
weighting is a must before confirming its reliability.
A good model takes years to develop, and depend what one want to achieve. Considering that there are
many steps before and after L&W Pulp Tester and the final paper product, one can have different
approaches. Fiber morphology is an important tool when making predictions, but certainly not the only
factor. Before refining, pulping method, bleaching sequence and washing can influence the individual
fiber strength and bonding ability of the fibers. After refining, there is a step where chemicals and fillers
are added in order to further improve the aspired paper properties. Then there is the paper machine
where tensile strength is further affected by orientation and drying. One can therefore approach the
model from a pulp- or paper production perspective. A pulpmill may want to provide the service where
they provide curves for their customers where the customers can determine the potential in their pulp.
Papermills that buys pulp may want to know how much specific energy is needed in order to reach a
certain SR or CFS. Though very much related, the in- and outdata differ and how the models are
formulated.

29 (36)
5 Conclusions
Fiber morphology alone cannot replace zero-span measurements. Additional measurements
must be used, preferably mechanical.
Light scattering coefficient is a possible compliment that can improve a linear model. Further
investigations are needed.
Many of the measured signals in L&W Fiber Tester Plus develop over clearly defined patterns.
The equations found are different for the two chemical pulps.
The linear regression model is the only model that exclusively uses fiber morphological factors
in order to calculate the tensile index. Confirmation of the model is still required in order to
determine the models validity.
Both Shear-Lag and Page Tensile equation uses zero-span and other parameters that cannot be
measured online. Therefore, they are not considered to be applicable with L&W Pulp Tester.
Shear-Lag is the only model that can produce one formula that could be applied to both pulps.
30 (36)
References
Axelsson, A. (2009). Fibre based models for predicting tensile strength of paper. Skellefteå: Luleå Universitet.
Bhardwaj, N. K., Kumar, S., & Bajpai, P. K. (2004). Effects of processing on zeta potential and cationic demand of kraft pulp. Colloids and Surfaces A: Physicochemical and Engineering Aspects, 121-125.
Biermann, C. J. (1996). Handbook of Pulping and Papermaking. Oregon: Academic press. C., S. P., & Doschi, M. R. (1986). Mathematical Models of Canadian Standard Freeness (CSF) and
Schopper-Riegler Freeness (SR). Wisconsin: The Instisute of Paper Chemistry. Dinwoodie, J. (1989). Wood: Nature's Cellular, Polymeric Fibre-Composite. The Institute of Metals. Eriksson, H. (2005). Measuring water retention value of paper pulp with L&W STFI Fibermaster.
Stockholm: KTH. Fredlund, M., Grundström, K.-J., & Vollmer, H. (1997). Prediktering av pappersegenskaper från
fiberegenskaper. Stockholm: STFI. Gurnagul, N., Page, D. H., & Paice, M. G. (1992). The effect of cellulose degradation on the strength of
wood pulp fibers. Nordic Pulp and Paper Research Journal, 152-154. Ilvessalo-Pfäffli, M.-S. (1995). Fiber Atlas. Berlin: Springer Series. Kollmann, F. F., & l Côté, W. A. (1968). Principles of wood science and technology. Berlin: Springer-
Verlag. Lai, R., & Mohlin, U.-B. (1998). Effects of fibre width and coarseness on FEX sheet properties.
Stockholm: STFI. Laine, J., Lövgren, L., Stenius, P., & Sjöberg, S. (1994). Potentiometric titration of unbleached kraft
cellulose fibre surfaces . Colloids and Surfaces A: Physiological and Engineering Aspects, 277-287.
Letho, J. H. (2004). Characterization of Mechanical and Chemical Pulp Fibers. 58th Appita annual conference and exhibition (p. 8). Canberra: Appita.
Miller, J. N., & Miller, J. C. (2010). Statistics and Chemometrics for Analytical Chemitry 6th Edition. Essex: Pearson Education Limited.
Mohlin, U.-B., Jansson, U., & Miller, J. (1991). Laboratoriemalning kontra industriell malning av kemisk masssa- Inverkan på fiberegenskaper, främst fiberform. Stockholm: STFI.
Olofsson, K. (1997). Mätmetod för fibrers fibrilleringsgrad. Stockholm: STFI. Paavilainen, L. (1994). Bonding potential of softwood sulphate pulp fibers. Paperi ja Puu- Paper and
Timber, 162-173. Page, D. (1969). A theory for tensile strength of paper. Tappi, 674-681. SCAN. (2000). SCAN-C 62:00 Water Rentention Value. Retrieved from Scandinavian Pulp, Paper and
Board: http://www.pfi.no/Documents/Scan_test_methods/C_CM_M/C_62-00.pdf Sjöström, E. (1993). Wood Chemistry, Fundamentals and Appllications. Orlando, USA: Academic
Press Inc. Stenström, S. (2011). Drying of Paper. In M. Ek, G. Gellerstedt, & G. Henriksson, The Ljungberg
Textbook- Paper Processes. Stockholm: KTH. Södra. (2015, 04 01). Södra Cell Värö – Pulp mill under constant development. Retrieved from Södra:
http://www.sodra.com/PageFiles/10517/sodrac_varo_en.pdf Teleman, A. (2011). Hemicelluloses and Pectins. In M. Ek, G. Gellerstedt, G. Henriksson, & m.fl,
Biofibre Chemistry (pp. 87-107). Stockholm: KTH. Thuvander, F., Gamstedt, E., & Ahlgren, P. (2001). Distribution of strain to failure of singe wood ulp
fibers. Nordic Pulp and Paper Research Journal Vol 16, 46-56.

MASTER THESIS IN MACROMOLECULAR MATERIALS
STOCKHOLM, SWEDEN, 2015
31 (36)
Appendix 1. L&W Fiber Tester Plus data
Table A1.
Prov Z-span index Coarseness, mg/m
Fines Primary %
Secondary %
Fibril Perimeter
SR Freeness ZD-styrka
Length Shape Fiber width (µm)
Thickness
SW-0 132,2958333 216,8 17,98 9,44 8,54 2,14 13,4 757 201,3 2,2438 83,62 29,7 4
SW-25 138,0125 178,72 19,64 9,42 10,22 3,58 13,75 742 363,93 2,247 83,94 30,56 4
SW-50 137,3541667 145,12 20,92 9,4 11,56 5,68 15,15 729 432,09 2,263 83,7 30,92 4
SW-100 146,3875 162,58 24,14 9,64 14,5 9,86 18,7 676 690,5 2,2542 83,68 31,62 4
SW-150 141,0708333 155 28,96 10,26 18,66 14,44 23,95 580,5 698 2,2198 82,92 32,12 4
SW-200 136,4875 134,4 33,22 11,04 22,2 18,76 36,1 450 840,7 2,149 82,3 32,4 4
Euc-0 119,1666667 71,72 17,22 7,96 9,26 1,8 16 591,85 330,8 0,8214 88,68 18,38 2,8
Euc-25 118,8333333 76,3 19,14 8,94 10,18 2,5 17,4 540,05 526,2763 0,7908 89,54 18,58 2,8
Euc-50 112,4166667 65,58 20,66 9,8 10,86 3,32 20,5 492,2 696,1 0,767 89,72 18,8 2,8
Euc-75 111,7916667 78,675 22,22 10,58 11,64 4,02 23,2 443,5 809,1 0,7348 90,06 19,04 2,8
Euc-100 109,5833333 71,4 24,06 11,42 12,64 4,74 27,3 393,2 947,6 0,7134 90,08 19,24 2,8
Euc-150 109,5833333 66,24 27,72 13,16 14,56 6,42 36,6 293,4 1068 0,6666 89,94 19,74 2,8

32 (36)
Table A1. continued
Prov Total cross area µm^2
Area fiber wall crossec, µm^2
Density g/m^3
Slenderness λ
1-Shape, S
Z-factor RBA Shear-lag Page tensile Tensile index
SW-0 692,791866 322,9557248 671299448,7 302,1953 16,38 2,145161 0,123306 31,6103 0,129533 34,16666667
SW-25 733,4940262 333,7628035 535470094,7 294,1099 16,06 2,197651 0,426138 46,41223 0,949058 56,16666667
SW-50 750,8770867 338,2866969 428985240,4 292,7555 16,3 2,219647 - 59,14874 - 68,5
SW-100 785,2602475 347,0831564 468418005,9 285,1613 16,32 2,262456 0,57779 78,64489 4,145601 80,5
SW-150 810,2908869 353,3663417 438638267,8 276,4384 17,08 2,293062 0,611067 84,13088 6,391266 96,33333333
SW-200 824,479576 356,8849254 376591978 265,3086 17,7 2,310211 0,602917 105,1258 8,849774 110,3333333
Euc-0 265,3266633 137,0488379 523317096,9 178,7595 11,32 1,936001 0,987882 31,84501 0,870078 26,66666667
Euc-25 271,1323265 138,8081298 549679619,7 170,2476 10,46 1,953289 0,992692 38,11112 1,095839 36,5
Euc-50 277,5911269 140,7433509 465954516,4 163,1915 10,28 1,972321 0,994088 47,19168 1,555712 42,33333333
Euc-75 284,7237988 142,8545011 550735184,2 154,3697 9,94 1,993103 0,989351 45,58625 1,488777 45,83333333
Euc-100 290,7368072 144,613793 493728838,1 148,316 9,92 2,010436 0,991334 52,54747 1,844545 56,16666667
Euc-150 306,0442174 149,0120227 444527889,6 135,076 10,06 2,053822 0,992068 58,44086 2,518127 61

33 (36)
Appendix 2. Graphs with correlated signals.
y = -0,0006x2 + 0,1267x + 79,281R² = 0,8313y = 0,0003x2 - 0,0958x + 72,118
R² = 0,9148
0
20
40
60
80
100
0 50 100 150 200 250
Zer
o-s
pa
n
Refining Energy kWh/t
Zero-span over refining energy
Softwood Eucalyptus
Poly. (Softwood) Poly. (Eucalyptus)
y = -0,0071x2 - 0,0907x + 753,22R² = 0,9993
y = -1,9824x + 591,19R² = 0,9999
0
200
400
600
800
0 50 100 150 200 250
Fre
enes
s m
l
Energy kWh/t
Development of Freeness
Softwood Eukalyptus
Poly. (Softwood) Linear (Eukalyptus)
y = 0,0006x2 - 0,0202x + 13,841R² = 0,9921
y = 0,0005x2 + 0,0619x + 15,861R² = 0,9991
05
10152025303540
0 50 100 150 200 250
SR
Energy kWh/t
Development of Schopper-Riegler
Softwood Eukalyptus
Poly. (Softwood) Poly. (Eukalyptus)
y = -6E-06x2 + 0,0007x + 2,2393R² = 0,9906
y = -0,001x + 0,8178R² = 0,9961
0
0,5
1
1,5
2
2,5
0 50 100 150 200 250
Fib
er l
eng
th,
mm
Energy kWh/t
Development of fiber length
Softwood Eucalyptus
Poly. (Softwood) Linear (Eucalyptus)

34 (36)
y = 0,0091x + 18,359R² = 0,9986
y = -6E-05x2 + 0,0244x + 29,823R² = 0,9905
0
5
10
15
20
25
30
35
0 50 100 150 200 250
Fib
er w
idth
µm
Energy kWh/t
Fiber width development
Eucalyptus Softwood
Linear (Eucalyptus) Poly. (Softwood)
y = 0,0763x + 17,471R² = 0,9907
y = 0,0691x + 17,232R² = 0,9987
0
5
10
15
20
25
30
35
0 50 100 150 200 250
Fin
es %
Energy (kWh/t)
Development of fines
Softwood Eucalyptus
Linear (Softwood) Linear (Eucalyptus)
y = 6E-05x2 - 0,0035x + 9,4464R² = 0,9982
y = 0,0342x + 8,0289R² = 0,9993
0
2
4
6
8
10
12
14
0 50 100 150 200 250
Pri
ma
ry f
ines
%
Energy kWh/t
Development of primary fines
Softwood Eucalyptus
Poly. (Softwood) Linear (Eucalyptus)
y = 0,0682x + 8,3101R² = 0,9957
y = 0,0349x + 9,1957R² = 0,996
0
5
10
15
20
25
0 50 100 150 200 250
Sec
on
da
ry f
ines
%
Energy kWh/t
Development of secondary fines
Softwood Eucalyptus
Linear (Softwood) Linear (Eucalyptus)

35 (36)
y = -6E-05x2 + 0,0047x + 83,705R² = 0,9624
y = -0,0001x2 + 0,0262x + 88,778R² = 0,9614
80
82
84
86
88
90
92
0 50 100 150 200 250
Sh
ap
e %
Energy kWh/t
Development of shape factor
Softwood Eucalyptus
Poly. (Softwood) Poly. (Eucalyptus)
y = 0,0846x + 1,6721R² = 0,998
y = 0,0307x + 1,7566R² = 0,9989
0
5
10
15
20
0 50 100 150 200 250
Fib
rill
Per
imet
er,
%
Energy kWh/t
Refinig vs. Fibril perimeter
Softwood Eucalyptus
Linear (Softwood) Linear (Eucalyptus)
y = -4,2646x + 520,09R² = 0,1715
y = 0,7334x + 21,679R² = 0,1346
50
70
90
110
130
150
170
190
210
230
65 70 75 80 85 90
Zero-span vs Coarseness
Softwood Eucalyptus
Linear (Softwood) Linear (Eucalyptus)
y = 63,115x0,3435
R² = 0,0369
y = 77,725x0,454
R² = 0,802560
65
70
75
80
85
90
0,5 1 1,5 2 2,5
Length vs. Zero-span
Softwood Eucalyptus
Power (Softwood) Power (Eucalyptus)

36 (36)
y = -0,0006x2 + 0,1267x + 79,281R² = 0,8313
y = 0,0003x2 - 0,0958x + 72,118R² = 0,9148
0
20
40
60
80
100
0 50 100 150 200 250
Zer
o-s
pa
n
Refining Energy kWh/t
Zero-span over refining energy
Softwood Eucalyptus
Poly. (Softwood) Poly. (Eucalyptus)