prediction of seizure spread network via sparse
TRANSCRIPT

Prediction of Seizure Spread Network via SparseRepresentations of Overcomplete Dictionaries
Feng Liu1, Wei Xiang2, Shouyi Wang1, and Bradley Lega3
1 Department of Industrial, Manufacturing & Systems Engineering,2 Department of Computer Science and Engineering,
University of Texas at Arlington,Arlington, TX 76019, USA
[email protected], [email protected], [email protected],3 Neurological Surgery, University of Texas Southwestern,
Dallas, TX 75253, [email protected]
Abstract. Epilepsy is one of the most common brain disorders and affect peo-ple of all ages. Resective surgery is currently the most effective overall treatmentfor patients whose seizures cannot be controlled by medications. Seizure spreadnetwork with secondary epileptogenesis are thought to be responsible for a sub-stantial portion of surgical failures. However, there is still considerable risk ofsurgical failures for lacking of priori knowledge. Cortico-cortical evoked poten-tials (CCEP) offer the possibility of understanding connectivity within seizurespread networks to know how seizure evolves in the brain as it measures directlythe intracranial electric signals. This study is one of the first works to investigateeffective seizure spread network modeling using CCEP signals. The previous un-supervised brain network connectivity problem was converted into a classicalsupervised sparse representation problem for the first time. In particular, wedeveloped an effective network modeling framework using sparse representationof over-determined features extracted from extensively designed experiments topredict real seizure spread network for each individual patient. The experimen-tal results on five patients achieved prediction accuracy of about 70%, whichindicates that it is possible to predict seizure spread network from stimulatedCCEP networks. The developed CCEP signal analysis and network modelingapproaches are promising to understand network mechanisms of epileptogenesisand have a potential to render clinicians better epilepsy surgical decisions in thefuture.
Keywords: Brain connectivity, Sparse representation, Feature selection, CCEP,Seizure spread network
1 Introduction
The human brain is among the most complex systems known to mankind [2]. Therehas been a great deal of neurophysiological researching attempting to understand brainfunctions and networks through detailed analysis of neuronal excitability and synaptictransmission [9][10]. Though the advances in brain imaging techniques have enabledmany studies to investigate brain functional connectivity with widely variable spatialand temporal resolution using different neurophysiology and neuroimaging modalitiesincluding electroencephalography (EEG), magnetoencephalography (MEG), functionalnear-infrared spectroscopy (fNIRS), and functional MRI (fMRI) approaches [16][20].However, most of current work on brain functional connectivity analyzes at a rela-tively coarse level of connectivity of the intrinsic dynamic brain network. The results

2 Feng Liu, Wei Xiang, Shouyi Wang, and Bradley Lega
are often at odds with the longstanding neuroscientific theory[7]. In this paper, weemploy cortico-cortical evoked potentials (CCEPs) which directly measure the localneural activity inside brain to map effective brain connectivity via stimulation. Themajor advantage of mapping brain connectivity via stimulation is the ability to as-sess directed dynamical spread networks and discover functional cortical connectionsin vivo, which is not possible using MRI-based tract tracing nor with the fMRI-basedcovariance methods [6].
To understand pathology of epilepsy, more researchers are focusing on abnormalbrain network connectivity. Historically speaking, there are two opposing perspectiveto view brain functionality: integration and segregation. The former views differentareas of cortex collaborate together to perform certain tasks, such as attention, memoryprocessing, etc. However the latter perspective think the ”segregated” area of cortexis responsible for certain functionality of the brain, such as language, emotion etc.A good discussion of integration and segregation can be found in the Nature Reviewpaper[3]. The advantage of the former one is to investigate brain in a more systematicview by searching distinction of functional and effective connectivity among patientsand controls. Moreover, the emerging interdisciplinary area of complex network theorycan offer a systematic measurement of network characteristics with great capabilityto model networks in nature and man-made complex systems[26][1][19][8]. Recently,an increasing number of theoretical and empirical studies approach the function ofthe human brain from a network perspective, i.e., the integration paradigm. The aimof human connectomics is to uncover the underlying dynamics associated with theirconnectivity. Disturbed interaction among brain areas is associated with brain andmental disorder [21][22]. Many researchers have verified that a large amount of braindiseases arise from dysfunction of brain network [28][30] [24]. CCEP offers the possibilityof understanding effective connectivity within seizure networks to improve diagnosisand identify resection candidates for seizure surgery to a finer spatial resolution. In ourpaper, CCEP signals are used to construct connectivity of epilepsy patients in orderto predict the ictal onset spreading network. The rest of paper is organized as follows:data description and preprocessing is presented in Section 2; The presented supervisedsparse feature selection formulation is given in Section 3. The experimental result ofspread network prediction is given in Section 4; Section 5 concludes this paper andfuture research is also described.
2 Data Processing and Visualization
2.1 Data Acquisition
Patients were drawn from the surgical epilepsy program at University of Texas South-western Medical Center (UTSW), the preeminent surgical epilepsy program in a metropoli-tan area of 7 million people. We have also analyzed subset of our existing databaseof intracranial electrode implantations [15] (as described in Table. 1) that have bothstructural MRI and CCEP mapping. Prior to electrode implantation, patients undergoresting-state fMRI as well as detailed structural MRI including diffusion-tensor imaging(DTI).
2.2 Stimulation Polarity
Stimulations (conducted using the Grass S88 stimulator (Warwick, RI, USA) [15]) showswitched polarity pattern due to the bipolar stimulation was applied between adjacentelectrodes by switching anode and cathode electrodes. The reason we prefer bipolarstimulation as opposed to unipolar stimulation where the stimulation is performed

Effective Connectivity Modeling for CCEP 3
SubjectID
Sex AgeDuration(years)
Totalseizures
Earlyspread
Latespread
Seizureanalyzed
Onsetpattern
Onsetsite
Earlysite
Latesite
1 M 59 8 4 0.2 30 4 4 R entorhinal MTG Insula2 F 38 8 7 2 13 5 4 R amygdala Para hippocampu STG3 M 30 21 3 0.3 12 3 1 L precuneus Fusiform Lingula4 F 63 54 14 0.3 9 5 4 L angular g. MTG Fusiform5 F 42 15 5 0.6 10 5 4 R planum polare STG Supramarginal
Table 1: Information of 5 patients studied in this paper, who undergo the surgicalepilepsy program at UTSW.
between an area of interest and a distant site, is that bipolar stimulation allows formore localized current flow in the cortex beneath electrodes, thereby minimizing thespatial spread of stimulation and increasing its spatial resolution [12][18]. In this paper,we show that stimulation responses categorized based on polarity of stimulus are relatedto the CCEPs measured and thereof we suggest to divide signals into groups based onpolarity of stimulus and then choose those from positive and negative group separatelyfor further analysis, as explained later.
In most studies [11] CCEPs at each site were averaged before any task of datamining to be done, however, in this paper we separate them out and term the responsesresulted from stimulus showing positive polarity as the Positive Group, and that fromstimulus of negative polarity as the Negative Group. For comparison, we also averageall CCEPs despite of its source and name it as the Mixed Group. In this paper, we referto the averaged response from three different groups using positive/negative/mixingaveraged response. Fig. 1 illustrates two examples of the comparison between responsesfrom three groups.
It is worth noting that in Fig. 1(a), the positive and negative averaged responsedemonstrate a semi -symmetrical structure where the momentum on the first 80msis affected by a dynamic force. We believe such dynamics were caused by neuronalactivities of those attempting to recover to its normal state. Besides, some averagedresponses like Fig. 1(b) can be treated as irregular ones since positive and negativeaveraged responses do not follow a similar trend (i.e. increase/decrease at differentphases).
With both groups, it is not wise to average signals over all trials (i.e., analyzing onthe black dotted signals shown in Fig. 1). The underlying tissue (which may be moresensitive to one polarity) will show averaged response in one group that have larger am-plitude at all phases comparing to the other’s. If we compare mixing averaged responsewith either positive or negative one, most likely we will see some prominent featuresweakened due to a distinguishable profile of the averaged response signal, including 1)semi-symmetry and 2) sensitivity to different polarity of stimulus. Therefore, we needto extract signals whose averaged response is stronger with respect to the polarity ofits source of stimulus.
2.3 Data Preprocessing
In this paper, to simplify further data analysis using averaged signals, we extract andonly work with the positive group (exemplified by Fig. 3). To remove post-stimulationartifacts which occur nondeterminately at various times between 85ms to 95ms, peakand valley detection algorithm is applied following which we retrieve signals from +1mstill +900ms (for some sites, there exist strong response immediately after the timingof post-stimulation artifact). After that, Savitzky-Golay filter is applied to smooth allsignals without greatly distorting the signals. Many of stimulus signals jitter with sine

4 Feng Liu, Wei Xiang, Shouyi Wang, and Bradley Lega
200 400 600 800
Time (ms)
-600
-400
-200
0
200
400
Response
sub 1, amp 8, stim 1, ch 75, trials 79
Positive: Averaged Response
Negative: Averaged Response
Mixed: Averaged Response
(a) A typical semi-symmetrical example
200 400 600 800
Time (ms)
50
100
150
200
250
300
Response
sub 1, amp 8, stim 2, ch 30, trials 79
Positive: Averaged Response
Negative: Averaged Response
Mixed: Averaged Response
(b) An irregular example
Fig. 1: Comparison of positive, negative and mixing averaged signals categorized ac-cording to the polarity of stimulus signals. Most paper studied on signals drawn withthe black dotted line while in this paper, we think polarity factor should be taken intoaccount when doing further data analysis.
waves whose frequency is found fixed at 49Hz. To alleviate this problem, we apply aspecific designed band-pass filter to attenuate artifact-induced frequency at 49Hz, aswell as those frequencies from 1 to 3Hz and outside 100Hz. Besides, by analyzing pat-terns of the stimulus signals, we find it necessary to remove outlier trials as they giverise to much stronger and longer CCEPs. To this end, all trials were further taken careof statistically using the approach of trimmed mean, i.e. for all trials stimulated on thesame pair of sites, we remove those generated from stimulus signals whose trimmedmeans are two standard deviations away from mean of the distribution of trimmedmeans over all stimulus signals at the two stimulation sites (with 25 percent of theends discarded). This guarantees all trials are generated from similar stimulations. Af-terwards. trimmed mean approach is also used for every channel in order to get ridof outlier trials. Take for example subject 1: during four stimulations with amplitude8mA on CP1-CP2, UP2-UP3, UP5-UP6 and UP7-UP8 respectively, there are 80 trialsamong all the 140 channels. Trimmed mean approach based on stimulus signals helpsget rid of 10, 13, 9, 10 trials for each of the four stimulations respectively, while thetrimmed mean approach based on channels removes 2 trials per channel. The signalresponses over all trials on one channel can be visualized using event-related potential(ERP) plot [4], by which the visualization of expected stimulation along trials shouldhave a clear curve belonging to similar colormap (shown in Fig. 2). Finally, we convertsignals to Z-scores so that for most signals their strengths are fixed from -5 to +5 as inFig. 3.
3 Supervised Sparse Feature Selection
3.1 Experimental Design of features
When it comes to modeling the brain connectivity based on the measurement of howsimilar two channels’ time series signals are, there are many options to be chosen. Themost popular ones can be categorized as linear and nonlinear measurements [14][23],linear ones include cross correlation, coherence,and nonlinear measurements includemutual information, transfer entropy, Granger causality, phase synchronization, etc.

Effective Connectivity Modeling for CCEP 5
-2185
-1092
0
1092
2185 ERP PLOT: pos, sub 1, amp 8, stim 1, ch 2, trials 40
10
20
30
40
Tria
ls
100 200 300 400 500 600 700 800 900
Frames
-448
0
448
896
1344
ER
P
Fig. 2: An example of ERP plot, where the signal responses can be visualized clearlywith similar colormap along trials.
Fig. 3: Normalized Z-scores from positive averaged responses on 140 channels for patient1. The signals were averaged over 36 repetitive 8mA stimulations on channel UP3 andUP4. Magenta colored regions indicate stimulus sites, cyan indicates seizure onset zone,and red and green indicate EARLY and LATE ictal spread respectively[15]. For e.g.,UP5, UP6 are both stimulus site and seizure onset zone.
Different measurement will usually result in different networks, combined with thelack of ground truth information, it’s hard to determine which one is more reasonableand accurate. However our case is different since we have a supervised label that wasgenerated from the spread network, which makes it possible to compare prediction accu-

6 Feng Liu, Wei Xiang, Shouyi Wang, and Bradley Lega
racy from different methodologies. The other choices come from the data preprocessingstep and an appropriate frequency band need to be selected, the band pass filter levelincludes . Moreover, according to our analysis, we want to explore the effected net-work from both positive stimulus and negative stimulus, we also want make a contrastwithout considering the positive and negative stimulus. Another experimental designconsideration includes the epoch signal length after the stimulus, we assume that afterthe stimulus, there is a transient period and it’s hard to measure that exact lengthsince every channel exhibits different temporal behavior. We picked 0.3s, 0.5s, 0.7s and0.8s as different levels of the time series length. Other options is that we have differentstimulus amplitude, which are 2 mA, 4 mA, 6 mA and 8 mA. All those different typeof choices are different factors in the perspective of experimental design, they all havedifferent levels. Another antagonistic choices comes when aggregating across differenttrials under the same conditions, as the impulsive stimulus signals were applied to thesame channel about 40 times under the condition of the same stimulus amplitude, thesame stimulus sites for the same person. One way of aggregation is to calculate theaveraged epoch time series first and then calculate the adjacency matrix using differentsimilarity measurement. The advantage of average first is to eliminate white noise inthe channels, however the disadvantage is that more precise connectivity informationat different time period might be lost. The opposing paradigm is to calculate the neuralsynchrony similarity measurement first and then aggregate on the adjacency matrix,we try to use both ways to predict the spread network. We call those two options trialaggregation design.
To sum up, we did a comprehensive full factorial design of experiment with 6 fac-tors, including (1) similarity measurements, (2) positive, negative vs overall stimulus,(3) stimulus amplitude, (4) epoch signal length following stimulus, (5) frequency band-pass design, (6) trial aggregation design. The frequency band-pass have 6 levels, whichare 4-100 Hz, 4-8 Hz, 8-13 Hz, 13-25 Hz, 25-40 Hz, 30-100 Hz; the neural time seriessimilarity measurements used in our research include cross correlation, coherence, mu-tual information, transfer entropy, phase synchronization and dynamic time warping.In table 2, a summary of level counts for each factor is given.
factor number of levels
similarity measurements 6
positive, negative vs overall stimulus 3
stimulus magnitude 4
epoch signal length 4
band pass frequency 6
trial aggregation design 2
Table 2: Number of levels of different factors. The number of features here in ourexploration is the number of full factorial of all the six factors in our design, which is3456 features.
3.2 Sparse Feature Selection
In order to select the most useful features, we used a sparse feature selection methodprocedure regularized with L1 norm. The idea behind of the sparse representation is thatwe want to represent connection vector y as a linear combination of the fewest featuresfrom the overcomplete dictionary [27], which becomes a powerful tool for biomedicaldata [29]. Here we use a sparse feature selection model which allows certain degree ofnoise, and the goal function is given below:
J1(x;λ) = ‖y −Ax‖22 + λ‖x‖1 (1)

Effective Connectivity Modeling for CCEP 7
where A ∈ Rn×k is the overcomplete dictionary with each column being the predictionresults using our factorial experimental design of 6 factors, n is the number of nodes andk is the number of features, y ∈ Rn is the supervised connection vector. The first partof Eq.(1) is to measure the sparse representation error and the second term is trying tomake the selected features to be sparse compared to the over-complete dictionary. Byminimizing the goal function, we will get the selected ensemble of prediction method-ologies. Unlike the traditional ensemble method [25], our learned vector x signifies thesupervised weighted version of an ensemble of weak classifiers. As a result, our problembecomes a classic `1-penalized least-squares problem. There are plenty of algorithms tosolve it available [17] [27] [5], here in our research, we use Homotopy algorithm proposedin [5]. For more detailed description of Homotopy algorithm, please refer to Donoho andTsaig’s paper [5].
4 Network Connectivity Modeling and Prediction
4.1 Spread Network Construction and Prediction
Like our previous work [15], in this paper we refined CCEP paradigm to analyze theseizure spread from ictal onset zones to EARLY and LATE sites of seizure propagation,defined as spread from onset site before or after 3s.
By better understanding the epilepsy ictal onset spread network, we can resectpathological path and reduce the potential destruction of functionality in other corticalregion. Promising clinical results from [13] show that 42% of patient are seizure freeafter resective epilepsy surgery based on seizure ictal onset spreading network.
In every similarity measurement, it’s nontrivial to select the threshold to get theconnected network with appropriate density. Take the calculation of cross correlationfor each trial as an example, we observed a time variant adjacency matrix. If the samethreshold is used, sometime, a very densely connected network is generated, for an-other stimulus trial, a very sparsely connected network is generated. Furthermore, weobserved that if we average time series from all epoch trials first and then compute thecross correlation, the resulting correlation coefficients are much higher than directlycalculating correlation for each trial. To solve that problem, a dynamically adjustedthreshold is used in the paper. The dynamically adjusted threshold is based on the pri-ori knowledge of average degree on brain network, which has been extensively studiesin the literature.
The predesignated percentage is calculated based on the following equation:
p =k
(N − 1)∗ 100% (2)
Using p to get the percentile in the correlation matrix, we can generate a networkwith the average degree to be k.
4.2 Experimental Result
Based on the framework mentioned, We conducted the sparse feature selection of thefirst two patients’ seizure onset spreading network, and test the learned features onthe next three patients and achieved 72.3% accuracy. Since we have 6 factors, it’simpossible to give a comprehensive accuracy result. We illustrate 2 factors, namely,the similarity measurements and band pass frequency design in the following table.The training accuracy is 80.5% and the testing accuracy is 72.3%. Generally speaking,the correlation and mutual information measurement perform better than the other 4measurements.
8 Feng Liu, Wei Xiang, Shouyi Wang, and Bradley Lega
Training Testing
Corr Cohe MI TE PS DTW Corr Cohe MI TE PS DTW
4-100Hz 72.3% 69.3% 74.3% 73.5% 68.8% 62.3% 71.3% 68.6% 74.6% 72.7% 68.4% 60.8%
4-8Hz 68.7% 66.1% 67.4% 70.2% 69.2% 59.3% 66.6% 67.5% 68.2% 68.8% 70.0% 61.2%
8-13Hz 65.2% 54.0% 68.3% 64.2% 67.3% 61.8% 65.9% 63.0% 68.1% 63.4% 64.7% 62.1%
13-25Hz 71.4% 67.4% 69.7% 69.0% 66.2% 63.0% 69.9% 66.6% 68.8% 70.2% 65.9% 63.4%
25-40Hz 70.5% 69.3% 70.2% 71.1% 65.4% 65.9% 71.4% 67.9% 70.3% 72.1% 65.2% 72.0%
30-100Hz 71.8% 72.5% 73.9% 68.5% 71.7% 64.8% 71.1% 71.5% 74.5% 68.3% 71.9% 63.9%
Sparse 80.5% 72.3%
Table 3: Accuracy Summary. Abbreviations– Corr: Correlation, Cohe: coherence, MI:mutual information, TE: transfer entropy, PS: phase synchronization, DTW: dynamictime warping.
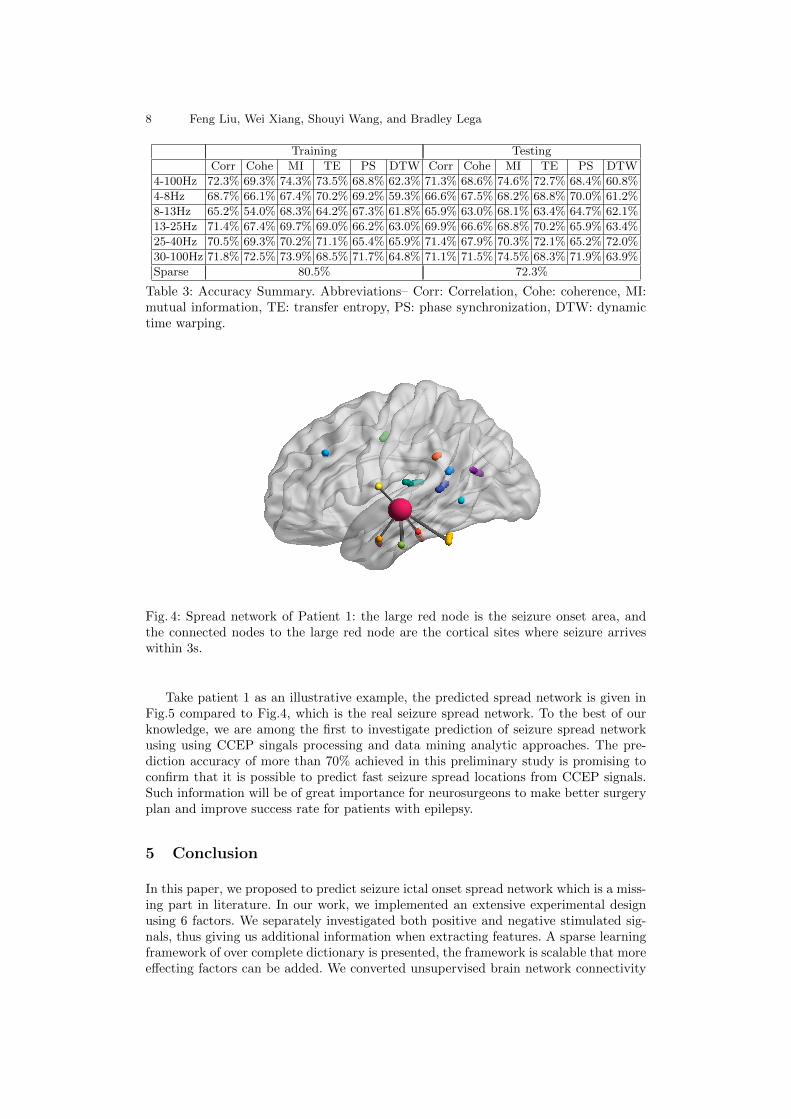
Fig. 4: Spread network of Patient 1: the large red node is the seizure onset area, andthe connected nodes to the large red node are the cortical sites where seizure arriveswithin 3s.
Take patient 1 as an illustrative example, the predicted spread network is given inFig.5 compared to Fig.4, which is the real seizure spread network. To the best of ourknowledge, we are among the first to investigate prediction of seizure spread networkusing using CCEP singals processing and data mining analytic approaches. The pre-diction accuracy of more than 70% achieved in this preliminary study is promising toconfirm that it is possible to predict fast seizure spread locations from CCEP signals.Such information will be of great importance for neurosurgeons to make better surgeryplan and improve success rate for patients with epilepsy.
5 Conclusion
In this paper, we proposed to predict seizure ictal onset spread network which is a miss-ing part in literature. In our work, we implemented an extensive experimental designusing 6 factors. We separately investigated both positive and negative stimulated sig-nals, thus giving us additional information when extracting features. A sparse learningframework of over complete dictionary is presented, the framework is scalable that moreeffecting factors can be added. We converted unsupervised brain network connectivity

Effective Connectivity Modeling for CCEP 9
Fig. 5: Predicted Spread network of Patient 1: the large red node is the seizure onsetarea, and the connected nodes to the large red node are the predicted cortical sites thatshould receive seizure attack from the origin sites.
problem into a classical supervised sparse representation problem, which there exist aplenty of algorithms to solve. The proposed framework achieved satisfactory result.
Through CCEP mapping, we can develop new network generation scheme and scal-able efficient algorithms for directed brain connectivity analysis. The scope of this studyis planned as a step forward to understand neural circuits of epilepsy and provide a newcomputational framework to understand seizure focus, initiating seizure circuits, pathsof spread, neuromodulatory centers, and to develop a system’s view of epilepsy. It willestablish valuable knowledge of seizure-spread networks and their relationship withsome critical factors in presurgery assessment. The brain network analysis methods canalso be generalized to analyze other brain disorders or cognitive functions of the brainwith immediate clinical implications. In our future research, the sensitivity and speci-ficity error rate will also taking into account in the goal function formulation instead ofthe overall accuracy as we studied here.
References
1. Barabasi, A.L., Albert, R.: Emergence of scaling in random networks. science 286(5439),509–512 (1999)
2. Bullmore, E., Sporns, O.: Complex brain networks: graph theoretical analysis of structuraland functional systems. Nature Reviews Neuroscience 10(3), 186–198 (2009)
3. Deco, G., Tononi, G., Boly, M., Kringelbach, M.L.: Rethinking segregation and integra-tion: contributions of whole-brain modelling. Nature Reviews Neuroscience 16(7), 430–439(2015)
4. Delorme, A., Makeig, S.: Eeglab: an open source toolbox for analysis of single-trial eegdynamics including independent component analysis. Journal of Neuroscience Methods134(1), 9 – 21 (2004)
5. Donoho, D.L., Tsaig, Y.: Fast solution of-norm minimization problems when the solutionmay be sparse. Information Theory, IEEE Transactions on 54(11), 4789–4812 (2008)
6. Enatsu, R., Piao, Z., OConnor, T., Horning, K., Mosher, J., Burgess, R., Bingaman, W.,Nair, D.: Cortical excitability varies upon ictal onset patterns in neocortical epilepsy: acortico-cortical evoked potential study. Clinical Neurophysiology 123(2), 252–260 (2012)
7. Friston, K.J.: Functional and effective connectivity: a review. Brain connectivity 1(1),13–36 (2011)

10 Feng Liu, Wei Xiang, Shouyi Wang, and Bradley Lega
8. Guan, Z.H., Liu, F., Li, J., Wang, Y.W.: Chaotification of complex networks with impulsivecontrol. Chaos: An Interdisciplinary Journal of Nonlinear Science 22(2), 023137 (2012)
9. Jefferys, J.G.: Basic mechanisms of epilepsy. Epilepsia (2009)10. Jefferys, J.G.: Advances in understanding basic mechanisms of epilepsy and seizures.
Seizure 19(10), 638 – 646 (2010)11. Keller, C.J., Honey, C.J., Entz, L., Bickel, S., Groppe, D.M., Toth, E., Ulbert, I., Lado,
F.A., Mehta, A.D.: Corticocortical evoked potentials reveal projectors and integrators inhuman brain networks. The Journal of Neuroscience 34(27), 9152–9163 (2014)
12. Keller, C.J., Honey, C.J., Megevand, P., Entz, L., Ulbert, I., Mehta, A.D.: Mapping humanbrain networks with cortico-cortical evoked potentials. Phil. Trans. R. Soc. B 369(1653),20130528 (2014)
13. Kim, D.W., Kim, H.K., Lee, S.K., Chu, K., Chung, C.K.: Extent of neocortical resectionand surgical outcome of epilepsy: intracranial eeg analysis. Epilepsia 51(6)
14. Kreuz, T.: Measures of neuronal signal synchrony 6(12), 11922 (2011), revision 15224915. Lega, B., Dionisio, S., Flanigan, P., Bingaman, W., Najm, I., Nair, D., Gonzalez-Martinez,
J.: Cortico-cortical evoked potentials for sites of early versus late seizure spread in stere-oelectroencephalography. Epilepsy research 115, 17–29 (2015)
16. Letzen, J.E., Craggs, J.G., Perlstein, W.M., Price, D.D., Robinson, M.E.: Functional con-nectivity of the default mode network and its association with pain networks in irritablebowel patients assessed via lidocaine treatment. The Journal of Pain 14(10), 1077–1087(2013)
17. Liu, J., Ji, S., Ye, J., et al.: Slep: Sparse learning with efficient projections. Arizona StateUniversity 6, 491 (2009)
18. Nathan, S.S., Sinha, S.R., Gordon, B., Lesser, R.P., Thakor, N.V.: Determination of currentdensity distributions generated by electrical stimulation of the human cerebral cortex.Electroencephalography and clinical neurophysiology 86(3), 183–192 (1993)
19. Newman, M.E.: The structure and function of complex networks. SIAM review 45(2),167–256 (2003)
20. Otti, A., Guendel, H., Henningsen, P., Zimmer, C., Noll-Hussong, M.: Functional net-work connectivity of pain-related resting state networks in somatoform pain disorder: anexploratory fmri study. Journal of psychiatry & neuroscience: JPN 38(1), 57 (2013)
21. Sporns, O.: Structure and function of complex brain networks. Dialogues Clin Neurosci15(3), 247–262 (2013)
22. Sporns, O., Tononi, G., Kotter, R.: The human connectome: a structural description ofthe human brain. PLoS Comput Biol 1(4), e42 (2005)
23. Uddin, L.Q., Clare Kelly, A., Biswal, B.B., Xavier Castellanos, F., Milham, M.P.: Func-tional connectivity of default mode network components: correlation, anticorrelation, andcausality. Human brain mapping 30(2), 625–637 (2009)
24. Vecchio, F., Miraglia, F., Curcio, G., Della Marca, G., Vollono, C., Mazzucchi, E., Bra-manti, P., Rossini, P.M.: Cortical connectivity in fronto-temporal focal epilepsy from eeganalysis: a study via graph theory. Clinical Neurophysiology 126(6), 1108–1116 (2015)
25. Wang, H., Fan, W., Yu, P.S., Han, J.: Mining concept-drifting data streams using ensem-ble classifiers. In: Proceedings of the ninth ACM SIGKDD international conference onKnowledge discovery and data mining. pp. 226–235. ACM (2003)
26. Watts, D.J., Strogatz, S.H.: Collective dynamics of small-worldnetworks. nature 393(6684),440–442 (1998)
27. Wright, S.J., Nowak, R.D., Figueiredo, M.A.: Sparse reconstruction by separable approx-imation. Signal Processing, IEEE Transactions on 57(7), 2479–2493 (2009)
28. Yaffe, R.B., Borger, P., Megevand, P., Groppe, D.M., Kramer, M.A., Chu, C.J., Santaniello,S., Meisel, C., Mehta, A.D., Sarma, S.V.: Physiology of functional and effective networksin epilepsy. Clinical Neurophysiology 126(2), 227–236 (2015)
29. Ye, J., Liu, J.: Sparse methods for biomedical data. ACM SIGKDD Explorations Newslet-ter 14(1), 4–15 (2012)
30. Zhou, J., Seeley, W.W.: Network dysfunction in alzheimers disease and frontotemporaldementia: implications for psychiatry. Biological psychiatry 75(7), 565–573 (2014)