prediction of removal rates in chemical–mechanical ... · material removal from the metal:...
TRANSCRIPT

Prediction of Removal Rates in Chemical–Mechanical Polishing(CMP) Using Tribocorrosion Modeling
J. Stojadinovic1• D. Bouvet2
• S. Mischler1
Received: 11 February 2016 / Revised: 15 March 2016 /Accepted: 17 March 2016 / Published online: 4 April 2016
� Springer International Publishing Switzerland 2016
Abstract The influence of electrochemical parameters,
open circuit potential, and passivation kinetics, on the
removal rates of tungsten in chemical–mechanical polish-
ing (CMP) was investigated in the presented study.
Removal rates were measured on a CMP machine, while
electrochemical test were performed separately, both using
technical CMP slurries. Electrochemical parameters are
shown to have a strong influence on tungsten removal rate
in CMP. Tungsten removal rate increases with the open
circuit potential (electrode potential) and with passivation
charge density. A model of Kaufman mechanism previ-
ously developed for sliding tribocorrosion of tungsten was
adapted to the CMP conditions. This model describes
removal rate in terms of both mechanical and electro-
chemical parameters and was found to effectively
rationalize experimental results obtained in different CMP
solutions according to their electrochemical properties.
Keywords Chemical–mechanical polishing � Removal
rate � Tribocorrosion modeling � Open circuit potential �Passivation charge density
1 Introduction
Chemical–mechanical polishing is widely used in the
production of integrated circuits in order to achieve planar
surfaces and remove excess deposited material. The main
elements of a CMP system are the wafer with the deposited
material to be polished, the pad, and the slurry. The metal
to be polished reacts with the oxidants from the slurry by
forming a passive film. During polishing, this passive film
is abraded by nanoparticles suspended in the slurry and
entrained in the contact between the pad and the wafer. The
depassivated areas undergo dissolution until the passive
film forms again. The cyclic depassivation–repassivation
process leads to preferential material removal from the
highest loaded asperities and thus to polishing. This phe-
nomenon is known as Kaufmann’s mechanism and can be
classified as a tribocorrosion process [1–4] involving
complex interactions between wear and corrosion.
Preston proposed the empirical Eq. (1) for the calcula-
tion of the removal rate RR [5] as a function of pressure
between wafer and pad, P, and the linear velocity of the
wafer relative to the polishing pad, V. The removal rate is
defined as the average thickness change during polishing
divided by polishing time:
RR ¼ KpPV ; ð1Þ
where Kp is the Preston coefficient, varying with process
variables such as pad properties, particles size, and slurry
composition [6]. Several attempts were proposed to refine
Preston equation according to practical experience. Tseng
et al. [7] introduced exponents of 5/6 and 0.5 for the
pressure and the velocity, respectively. Mpagazehe et al.
[8] modeled the fluid dynamics of the slurry and thereof
developed hydrodynamic pressure, which is supposed to
interfere with the load applied to the contact. Hocheng
& J. Stojadinovic
[email protected]; [email protected]
1 Ecole Polytechnique Federale de Lausanne, EPFL-TIC,
Lausanne, Switzerland
2 Ecole Polytechnique Federale de Lausanne, EPFL-CMI-GE,
Lausanne, Switzerland
123
J Bio Tribo Corros (2016) 2:8
DOI 10.1007/s40735-016-0041-4
et al. [9] provided analytical extension of the Preston
equation for dielectrics by including surface charge effect
between abrasive particles and SiO2 surfaces. More
recently, Jing Li et al. [10] proposed a theoretical model
based on a tribocorrosion approach that describes the total
CMP material removal rate as the sum of pure wear, cor-
rosion-induced wear, wear-induced corrosion, and pure
corrosion (etching). The model predictions concerning the
effect of contact pressure and particle size were found to
match experimental results reasonably well. However,
none of the proposed models can account for the crucial
role played by the chemical composition of the slurries and
in particular by their oxidizing power, a key parameter in
CMP.
In the present study, we explore another tribocorrosion
approach of CMP based on mechanistic models that was
found to accurately describe the wear accelerated corrosion
of tungsten submitted to sliding in CMP relevant model
fluids [1, 4, 11, 12].
Tribocorrosion depends on a multitude of mechanical,
material, chemical, and electrochemical factors [13, 14]. A
simple view of tribocorrosion was proposed by Uhlig for an
inert indenter sliding over a passive metal surface [15]. In
this case, two independent mechanisms contribute to
material removal from the metal: particle detachment by
the indenter digging below the surface (mechanical wear)
and accelerated corrosion on the depassivated surface left
behind the indenter (wear accelerated corrosion). Both
mechanisms are affected by the interaction of mechanical
and chemical phenomena. The extent of depassivated area
and thus of the wear accelerated corrosion depends on the
acting stress field as well as on the resistance and geo-
metrical properties of the contacting materials. On the
other hand, the electrochemical conditions established in
the contact may significantly affect the mechanical
response of metals [11, 16–19]. According to the Kauf-
mann’s model, wear accelerated corrosion is expected to be
the determining tribocorrosion mechanisms in CMP.
The tribocorrosion model proposed by Mischler and
Landolt [14, 20] (Eq. 2) predicts the theoretical current
generated during rubbing, Ith, to be proportional to
mechanical factors gathered under the parameter Rdep, the
depassivation rate (the area of bare metal exposed to the
solution by unit time), and electrochemical factor Qp, the
passivation charge density (the charge density required to
repassivate the metal):
Ith ¼ RdepQp ð2Þ
In case of a rough, inert indenter sliding on a soft metal,
depassivation occurs at asperity junctions plastically
indenting the metal. According to Landolt et al. [14], the
depassivation rate for that case can be described by Eq. (3),
which predicts a square root dependence of Rdep on normal
force, provided the number of asperity contacts is inde-
pendent of normal force.
Rdep ¼ KavsF
H
� �0:5
ð3Þ
with Ka = (k/2) p0.5 nj0.5, where
– K is the probability factor for an asperity junction to
become depassivated,
– nj is the number of asperity junction established in the
contact,
– vs is the sliding velocity [m/s],
– F is the normal force applied to the contact [N], and
– H is the indentation micro hardness of the metal [Pa].
The goal of this paper is to adapt the above tribocor-
rosion equations to the CMP situation and to investigate
their applicability to a real CMP process. As a model
system, CMP of tungsten PVD film deposited on silicon
wafer was considered. Polishing was carried out on an
industrial CMP device using slurries containing well-de-
fined silica nanoparticles and different oxidizing agents.
2 The Proposed CMP Tribocorrosion Model
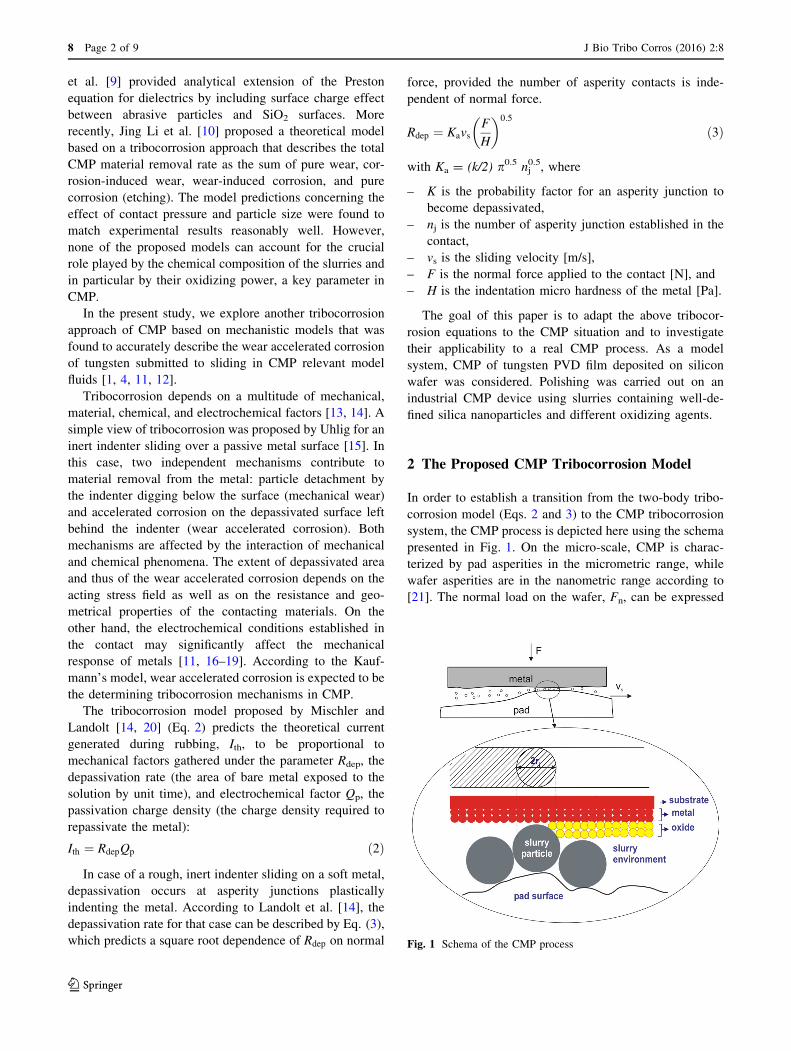
In order to establish a transition from the two-body tribo-
corrosion model (Eqs. 2 and 3) to the CMP tribocorrosion
system, the CMP process is depicted here using the schema
presented in Fig. 1. On the micro-scale, CMP is charac-
terized by pad asperities in the micrometric range, while
wafer asperities are in the nanometric range according to
[21]. The normal load on the wafer, Fn, can be expressed
Fig. 1 Schema of the CMP process
8 Page 2 of 9 J Bio Tribo Corros (2016) 2:8
123

using the pressure on the wafer head, P, multiplied by the
surface of the wafer on which the metal is uniformly
deposited, Aw:
Fn ¼ PAw ð4Þ
Relative sliding velocity, vs, is determined using Eq. (5)
knowing the rotation rate of a platen holding the pad, xT,
and the distance of the centers of the wafer and the pad, rcc:
vs ¼ xTrcc: ð5Þ
In the nanometric scale, the removal can be depicted as
the particle’s scratching action on the surface oxide film.
Therefore, instead of considering the number of asperities
junctions nj, we can introduce the number of abrasive silica
particles, np, acting in the contact. The value of H corre-
sponds to the hardness Hw of the metal deposited onto the
wafer that needs to be polished. Equation (6) is a derivation
of Eq. (2) by expressing Rdep, Fn, and vs, using Eqs. (3),
(4), and (5), respectively, and Ka = (k/2) p0.5 np0.5. Details
of the derivation are given elsewhere [14, 20].
ICMP ¼ RdepQ ¼ 0:5p0:5kxTrccn0:5p
PAw
Hw
� �0:5
Q ð6Þ
The wear accelerated corrosion can be converted into
removed volume per unit time V (mm3/s) using Faraday’s
law (Eq. 7):
V ¼ ICMP
M
nFq; ð7Þ
where M is the atomic mass of the polished metal (g/mol),
F is the Faraday’s constant (96500 C/mol), n is the valence
of dissolution of the metal, and q its density (g/cm3). The
CMP removal rate is usually expressed in polished depth
by unit time and can be determined using Eq. (8) by con-
sidering a uniform removal of the metal on the wafer
surface Aw:
RR ¼ V
Aw
ð8Þ
Finally, by combining Eqs. (5)–(8), one obtains Eq. (9),
which described the theoretical removal rate expected in
CMP:
RR ¼ 0:5p0:5kM
nFqnpP
AwHw
� �0:5
xTrccQ: ð9Þ
The present model predicts RR to be a function of the
sliding velocity, number of active particles, wafer surface,
pressure, wafer hardness, and the passivation charge den-
sity, Q. Equation (9) gives a more detailed insight than the
Preston equation, although both contain the parameter
P and vs. Note however, that the contact pressure appears at
the square root in the present model instead of the linear
dependence predicted by Preston equation. A power
exponent below 1 was already proposed in past attempts to
refine Preston equation [9].
3 Experimental
3.1 Investigated Slurries
The following slurries were investigated:
– slurries containing 3 % silica particles and different
contents of KIO3 (0, 0.1, 2 and 4 %) with pH 5,
– slurries containing 3 % silica particles and different
contents of KIO3 (0, 0.1, 2 and 4 %) with addition of
HCl in order to achieve pH 2,
– slurries containing 3 % silica particles, 5 % H2O2,
different contents of Fe(NO3)3 (0 %, 0.001 %, 0.02 %,
0.05 %) and HCl in order to adjust the pH. These
slurries have pH 2.5, except for 0.02 % Fe(NO3)3,
which has pH 3,
– the reference slurry (RS) containing 3 % silica parti-
cles, 2 % KIO3, H3PO4, and C3H6O3 with a pH 2.75
(adjusted with NH4OH).
This technical slurry has been used at the Center ofMicro-
nanotechnology (EPFL) for tungsten polishing. All slurries
contained the same silica particles of 12 nmdiameter. All the
concentrations are given in weight percent.
3.2 Electrochemical Experiments
Tungsten electrodes were prepared by embedding tungsten
rods of 5.3 mm diameter (GoodFellow) in epoxy resin. The
flat ends were left free, one was exposed to the solution
while the other served for electrical connection. Prior to
immersion to the solution, the flat end was polished with
grit paper 600, rinsed with alcohol and distilled water, and
dried with compressed air.
Open circuit potentials (OCP) for tungsten samples were
measured using a mercury sulfate reference electrode and a
multimeter. All the potentials in this paper will be given
with respect to the mercury sulfate reference electrode,
which potential with respect to the standard hydrogen
electrode is 0.654 V. The OCP values were measured after
60 s immersion in the investigated slurries.
Passivation kinetics was measured using a Wenking LB
95L Auto Range Laboratory Potentiostat. The potentiostat
was controlled by a desktop computer equipped with a
National Instruments data acquisition board running under
Lab View based software. This set-up allows imposing a
potential step (rise time of 2 ms) with simultaneous trig-
gering of the current measurement at a sampling rate of 10 K
samples/s. The potential was kept initially at the value of
-1 V for 3 s and then switched to the arbitrarily selected
J Bio Tribo Corros (2016) 2:8 Page 3 of 9 8
123
potential of 0.2 V during 1 s, for all chosen slurries. This
potential was selected because it lies at least 100 mV above
all measuredOCPs. Three independent tests were carried out
in each slurry in order to check the reproducibility.
3.3 CMP Tests
Polishing of tungsten was carried out using the Mecapol
E460, Alpsitec CMP machine in the Center of Micro-
nanotechnology (CMI) at the EPFL. Tungsten was depos-
ited on the surface of the wafers to be polished (diameter
101.6 mm or 400) using CVD (chemical vapor deposition).
The CMP process parameters were as follows: wafer
pressure (pressure on the head) of 5 psi, platen speed of
50 rpm, head (wafer) speed 60 rpm, back pressure (pres-
sure on the back of the wafer) of 0.15 psi, slurry flow of
100 ml/min and polishing time of 60 s. In terms of global
planarization at the wafer scale, film thickness was mea-
sured at points across the wafer surface and used to cal-
culate within-wafer-nonuniformity (WIWNU). Most
commonly, a 49-point measurement grid is used to deter-
mine the WIWNU [22].
4 Results
Open circuit potentials, measured in slurries with different
contents of KIO3 and having different pH, are given in
Table 1. When the concentration of KIO3 reaches 1 %, the
saturation occurs and the OCP is stabilizing for both pH
values. OCP values are lower for the pH 5 compared to pH 2
values. OCP,measured in slurries containing oxidizing agent
H2O2 and different contents of Fe(NO3)3, are also given in
Table 1. When the concentration of Fe(NO3)3 reaches
0.02 %, the saturation occurs and the OCP stabilizes.
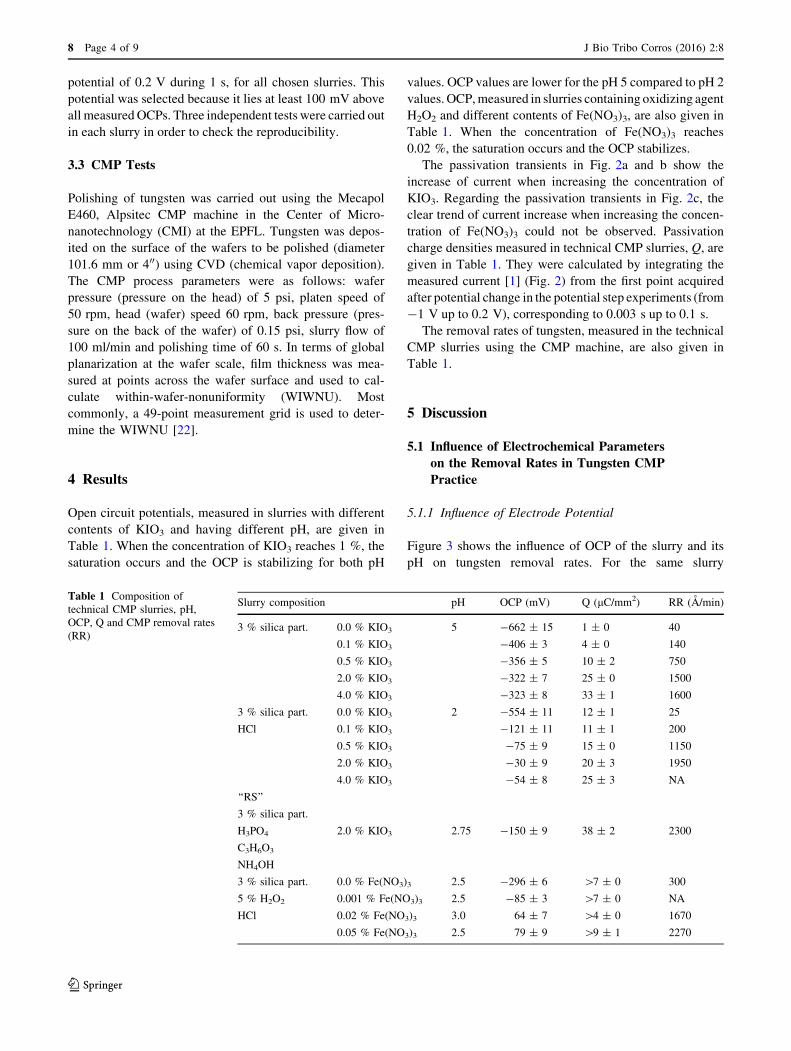
The passivation transients in Fig. 2a and b show the
increase of current when increasing the concentration of
KIO3. Regarding the passivation transients in Fig. 2c, the
clear trend of current increase when increasing the concen-
tration of Fe(NO3)3 could not be observed. Passivation
charge densities measured in technical CMP slurries, Q, are
given in Table 1. They were calculated by integrating the
measured current [1] (Fig. 2) from the first point acquired
after potential change in the potential step experiments (from
-1 V up to 0.2 V), corresponding to 0.003 s up to 0.1 s.
The removal rates of tungsten, measured in the technical
CMP slurries using the CMP machine, are also given in
Table 1.
5 Discussion
5.1 Influence of Electrochemical Parameters
on the Removal Rates in Tungsten CMP
Practice
5.1.1 Influence of Electrode Potential
Figure 3 shows the influence of OCP of the slurry and its
pH on tungsten removal rates. For the same slurry
Table 1 Composition of
technical CMP slurries, pH,
OCP, Q and CMP removal rates
(RR)
Slurry composition pH OCP (mV) Q (lC/mm2) RR (A/min)
3 % silica part. 0.0 % KIO3 5 -662 ± 15 1 ± 0 40
0.1 % KIO3 -406 ± 3 4 ± 0 140
0.5 % KIO3 -356 ± 5 10 ± 2 750
2.0 % KIO3 -322 ± 7 25 ± 0 1500
4.0 % KIO3 -323 ± 8 33 ± 1 1600
3 % silica part.
HCl
0.0 % KIO3 2 -554 ± 11 12 ± 1 25
0.1 % KIO3 -121 ± 11 11 ± 1 200
0.5 % KIO3 -75 ± 9 15 ± 0 1150
2.0 % KIO3 -30 ± 9 20 ± 3 1950
4.0 % KIO3 -54 ± 8 25 ± 3 NA
‘‘RS’’
3 % silica part.
H3PO4
C3H6O3
NH4OH
2.0 % KIO3 2.75 -150 ± 9 38 ± 2 2300
3 % silica part.
5 % H2O2
HCl
0.0 % Fe(NO3)3 2.5
2.5
3.0
2.5
-296 ± 6 [7 ± 0 300
0.001 % Fe(NO3)3 -85 ± 3 [7 ± 0 NA
0.02 % Fe(NO3)3 64 ± 7 [4 ± 0 1670
0.05 % Fe(NO3)3 79 ± 9 [9 ± 1 2270
8 Page 4 of 9 J Bio Tribo Corros (2016) 2:8
123
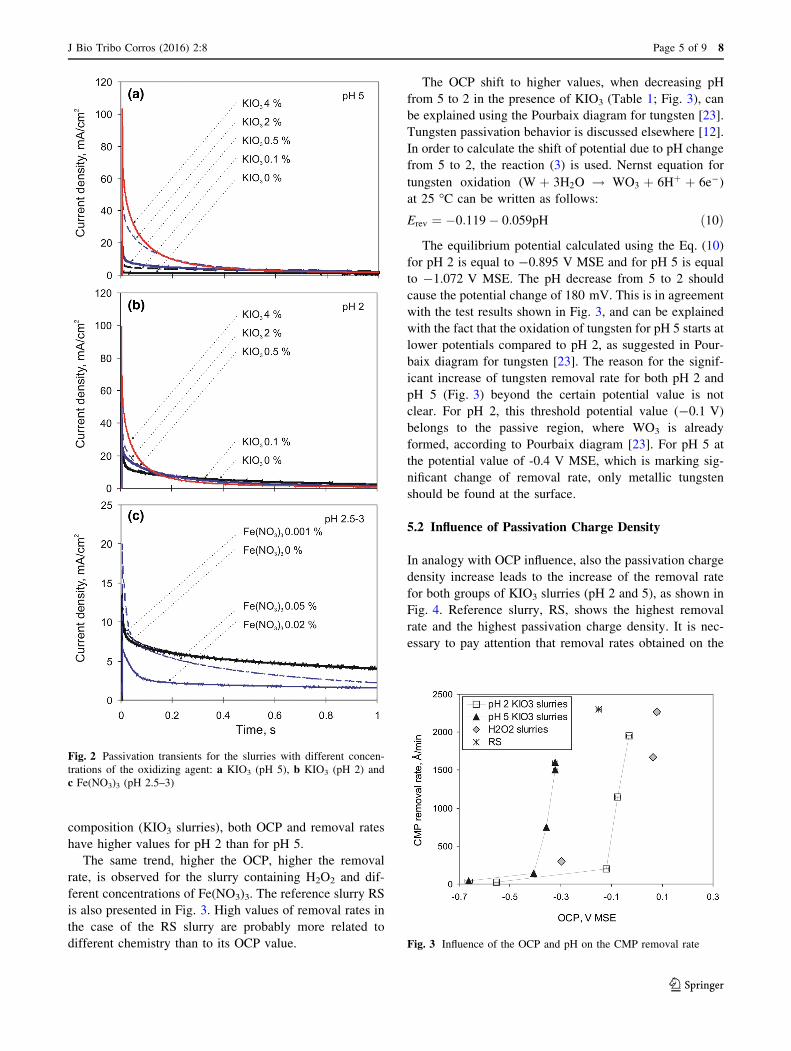
composition (KIO3 slurries), both OCP and removal rates
have higher values for pH 2 than for pH 5.
The same trend, higher the OCP, higher the removal
rate, is observed for the slurry containing H2O2 and dif-
ferent concentrations of Fe(NO3)3. The reference slurry RS
is also presented in Fig. 3. High values of removal rates in
the case of the RS slurry are probably more related to
different chemistry than to its OCP value.
The OCP shift to higher values, when decreasing pH
from 5 to 2 in the presence of KIO3 (Table 1; Fig. 3), can
be explained using the Pourbaix diagram for tungsten [23].
Tungsten passivation behavior is discussed elsewhere [12].
In order to calculate the shift of potential due to pH change
from 5 to 2, the reaction (3) is used. Nernst equation for
tungsten oxidation (W þ 3H2O ! WO3 þ 6Hþ þ 6e�)at 25 �C can be written as follows:
Erev ¼ �0:119� 0:059pH ð10Þ
The equilibrium potential calculated using the Eq. (10)
for pH 2 is equal to -0.895 V MSE and for pH 5 is equal
to -1.072 V MSE. The pH decrease from 5 to 2 should
cause the potential change of 180 mV. This is in agreement
with the test results shown in Fig. 3, and can be explained
with the fact that the oxidation of tungsten for pH 5 starts at
lower potentials compared to pH 2, as suggested in Pour-
baix diagram for tungsten [23]. The reason for the signif-
icant increase of tungsten removal rate for both pH 2 and
pH 5 (Fig. 3) beyond the certain potential value is not
clear. For pH 2, this threshold potential value (-0.1 V)
belongs to the passive region, where WO3 is already
formed, according to Pourbaix diagram [23]. For pH 5 at
the potential value of -0.4 V MSE, which is marking sig-
nificant change of removal rate, only metallic tungsten
should be found at the surface.
5.2 Influence of Passivation Charge Density
In analogy with OCP influence, also the passivation charge
density increase leads to the increase of the removal rate
for both groups of KIO3 slurries (pH 2 and 5), as shown in
Fig. 4. Reference slurry, RS, shows the highest removal
rate and the highest passivation charge density. It is nec-
essary to pay attention that removal rates obtained on the
Fig. 2 Passivation transients for the slurries with different concen-
trations of the oxidizing agent: a KIO3 (pH 5), b KIO3 (pH 2) and
c Fe(NO3)3 (pH 2.5–3)
Fig. 3 Influence of the OCP and pH on the CMP removal rate
J Bio Tribo Corros (2016) 2:8 Page 5 of 9 8
123

CMP machine relate to the OCP values of slurries, but no
potential was imposed on the CMP machine during pol-
ishing. The calculated passivation charge (Table 1) relates
to the same fixed imposed electrode potential for all the
slurries (0.2 V MSE). Measured passive current (Fig. 2) for
all technical slurries (Table 1) is probably highly influ-
enced by the cathodic reaction. According to Pourbaix
diagram for I [23], the reaction occurring in the presence of
KIO3 slurries is the following one:
I2 þ 6H2O ¼ 2IO�3 þ 12Hþ þ 10e� ð11Þ
The Erev values for this reaction are equal to 0.38 V
MSE and 0.16 V MSE for pH 2 and pH 5, respectively,
according to the equation:
Erev ¼ 1:178 � 0:0709 pH þ 0:0059 logIO�
3
� �I2ð Þ ð12Þ
As presented in Fig. 5, the measured current represents
the sum of the anodic and the cathodic current. The test
potential for passivation kinetics measurements was 0.2 V.
The influence of the excess cathodic current (reduction of
I) cannot be neglected for pH 2. For a simple electrode, it is
schematically shown in Fig. 5. On the other hand, for pH 5,
at the potential of 0.2 V, the contribution of the anodic
current is more important.
The effect of the important contribution of the cathodic
current to the overall current measured during passivation
kinetics measurement is also present in the slurries con-
taining H2O2. Therefore, the calculated QpCMPvalues for
these slurries (Table 1) are underestimated.
Hydrogen peroxide is unstable and reducible to water
below 0.93 V MSE and unstable and oxidizable to oxygen
above the potential of -0.09 V MSE [23]. These two
domains of instability have a common area in which
hydrogen peroxide is doubly unstable and can decompose
into water and oxygen according to reaction (6):
2H2O2 ! 2H2O þ O2 ð13Þ
In the performed potential step experiments, the
imposed electrode potential was 0.2 V MSE that is situated
in the hydrogen peroxide double instability region.
A way to refine the measurements of passivation
kinetics should be to take into account the OCP value of the
given slurry and to impose the potential corresponding to
the OCP of the given slurry augmented by 200 mV.
Despite the simplifications made in the passivation
kinetics measurements, related to imposing the fixed
potential of 0.2 V after the potential change, the influence
of passivation kinetics on the removal rate is clear, as
shown in Fig. 4.
The influence of KIO3 concentration on the CMP
removal rate and OCP is shown in Fig. 6a, b. When
increasing the KIO3 concentration, saturation of CMP RR
and OCP occurs for both pH 2 and pH 5.
5.3 Quantitative Prediction of the Removal Rate
in CMP Using Tribocorrosion Model
In order to predict the RR using the Eq. (9) it is necessary
to correctly determine the passivation charge density,
which is a complex issue. One of the methods would be to
integrate the values of current measured in potential step
experiments [1]:
Q ¼Ztdo
iexdt ð14Þ
The typical passivation transient for technical slurry
containing 2 % KIO3 for pH 2 is shown in Fig. 7. The
current in the initial period is limited by the ohmic resis-
tance of the solution. Therefore, the current can beFig. 4 Influence of the passivation charge density on the CMP
removal rate
Fig. 5 Influence of cathodic partial reaction on the resulting current
regarding the passivation kinetics measurements undertaken at 0.2 V
8 Page 6 of 9 J Bio Tribo Corros (2016) 2:8
123
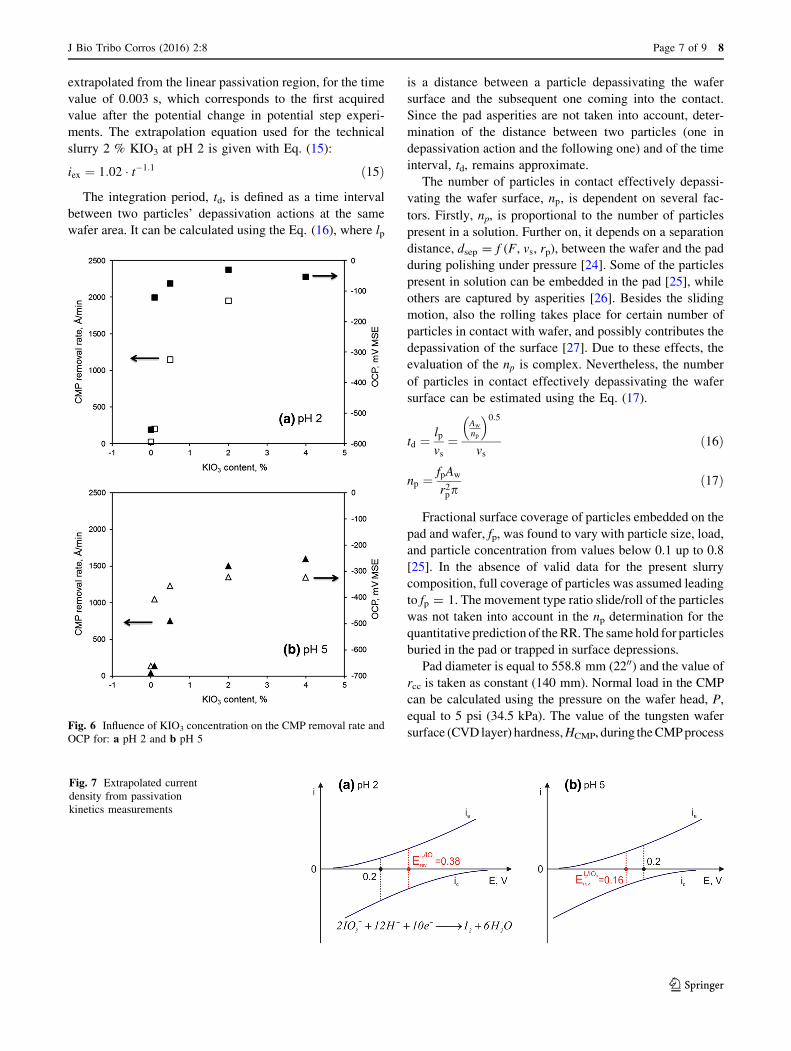
extrapolated from the linear passivation region, for the time
value of 0.003 s, which corresponds to the first acquired
value after the potential change in potential step experi-
ments. The extrapolation equation used for the technical
slurry 2 % KIO3 at pH 2 is given with Eq. (15):
iex ¼ 1:02 � t�1:1 ð15Þ
The integration period, td, is defined as a time interval
between two particles’ depassivation actions at the same
wafer area. It can be calculated using the Eq. (16), where lp
is a distance between a particle depassivating the wafer
surface and the subsequent one coming into the contact.
Since the pad asperities are not taken into account, deter-
mination of the distance between two particles (one in
depassivation action and the following one) and of the time
interval, td, remains approximate.
The number of particles in contact effectively depassi-
vating the wafer surface, np, is dependent on several fac-
tors. Firstly, np, is proportional to the number of particles
present in a solution. Further on, it depends on a separation
distance, dsep = f (F, vs, rp), between the wafer and the pad
during polishing under pressure [24]. Some of the particles
present in solution can be embedded in the pad [25], while
others are captured by asperities [26]. Besides the sliding
motion, also the rolling takes place for certain number of
particles in contact with wafer, and possibly contributes the
depassivation of the surface [27]. Due to these effects, the
evaluation of the np is complex. Nevertheless, the number
of particles in contact effectively depassivating the wafer
surface can be estimated using the Eq. (17).
td ¼lp
vs¼
Aw
np
� �0:5
vsð16Þ
np ¼fpAw
r2ppð17Þ
Fractional surface coverage of particles embedded on the
pad and wafer, fp, was found to vary with particle size, load,
and particle concentration from values below 0.1 up to 0.8
[25]. In the absence of valid data for the present slurry
composition, full coverage of particles was assumed leading
to fp = 1. The movement type ratio slide/roll of the particles
was not taken into account in the np determination for the
quantitative prediction of theRR. The same hold for particles
buried in the pad or trapped in surface depressions.
Pad diameter is equal to 558.8 mm (2200) and the value ofrcc is taken as constant (140 mm). Normal load in the CMP
can be calculated using the pressure on the wafer head, P,
equal to 5 psi (34.5 kPa). The value of the tungsten wafer
surface (CVD layer) hardness,HCMP, during theCMPprocessFig. 6 Influence of KIO3 concentration on the CMP removal rate and
OCP for: a pH 2 and b pH 5
Fig. 7 Extrapolated current
density from passivation
kinetics measurements
J Bio Tribo Corros (2016) 2:8 Page 7 of 9 8
123

is not known, but we can approximately assume it has equal
value to the hardness of tungsten samples (3.7 GPa).
The calculated passivation charge density for the time
period td in the slurry containing 2 % KIO3 for pH 2 equals
3.1 10-7 mC/mm2.
Taking into account the above explained parameters, the
maximum calculated RR has the value of approx. 30,000 A/
min for tungsten during polishing in the slurry containing
2 % KIO3 at pH 2. The RR calculated using the explained
model is one order ofmagnitude higher thanRRmeasured on
the CMP machine in the same technical slurry (Table 1).
This discrepancy is most likely due to the assumption of full
particle coverage fp that is expected to overestimate the
number of active, depassivating particles and thus the
removal rate. Clearly, improved quantification of this factor
is a prerequisite for further developing the quantitative pre-
dictability of the present tribocorrosion model.
6 Conclusions
– Electrochemical parameters (OCP, passivation charge
density) are strongly influencing tungsten CMP
removal rate (RR). Tungsten removal rate increases
when increasing the value of these electrochemical
parameters. Under given CMP polishing conditions
(known OCP and passivation kinetics), it would be
possible to rationalize the industrial CMP outcome
based on the developed scientific criteria.
– The simplified method used for determination of the
passivation charge density does not diminish the clarity
of the observed increasing trend of tungsten CMP
removal rate and tribocorrosion wear rate with passiva-
tion charge density.
– The tribocorrosion model can be successfully applied to
tungsten CMP practice. The results of the undertaken study
are in a good agreement with Mischler’s model. The
assumption is made that the number of asperities in
tribocorrosion contact corresponds to the number of abrasive
particles in the CMP slurry contributing to the depassivation
of tungsten wafer’s surface. The advantage of the used
tribocorrosionmodelover thePreston’smodel is that it allows
to semi-quantitatively predict the effect of (electro)-chemical
and material parameters (such as the passivation charge) on
tungsten removal in CMP, with a reasonable approximation.
References
1. Stojadinovic J, Bouvet D, Declercq M, Mischler S (2009) Effect
of electrode potential on the tribocorrosion of tungsten. Tribol Int
42(4):575–583
2. Mischler S (2008) Triboelectrochemical techniques and inter-
pretation methods in tribocorrosion: a comparative evaluation.
Tribol Int 41:573–583
3. Ziomek-Moroz M, Miller A, Hawk J, Cadien K, Li DY (2003) An
overview of corrosion–wear interaction for planarizing metallic
thin films. Wear 255:869–874
4. Bielmann M, Mahajan U, Sigh R, Agarwal P, Mischler S, Rosset
E, Landolt D (2000) Tribological experiments applied to tungsten
chemical mechanical polishing. Mat Res Soc Symp Proc 566:97
5. Preston FW (1927) The theory and design of glass plate polishing
machines. J Soc Glass Technol. 11:247–256
6. Steigerwald JM, Murarka SP, Gutmann RJ (1997) Chemical
mechanical planarization of microelectronic materials. Wiley,
New York
7. Tseng WT, Wang YL (1997) Re-examination of pressure and
speed dependences of removal rate during chemical–mechanical
polishing processes. J Electrochem Soc 144(2):L15–L17
8. Mpagazehe JN, Higgs CF III (2013) A three-dimensional tran-
sient model to predict interfacial phenomena during chemical
mechanical polishing using computational fluid dynamics. Proc
Inst Mech Eng Part J 227(7):777–786
9. Hocheng H, Tsai HY, Su YT (2001) Modeling and experimental
analysis of the material removal rate in the chemical mechanical
planarization of dielectric films and bare silicon wafers. J Elec-
trochem Soc 148(10):G581–G586
10. Li J, Lu X, He Y, Luo J (2011) Modeling the chemical–me-
chanical synergy during copper CMP. J Electrochem Soc 158(2):
H197–H202
11. Stojadinovic J, Mendia L, Bouvet D, Declercq M, Mischler S
(2009) Electrochemically controlled wear transitions in the tri-
bocorrosion of ruthenium. Wear 267:186–194
12. Stojadinovic J, Bouvet D, Declercq M, Mischler S (2011) Influ-
ence of chelating agents on the tribocorrosion of tungsten in
sulphuric acid solution. Electrochim Acta 56:7131–7140
13. Landolt D (2007) Corrosion and Surface Chemistry of Metals,
Lausanne, EPFL Press, distributed by CRC Press
14. Landolt D, Mischler S, Stemp M (2001) Electrochemical methods
in tribocorrosion: a critical appraisal. Electrochim Acta 46:3913–
3929
15. Uhlig HH (1948) Corrosion handbook. John, New York
16. Favero M, Stadelmann P, Mischler S (2006) Effect of the applied
potential of the near surface microstructure of a 316L steel sub-
mitted to tribocorrosion in sulfuric acid. J Phys D 39:3175–3183
17. Bidiville A, Favero M, Stadelmann P, Mischler S (2007) Effect of
surface chemistry on the mechanical response of metals in sliding
tribocorrosion systems. Wear 263:207–217
18. Perret J, Boehm-Courjault E, Cantoni M, Mischler S, Beaudouin
A, Chity W, Vernot JP (2010) EBSD, SEM and FIB characteri-
sation of subsurface deformation during tribocorrosion of stain-
less steel in sulphuric acid. Wear 269:383–393
19. Akonko SB, Li DY, Ziomek-Moroz M, Hawk J, Miller A, Cadien
K (2005) Effects of K3[Fe(CN)6] slurry’s pH value and applied
potential on tungsten removal rate for chemical–mechanical
planarization application. Wear 259:1299–1307
20. Mischler S, Debaud S, Landolt D (1998) Wear-accelerated cor-
rosion of passive metals in tribo-corrosion systems. J Elec-
trochem Soc 145(3):750–758
21. Zantye PB, Kumar A, Sikder AK (2004) Chemical mechanical
planarization for micro electronics applications. Mater Sci Eng R
45:89–220
22. Yeruva SB (2005) PhD Thesis Particle scale modeling of material
removal and surface roughness in chemical mechanical polishing.
University of Florida
23. Pourbaix M (1974) Atlas of electrochemical equilibria in aqueous
solutions. National Association of Corrosion Engineers, Houston
8 Page 8 of 9 J Bio Tribo Corros (2016) 2:8
123

24. Jeng YR, Huang PY, Pan WC (2003) Tribological analysis of.
CMP with partial asperity contact. J Electrochem Soc 150(10):
G630–G637
25. Choi W, Lee SM, Abiade J, Sing RK (2004) Estimation of
fractional surface coverage during oxide chemical mechanical
polishing (CMP). J Electrochem Soc 151(5):G367–G372
26. Luo J, Dornfeld D (2001) Material removal mechanism in
chemical mechanical polishing: theory and modelling. IEEE
Trans Semicond Manuf 14(2):112–133
27. Sun D, Wharton JA, Wood RJK, Ma L, Rainforth WM (2009)
Microabrasion–corrosion of cast CoCrMo alloy in simulated
body fluids. Tribol Int 42(1):99–110
J Bio Tribo Corros (2016) 2:8 Page 9 of 9 8
123