prediction of remaining useful life (rul) of lithium ion
TRANSCRIPT

Prediction of Remaining Useful Life (RUL)of Lithium ion (Li-ion) Batteries
MSc Research Project
Data Analytics
Rashmikant T. ShuklaStudent ID: x18181236
School of Computing
National College of Ireland
Supervisor: Dr. Rashmi Gupta
www.ncirl.ie

National College of IrelandProject Submission Sheet
School of Computing
Student Name: Rashmikant T. Shukla
Student ID: x18181236
Programme: Data Analytics
Year: 2020
Module: MSc Research Project
Supervisor: Dr. Rashmi Gupta
Submission Due Date: 17/08/2020
Project Title: Prediction of Remaining Useful Life (RUL) of Lithium ion (Li-ion) Batteries
Word Count: 8095
Page Count: 21
I hereby certify that the information contained in this (my submission) is informationpertaining to research I conducted for this project. All information other than my owncontribution will be fully referenced and listed in the relevant bibliography section at therear of the project.
ALL internet material must be referenced in the bibliography section. Students arerequired to use the Referencing Standard specified in the report template. To use otherauthor’s written or electronic work is illegal (plagiarism) and may result in disciplinaryaction.
Signature:
Date: 27th September 2020
PLEASE READ THE FOLLOWING INSTRUCTIONS AND CHECKLIST:
Attach a completed copy of this sheet to each project (including multiple copies). �Attach a Moodle submission receipt of the online project submission, toeach project (including multiple copies).
�
You must ensure that you retain a HARD COPY of the project, both foryour own reference and in case a project is lost or mislaid. It is not sufficient to keepa copy on computer.
�
Assignments that are submitted to the Programme Coordinator office must be placedinto the assignment box located outside the office.
Office Use Only
Signature:
Date:
Penalty Applied (if applicable):

Prediction of Remaining Useful Life (RUL) of Lithiumion (Li-ion) Batteries
Rashmikant T. Shuklax18181236
Abstract
In recent time Li-ion battery gained popularity because of their high chargedensity, portability and longer life span. It compliments the human quest for greenenergy. As many of the green energy applications like Electrical Vehicle, WindEnergy and Solar Energy use Li-ion battery as their energy storage device. So, abetter and intelligent Remaining Useful Life (RUL) prediction model will improvethe reliability of these systems. This research states that autoencoder can be usedto learn time-based battery parameter and their dimension reduction. Featuresfrom an autoencoder are fed into another neural network which predicts RUL ofbattery. NASA battery degradation data set is used for this analysis and targetdata are extracted based on the geometric features. The model evaluation is basedon R-square and Mean Squared Error.
1 Introduction
We heavily rely on machines, devices and equipment in our day-to-day life. Many of thesesystems have an energy storage device, battery as their integral part. Various batteriesare used in these systems, but Li-ion batteries are emerged as one of the best perform-ing options because of its high charge density and long-life span. These machines aremeant to falter after the continuous use over a period. To ensure the smooth functioningof battery-based equipment, maintenance is performed. It is essential to monitor thehealth of batteries to ensure the proper functioning of these systems. There are differentmaintenance programs like reactive maintenance, preventive maintenance and predictivemaintenance which are adopted for these systems.
Reactive maintenance is performed when equipment stops working. It is the tradi-tional way which may leads to downtime period and there is always an uncertainty aboutthe current health of the equipment. In the preventive maintenance, periodic mainten-ance is scheduled to ensure that machine does not brake while in operation. In thisprocess the selection of maintenance period is of utmost importance otherwise it mayresult into over maintenance or under maintenance. These both scenarios are risky andpossess substantial time and economic loss. In predictive maintenance one collects thedata regarding the health of the equipment in terms of various sensor and operationaldata, then accordingly maintenance of the device can be scheduled. This method is costeffective, and it reduces the chances of downtime.
Predictive maintenance in batteries are used for their health monitoring, which in-cludes prediction of battery’s State of Charge (SOC) and Remaining Useful Life (RUL).
1

SOC indicates the current capacity of batteries in comparison to its rated capacity andRUL indicates how much longer battery is going to last under current working condi-tions. This research is specifically focused on the prediction of RUL of Li-ion batteries.Accurate RUL prediction helps in overall maintenance of the system and gives the clearidea about replacement of the batteries.
Predictive maintenance domain got a great boost by advancement of sensor techno-logy, Internet of Things (IOT) and computational capabilities. Sensors are used to trackperformance of different parts by being integrated with the devices. This generates asubstantial amount of data, which is then stored and analysed. Based on these data,predictions are made with the help of various machine learning models. Same approachis used in electronic devices, home appliances and industrial equipment. If we talk aboutbatteries, then traditionally the preventive techniques were used for maintenance this isalso due to its enclosed structure and complex electrochemical nature. This limits theusage of sensors. Still, the earlier research has shown the potential of using internal cur-rent, voltage and impedance profiles of batteries for health monitoring but these wereonly limited to experimental levels (Vutetakis and Viswanathan; 1995).
It took some time for the world to acknowledge the potential of Li-ion batteries, buteventually it happened. Even, 2019 Chemistry Nobel price were given to the scientists,responsible for the emergence of the Li-ion batteries.1 Now one can see the bloomingmarket of the Li-ion batteries as the world is exploring new alternate energy options likesolar energy, wind energy, electrical vehicles etc and all these are using Li-ion batteries asenergy storage devices. It is projected that valuation of Li-ion batteries will be doubledin coming five years.2 The reliability and longevity of these systems can be ensured byenhancing the performance of the Li-ion batteries. This can be achieved by an accuratehealth monitoring of the batteries. Initial research, Goebel et al. (2008), has shown howdata of the Li-ion batteries can be stored and different machine learning techniques canbe very effective in health monitoring of the batteries. Ibid has shown the potentialof using relations between capacity and impedance parameter to predict the RUL of thebattery. Even simple baseline regression models were able to make reasonable predictions.Degradation profile of the batteries are non-linear in nature and accurate prediction canbe made by using algorithms which are good at learning non-linear parameters.
Several research papers have used Probabilistic Algorithms, Support Vector Machine(SVM), Kalman Filters, Optimization Algorithm etc. to predict the State of Health(SOH), SOC and RUL of the batteries. These algorithms use different internal parameterprofiles like Electrochemical Impedance Spectroscopy (EIS), open circuit voltage, voltageunder load in order to apply machine learning models (Li et al.; 2017). However, it needsa good understanding of the internal chemistry of the Li-ion batteries based on whichappropriate profile can be chosen for the final prediction.
In recent years, this domain has seen research papers which are using deep learningand neural network methods for RUL prediction (Shen et al.; 2020; Qu et al.; 2019; Zhanget al.; 2018). The performance of the deep learning methods is very promising, especiallyLong Short Term Memory (LSTM) model has given the state-of-the-art results. Deeplearning models have an advantage over the traditional methods as the network itselflearns the features, so it provides leverage against the expertise in complex electrochemicalprofiles of batteries which was compulsory in previous researches. Most of the research
1https://www.nobelprize.org/prizes/chemistry/2019/press-release/2https://www.prnewswire.co.uk/news-releases/global-lithium-ion-power-battery-market-size-projected-to-reach-100-billion-by-2025-889563915.
html
2

focuses on a single battery or gives different models for different kind of batteries andusually they provide only short-term RUL predictions. To address this, a combinationof autoencoder and Deep Neural Network (DNN) is used in this research, in order toproduce prediction on multi-battery dataset. In previous research an autoencoder wasused to analyse and known to be work well with the non-linear trends which is an addedadvantage over the other models.
1.1 Research Question
The research question for this paper is ”How well a hybrid model with Autoencoder andDeep Neural Network can predict the RUL of Li-ion batteries based on their charging anddischarging cycle?”
1.2 Research Objective and Contribution
Objective of this research are,
1. A literature review on the SOC and RUL prediction.
2. To understand the charging, discharging cycle of battery in order to develop adata-driven model to predict remaining time before the failure of the battery.
3. Feature Extraction from raw data.
4. Implementation and evaluation of model with autoencoder and neural network.
Main contribution of the paper is the use of autoencoder with numerical data as it ismainly used with the image related problems. This research will also confirm the abilityof autoencoder in fusion of time domain data. The model in this research also tries to findthe options for the LSTM models when dealing with time related data. Uses of Li-ionbatteries in critical applications like aircraft, satellite, automobiles make this researchvery critical in order to make battery health management system more intelligent andaccurate. It not only improves the overall system reliability but also prevents the mishapsduring operations. This research also tries to reduce the dimension of the original signalin order to find minimum dimension, which will be enough to give good prediction ofRUL. The final model will be evaluated on its R-square and Mean Squared Error. Therobustness and accuracy of the model will be compared with the state of art LSTMmodels.
The remaining part of this paper is organized as follows. Section 2 gives a brief accounton related works. Followed by Section 3, which discusses the used methodology throughdata selection, Data Preparation, Feature Selection, Data Mining, RUL Calculation,Data Normalization and Evaluation subsections. Followed by Section 4, which givesDesign Specification of the models. Followed by Section 5, on details of Implementation.followed by section 6, Evaluation, Section 7, covers Conclusion and Future Work. Lastsection 8 is for acknowledgement.
2 Related Work
In literature one can see that as the importance of Li-ion batteries was realised, therewere efforts to find the methods to monitor the health of Li-ion batteries. This meant to
3
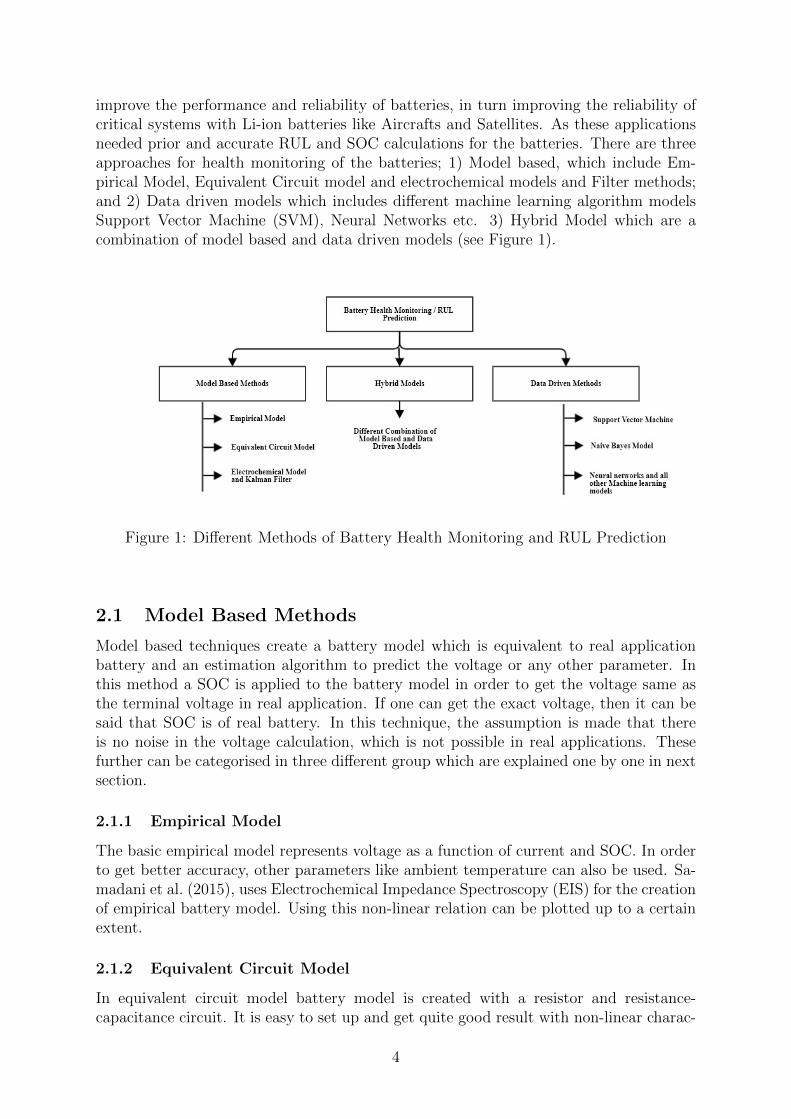
improve the performance and reliability of batteries, in turn improving the reliability ofcritical systems with Li-ion batteries like Aircrafts and Satellites. As these applicationsneeded prior and accurate RUL and SOC calculations for the batteries. There are threeapproaches for health monitoring of the batteries; 1) Model based, which include Em-pirical Model, Equivalent Circuit model and electrochemical models and Filter methods;and 2) Data driven models which includes different machine learning algorithm modelsSupport Vector Machine (SVM), Neural Networks etc. 3) Hybrid Model which are acombination of model based and data driven models (see Figure 1).
Figure 1: Different Methods of Battery Health Monitoring and RUL Prediction
2.1 Model Based Methods
Model based techniques create a battery model which is equivalent to real applicationbattery and an estimation algorithm to predict the voltage or any other parameter. Inthis method a SOC is applied to the battery model in order to get the voltage same asthe terminal voltage in real application. If one can get the exact voltage, then it can besaid that SOC is of real battery. In this technique, the assumption is made that thereis no noise in the voltage calculation, which is not possible in real applications. Thesefurther can be categorised in three different group which are explained one by one in nextsection.
2.1.1 Empirical Model
The basic empirical model represents voltage as a function of current and SOC. In orderto get better accuracy, other parameters like ambient temperature can also be used. Sa-madani et al. (2015), uses Electrochemical Impedance Spectroscopy (EIS) for the creationof empirical battery model. Using this non-linear relation can be plotted up to a certainextent.
2.1.2 Equivalent Circuit Model
In equivalent circuit model battery model is created with a resistor and resistance-capacitance circuit. It is easy to set up and get quite good result with non-linear charac-
4
teristics of the battery. Sangwan et al. (2016), use a modified equivalent circuit with twoset of resistance–capacitance network to estimate SOC of the battery.
2.1.3 Electrochemical Model
Electrochemical Models tries to represent internal working of the battery that is transferof charge from cathode to anode in term of mathematical equation usually it is representedby partial differential equation of high order, which makes it difficult to calculate SOCin real time but there are many papers which have given the methods to simplify theseequation in order to estimate SOC of the Li-ion battery (Meng et al.; 2018).
2.1.4 Kalman Filter
In literature one can find many applications of Kalman Filter for RUL and SOC predictionof Li-ion battery, it’s kind of extension to the electrochemical model. In general, Kalmanfilter are used to estimate unknown state of a system given the previous state data withsome system noises, they are widely used in navigation type of application and for signalprocessing systems. They are popular because they are used to provide an estimation ofunmeasurable quantity based on the nearest measurable quantities.
In batteries SOC cannot be calculated directly instead it can be estimated by othermeasurable parameters like internal impedance, voltage and current.Mo et al. (2016),have used a Kalman filter with particle swarm optimization to give improvement on theparticle filter method of the RUL prediction. Kalman filter provide better results withthe noisy data and particle swarm optimization improve the particle degeneracy problemof particle filter. The proposed model take account the internal impedance, aging rate ofbatteries and number of charging discharging cycle in order to estimate the capacity ofLi-ion battery and uses 30% fade in rated capacity criteria as end of life criterion. Forthe evaluation of the model performance RMSE is used, while for accuracy comparisonestimation error percentage method is used.
Yao et al. (2015), used an improved version of Kalman filter, Extended Kalman filterfor SOC estimation of Li-ion batteries. They have used concept of equivalent circuitmodel to estimate the open circuit voltage. Based on this open circuit voltage SOCis estimated, this method provides better precision with the non-linear characteristicsof the battery. To make the model more reliable under noise, Buss’s adaptive rule isapplied. Hu et al. (2012), also presented an extended Kalman filter model for the SOCand capacity estimation of Li-ion battery. They proposed a multi-scale framework forSOC and capacity estimation, which resulted in high efficiency and accuracy.
2.2 Hybrid Model
There are few models which uses a combination of data driven and model-based methodsto predict SOC and RUL of Li-ion batteries. Majority of these models use KalmanFilter with another model. He et al. (2014), developed a neural network model for SOCprediction of the battery and usage Kalman Filter to reduce the error. Zheng and Fang(2015), also uses the unscented Kalman Filter with Relevance Vector Regression modelto make short term RUL prediction. These hybrid models improved the performance ofthe standalone models.
5
2.3 Data Driven Model
As technology progressed, the computing power enhanced, and sensor technology im-proved which made possible the collection and storage of data and many applications ofdata driven methods can be seen in RUL and SOC prediction of Li-ion batteries.
2.3.1 Support Vector Machine
Support vector machine is a kernel-based machine learning technique which is predomin-antly used for classification problems, but it can be used for regression problems as well.Battery profile is regressive in nature with linear and nonlinear part, so many papers usedthis concept to apply Support Vector Regressor (SVR) for the RUL and SOC prediction.SVR tries to map the non-linear feature in high dimension to treat it as linear. Patilet al. (2015), had used SVM for the RUL prediction. They have used two SVM model,first classifies the different discharging cycle into four groups and the later one is usedfor RUL prediction. Classifying SVM helps to recognise the suitable discharge cycle forRUL prediction, based on this data for the SVR is prepared. Classifying SVM uses theradial basis function kernel while the regression one is tested on Gaussian, exponential,hyperbolic and multilayer perceptron kernel out of which perceptron kernel gave the bestresults. These models are compared with respect to their accuracy.
Li et al. (2017), also used SVM model for the RUL prediction of the Li-ion batteries.This model uses the relation between RUL and internal resistance, capacity, derivativevoltage, terminal voltage relation for the prediction. Applied SVM model gave 95%accuracy and it is compared with the neural network with forty neurons. The resultsof the SVM are better than the neural network but this cannot be considered a faircomparison as used neural network is very novice and if comparison is to be made itshould be with the state of art. Although SVM are performed well but they are highlysensitive to data and their performance with unseen data changes considerably, whichcannot be considered as a robust model.
2.3.2 Naıve Bayes
Ng et al. (2014), presented a naıve Bayes model for RUL prediction. Its results arecompared with SVM model, Naıve Bayes model gives competitive results and it is morerobust to different kind of data unlike the SVM model. In this paper different set ofdata is made using Bayes probability theorem and they future used for the prediction.They have not used capacity as their target variable instead they used the number ofcycles remaining as dependent variable. So, now this becomes regression problem whichis predicted using Bayes approach. Result are almost comparable to SVM model withmajority of the cases achieving same or better RMSE value than the SVM model.
2.3.3 Neural Networks
Neural networks have gained popularity in machine learning and data analytics domainbecause of its self-learning capabilities. In academia there have been many papers whichpresent different kind of neural nets to predict SOH and RUL of the Li-ion batteries.
Chemali et al. (2018), presented a DNN model with three layers to estimate the SOC ofthe Li-ion battery. It gives quite competitive result. The focus of this paper is to developa model which can be used in electrical vehicles, the model initially requires considerable
6

time for training but once the model is trained, that is it has found the weights thenit can be very fast in prediction of SOC and RUL with appropriate hardware and thiscan be used in online methods too. It has used the early stopping method to avoidthe overfitting. This research focused on one battery and take care of different ambienttemperature that means model is robust to different temperature, other than this theyhave introduce noise into the data which make final model robust to noise, which maybe entered during to different operating conditions. This does not provide a generalizemodel which can be used with different batteries. Other than this, it shows that neuralnetwork can be a good choice for health monitoring of the batteries.
Zhang et al. (2018), used Long Short-Term Memory Recurrent Neural Network (LSTMRNN) for RUL prediction of batteries. In this they have generated data under differentambient temperature and as the goal is to plot degradation characteristics of battery, theyhave used different current rate for discharging. For 25◦ C ambient temperature dischar-ging current rate is 1C and 2C while for 40◦ C current rate is 1 C and 3.5 C. Presentedmodel have gated LSTM RNN architecture with root mean square prop backpropagationmethod and a Monte Carlo simulation unit to introduce noise to make model resilient todifferent type of noises. This model performed better than previous SVM models ParticleFilter models. As data travels sequentially in LSTM RNN network so there is alwaysa chances of vanishing gradients which is solved by gated architecture but still researchhave shown that attention-based model can outperform these networks.
Many research have used NASA battery dataset with different neural networks andachieved good results for the RUL and SOH of Li-ion batteries. This gives a boost to thedecision of selecting NASA battery dataset for this research. Shen et al. (2020), uses DeepConvolutional Neural Network (DCNN) for health prognostics of Li-ion batteries. Theyused transfer learning method to ensure that even partial charging cycle data should beenough to make the prediction on unseen data. They have used data from multiple Li-ionbatteries to build a DCNN model, then weight learned from this pretrained model is usedfor transfer learning, in this there are three different DCNN Transfer Learning modelswhich are ensembled to make the final prediction about the capacity of the battery. So,this ensemble model is trained on relatively smaller target data and based on this, the finalcapacity prediction is made on NASA dataset. Finally, they compared the result fromDCNN-ETL with random forest regression model, Gaussian process regression model andother DCNN models based on their RMSE values, results from DCNN-ETL models arebetter than others. This model emphasises on online prediction for Li-ion batteries, butit needs enormous diverse data for pre-training, which is quite difficult to get even afterthat the final prediction may be very subjective.
Qu et al. (2019), presented a LSTM based model for SOH and RUL prediction, thereapproach is to identify shortcomings of previous LSTM models and come up with thesolution for each and finally make a model in combination with these components whichhelps to improve the performance of LSTM model. In LSTM models sliding windowapproach is used to make the prediction so one can say that only a particular set offeatures are involved in prediction to further generalise this process attention mechanismis used which improved the LSTM performance, they also have used particle swarmoptimization and to cater the noise in battery data Complete Ensemble Empirical ModeDecomposition with Adaptive Noise (CEEMDAN) is used, which take care of noisesintroduce due to different operating environment. For this they have used NASA batterydataset and results are better than Simple Recurrent Neural Network (RNN), simpleLSTM models and Relevance Vector Machine, evaluation are made based on RMSE.
7

Wang et al. (2018), also presented a LSTM model on the NASA dataset. This paper usesSpearman Correlation based Li-ion battery health indices to extract the features from thecharging and discharging cycle. It uses a memory cell structure to address the problems ofvanishing gradient and exploding gradient. Proposed Dynamic Long Short-Term Memory(DLSTM) model is evaluated based on the RMSE value.
From the literature one can say that DNN, CNN and LSTM are the common neuralnetworks for the prediction of RUL of Li-ion batteries. However, these all methods havesome limitations like DNN models are specific to a battery that limits its uses in real lifeapplications. CNN requires large data and often suffers from the overfitting while LSTMmodel have critical window selection task which is very research specific. Other thanthis battery’s nonzero relaxation time makes implementation of LSTM difficult due tocapacity regeneration phenomenon. So, using Autoencoder one tackles the complex gatestructure of LSTM, capacity regeneration problem in recurrent neural networks and timevector data fusion with other parameter of batteries (Qin et al.; 2016).PA-LSTM andDLSTM are the best performing model when compared with the other neural networkbased techniques (Qu et al.; 2019; Wang et al.; 2018).
3 Methodology
In presented research, Knowledge Discovery in Database (KDD) methodology is followedfor prediction of RUL of Li-ion battery (Fayyad et al.; 1996). However, SEMMA and KDDare almost equivalent, but steps of KDD are more suitable for this research (Azevedo andSantos; 2008). Other data mining methodology is Cross Industry Standard Process forData Mining (CRISP-DM), it’s initial phase is focused on understanding the objective andrequirement of the project from business point of view and in final stage full deployment inincluded but this project understood the objective from academic point of view while alsoknowing its business implication. This project does not provide an account on deploymentof used models on some IT system in business setup, but it derives the knowledge whichshow it is useful way to predict RUL and it has applicability in real systems.
3.1 Data Selection
In order to predict RUL of any device or systems usually uses three kind of dataset
1. Dataset have reading from entire life span of the system.
2. Dataset have only failure reading.
3. Dataset have few readings and their threshold is already defined.
This research uses the NASA AMES Centre battery dataset (Goebel et al.; 2008). Thisdataset has four battery reading B005, B006, B007 and B0018. Each battery has charging,discharging and impedance profile of multiple cycles and given threshold condition isreduction in battery capacity by 30% of its rated capacity. Batteries in the datasetare 18650-size Li-ion cells that which are used in studies at Idaho National Laboratory.These tests were done under controlled ambient temperature. These files are in MATLABformat which are converted into json format for better readability and usability in python.The selection of this dataset is also motivated by the fact that this is one of the mostused datasets for different deep learning network like LSTM, DNN for health monitoring
8

of the Li-ion battery. That means it can be used for neural network although it is verysmall but other paper have achieved good result on the same data. Other than this thisdataset comes from one of the renowned institution NASA and it is publicly available,so there is not much ethical issue regarding it.3 The dataset is of batteries, there is nopersonal type of information, so it does not raise any question under GDPR. Descriptionof Charging, Discharging and Impedance cycle of Li-ion battery in selected dataset.
• Charging Cycle: Li-ion batteries are rechargeable so they are recharge by constantvoltage or constant current source. In this dataset Charging of the batteries aredone under constant current of 1.5A until the voltage reached to 4.2V (single batterycell’s maximum voltage) and then it is continued under this voltage until currentdropped to 20mA.
• Discharging Cycle: The process of using stored energy in Li-ion battery is calleddischarging cycle. In this dataset discharging is done at constant current of 2A untilbattery voltages of B005 reached 2.7V, B006 reached 2.5V, B007 reached 2.2V andB0018 reached 2.5 V.
• Impedance Cycle: Impedance measurements are taken by Electrochemical Im-pedance Spectroscopy (EIS) and selected frequency are from 0.1 Hz to 5kHz.
Table 1: Different Batteries and their Number of Cycle.Batteries Number of Cycles
B005 168B006 168B007 168B0018 132
3.2 Data Preparation
Original dataset is in .mat format, in which data is stored in hierarchical format. For theeasy usage and make it readable in python, it is converted into json file by enumeratingdata from MATLAB file to dictionary using loadmat from the SciPy library. For charging,discharging cycle separate json file is created which have cycle as key and inside each cyclevarious reading are captured regarding that particular cycle. Data is captured till thebattery’s capacity reached to the threshold condition.
3.3 Feature Selection
The dataset contains multiple charging and discharging cycle and each cycle have differentdatapoints. They cannot be used directly for the model creation, instead feature needs tobe equal in each cycle. To address this, one option is to take some points randomly formeach cycle, but it always has risk of losing the important data, so the approach needsto be backed up by the behaviour of the Li-ion battery. Feature extracted must retainthe battery’s behaviour so that a good prediction can be obtained from the data. Other
3https://ti.arc.nasa.gov/tech/dash/groups/pcoe/prognostic-data-repository/
9

than this, these extracted features requires to remain reliable for all operating conditionand for other similar batteries, then only the batteries appropriate degradation can bemapped.
To ensure that all these conditions are met, Lu et al. (2014) described the conceptof geometric metric to estimate the capacity of battery based on their voltage, currentand temperature profile. If the capacity estimation is correct one can say that the setof extracted features are accurately representing the charging and discharging of Li-ion battery over their lifetime. Ibid have used same NASA battery dataset to defineGeometric features of the Li-ion battery. These features were successful in mapping thecapacity degradation. The geometric feature were also used in other published work(Ren et al.; 2018). These features can be interpreted as time when voltage reached itsmaximum value, in our case it is 4.2V, time when current started to drop and time whenmax temperature reached under operating ambient conditions. These geometric featureswere able to depict the capacity degradation of Li-ion battery under various operatingand aging condition. Thus, based on this concept data point is extracted from eachcharging and discharging cycle and collated to make the final data for feature fusion inautoencoder.
These geometric features can be seen, tracking the time-based relationship betweeninternal parameters of battery with each charging discharging cycle. In Figure 2(1), onecan see that during charging the maximum voltage get delayed as the number of cycleincreases. Similarly, for temperature as the battery get old it takes more and more timeto reach same maximum temperature. During discharging similar trend is followed forvoltage and current as the battery get old discharging process become quick. This is canbe seen for all the parameter as shown in Figure 2.
All the feature were extracted based on below equations.For Charging Cycle,
Batteries terminal voltage is according to equation (1):
(ti, vi), s.t. vi ≥ 4.2V i = 1, 2, 3, 4 . . . n (1)
In the above equation (t) is a time when the battery voltage reaches the max-imum value for the first time and (v) is the maximum voltage achieved by the bat-tery during charging cycle, (i) is no of cycle up to (n), which represent sample size.
Batteries terminal current is according to equation (2):
(ti, Ai), s.t. Ai ≤ 1.5Amp i = 1, 2, 3, 4 . . . n (2)
In the above equation (t) represent the time when the current started to drop.(A) is thevalue of the current when it started to drop.(n) is total sample size.
(ti, Ti) = ti, Ti at maxTi i = 1, 2, 3, 4 . . . n (3)
In the above equation, (t) is the time when the temperature reaches the maximum value.(T) is the maximum temperature of the battery during charging. max T is the maximumtemperature. (n) is sample size.
Batteries current at load is according to the equation (4):
(ti, Ai), s.t. Ai just before it drops i = 1, 2, 3, 4 . . . n (4)
10

Figure 2: Changes in Different Battery Parameter over the different Cycles
11

Where, (t) is time just before current starts to drop. (A) is value of current in Amp whenit started to drop. (n) is sample size.
(ti, vi) = (ti, vi) at vimax i = 1, 2, 3, 4 . . . n (5)
Where, (t) is time at which voltage at load reaches maximum value. (v) is value ofmaximum voltage at the load. (n) is number of samples.
For Discharging cycles,Batteries terminal voltage is according to equation (6):
(ti, vi) = (ti, vi) at vimin i = 1, 2, 3, 4 . . . n (6)
Where,(t) is time when batteries voltage reaches its minimum value. (v) is minimumvoltage of battery during discharging. (n) is sample size.
Batteries terminal current is according to equation (7):
(ti, Ai), s.t. Ai > −2A i = 1, 2, 3, 4 . . . n (7)
Where,(t) is time when the terminal current gradually start increasing. (A) is value ofcurrent when it start increasing. (n) is sample size.
Batteries Temperature is according to equation(8):
(ti, Ti) = ti, Ti at maxTi i = 1, 2, 3, 4 . . . n (8)
Where, (t) is time at which temperature reaches its maximum value. (T) maximumtemperature value achieved by battery during discharging. (n) is sample size.
Batteries current at load is according to equation (9):
(ti, Ai), s.t. Ai > −2A i = 1, 2, 3, 4 . . . n (9)
Where,(t) is time when the current at load gradually start increasing. (A) is value ofcurrent measured at load when it start increasing. (n) is sample size.
Batteries voltage at load during discharging is according to equation (10):
(ti, vi) = {(ti, vi) at min(vi) s.t. vi 6= 0} i = 1, 2, 3 . . . n (10)
(t) is time when voltage is minimum but not zero. (v) non zero minimum voltagevalue. (n) is sample size.
This give 20-dimensional dataset, corresponding capacity of batteries also added intothis so the final data is 21-dimensional.
3.4 Data Mining
This paper predicts the RUL of Li-ion battery in term of remaining cycle. Batteryused are mostly having 168 cycle as their end of life cycle. So, it is a regression kindof problem where a number will be predicted for the RUL of battery. For this paperhas used autoencoder which will firstly reduce the dimension along with the fusion offeatures. Data from the autoencoder is then used in another simple neural network forRUL prediction.
12

3.5 RUL Calculation for Training of the Prediction Model
Before passing the data to prediction model, calculation of RUL is required, this datasethave reading till the battery reaches to their end of life criteria. For example B005 has168 cycles let’s call it (n), let’s say battery for prediction is currently in ith cycle, RULcan be calculated as
RULi = n + 1− i Where, (0 < i < n) (11)
At this stage final data for prediction model is converted into supervised dataset withcorresponding reading of RUL of the battery using equation (11).
3.6 Data Normalization
In process of model creation often feature have different ranges, which may introducesome error into the result. To avoid this paper uses data normalization technique, whereall the data is normalized in the range of 0 to 1 using minimum maximum normalizationtechnique (Galea and Capelo; 2018).
Xnormalized =x− xmin
xmax − xmin
(12)
It is widely used normalization techniques it ensures that all the data are in samescale on other hand it is less effective with the outlier but in present case outlier are notthe concern.
3.7 Evaluation
As the problem in hand is regression type, so to evaluate the performance of the model R-square and Mean Square Error (MSE) are taken and based on this caparison will be donewith other models. R-square indicate the variability explained by the features selected forthe model. It ranges between 0 to 1. Otherwise this value is converted into percentage.MSE indicate the quality of the prediction. Smaller the MSE better the prediction.
4 Design Specification
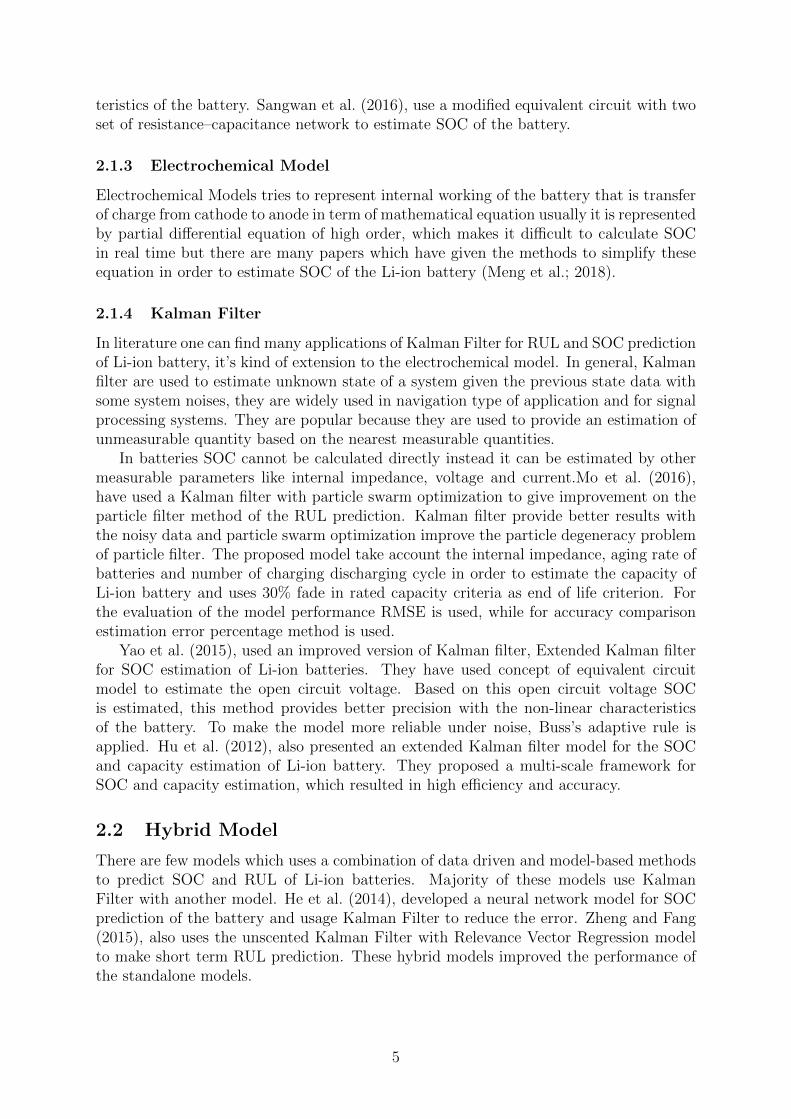
Process flow of this paper is presented in figure 3. The entire model developing processdivided into three parts viz. Feature Extraction, Feature Fusion and RUL prediction.
4.1 Feature Extraction
In this part battery data is converted into json data format. From json file based onthe concept of geometric feature of the Li-ion batteries a set of 21 feature are extractedfrom the data. It has observations of voltage, current and temperature for each charging,discharging cycle with their corresponding time values. These time-based features arethe reason for the use of LSTM and RNN model for SOC and RUL prediction, whichare suffered by capacity regeneration and complex gate selection methodology. This isavoided in presented research by use of the autoencoder in the feature fusion section.
13
Figure 3: Process Flow for RUL Prediction
4.2 Feature Fusion
In this part paper uses Autoencoder which solves multiple complications like it reducesthe dimension of data, it learns the time-based representation of the features, it does notget affected by non-zero relaxation time of the Li-ion batteries. Autoencoder are unsu-pervised techniques which means they do not need labelled data to learn the feature withappropriate architecture they can learned the feature from the data itself (Goodfellowet al.; 2016). Autoencoder have symmetrical structure that is input, and output layerare similar. They are designed in such a way that their central layer is smaller than the
14

encoder and decoder (as shown in Figure 4). When the output from the decoder is sameto the input at encoder layer then the network have learned the weights and this centrallayer can be used for further analysis.
Figure 4: Autoencoder Architecture
Autoencoder used in this paper have (Rectified Linear Unit) ReLU at encoder sideand sigmoid at the output size as activation function. When autoencoder is used asdimensionality reduction it can be compared with the Principle Component Analysis(PCA) only difference is activation function. PCA uses Gaussian distribution whichextract linear features while in this case ReLU and Sigmoid extract linear as well asnonlinear characteristics. Performance of the autoencoder in dimensionality reductionwith non-linear data is better than other commonly used methods (Goodfellow et al.;2016). It fit the purpose as batteries have nonlinear nature. To control the encoder anddecoder layer Mean Squared Error is used as loss function and adadelta as optimizer.From the hidden layer 15-dimensional data is extracted when the networks encoder anddecoder are very close. We do not want exact replica as that will mean that network hasoverfit.
4.3 RUL Prediction
After getting 15-dimensional data from the Autoencoder which is fused with time char-acteristic of battery parameters. Data is converted from unsupervised to supervised byadding the RUL data. RUL is number of cycle battery going to last before it becomesdis-functional.For this a simple deep neural network is used which have three dense layerinput layer has 512 neurons with ReLU as activation function, then next layer is dropoutlayer and output layer has one neuron with sigmoid activation function.This final layergives the RUL value for corresponding input features.
15

5 Implementation
This parts support document is mentioned in the design manual of the paper. For entireresearch coding is done in python using jupyter notebook and google colab.
5.1 Data Processing
First thing was to convert MATLAB file into json file so that it can be opened in Python.All the data related work is done in Jupyter Notebook.
After this feature were extracted based on the equations in section 3.3. From eachcycle data was stored in different list, each equation provided two set of features, in total20 feature were collated from the data and converted into csv file one for each battery.This step was tedious as generalizing each cycle required lots of testing with differentcycle. This was done based on trial and errors and finally condition was derived for theloop coding during the feature extraction process. Last feature is derived by multiplyingmaximum terminal voltage and current. This represents corresponding capacity of thebattery. So, paper uses these 21-dimensional data for the model creation.
5.2 Model Training and Testing
This step is performed using google colab which help in quick training and testing ofmodel. Autoencoder and neural network is created based on architecture discussed insection 4.2. Files from all the battery joined to make a single file. At this stage data issplit into training and testing set. The splitting ratio is selected as 90% for training and10% for testing. High percentage of data was allotted to training as the used dataset isvery small and target was to train the model on maximum data. Then Autoencoder istrained on the data of batch size of 12 for 1000 epoch when the loss hit the approximateconstant state then training is stopped, and 15-dimensional feature are extracted fromthe hidden layer of autoencoder.
Figure 5 shows the model loss of autoencoder, validation loss closely follows the train-ing loss and becomes approximately constant at the later stage of the epochs. This meansdata is not overfitted or underfitted.
After this prediction phase starts; before starting the prediction, data is normalizedas discussed in section 3.6. RUL feature is added as target variable for the training ofNeural Network as explained in section 3.5. Neural Network architecture is created asexplained in section 4.3. This neural network uses ’Mean Squared Error’ as loss functionand ’adam’ as optimizer, batch size is 16 and trained for 500 epoch. Loss function of themodel becomes constant at the later stage of the operation (see Figure 6).
From this trained model final prediction is done on the test data. R-square and MeanSquared Error is calculated for the finally predicted RUL value.
6 Evaluation
As the RUL prediction is a regression problem so the evaluation can be done on the basisof the Mean Square Error (MSE) and R- Square values. MSE represent the deviationbetween predicted value and actual value, smaller the test MSE better is the prediction(James et al.; 2013a). R-Square explains the proportion of variation within predictedvalue (Y) explained by the independent set of features (James et al.; 2013b). It always lies
16

Figure 5: Training Model Loss of Autoencoder
Figure 6: Prediction Model Loss
between 0 to 1, if its value is near to 1, that means maximum proportion of variability inpredicted value is explained by the used model. In this paper used model gave maximumR-squared 95.7% and MSE is 0.0038 as shown in Table 2.
R-square and MSE is calculated for different set of test data and minimum R-squared87.05% and MSE is 0.0105. So, based on this one can say it is quite robust to differentset of testing data.
These results were also compared with the previous models on the same dataset.
17

Table 2: Evaluation of Prediction ModelEvaluation Parameter Minimum Value Maximum Value
R-square 87.05% 95.70%MSE 0.0105 0.003
6.1 Linear Regression Model
After extracting 15-dimensional data from the Autoencoder paper tried to use a simpleregression model for the RUL prediction it achieved competitive R-Square of around 90%,judging from the point of complexity and interpretability of the model it is quite goodresult.
6.2 Discussion
For RUL prediction earlier best-performing model was improved LSTM since the batteriescharging, discharging cycles have time dependent features, so the choice of LSTM wasobvious in order to retain the time data. This paper had argued how autoencoder canbe used with the time dependent features and the results shows it has been successfulup to a certain level since the results from the proposed model is comparable with thebest performing models of PA-LSTM, DLSTM and better than the ANN model ((Quet al.; 2019; Wang et al.; 2018). From Table 3 one can say that presented model is almostas good as the model with the best MSE. So, the autoencoder successfully learned thetime feature and compressed them into smaller dimension. As the dataset was small, sothere is always chances that autoencoder do not converge, that’s why data was used invery small batches in training phase. Other than this used dataset has only one ambienttemperature, so the final model will not be robust against different working temperature.This issue can easily be resolved by using data from different ambient temperature.
Table 3: Comparison Between State of Art RUL Prediction Deep Learning Model andAutoencoder-DNN Model
Model Mean Square ErrorAutoencoder+DNN 0.003
PA-LSTM 0.003DLSTM 0.002
ANN 0.009
This research was able to meet all objectives set during the starting phase of theresearch. Literature review section gives a brief historical evolution of RUL and SOCcalculation in batteries. Then in later part it focuses on current methods of deep neuralnetworks like ANN, LSTM etc. The big chunk of time was devoted to the data pointselection which is discussed in 3.3 great detail with the help of various mathematicalequations.
7 Conclusion and Future Work
This research was started with the aim of making an accurate prediction for RUL of Li-ionbatteries, which will make the battery health monitoring more reliable and intelligent.
18

This will help the electrical automobile industry, renewable energy plants etc. to main-tain environmental sustainability and progress towards the clean energy goal. Almost allthe objectives from this research are fulfilled. This research proves that it is possible torecognise, monitor and analyse the voltage, current, temperature and all other geomet-ric parameters. In this research, the geometric parameter of Li-ion batteries was usedsuccessfully to predict RUL with the time-based feature fusion using autoencoder. Itshows that autoencoder can be an effective tool to deal with numerical data or regressionproblems.
The used method has the comparative result with the state of art DLSTM and PA-LSTM models. It confirms the effectiveness of autoencoder in extracting non-linear char-acteristics. The extracted feature gave quite good results even with simple regressionprediction model which again validate the quality of the extracted feature.
Dataset used, has only one ambient temperature, so to make model more robust itneeds to be trained on dataset of other ambient temperatures. This research obtainedthe prediction only for the single cell of battery, while in real application usually a set ofcells are used. Hence, there is a room to further extend this methodology to predict theRUL of entire battery pack.
8 Acknowledgement
I would like to thank my supervisor Dr. Rashmi Gupta for her invaluable suggestions,support and feedback throughout the research. I would also thank the researcher atNASA AMES for publishing data publicly. Lastly, I would like to thank my family andfriends for keeping me motivated and focused.
References
Azevedo, A. I. R. L. and Santos, M. F. (2008). Kdd, semma and crisp-dm: a paralleloverview, IADS-DM .
Chemali, E., Kollmeyer, P. and Preindl, M. (2018). State-of-charge estimation of li-ionbatteries using deep neural networks: A machine learning approach, Journal of PowerSources 400: 242–255.
Fayyad, U. M., Piatetsky-Shapiro, G., Smyth, P. et al. (1996). Knowledge discovery anddata mining: Towards a unifying framework., KDD, Vol. 96, pp. 82–88.
Galea, A. and Capelo, L. (2018). Applied Deep Learning with Python: Use scikit-learn,TensorFlow, and Keras to create intelligent systems and machine learning solutions,Packt Publishing.URL: https://books.google.ie/books?id=dPFsDwAAQBAJ
Goebel, K., Saha, B., Saxena, A., Celaya, J. R. and Christophersen, J. P. (2008). Pro-gnostics in battery health management, IEEE Instrumentation Measurement Magazine11(4): 33–40.
Goodfellow, I., Bengio, Y. and Courville, A. (2016). Deep Learning, MIT Press. http:
//www.deeplearningbook.org.
19

He, W., Williard, N., Chen, C. and Pecht, M. (2014). State of charge estimation forli-ion batteries using neural network modeling and unscented kalman filter-based errorcancellation, International Journal of Electrical Power and Energy Systems 62: 783–791.
Hu, C., Youn, B. D. and Chung, J. (2012). A multiscale framework with extended kalmanfilter for lithium-ion battery soc and capacity estimation, Applied Energy 92: 694–704.
James, G., Witten, D., Hastie, T. and Tibshirani, R. (2013a). An Introduction to Stat-istical Learning: with Applications in R, Springer.URL: https://faculty.marshall.usc.edu/gareth-james/ISL/
James, G., Witten, D., Hastie, T. and Tibshirani, R. (2013b). An Introduction to Stat-istical Learning: with Applications in R, Springer.URL: https://faculty.marshall.usc.edu/gareth-james/ISL/
Li, X., Shu, X., Shen, J., Xiao, R., Yan, W. and Chen, Z. (2017). An on-board remaininguseful life estimation algorithm for lithium-ion batteries of electric vehicles, Energies10(5): 691.
Lu, C., Tao, L. and Fan, H. (2014). Li-ion battery capacity estimation: A geometricalapproach, Journal of power sources 261: 141–147.
Meng, J., Luo, G., Ricco, M., Swierczynski, M., Stroe, D.-I. and Teodorescu, R. (2018).Overview of lithium-ion battery modeling methods for state-of-charge estimation inelectrical vehicles, Applied Sciences 8(5).URL: https://www.mdpi.com/2076-3417/8/5/659
Mo, B., Yu, J., Tang, D., Liu, H. and Yu, J. (2016). A remaining useful life predic-tion approach for lithium-ion batteries using kalman filter and an improved particlefilter, 2016 IEEE International Conference on Prognostics and Health Management(ICPHM), pp. 1–5.
Ng, S. S., Xing, Y. and Tsui, K. L. (2014). A naive bayes model for robust remaininguseful life prediction of lithium-ion battery, Applied Energy 118: 114–123.
Patil, M. A., Tagade, P., Hariharan, K. S., Kolake, S. M., Song, T., Yeo, T. and Doo, S.(2015). A novel multistage support vector machine based approach for li ion batteryremaining useful life estimation, Applied energy 159: 285–297.
Qin, T., Zeng, S., Guo, J. and Skaf, Z. (2016). A rest time-based prognostic frameworkfor state of health estimation of lithium-ion batteries with regeneration phenomena,Energies 9(11): 896.
Qu, J., Liu, F., Ma, Y. and Fan, J. (2019). A neural-network-based method for rulprediction and soh monitoring of lithium-ion battery, IEEE Access 7: 87178–87191.
Ren, L., Zhao, L., Hong, S., Zhao, S., Wang, H. and Zhang, L. (2018). Remaininguseful life prediction for lithium-ion battery: A deep learning approach, IEEE Access6: 50587–50598.
20
Samadani, E., Farhad, S., Scott, W., Mastali, M., Gimenez, L., Fowler, M. and Fraser, R.(2015). Empirical modeling of lithium-ion batteries based on electrochemical impedancespectroscopy tests, Electrochimica Acta 160.
Sangwan, V., Sharma, A., Kumar, R. and Rathore, A. K. (2016). Equivalent circuit modelparameters estimation of li-ion battery: C-rate, soc and temperature effects, 2016 IEEEInternational Conference on Power Electronics, Drives and Energy Systems (PEDES),pp. 1–6.
Shen, S., Sadoughi, M., Li, M., Wang, Z. and Hu, C. (2020). Deep convolutionalneural networks with ensemble learning and transfer learning for capacity estimationof lithium-ion batteries, Applied Energy 260: 114296.
Vutetakis, D. G. and Viswanathan, V. V. (1995). Determining the state-of-health ofmaintenance-free aircraft batteries, Proceedings of the Tenth Annual Battery Confer-ence on Applications and Advances, pp. 13–18.
Wang, C., Lu, N., Wang, S., Cheng, Y. and Jiang, B. (2018). Dynamic long short-term memory neural-network-based indirect remaining-useful-life prognosis for satellitelithium-ion battery, Applied Sciences 8(11): 2078.
Yao, L. W., Aziz, J. A., Idris, N. R. N. and Alsofyani, I. M. (2015). Online batterymodeling for state-of-charge estimation using extended kalman filter with busse’s ad-aptive rule, IECON 2015 - 41st Annual Conference of the IEEE Industrial ElectronicsSociety, pp. 004742–004747.
Zhang, Y., Xiong, R., He, H. and Pecht, M. G. (2018). Long short-term memory recur-rent neural network for remaining useful life prediction of lithium-ion batteries, IEEETransactions on Vehicular Technology 67(7): 5695–5705.
Zheng, X. and Fang, H. (2015). An integrated unscented kalman filter and relevancevector regression approach for lithium-ion battery remaining useful life and short-termcapacity prediction, Reliability Engineering and System Safety 144.
21