prediction of lamb meat fatty acid composition using near-infrared reflectance spectroscopy (nirs)
TRANSCRIPT
Food Chemistry 127 (2011) 1280–1286
Contents lists available at ScienceDirect
Food Chemistry
journal homepage: www.elsevier .com/locate / foodchem
Analytical Methods
Prediction of lamb meat fatty acid composition using near-infrared reflectancespectroscopy (NIRS)
F. Guy, S. Prache, A. Thomas, D. Bauchart, D. Andueza ⇑Institut National de la Recherche Agronomique, INRA, UR1213 Herbivores, Site de Theix, F-63122 Saint-Genès-Champanelle, France
a r t i c l e i n f o
Article history:Received 22 February 2010Received in revised form 4 January 2011Accepted 22 January 2011Available online 27 January 2011
Keywords:LambMeatFatty acidsNIR spectroscopyGas-liquid chromatography
0308-8146/$ - see front matter � 2011 Elsevier Ltd. Adoi:10.1016/j.foodchem.2011.01.084
⇑ Corresponding author. Tel.: +33 4 73 62 40 71; faE-mail addresses: [email protected], don
(D. Andueza).
a b s t r a c t
The aim of this study was to assess the feasibility of near-infrared reflectance spectroscopy (NIRS) for pre-dicting lamb meat fatty acid composition. We compared ground vs. intact non-ground meat samples todetermine whether grinding and homogenisation of meat samples improved the performance of the pre-dictions. We used 76 male lambs, of which 32 were pasture-fed and 44 stall-fed with concentrate andhay. The reflectance spectrum of Longissimus lumborum muscle was measured at wavelengths between400 and 2500 nm. Predictions were better with ground than with intact muscle samples. NIRS accuratelypredicts several individual fatty acids (FA) (16:0, 18:0, 16:1 D9 cis, 17:1 D9 cis, 18:1 D9 cis, 18:1 D11 cisand 16:1 D9 trans) and several FA groups (total linear saturated FA, total branched saturated FA, total sat-urated FA, total cis monounsaturated FA (MUFA), total trans MUFA, total MUFA and total polyunsaturatedPUFA). These results show the potential of NIRS as a rapid, and convenient tool to predict the major FA inlamb meat.
� 2011 Elsevier Ltd. All rights reserved.
1. Introduction
Meat is an important source of fatty acids (FA) in the humandiet, especially of saturated fatty acids (SFA). However, when con-sumed in excess, SFA are linked to certain health disorders associ-ated with modern living, especially in developed countries. SomeSFA (12:0, 14:0, 16:0) have been shown to be associated with ahigher risk of cardiovascular accidents, although 18:0 has no ad-verse effect (Mensink, Zock, Kester, & Katan, 2003). Other workshows that SFA in excess of 14% of total energy supply increasesinsulin resistance, but has no detrimental effect below 10% (Vessbyet al., 2001). The French National Nutrition Health Program 2006–2010 aims to reduce human consumption of SFA by 25%. Anotherfeature of ruminant products is the presence of trans monounsatu-rated fatty acids (trans MUFA). The trans MUFA, abundant inhuman foods, are known to be generally more atherogenic thanSFA (Sacks & Katan, 2002). However, the risk to human health var-ies widely according to the origin of trans FA. The ‘‘industrial’’ transFA, rich in 18:1 D9 trans and D10 trans isomers, apparently in-crease cardiovascular accident risk, whereas the ‘‘natural’’ transFA in ruminant products, rich in 18:1 D11 trans, do not seem todo so in humans (see review of Lock, Parodi, & Baumann, 2005).However, the amount and composition of ‘‘natural’’ trans FA inruminant products are strongly modulated by animal feeding con-
ll rights reserved.
x: +33 4 73 62 41 [email protected]
ditions, such as composition of basal diet or lipid supplements(Bispo-Villar et al., 2009). By contrast, n-3 polyunsaturated fattyacids (n-3 PUFA), which are abundant in meat products, appearto be beneficial to consumer health, decreasing blood pressure,triglyceridemia, morbidity and mortality following cardio-vascularaccidents and tumour growth (Bougnoux, 1999). The AFSSA (www.afssa.fr) (Agence Française de Sécurité Sanitaire des Aliments) re-port on n-3 PUFA recommends a ratio of n-6 PUFA to n-3 PUFAof about 5 for a balanced diet. Given current human diets in devel-oped countries, this means reducing n-6 PUFA while sustaining orincreasing n-3 PUFA. Nutritionally, another FA family is of interest;the conjugated linoleic acids (CLA). Some of these FA reduce fatdeposition in rodents and pigs (Pariza, 1999) and inhibit degener-ative cellular proliferation (Khanal & Olson, 2004).
There has accordingly been a growing interest in the FA profileof meat in recent years and in ways to control it by acting on var-ious factors, especially diet composition (Berthelot, Bas, & Schmid-ely, 2010; Scollan et al., 2005). Concurrently, there has been anincreasing demand from human nutritionists and dieticians, andalso from consumers, for more accurate and systematic informa-tion on the nutritional quality of foods.
In addition to its utility for diet authentication purposes (Dian,Andueza, Jestin, Prado, & Prache, 2008), NIRS has potential for rapidroutine measurements of meat FA composition. NIRS has beenused to determine the total fat and FA composition of rabbit meat(Pla, Hernández, Ariño, Ramírez, & Díaz, 2007), chicken (Berzaghi,Della Zotte, Jansson, & Andrighetto, 2005) and pork (Pérez-Marín,De Pedro, Guerrero-Ginel, & Garrido-Varo, 2009) or pork products
F. Guy et al. / Food Chemistry 127 (2011) 1280–1286 1281
(Fernandez-Cabanas, Polvillo, Rodriguez-Acuña, Botella, & Horcada,2011). Information on the FA analysis of ruminant products byNIRS is relatively scant and mainly concerns FA prediction for milk(Coppa et al., 2010) and cheese (Lucas, Andueza, Ferlay, & Martin,2008) and for bovine meat (Realini, Duckett, & Windham, 2004;Sierra et al., 2008; Windham & Morrison, 1998).
The current reference method for analysis of meat FA composi-tion by gas-liquid chromatography (GLC) requires work-up, such assolvent extraction and derivatization. The method performs well,but is polluting, costly and time-consuming, whereas NIRS analysisis simple, fast and chemical-free.
The aim of the present study was to determine whether NIRSwas feasible for accurate predictions of lamb meat FA. We com-pared two preparations of meat for NIRS analysis (ground vs. intact,non-ground meat samples).
2. Materials and methods
The lambs were raised at the experimental farm of the Monts-d’Auvergne Experimental Unit (UE1296), Site d’Orcival, of the INRACentre of Clermont-Ferrand Theix, France. The animals were han-dled by specialised staff to ensure their welfare in accordance withEuropean Union Directive No. 609/1986.
2.1. Animals, diets and slaughter procedures
A total of 76 Limousine male lambs were used, 32 pasture-fed(Group P) and 44 stall-fed (Group S); 28 were slaughtered in2005 (8 P and 20 S) and 48 in 2006 (24 P and 24 S).
We used both pasture-fed and stall-fed lambs to ensure a widevariability of meat FA composition. It is now well known that theintramuscular lipids from pasture-fed lambs contain more n-3PUFA and CLA and less n-6 PUFA and palmitic acid than the intra-muscular lipids from stall-fed lambs (Aurousseau, Bauchart, Cali-chon, Micol, & Priolo, 2004).
The experiment lasted from April to October in both years. The Slambs were fed ad libitum with a commercial concentrate and hay.The P lambs were offered permanent pasture ad libitum and theyreceived no supplementation at pasture. The same pasture wasused in both years and it was maintained in a leafy, green, vegeta-tive state. Animals were weaned at 75 and 90 d on average for Sand P lambs, respectively.
Lambs were slaughtered when they had reached a targetfat class of 2–3 (on a scale of 1–5), manually assessed by skilledtechnicians. The animals were transported by truck to the INRAslaughterhouse located within 25 km of the pasture and stalls.Immediately after their arrival the animals were electricallystunned and slaughtered by a throat cut. Carcasses were placedin a chiller at 4 �C until 24 h post mortem.
2.2. Measurements
2.2.1. Carcass measurements and samplingLambs were weighed just before slaughter. Carcass weight was
measured 24 h post mortem. The perirenal fat and the kidneys werethen removed from the carcass. The fat was separated from thekidneys using a knife and then weighed. Two samples of Longissi-mus lumborum were taken from each lamb at 24 h post mortem.The first one (10–20 g) was packed in aluminum foil, placed in aplastic bag under vacuum, and stored in a conventional freezer at�20 �C before NIRS scanning as an intact muscle sample. The sec-ond one (60–80 g) was cut into small pieces and frozen in liquidnitrogen. Muscle tissue samples were ground in liquid nitrogenin a mill (model M20, IKA-Werke, Staufen, Germany) to producea fine homogeneous powder. Ground muscle was divided into
two parts and stored at �80 �C for lipid and fatty acid analysisand NIRS scanning respectively.
2.2.2. Fatty acid analysis using gas-liquid chromatography (GLC): thereference method
Lamb L. lumborum muscle dry matter was assayed gravimetri-cally after drying at 80 �C for 48 h. Total lipids of L. lumborum mus-cle were extracted by mixing 6 g of muscle powder withchloroform–methanol according to the method of Folch, Lees,and Stanley (1957) and assayed gravimetrically. Total FA wereextracted and transmethylated from total lipids at 20 �C, first withNa methanolate for 20 min, and second with BF3-methanol 14% foran additional 20 min (Glass, 1971). Concentration and detailed FAcomposition of L. lumborum muscle samples were determined bygas–liquid chromatography (GLC) using the Peri 2100 chromato-graph model (Perichrom, Saulz-les-Chartreux, France) equippedwith a CP-Sil 88 glass capillary column (Varian, USA) (length100 m, ID 0.25 mm, H2 as carrier gas). Temperatures of the split/splitless injector and of the flame ionisation detector were 200and 230 �C respectively, and the oven temperature was pro-grammed as follows: 70 �C for 4 min, 70–175 �C at 20 �C/min,175 �C for 25 min, 175–215 �C at 10 �C/min and a final plateau at215 �C for 42 min. FA were quantified using 19:0 as the internalstandard. Identification of muscle FA was based on comparison ofthe retention time of individual FA with commercial standard ofindividual FA or FA mixtures (FAME Mix C4–C24) (Supelco, USA).The response coefficient of each individual FA was calculated usingthe quantitative mix C4–C24 FAME (Supelco, USA).
Standard error of the reference method (SERM) was assessed byanalysing, in triplicate, FA from total lipids of three lamb L. lumbo-rum muscles in the same single day. L. lumborum muscles werehere collected from three lambs, one of them stall-fed indoors withconcentrate and hay and the other two pasture-fed.
2.2.3. Reflectance spectrum of L. lumborum muscle in the visible andnear infrared range (400–2500 nm)
The reflectance spectrum of L. lumborum muscle in the visibleand near infrared range was measured on ground samples andon intact non-ground samples. The non-ground muscle samplewas a slice of intact muscle tissue. Ground and non-ground tissuesamples were thawed at room temperature for approximately 2 h.Portions weighing about 3 g were then scanned in the reflectancemode (400–2500 nm) in a NIRS 6500 scanning monochromator(NIRSystems, Silver Spring, MD, USA) using ISI software, version3.01, from Infrasoft International (Infrasoft International, SouthAtherton St. State College, PA 16801, USA) equipped with a spin-ning module. Muscle samples were scanned in a circular cup(diameter 50 mm, depth 10 mm) (Part number IH – 0307, NIRSys-tems, Infrasoft International, South Atherton St. State College, PA16801, USA), compressed and sealed with a disposable paper-backed wrap. Reflectance data were recorded at 2 nm intervalsand stored as log (1/reflectance).
2.3. Calibrations and statistics
Calibrations were performed using WinISI II version 1.60 (Infra-soft International, South Atherton St. State College, PA 16801, USA).NIR calibration equations were obtained by modified partial leastsquares (MPLS) regression using the range 400–2500 nm or700–2500 nm. To optimise the accuracy of the calibration, the dataunderwent (i) different combinations of scattering corrections(no correction, detrending, standard normal variate, standard nor-mal variate + detrending, multiplicative scatter correction) and(ii) mathematical pre-treatments (no derivative, first and secondderivatives applied on different gaps; 0,0,1,1; 1,4,4,1; 1,8,8,1;2,5,5,1 and 2,10,10,1; where the first digit is the number of the
1282 F. Guy et al. / Food Chemistry 127 (2011) 1280–1286
derivative, the second is the gap over which the derivative is calcu-lated, the third is the number of data points in the first smoothing,and the fourth is the number of data points in the second smooth-ing). Student’s t-test was used to identify outlier samples. In thecalibration process, samples were considered as outliers if theresidual between the reference method and the predicted valuewas larger than 2.5 times the standard error of calibration. Twoelimination passes were allowed. The models were then testedusing a cross-validation procedure in which a quarter of all sam-ples, randomly chosen, were temporarily removed from the initialdata set to be used for validation. This procedure was repeated fourtimes, i.e. until all data set samples had been used through the val-idation procedure. The cross-validation error of the models wascalculated. Analyses were performed using WinISI II version 1.6software (Infrasoft International, South Atherton St. State College,PA 16801, USA). The best combination of wavelength range, scat-tering correction and mathematical pre-treatment was selectedfor each constituent on the basis of the lowest standard error ofcross-validation (SECV). The statistics used to evaluate the calibra-tion models included SECV, coefficient of determination forcross-validation (R2CV) and the residual predictive deviation(RPD), defined as the ratio of standard deviation of reference datato the SECV (Williams & Sobering, 1993). For R2CV values, quanti-fications were considered poor if values were under 0.66, approx-imate between 0.66 and 0.81, good between 0.82 and 0.90 andexcellent above 0.91 (Karoui et al., 2006). The RPD statistic pro-vides a basis for standardising the standard error of prediction(SEP) (Williams & Sobering, 1993). RPD values should be as highas possible; RPD higher than 10 is considered as equivalent to
Table 1Descriptive statistics for total lipids and fatty acids (g/100 g fresh tissue) in lamb Longissiu
Constituent Mean Min
Total lipids 4.440 1.776Individual fatty acids (g/100 g fresh tissue muscle))14:0 0.142 0.02316:0 0.802 0.22418:0 0.537 0.17516:1 D9 cis 0.054 0.00517:1 D9 cis 0.028 0.00018:1 D9 cis 1.230 0.38818:1 D11 cis 0.043 0.01616:1 D9 trans 0.021 0.00518:1 D9 trans 0.015 0.00518:1 D10 + D11 trans 0.175 0.02718:2 n-6 0.151 0.05620:3 n-6 0.004 0.00020:4 n-6 0.024 0.00018:3 n-3 0.043 0.01420:5 n-3 0.009 0.00322:5 n-3 0.014 0.00522:6 n-3 0.004 0.0009cis,11trans-CLA 0.037 0.008
Fatty acid families (g/100 g fresh tissue muscle)Total linear saturated FA 1.578 0.483Total branched-chain saturated FA 0.057 0.015Total saturated FA 1.634 0.500Total cis MUFA 1.409 0.432Total trans MUFA 0.220 0.041Total MUFA 1.629 0.478Total n-6 PUFA 0.208 0.091Total n-3 PUFA 0.069 0.030Total PUFA 0.322 0.152Total CLA 0.043 0.009
Total linear saturated FA: 12:0 up to 24:0; Branched-chain saturated FA: iso [14 up to 18]14:1 D9cis + 15:1 D9cis + 16:1 D9cis + 17:1 D8 and D9cis + 18:1 D6cis up to D15cis + 20:MUFA: cis + trans MUFA; Total n-6 PUFA: 18:2n-6 + 18:3 n-6 + 20:2n-6 + 20:3n-6 + 20:43 + 20:5 n-3 + 22:3 n-3 + 22:4n-3 + 22:5n-3 + 22:6n-3; Total CLA: 9cis,11trans-CLA + 11cPUFA + CLA.
a Abbreviations: FA, fatty acids; Min, minimum; Max, maximum; SD, standard deviati
the reference method (Williams & Sobering, 1993). In ground grain,powdered materials, liquids or slurries, RPD values above 5 areconsidered adequate for quality control, and RPD values above2.5 are considered adequate for analytical purposes (Sinnaeve,Dardenne, Agneessens, & Biston, 1994).
3. Results
3.1. Animal characteristics
Lambs were slaughtered at mean age of 124 days (standarddeviation (SD) 28.6) and at a mean live weight of 37.0 kg SD3.34). Cold carcass weighed 16.2 kg on average (SD 2.28). Meandaily weight gain from birth to slaughter was 280 g/d (SD 71.6).Mean weight of perirenal fat was 237 g (SD 133.2).
3.2. Fatty acid composition measured using the GLC reference method
The range of intramuscular lipid FA concentration observed inthe database used and the SERM values are presented in Table 1.Oleic acid (18:1 D9 cis) was on average the most abundant FA(1.23 g/100 g of fresh muscle, ranging from 0.39 to 3.07 g/100 g).Palmitic acid (16:0) averaged 0.80 g/100 g, ranging from 0.22 to2.13 g/100 g, and stearic acid (18:0) averaged 0.54 g/100 g, rangingfrom 0.18 to 1.07 g/100 g. Mean SFA and MUFA contents were sim-ilar (1.63 g/100 g), whereas mean PUFA contents were 5 times low-er (0.32 g/100 g). CLA contents were low (0.04 g/100 g of muscle).
mus lumborum muscle samples of the database used (n = 76)a.
Max SD SERM
11.922 1.978 0.21
0.530 0.092 0.022.135 0.398 0.071.075 0.246 0.040.171 0.030 0.010.067 0.012 0.0033.070 0.565 0.110.112 0.018 0.0030.058 0.012 0.0010.040 0.008 0.0020.618 0.129 0.010.357 0.076 0.020.013 0.002 0.00050.045 0.007 0.0040.114 0.021 0.0050.018 0.004 0.0020.020 0.004 0.0030.008 0.002 0.0020.095 0.023 0.01
3.909 0.755 0.130.147 0.031 0.0034.056 0.784 0.133.527 0.647 0.130.727 0.151 0.014.057 0.785 0.140.455 0.091 0.020.157 0.027 0.010.621 0.116 0.040.113 0.028 0.005
+ anteiso [15 + 17]; Total saturated FA: linear + branched chain SFA; Total cis MUFA:1 D9cis + 22:1 D9cis; Total trans MUFA: 16:1 D9trans + 18:1D6 up to D16trans; totaln-6 + 22:2 n-6 + 22:4 n-6 + 22:5 n-6; Total n-3 PUFA: 18:3n-3 + 20:3n-3 + 20:4 n-
is,13trans-CLA + total cis,cis CLA + total trans,trans CLA; Total PUFA: n-6 PUFA + n-3
on; SERM: standard error of reference method.
F. Guy et al. / Food Chemistry 127 (2011) 1280–1286 1283
3.3. Muscle spectra
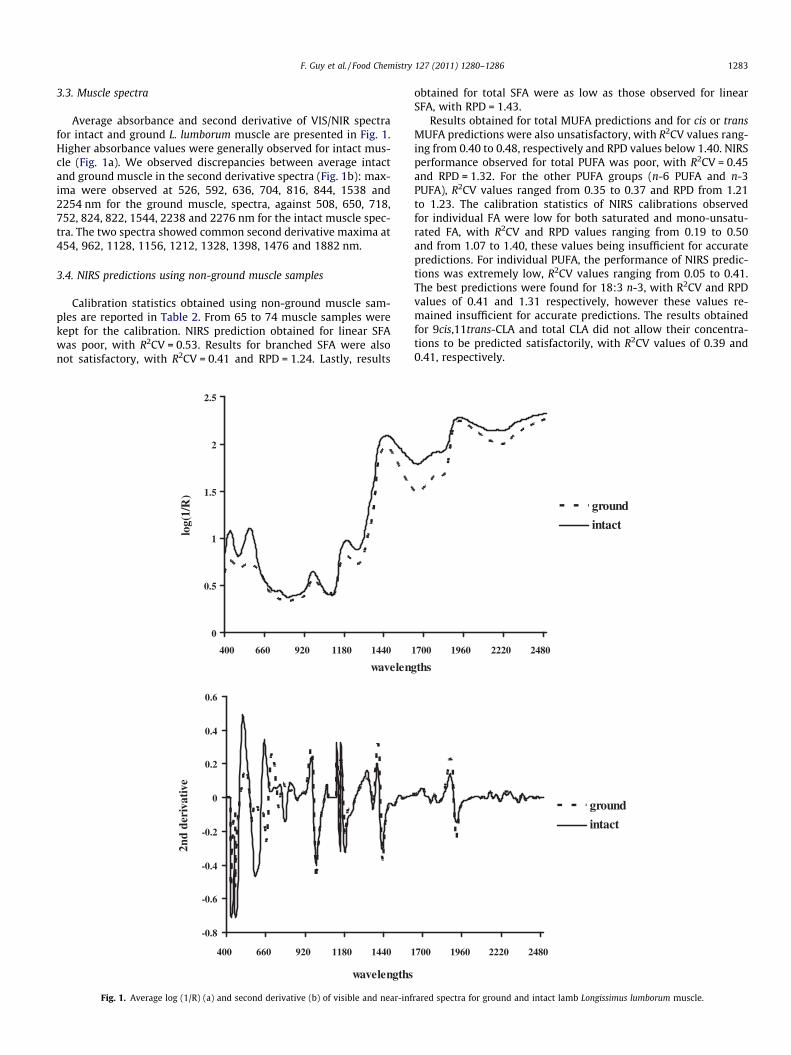
Average absorbance and second derivative of VIS/NIR spectrafor intact and ground L. lumborum muscle are presented in Fig. 1.Higher absorbance values were generally observed for intact mus-cle (Fig. 1a). We observed discrepancies between average intactand ground muscle in the second derivative spectra (Fig. 1b): max-ima were observed at 526, 592, 636, 704, 816, 844, 1538 and2254 nm for the ground muscle, spectra, against 508, 650, 718,752, 824, 822, 1544, 2238 and 2276 nm for the intact muscle spec-tra. The two spectra showed common second derivative maxima at454, 962, 1128, 1156, 1212, 1328, 1398, 1476 and 1882 nm.
3.4. NIRS predictions using non-ground muscle samples
Calibration statistics obtained using non-ground muscle sam-ples are reported in Table 2. From 65 to 74 muscle samples werekept for the calibration. NIRS prediction obtained for linear SFAwas poor, with R2CV = 0.53. Results for branched SFA were alsonot satisfactory, with R2CV = 0.41 and RPD = 1.24. Lastly, results
0
0.5
1
1.5
2
2.5
400 660 920 1180 1440
waveleng
log(
1/R
)
-0.8
-0.6
-0.4
-0.2
0
0.2
0.4
0.6
400 660 920 1180 1440 1
wavelengths
2nd
deri
vativ
e
Fig. 1. Average log (1/R) (a) and second derivative (b) of visible and near-inf
obtained for total SFA were as low as those observed for linearSFA, with RPD = 1.43.
Results obtained for total MUFA predictions and for cis or transMUFA predictions were also unsatisfactory, with R2CV values rang-ing from 0.40 to 0.48, respectively and RPD values below 1.40. NIRSperformance observed for total PUFA was poor, with R2CV = 0.45and RPD = 1.32. For the other PUFA groups (n-6 PUFA and n-3PUFA), R2CV values ranged from 0.35 to 0.37 and RPD from 1.21to 1.23. The calibration statistics of NIRS calibrations observedfor individual FA were low for both saturated and mono-unsatu-rated FA, with R2CV and RPD values ranging from 0.19 to 0.50and from 1.07 to 1.40, these values being insufficient for accuratepredictions. For individual PUFA, the performance of NIRS predic-tions was extremely low, R2CV values ranging from 0.05 to 0.41.The best predictions were found for 18:3 n-3, with R2CV and RPDvalues of 0.41 and 1.31 respectively, however these values re-mained insufficient for accurate predictions. The results obtainedfor 9cis,11trans-CLA and total CLA did not allow their concentra-tions to be predicted satisfactorily, with R2CV values of 0.39 and0.41, respectively.
1700 1960 2220 2480
ths
ground
intact
700 1960 2220 2480
ground
intact
rared spectra for ground and intact lamb Longissimus lumborum muscle.
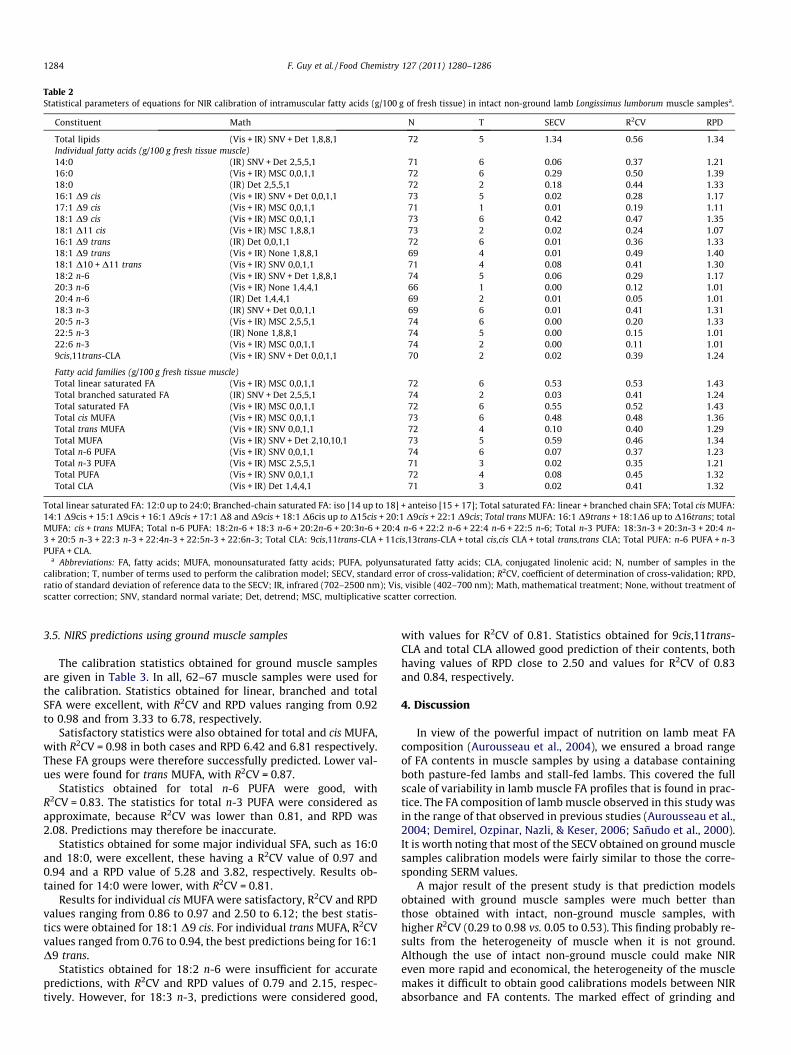
Table 2Statistical parameters of equations for NIR calibration of intramuscular fatty acids (g/100 g of fresh tissue) in intact non-ground lamb Longissimus lumborum muscle samplesa.
Constituent Math N T SECV R2CV RPD
Total lipids (Vis + IR) SNV + Det 1,8,8,1 72 5 1.34 0.56 1.34Individual fatty acids (g/100 g fresh tissue muscle)14:0 (IR) SNV + Det 2,5,5,1 71 6 0.06 0.37 1.2116:0 (Vis + IR) MSC 0,0,1,1 72 6 0.29 0.50 1.3918:0 (IR) Det 2,5,5,1 72 2 0.18 0.44 1.3316:1 D9 cis (Vis + IR) SNV + Det 0,0,1,1 73 5 0.02 0.28 1.1717:1 D9 cis (Vis + IR) MSC 0,0,1,1 71 1 0.01 0.19 1.1118:1 D9 cis (Vis + IR) MSC 0,0,1,1 73 6 0.42 0.47 1.3518:1 D11 cis (Vis + IR) MSC 1,8,8,1 73 2 0.02 0.24 1.0716:1 D9 trans (IR) Det 0,0,1,1 72 6 0.01 0.36 1.3318:1 D9 trans (Vis + IR) None 1,8,8,1 69 4 0.01 0.49 1.4018:1 D10 + D11 trans (Vis + IR) SNV 0,0,1,1 71 4 0.08 0.41 1.3018:2 n-6 (Vis + IR) SNV + Det 1,8,8,1 74 5 0.06 0.29 1.1720:3 n-6 (Vis + IR) None 1,4,4,1 66 1 0.00 0.12 1.0120:4 n-6 (IR) Det 1,4,4,1 69 2 0.01 0.05 1.0118:3 n-3 (IR) SNV + Det 0,0,1,1 69 6 0.01 0.41 1.3120:5 n-3 (Vis + IR) MSC 2,5,5,1 74 6 0.00 0.20 1.3322:5 n-3 (IR) None 1,8,8,1 74 5 0.00 0.15 1.0122:6 n-3 (Vis + IR) MSC 0,0,1,1 74 2 0.00 0.11 1.019cis,11trans-CLA (Vis + IR) SNV + Det 0,0,1,1 70 2 0.02 0.39 1.24
Fatty acid families (g/100 g fresh tissue muscle)Total linear saturated FA (Vis + IR) MSC 0,0,1,1 72 6 0.53 0.53 1.43Total branched saturated FA (IR) SNV + Det 2,5,5,1 74 2 0.03 0.41 1.24Total saturated FA (Vis + IR) MSC 0,0,1,1 72 6 0.55 0.52 1.43Total cis MUFA (Vis + IR) MSC 0,0,1,1 73 6 0.48 0.48 1.36Total trans MUFA (Vis + IR) SNV 0,0,1,1 72 4 0.10 0.40 1.29Total MUFA (Vis + IR) SNV + Det 2,10,10,1 73 5 0.59 0.46 1.34Total n-6 PUFA (Vis + IR) SNV 0,0,1,1 74 6 0.07 0.37 1.23Total n-3 PUFA (Vis + IR) MSC 2,5,5,1 71 3 0.02 0.35 1.21Total PUFA (Vis + IR) SNV 0,0,1,1 72 4 0.08 0.45 1.32Total CLA (Vis + IR) Det 1,4,4,1 71 3 0.02 0.41 1.32
Total linear saturated FA: 12:0 up to 24:0; Branched-chain saturated FA: iso [14 up to 18] + anteiso [15 + 17]; Total saturated FA: linear + branched chain SFA; Total cis MUFA:14:1 D9cis + 15:1 D9cis + 16:1 D9cis + 17:1 D8 and D9cis + 18:1 D6cis up to D15cis + 20:1 D9cis + 22:1 D9cis; Total trans MUFA: 16:1 D9trans + 18:1D6 up to D16trans; totalMUFA: cis + trans MUFA; Total n-6 PUFA: 18:2n-6 + 18:3 n-6 + 20:2n-6 + 20:3n-6 + 20:4 n-6 + 22:2 n-6 + 22:4 n-6 + 22:5 n-6; Total n-3 PUFA: 18:3n-3 + 20:3n-3 + 20:4 n-3 + 20:5 n-3 + 22:3 n-3 + 22:4n-3 + 22:5n-3 + 22:6n-3; Total CLA: 9cis,11trans-CLA + 11cis,13trans-CLA + total cis,cis CLA + total trans,trans CLA; Total PUFA: n-6 PUFA + n-3PUFA + CLA.
a Abbreviations: FA, fatty acids; MUFA, monounsaturated fatty acids; PUFA, polyunsaturated fatty acids; CLA, conjugated linolenic acid; N, number of samples in thecalibration; T, number of terms used to perform the calibration model; SECV, standard error of cross-validation; R2CV, coefficient of determination of cross-validation; RPD,ratio of standard deviation of reference data to the SECV; IR, infrared (702–2500 nm); Vis, visible (402–700 nm); Math, mathematical treatment; None, without treatment ofscatter correction; SNV, standard normal variate; Det, detrend; MSC, multiplicative scatter correction.
1284 F. Guy et al. / Food Chemistry 127 (2011) 1280–1286
3.5. NIRS predictions using ground muscle samples
The calibration statistics obtained for ground muscle samplesare given in Table 3. In all, 62–67 muscle samples were used forthe calibration. Statistics obtained for linear, branched and totalSFA were excellent, with R2CV and RPD values ranging from 0.92to 0.98 and from 3.33 to 6.78, respectively.
Satisfactory statistics were also obtained for total and cis MUFA,with R2CV = 0.98 in both cases and RPD 6.42 and 6.81 respectively.These FA groups were therefore successfully predicted. Lower val-ues were found for trans MUFA, with R2CV = 0.87.
Statistics obtained for total n-6 PUFA were good, withR2CV = 0.83. The statistics for total n-3 PUFA were considered asapproximate, because R2CV was lower than 0.81, and RPD was2.08. Predictions may therefore be inaccurate.
Statistics obtained for some major individual SFA, such as 16:0and 18:0, were excellent, these having a R2CV value of 0.97 and0.94 and a RPD value of 5.28 and 3.82, respectively. Results ob-tained for 14:0 were lower, with R2CV = 0.81.
Results for individual cis MUFA were satisfactory, R2CV and RPDvalues ranging from 0.86 to 0.97 and 2.50 to 6.12; the best statis-tics were obtained for 18:1 D9 cis. For individual trans MUFA, R2CVvalues ranged from 0.76 to 0.94, the best predictions being for 16:1D9 trans.
Statistics obtained for 18:2 n-6 were insufficient for accuratepredictions, with R2CV and RPD values of 0.79 and 2.15, respec-tively. However, for 18:3 n-3, predictions were considered good,
with values for R2CV of 0.81. Statistics obtained for 9cis,11trans-CLA and total CLA allowed good prediction of their contents, bothhaving values of RPD close to 2.50 and values for R2CV of 0.83and 0.84, respectively.
4. Discussion
In view of the powerful impact of nutrition on lamb meat FAcomposition (Aurousseau et al., 2004), we ensured a broad rangeof FA contents in muscle samples by using a database containingboth pasture-fed lambs and stall-fed lambs. This covered the fullscale of variability in lamb muscle FA profiles that is found in prac-tice. The FA composition of lamb muscle observed in this study wasin the range of that observed in previous studies (Aurousseau et al.,2004; Demirel, Ozpinar, Nazli, & Keser, 2006; Sañudo et al., 2000).It is worth noting that most of the SECV obtained on ground musclesamples calibration models were fairly similar to those the corre-sponding SERM values.
A major result of the present study is that prediction modelsobtained with ground muscle samples were much better thanthose obtained with intact, non-ground muscle samples, withhigher R2CV (0.29 to 0.98 vs. 0.05 to 0.53). This finding probably re-sults from the heterogeneity of muscle when it is not ground.Although the use of intact non-ground muscle could make NIReven more rapid and economical, the heterogeneity of the musclemakes it difficult to obtain good calibrations models between NIRabsorbance and FA contents. The marked effect of grinding and
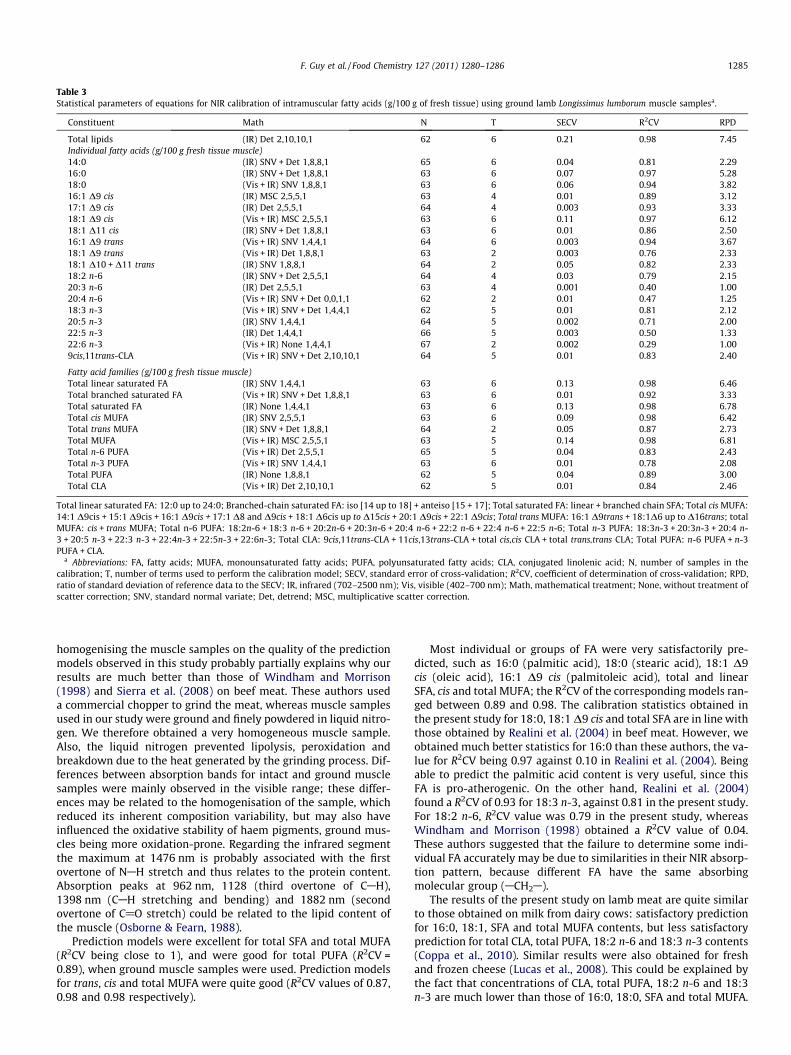
Table 3Statistical parameters of equations for NIR calibration of intramuscular fatty acids (g/100 g of fresh tissue) using ground lamb Longissimus lumborum muscle samplesa.
Constituent Math N T SECV R2CV RPD
Total lipids (IR) Det 2,10,10,1 62 6 0.21 0.98 7.45Individual fatty acids (g/100 g fresh tissue muscle)14:0 (IR) SNV + Det 1,8,8,1 65 6 0.04 0.81 2.2916:0 (IR) SNV + Det 1,8,8,1 63 6 0.07 0.97 5.2818:0 (Vis + IR) SNV 1,8,8,1 63 6 0.06 0.94 3.8216:1 D9 cis (IR) MSC 2,5,5,1 63 4 0.01 0.89 3.1217:1 D9 cis (IR) Det 2,5,5,1 64 4 0.003 0.93 3.3318:1 D9 cis (Vis + IR) MSC 2,5,5,1 63 6 0.11 0.97 6.1218:1 D11 cis (IR) SNV + Det 1,8,8,1 63 6 0.01 0.86 2.5016:1 D9 trans (Vis + IR) SNV 1,4,4,1 64 6 0.003 0.94 3.6718:1 D9 trans (Vis + IR) Det 1,8,8,1 63 2 0.003 0.76 2.3318:1 D10 + D11 trans (IR) SNV 1,8,8,1 64 2 0.05 0.82 2.3318:2 n-6 (IR) SNV + Det 2,5,5,1 64 4 0.03 0.79 2.1520:3 n-6 (IR) Det 2,5,5,1 63 4 0.001 0.40 1.0020:4 n-6 (Vis + IR) SNV + Det 0,0,1,1 62 2 0.01 0.47 1.2518:3 n-3 (Vis + IR) SNV + Det 1,4,4,1 62 5 0.01 0.81 2.1220:5 n-3 (IR) SNV 1,4,4,1 64 5 0.002 0.71 2.0022:5 n-3 (IR) Det 1,4,4,1 66 5 0.003 0.50 1.3322:6 n-3 (Vis + IR) None 1,4,4,1 67 2 0.002 0.29 1.009cis,11trans-CLA (Vis + IR) SNV + Det 2,10,10,1 64 5 0.01 0.83 2.40
Fatty acid families (g/100 g fresh tissue muscle)Total linear saturated FA (IR) SNV 1,4,4,1 63 6 0.13 0.98 6.46Total branched saturated FA (Vis + IR) SNV + Det 1,8,8,1 63 6 0.01 0.92 3.33Total saturated FA (IR) None 1,4,4,1 63 6 0.13 0.98 6.78Total cis MUFA (IR) SNV 2,5,5,1 63 6 0.09 0.98 6.42Total trans MUFA (IR) SNV + Det 1,8,8,1 64 2 0.05 0.87 2.73Total MUFA (Vis + IR) MSC 2,5,5,1 63 5 0.14 0.98 6.81Total n-6 PUFA (Vis + IR) Det 2,5,5,1 65 5 0.04 0.83 2.43Total n-3 PUFA (Vis + IR) SNV 1,4,4,1 63 6 0.01 0.78 2.08Total PUFA (IR) None 1,8,8,1 62 5 0.04 0.89 3.00Total CLA (Vis + IR) Det 2,10,10,1 62 5 0.01 0.84 2.46
Total linear saturated FA: 12:0 up to 24:0; Branched-chain saturated FA: iso [14 up to 18] + anteiso [15 + 17]; Total saturated FA: linear + branched chain SFA; Total cis MUFA:14:1 D9cis + 15:1 D9cis + 16:1 D9cis + 17:1 D8 and D9cis + 18:1 D6cis up to D15cis + 20:1 D9cis + 22:1 D9cis; Total trans MUFA: 16:1 D9trans + 18:1D6 up to D16trans; totalMUFA: cis + trans MUFA; Total n-6 PUFA: 18:2n-6 + 18:3 n-6 + 20:2n-6 + 20:3n-6 + 20:4 n-6 + 22:2 n-6 + 22:4 n-6 + 22:5 n-6; Total n-3 PUFA: 18:3n-3 + 20:3n-3 + 20:4 n-3 + 20:5 n-3 + 22:3 n-3 + 22:4n-3 + 22:5n-3 + 22:6n-3; Total CLA: 9cis,11trans-CLA + 11cis,13trans-CLA + total cis,cis CLA + total trans,trans CLA; Total PUFA: n-6 PUFA + n-3PUFA + CLA.
a Abbreviations: FA, fatty acids; MUFA, monounsaturated fatty acids; PUFA, polyunsaturated fatty acids; CLA, conjugated linolenic acid; N, number of samples in thecalibration; T, number of terms used to perform the calibration model; SECV, standard error of cross-validation; R2CV, coefficient of determination of cross-validation; RPD,ratio of standard deviation of reference data to the SECV; IR, infrared (702–2500 nm); Vis, visible (402–700 nm); Math, mathematical treatment; None, without treatment ofscatter correction; SNV, standard normal variate; Det, detrend; MSC, multiplicative scatter correction.
F. Guy et al. / Food Chemistry 127 (2011) 1280–1286 1285
homogenising the muscle samples on the quality of the predictionmodels observed in this study probably partially explains why ourresults are much better than those of Windham and Morrison(1998) and Sierra et al. (2008) on beef meat. These authors useda commercial chopper to grind the meat, whereas muscle samplesused in our study were ground and finely powdered in liquid nitro-gen. We therefore obtained a very homogeneous muscle sample.Also, the liquid nitrogen prevented lipolysis, peroxidation andbreakdown due to the heat generated by the grinding process. Dif-ferences between absorption bands for intact and ground musclesamples were mainly observed in the visible range; these differ-ences may be related to the homogenisation of the sample, whichreduced its inherent composition variability, but may also haveinfluenced the oxidative stability of haem pigments, ground mus-cles being more oxidation-prone. Regarding the infrared segmentthe maximum at 1476 nm is probably associated with the firstovertone of NAH stretch and thus relates to the protein content.Absorption peaks at 962 nm, 1128 (third overtone of CAH),1398 nm (CAH stretching and bending) and 1882 nm (secondovertone of C@O stretch) could be related to the lipid content ofthe muscle (Osborne & Fearn, 1988).
Prediction models were excellent for total SFA and total MUFA(R2CV being close to 1), and were good for total PUFA (R2CV =0.89), when ground muscle samples were used. Prediction modelsfor trans, cis and total MUFA were quite good (R2CV values of 0.87,0.98 and 0.98 respectively).
Most individual or groups of FA were very satisfactorily pre-dicted, such as 16:0 (palmitic acid), 18:0 (stearic acid), 18:1 D9cis (oleic acid), 16:1 D9 cis (palmitoleic acid), total and linearSFA, cis and total MUFA; the R2CV of the corresponding models ran-ged between 0.89 and 0.98. The calibration statistics obtained inthe present study for 18:0, 18:1 D9 cis and total SFA are in line withthose obtained by Realini et al. (2004) in beef meat. However, weobtained much better statistics for 16:0 than these authors, the va-lue for R2CV being 0.97 against 0.10 in Realini et al. (2004). Beingable to predict the palmitic acid content is very useful, since thisFA is pro-atherogenic. On the other hand, Realini et al. (2004)found a R2CV of 0.93 for 18:3 n-3, against 0.81 in the present study.For 18:2 n-6, R2CV value was 0.79 in the present study, whereasWindham and Morrison (1998) obtained a R2CV value of 0.04.These authors suggested that the failure to determine some indi-vidual FA accurately may be due to similarities in their NIR absorp-tion pattern, because different FA have the same absorbingmolecular group (ACH2A).
The results of the present study on lamb meat are quite similarto those obtained on milk from dairy cows: satisfactory predictionfor 16:0, 18:1, SFA and total MUFA contents, but less satisfactoryprediction for total CLA, total PUFA, 18:2 n-6 and 18:3 n-3 contents(Coppa et al., 2010). Similar results were also obtained for freshand frozen cheese (Lucas et al., 2008). This could be explained bythe fact that concentrations of CLA, total PUFA, 18:2 n-6 and 18:3n-3 are much lower than those of 16:0, 18:0, SFA and total MUFA.
1286 F. Guy et al. / Food Chemistry 127 (2011) 1280–1286
Further research may be directed to improving the quality of theprediction models in dairy and meat products using diets thatcan increase the concentrations of some minor FA. For example,with diets containing linseed or rapeseed in stall-fed lambs, Berth-elot et al. (2010) increased n-3 PUFA to up to 4.15% of total lipids,whereas the values observed in our study averaged 2.18% of totallipids.
5. Conclusion
This study was undertaken to evaluate the feasibility of usingNIRS to predict the FA contents of lamb meat. The results demon-strate that prediction models are much better using ground thanintact non-ground muscle samples. The statistics of the predictionmodels obtained on ground muscle samples vary according to FAcontent: satisfactory for FA groups or individual FA that are presentat medium-to-high concentrations (linear and total SFA, cis andtotal MUFA, 16:0, 18:0, 18:1 D9 cis, 18:1 D9 trans), but lower forFA which in general are present at low or very low concentrations(18:1 D9 trans, 18:2 n-6, 20:3 n-6, 20:5 n-3, 22:5 n-3, 22:6 n-3,total n-3 PUFA).
Acknowledgements
We thank J. Pourrat, M. Jestin, C Legay, J. Ballet and all the staffof the Monts d’Auvergne Experimental Unit (UE1296) and R. Jaillerand all the staff of the Experimental Slaughterhouse for their coop-eration in this study.
References
Aurousseau, B., Bauchart, D., Calichon, E., Micol, D., & Priolo, A. (2004). Effect of grassor concentrate feeding systems and rate of growth on triglyceride andphospholipid and their fatty acids in the M. Longissimus thoracis of lambs.Meat Science, 66(3), 531–541.
Berthelot, V., Bas, P., & Schmidely, P. (2010). Utilization of extruded of extrudedlinseed to modify fatty composition of intensively-reared lamb meat: Effect ofassociated cereals (wheat vs corn) and linoleic acid content of the diet. MeatScience, 84(1), 114–124.
Berzaghi, P., Della Zotte, A., Jansson, L. M., & Andrighetto, I. (2005). Near-infraredreflectance spectroscopy as a method to predict chemical composition of breastmeat and discriminate between different n-3 feeding sources. Poultry Science,84, 128–136.
Bispo-Villar, E., Thomas, A., Lyan, B., Gruffat, D., Durand, D., & Bauchart, D. (2009).Lipid supplements rich in n-3 polyunsaturated fatty acids deeply modify trans18:1 isomers in the Longissimus thoracis muscle of finishing bovine. In Y.Chilliard, F. Glasser, Y. Faulconnier, F. Bocquier, I. Veissier, & M. Doreau (Eds.),Ruminant Physiology. Digestion, metabolism, and effects of nutrition onreproduction and welfare. Proceedings of the 11th Intern. Symp. on RuminantPhysiology, 6–9th September 2009 (pp. 464–466). Wageningen: WageningenAcademic Publishers.
Bougnoux, P. (1999). N-3 polyunsaturated fatty acids and cancer. Current Opinion ofClinical Nutrition and Metabolism, 2, 121–126.
Coppa, M., Ferlay, A., Leroux, C., Jestin, M., Chilliard, M., Martin, B., et al. (2010).Prediction of milk fatty acid composition by Near Infrared ReflectanceSpectroscopy (NIRS). International Dairy Journal, 20, 182–189.
Demirel, G., Ozpinar, H., Nazli, B., & Keser, O. (2006). Fatty acids of lamb meatfrom two breeds fed different forage: Concentrate ratio. Meat Science, 72(2),229–235.
Dian, P. H. M., Andueza, D., Jestin, M., Prado, I. N., & Prache, S. (2008). Comparison ofvisible and near infrared reflectance spectroscopy to discriminate betweenpasture-fed and concentrate-fed lamb carcasses. Meat Science, 80(4),1157–1164.
Fernandez-Cabanas, V., Polvillo, O., Rodriguez-Acuña, R., Botella, B., & Horcada, A.(2011). Rapid determination of the fatty acid profile in pork dry-cured sausagesby NIR-spectroscopy. Food Chemistry, 124, 373–378.
Folch, J., Lees, M., & Stanley, G. H. S. (1957). A simple method for the isolation andpurification of total lipids from animal tissue. Journal of Biological Chemistry,226, 497–509.
Glass, R. L. (1971). Alcoholysis, saponification and the preparation of fatty acidmethyl esters. Lipids, 6, 919–925.
Karoui, R., Mouazen, A. M., Dufour, E., Pillonel, L., Picque, D., Bosset, J. O., et al.(2006). Mid-infrared spectrometry: A tool for the determination of chemicalparameters in Emmental cheeses produced during winter. Lait, 86, 83–97.
Khanal, R. C., & Olson, K. C. (2004). Factors affecting Conjugated Linoleic Acid (CLA)content in milk, meat and egg: A review. Pakistan Journal of Nutrition, 3–2,82–98.
Lock, A. L., Parodi, P. W., & Baumann, D. E. (2005). The biology of trans fatty acids:Implications for human health and the dairy industry. Australian Journal of DairyTechnology, 60(2), 25–32.
Lucas, A., Andueza, D., Ferlay, A., & Martin, B. (2008). Prediction of fatty acidcomposition of fresh and freeze-dried cheeses by visible-near-infraredreflectance spectroscopy. International Dairy Journal, 18(6), 595–604.
Mensink, R. P., Zock, P. L., Kester, A. D., & Katan, M. B. (2003). Effect of dietary acidsand carbohydrates on the ration of serum total to HDL cholesterol and on serumlipids and apolipoproteins: A meta analysis of 60 controlled trials. AmericanJournal of Clinical Nutrition, 77, 1146–1155.
Osborne, B. G., & Fearn, T. (1988). Near infrared spectroscopy in food analysis. Essex:Longman Scientific & Technical.
Pariza, P. W. (1999). Conjugated linoleic acid: The early years. Advances inConjugated Linoleic Acid Research, 1, 1–11.
Pérez-Marín, D., De Pedro, E., Guerrero-Ginel, J. E., & Garrido-Varo, A. (2009). Afeasibility study on the use of near-infrared spectroscopy for prediction of thefatty acid profile in live Iberian pigs and carcasses. Meat Science, 83, 627–633.
Pla, M., Hernández, P., Ariño, B., Ramírez, J. A., & Díaz, I. (2007). Prediction of fattyacid content in rabbit meat and discrimination between conventional andorganic production systems by NIRS methodology. Food Chemistry, 100(1),165–170.
Realini, C. E., Duckett, S. K., & Windham, W. R. (2004). Effect of vitamin C addition toground beef from grass-fed or grain-fed sources on color and lipid stability, andprediction of fatty acid composition by near-infrared reflectance analysis. MeatScience, 68, 35–43.
Sacks, F. M., & Katan, M. (2002). Randomized clinical trials on the effects of dietaryfat and carbohydrate on plasma lipoproteins cardiovascular disease. AmericanJournal of Medicine, 113, 13S–24S.
Sañudo, C., Enser, M. E., Campo, M. M., Nute, G. R., María, G., Sierra, I., et al. (2000).Fatty acid composition and sensory characteristics of lamb carcasses fromBritain and Spain. Meat Science, 54(4), 339–346.
Scollan, N., Richardson, I., De Smet, S., Moloney, A. P., Doreau, M., Bauchart, D et al.(2005). Enhancing the content of beneficial fatty acids in beef and consequencesfor meat quality. In J.F. Hocquette, S. Gigli (Eds.), Indicators of milk and beefquality, EAAP Publ. n 112 (pp. 151–162). Wageningen: Academic Publishers.
Sierra, V., Aldai, N., Castro, P., Osoro, K., Coto-Montes, A., & Oliván, M. (2008).Prediction of the fatty acid composition of beef by near infrared transmittancespectroscopy. Meat Science, 78, 248–255.
Sinnaeve, G., Dardenne, P., Agneessens, R., & Biston, R. (1994). The use of nearinfrared spectroscopy for the analysis of fresh grass silage. Journal of NearInfrared Spectroscopy, 2, 79–84.
Vessby, B., Unsitupa, M., Hermansen, K., Riccardi, G., Tapsell, L. C., Nälsén, C., et al.(2001). Substituting dietary saturated for monounsaturated fat impairs insulinsensitivity in healthy men and women. The KANWU study. Diabetologia, 44(3),312–319.
Williams, P. C., & Sobering, D. C. (1993). Comparison of commercial near infraredtransmittance and reflectance instruments for analysis of whole grains andseeds. Journal of Near Infrared Spectroscopy, 1, 25–32.
Windham, W. R., & Morrison, W. H. (1998). Prediction of fatty acid content in beefneck lean by near infrared reflectance analysis. Journal of Near InfraredSpectroscopy, 6, 229–234.