prediction of criticality in patients with severe covid …2020/02/27 · prediction of criticality...
TRANSCRIPT

Prediction of criticality in patients with severe Covid-19 infection using three clinical features: a machine learning-based prognostic model with clinical data in
Wuhan
Li Yan 1*, M.D., Hai-Tao Zhang 2*, Ph.D., Yang Xiao 2*, Ph.D., Maolin Wang 2, Yuqi Guo 2, Chuan Sun 2, Xiuchuan Tang 3, Liang Jing 1, Shusheng Li 1, Mingyang Zhang 2, Ying Xiao 2, Haosen Cao 2, Yanyan Chen 5, Tongxin Ren 6, Junyang Jin 6, Ph.D., Fang Wang 1, Yanru Xiao 1, Sufang Huang 1, Xi Tan 4, Niannian Huang 4, Bo Jiao 4, Yong Zhang 7, Ph.D., Ailin Luo 4, M.D., Zhiguo Cao 2, Ph.D., Hui Xu 4, M.D., and Ye Yuan 2, Ph.D.
1. Department of Emergency, Tongji Hospital of Tongji Medical College, Huazhong University of Science and Technology
2. School of Artificial Intelligence and Automation, Huazhong University of Science and Technology
3. School of Mechanical Science and Engineering, Huazhong University of Science and Technology
4. Department of Anesthesiology, Tongji Hospital of Tongji Medical College, Huazhong University of Science and Technology
5 Department of Information Management, Tongji Hospital of Tongji Medical College, Huazhong University of Science and Technology
6 Huazhong University of Science and Technology-Wuxi Research Institute
7 School of Information Science and Engineering, Wuhan University of Science and Technology
* Equal contribution.
Corresponding authors: Prof. Dr. Ye Yuan, School of Artificial Intelligence and Automation, Key Laboratory of Image Processing and Intelligent Control, State Key Laboratory of Digital Manufacturing Equipment and Technology, Huazhong University of Science and Technology, Wuhan 430074, P.R. China. Email: [email protected]. Prof. Dr. Hui Xu, Department of Anesthesiology, Tongji Hospital of Tongji Medical College of Huazhong University of Science and Technology, Wuhan 430074, P.R. China. Email: [email protected].
Abstract:
Background:
COVID-19 appeared in Wuhan, China in December 2019, and since then it has immediately become a serious public health problem worldwide. No specific medicine against COVID-19 has been found until now. However, mortality risk in patients could potentially be predicted before they transmit to critically ill.
Methods:
We screened the electronic records of 2,799 patients admitted in Tongji Hospital from January 10th to February 18th, 2020. There were 375 discharged patients including 201 survivors. We built a prognostic prediction model based on XGBoost machine learning algorithm and then tested 29 patients (included 3 patients from other hospital) who were cleared after February 19th.
Results:
The mean age of the 375 patients was 58.83 years old with 58.7% of males. Fever was the most common initial symptom (49.9%), followed by cough (13.9%), fatigue (3.7%), and dyspnea (2.1%). Our model identified three key clinical features, i.e., lactic dehydrogenase (LDH), lymphocyte and High-sensitivity C-reactive protein (hs-CRP), from a pool of more than 300 features. The clinical route is simple to check and can precisely and quickly assess the risk of death. Therefore, it is of great clinical significance.
. CC-BY-NC-ND 4.0 International licenseIt is made available under a is the author/funder, who has granted medRxiv a license to display the preprint in perpetuity. (which was not certified by peer review)
The copyright holder for this preprint this version posted March 1, 2020. .https://doi.org/10.1101/2020.02.27.20028027doi: medRxiv preprint

Conclusion:
The three indices-based prognostic prediction model we built is able to predict the mortality risk, and present a clinical route to the recognition of critical cases from severe cases. It can help doctors with early identification and intervention, thus potentially reducing mortality.
Keywords: COVID-19, Machine Learning, Clinical Route.
Funding: None.
Author’s contribution: L. Y. collected data; M. W., C. S., Y. G., X. T., H. Z., Y. X., Z. C., L. Y., H. X., Y. Y. discussed about the research; Y. Y., M. W., Y. G. discovered key features and clinical route; L. Y., H. Z., Y. X., H. X., Y. Y. drafted the manuscript; all authors provided critical review of the manuscript and approved the final draft for publication.
Conflict of interest: None declared.
Introduction
The outbreaks of COVID-19 epidemic has caused worldwide health concerns since December, 2019. It has been shown in literature [1, Error! Reference source not found.] that 26.1-32.0% of COVID-19 patients would develop to critically ill cases. Moreover, Yang et al. [Error! Reference source not found.] reported that the fatal rate of critically ill patients is astonishingly 61.5%. However, it is arduous to identify these patients manually from the infectious crowds. Hence, it is becoming an urgent yet challenging mission to identify the critically ill cases form the infectious crowds using clinical data with the assistance of machine learning approaches. Such a developed prognostic model could offer early treatment to critical patients, thus potentially reducing mortality.
Methods
Data resources
For this retrospective, single-center study, we collected the electronic records of 2,779 validated or suspected COVID-19 patients from January 10th to February 18th, 2020 at Tongji Hospital in Wuhan, China. We distilled epidemiological, demographic, clinical, laboratory, drugs, nursing record, and outcome data from electronic medical record. The clinical outcomes were followed up to February 18th.The study was approved by the Tongji Hospital Ethics Committee.
As shown in Figure 1, of the 2,779 individuals retained in our hospital, 2,259 cases were excluded as they were still in treatment before February 19th, 2020. Per the other 520 cases,
. CC-BY-NC-ND 4.0 International licenseIt is made available under a is the author/funder, who has granted medRxiv a license to display the preprint in perpetuity. (which was not certified by peer review)
The copyright holder for this preprint this version posted March 1, 2020. .https://doi.org/10.1101/2020.02.27.20028027doi: medRxiv preprint

375 ones including 201 survivors have complete data materials. Pregnant or breast-feeding women, younger than 18 years old were excluded.
After February 19th, 2020, there were 26 new cleared severe patients, which were thus picked for the test together with other 3 cleared severe patients from Ying Cheng People’s Hospital for testing. Note that all types of patients were included as samples for the study, whereas only severe patients were selected for testing.
Figure 1. A flowchart of patient enrollment.
Case definitions
We apply the following diagnostic criteria [4]:
1) Epidemiological history: Traveled or lived in Wuhan within 14 days before onset; Had contact with patients with fever and respiratory symptoms from Wuhan within 14 days before onset; Had contact with COVID-19 patients (positive for COVID-19 nucleic acid) within 14 days before onset; Or part of a familial cluster of onsets;
2) Clinical manifestations: Fever and/or respiratory symptoms; Normal or decreased total white blood cell count or decreased lymphocyte count during early stage of onset; Typical imaging features.
Subjects that meet any one epidemiological history or meet two clinical manifestations without epidemiological history are defined as suspected cases. Suspected cases with one of the following etiological evidence are defined as validated cases: 1) SARS-CoV-2 nucleic acid is positive in respiratory or blood samples detected by RT-PCR; 2) virus sequence
. CC-BY-NC-ND 4.0 International licenseIt is made available under a is the author/funder, who has granted medRxiv a license to display the preprint in perpetuity. (which was not certified by peer review)
The copyright holder for this preprint this version posted March 1, 2020. .https://doi.org/10.1101/2020.02.27.20028027doi: medRxiv preprint

detected in respiratory or blood samples shares high homology with the known sequence of SARS-CoV-2.
A case with one of the three following conditions is defined as critical case: 1) shock, 2) need mechanical ventilation and 3) admitted into ICU because of MODS. Severe case is defined as those who exhibit RR≥30bpm or SPO2 ≤93% on rest.
Statistical Analysis
The valid data after verification using Excel 2016 input was recovered, and double checked through SPSS 26.0 analysis data. The continuity variables of normal distribution were described by mean ± standard deviation, and the continuity variables of non-normal distribution were described by median and quartile.
First, the general data was tested for normality. The Kolmogorov-Smirnov test (K-S test for short) was used to examine whether the single sample is from a particular distribution, and then the single sample K-S test was used to test the normality of the general data. The test level α=0.05, and P <0.05 indicate that the sample does not fit a normal distribution. Because age, total protein, albumin, and calcium content satisfy normal distribution, after testing, mean ± standard deviation was used to describe their concentration trend. As other continuous variables are non-normal distribution, median was used to describe their concentration trend.
The performance of the model was first evaluated by assessing its predicted classification accuracy, and equaling the ratio of the test samples predicted correctly. The precision, sensitivity/recall and F1 score of each class are defined as below, in which n ∈ N represents the class, TP, TN, FP, and FN stand for true positive, true negative, false positive and false negative rates respectively:
Precesion+ =-.
-./0. (1)
Sensitivity+/Recall+ =-.
-./09 (2)
F1+ ==∗.?@ABCBD+E∗F@AGHHE.?@ABCBD+E/F@AGHHE
. (3)
Modeling and analysis of machine learning algorithm were performed using Python.
Machine learning model
In this study, a supervised XGBoost classifier [5] was chosen as the predictor, due to its superb pattern characterization and feature selection ability. As shown in Figure 2, its step-by-step procedure is detailed as below.
. CC-BY-NC-ND 4.0 International licenseIt is made available under a is the author/funder, who has granted medRxiv a license to display the preprint in perpetuity. (which was not certified by peer review)
The copyright holder for this preprint this version posted March 1, 2020. .https://doi.org/10.1101/2020.02.27.20028027doi: medRxiv preprint

Data Pre-processing: Imported patients’ data, used all clinical measurements of their last available date as features and set ‘survival’ and ‘death’ as labels for two classes. Used “-1” padding method to complement the incomplete clinical measures.
Figure 2. Flowchart of the XGBoost machine learning algorithm.
Model Training (Multi-tree XGBoost): Randomly split the selected two-class data into a training set and a validation set, according to the ratio of 7:3. Multi-tree XGBoost was trained with the parameters setting as the max depth with 4, the learning rate was equal 0.2, the tress number of estimators was set to 150, the value of the regularization parameter α was set to 1 and the ‘subsample’ and ‘colsample_bytree’ both were set to 0.9 to prevent overfitting when there were many features but the sample size was not large[5].
Feature Selection: Key features were ranked by Multi-tree XGBoost according to their importance (Supplementary Figure 1). Supplementary Algorithm 1 was applied to select three key features. Supplementary Figure 2 shows that when the number of top features increased to 4, there was no performance improvement. Therefore, the number of key features was set to 3, Multi-tree XGBoost was trained with the parameters setting as the max depth with 4, the learning rate was equal 0.2 and the value of the regularization parameter α was set to 1. We had deleted some parameters and kept other parameters unchanged because we had selected only a few features here, not needing to add some of the previous parameters here to prevent overfitting.
Explainable Model (Single-tree XGBoost): The XGBoost was applied for final prediction using only the three key features as well as setting the number of tree estimator to 1 (so that
. CC-BY-NC-ND 4.0 International licenseIt is made available under a is the author/funder, who has granted medRxiv a license to display the preprint in perpetuity. (which was not certified by peer review)
The copyright holder for this preprint this version posted March 1, 2020. .https://doi.org/10.1101/2020.02.27.20028027doi: medRxiv preprint

the model is explainable). We further removed those patients with incomplete measurements for any of these three features and obtained 351 patients out of 375. XGBoost was re-trained with the parameter setting as the tress number of estimators was set to 1, the values of the two regularization parameters α and β were both set to 0, and the subsample and max features both were set to 1.
Model Prediction: The trained model was used to predict sample class on the testing set. The predicted and ground-truth label of test set were used to calculate the standard metrics for prediction performance evaluation.
Ethics Approval
Data collection and analysis of cases and close contacts were approved by the Ethical Committee of Tongji Hospital, Tongji Medical College, Huazhong University of Science and Technology.
Results
Characteristics of the 375 patients
The mean age of the 375 patients was 58.83±16.46 years old with 58.7% of males. Fever was the most common initial symptom (49.9%), followed by cough (13.9%), fatigue (3.7%), and dyspnea (2.1%). The epidemiological history included Wuhan residents (37.9%), familial cluster (6.4%), and health workers (only 1.9%). Of the 375 patients, 46.1% were critical patients.
Table 1�Clinical characteristics of the studied patients. Items Value M(P25, P75)
Age 58.83±16.46
Sex
male 58.7�
female 40.3�
Epidemiological history
Wuhan residents 37.9�
Contact with confirm or suspected patients 0.5�
Familial cluster 6.4�
Health worker 1.9�
Contact with HUANAN seafood market 0.5�
Undefined contact history 52.8�
Symptoms on onset
fever 49.9�
cough 13.9�
fatigue 3.7�
Abdominal pain 1.9�
dyspnea 2.1�
. CC-BY-NC-ND 4.0 International licenseIt is made available under a is the author/funder, who has granted medRxiv a license to display the preprint in perpetuity. (which was not certified by peer review)
The copyright holder for this preprint this version posted March 1, 2020. .https://doi.org/10.1101/2020.02.27.20028027doi: medRxiv preprint
Chest distress 1.9�
Muscular soreness 0.5�
Outcomes
survival 53.6�
death 46.4�
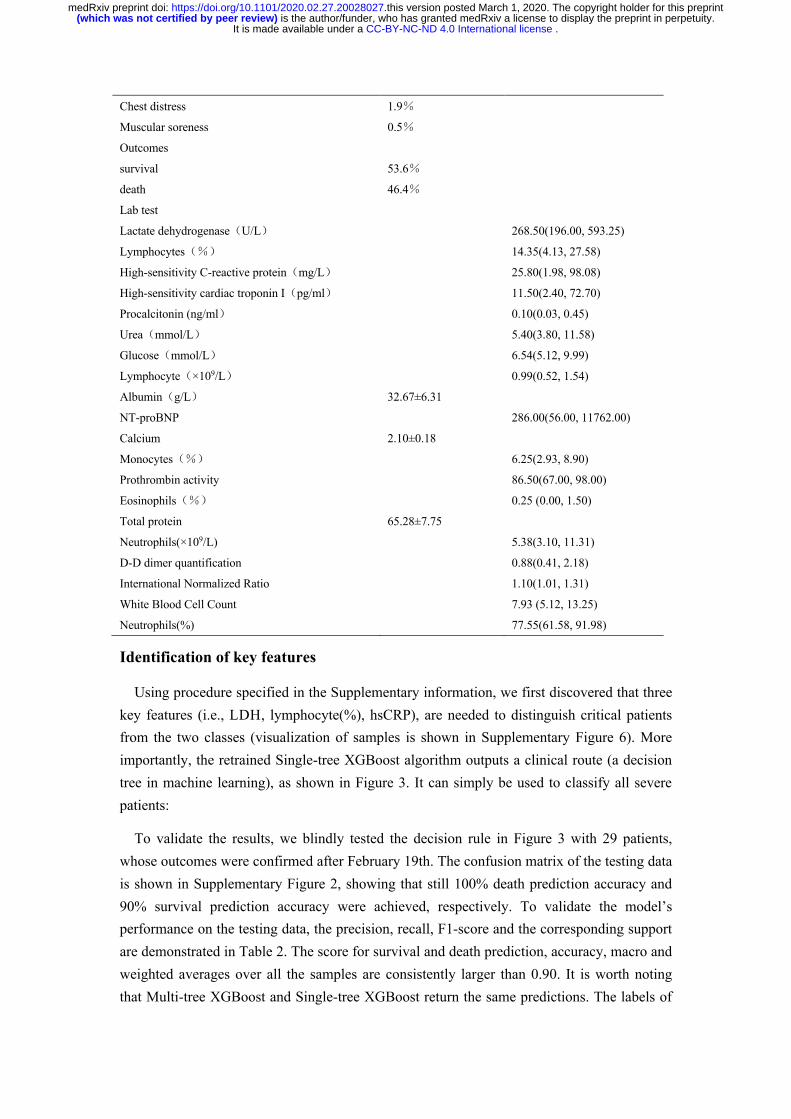
Lab test
Lactate dehydrogenase�U/L� 268.50(196.00, 593.25)
Lymphocytes��� 14.35(4.13, 27.58)
High-sensitivity C-reactive protein�mg/L� 25.80(1.98, 98.08)
High-sensitivity cardiac troponin I�pg/ml� 11.50(2.40, 72.70)
Procalcitonin (ng/ml� 0.10(0.03, 0.45)
Urea�mmol/L� 5.40(3.80, 11.58)
Glucose�mmol/L� 6.54(5.12, 9.99)
Lymphocyte�×109/L� 0.99(0.52, 1.54)
Albumin�g/L� 32.67±6.31
NT-proBNP 286.00(56.00, 11762.00)
Calcium 2.10±0.18
Monocytes��� 6.25(2.93, 8.90)
Prothrombin activity 86.50(67.00, 98.00)
Eosinophils��� 0.25 (0.00, 1.50)
Total protein 65.28±7.75
Neutrophils(×109/L) 5.38(3.10, 11.31)
D-D dimer quantification 0.88(0.41, 2.18)
International Normalized Ratio 1.10(1.01, 1.31)
White Blood Cell Count 7.93 (5.12, 13.25)
Neutrophils(%) 77.55(61.58, 91.98)
Identification of key features
Using procedure specified in the Supplementary information, we first discovered that three key features (i.e., LDH, lymphocyte(%), hsCRP), are needed to distinguish critical patients from the two classes (visualization of samples is shown in Supplementary Figure 6). More importantly, the retrained Single-tree XGBoost algorithm outputs a clinical route (a decision tree in machine learning), as shown in Figure 3. It can simply be used to classify all severe patients:
To validate the results, we blindly tested the decision rule in Figure 3 with 29 patients, whose outcomes were confirmed after February 19th. The confusion matrix of the testing data is shown in Supplementary Figure 2, showing that still 100% death prediction accuracy and 90% survival prediction accuracy were achieved, respectively. To validate the model’s performance on the testing data, the precision, recall, F1-score and the corresponding support are demonstrated in Table 2. The score for survival and death prediction, accuracy, macro and weighted averages over all the samples are consistently larger than 0.90. It is worth noting that Multi-tree XGBoost and Single-tree XGBoost return the same predictions. The labels of
. CC-BY-NC-ND 4.0 International licenseIt is made available under a is the author/funder, who has granted medRxiv a license to display the preprint in perpetuity. (which was not certified by peer review)
The copyright holder for this preprint this version posted March 1, 2020. .https://doi.org/10.1101/2020.02.27.20028027doi: medRxiv preprint

some patients are predicted wrong. Yet, the prognosis of these patients is not optimistic. One of the patients had been admitted to the ICU because of an endangered condition and was recovered after emergency rescue. The other patient was in the cerebrovascular sequelae period with an extremely weak condition. Although this patient is currently alive, the prognosis is extremely poor.
Figure 3. Establishing a decision rule using three key features. Num represents the number of patients, T represents
the number of corrected classified patients while F represents the number of misclassified patients.
Table 2�Performance of the proposed algorithm on testing dataset.
Precision Recall F1-score Support
Survival 1.00 0.83 0.91 12
Death 0.89 1.00 0.94 17
accuracy 0.93 29
macro avg 0.95 0.92 0.93 29
weighted avg 0.94 0.93 0.93 29
Discussion
Coronavirus is prevalent in China and all over the world, with high morbidity and
high mortality in critically ill patients. According to the recent reports [2�6], old patients
are more prone to be infected by COVID-19, especially for those with underlying diseases. The severity of patients is applying great pressure on the shortage of intensive care resources. Unfortunately, so far, specific clinical features of COVID-19 pneumonia in different critical stages remain still unclear. Under this circumstance, novel approaches based on feature data to help clinicians to identify high-risk patients as early as possible, to improve the prognosis of patients and to reduce the mortality of critically ill patients, are highly demanded and are of clinical significance. In this study, we used XGBoost
. CC-BY-NC-ND 4.0 International licenseIt is made available under a is the author/funder, who has granted medRxiv a license to display the preprint in perpetuity. (which was not certified by peer review)
The copyright holder for this preprint this version posted March 1, 2020. .https://doi.org/10.1101/2020.02.27.20028027doi: medRxiv preprint

machine learning method to establish a predictive model for early identification of critically ill patients based on the epidemiological and clinical data of 375 patients with COVID-19 infection in Tongji Hospital of Wuhan. The working mechanism of the XGBoost-based machine learning model is that it is detailed with quantitatively sorting clinical features accordingly to their criticality, then sorting out revealed features, and giving the interpretable clinical route. Inspiringly, with the assistance of such a model, we have extracted merely three key clinical features from all the 300+ features, i.e., LDH, hs-CRP and lymphocyte, which can precisely predict the survival with more than 90% accuracy. These three indexes correspond to the most important factors such as cell injury, cellular immunity and inflammation in the pathophysiological progress of COVID-19.
The significance of our work is three-fold. First, instead of merely providing the high-risk factors as the earlier published articles, the present study has provided a general operable formula to precisely and quickly quantify the risk of death, representing a significant progress in clinical practice. For example, for patients with SPO2 below 93%, the respiratory support therapy include intranasal catheterization of oxygen, oxygen supply through mask, high flow oxygen supply through nasal catheter, non-invasive ventilation support, invasive ventilation support, and ECMO. However, the routine sequential usage of the oxygen therapy usually leads to unsatisfactory therapeutic effects in severe patients. Significantly, our predictive model is likely to identify high-risk patients before irreversible lesions occur. By using appropriate respiratory support therapy as soon as possible, we may be able to completely improve the prognosis. Second, these three revealed key features can be conveniently collected by any hospital, thus helping bypass large streams of patients crowded in top-tier hospitals. As a result, our model can substantially alleviate the pressure caused by the shortage of medical resources and facilitates the forming of hierarchical medical care system of COVID-19. Third, the millisecond machine learning speed of the present model could improve the efficiency of frontline doctors in term of classifying the severity and predicting the fatal development trend, thereby greatly releasing the heavy work load of doctors.
The most common fatal complication of COVID-19 is acute respiratory distress syndrome (ARDS). Although the pathological features of COVID-19 are very similar to those by acute respiratory distress syndrome(SARS) and Middle East respiratory distress syndrome (MERS)[7], it is known from the latest systematic anatomy that pulmonary fibrosis and consolidation by COVID-19 patients are not as serious as those caused by SARS, but the exudative reaction is more severe than that of SARS[8]. Histological examination of COVID-19 showed bilateral diffuse alveolar damage with cellular fibro-myxoid Exudates, evident desquamation of pneumocytes and hyaline membrane formation [7] and then interstitial fibrosis.
The increase of LDH reflects tissue/cell destruction and is regarded as a common sign of tissue/cell damage. Serum LDH has been identified as an important biomarker for the activity
. CC-BY-NC-ND 4.0 International licenseIt is made available under a is the author/funder, who has granted medRxiv a license to display the preprint in perpetuity. (which was not certified by peer review)
The copyright holder for this preprint this version posted March 1, 2020. .https://doi.org/10.1101/2020.02.27.20028027doi: medRxiv preprint

and severity of Idiopathic Pulmonary Fibrosis (IPF)[9]. In patients with severe pulmonary interstitial disease, the increase of LDH is significant and is one of the most important prognostic markers of lung injury[9]. For the critically ill patients with COVID-19, the rise of LDH level indicates an increase of the activity and extent of lung injury.
Our analysis showed that higher serum hs-CRP could be used to predict the risk of death in severe COVID-19 patients. The increase of hs-CRP, an important marker for poor prognosis in ARDS [10, 11], reflects the persistent state of inflammation [12]. The result of this persistent inflammatory response is large gray-white lesions in the lungs of patients with COVID-19 (what was seen in the autopsy) [8]. In the tissue section, a large amount of sticky secretion was also seen overflowing from the alveoli [8].
Our results also suggested that lymphocytes play vital role in forecasting of progression from mild to critically ill and may serve as a potential therapeutic target. The hypothesis is supported by the results of clinical studies [2�6]. Moreover, lymphopenia is a common feature in the patients with COVID-19 and might be a critical factor associated with disease severity and mortality[Error! Reference source not found.]. The injured alveolar epithelial cells could induce the infiltration of lymphocytes, leading to a persistent lymphopenia as SARS-CoV and MERS-CoV did, given that they share the similar alveolar penetrating and antigen presenting cells (APC) impairing pathway [14,15]. A biopsy study has provided strong evidence that the counts of peripheral CD4 and CD8 T cells were substantially reduced, while their status was hyperactivated [Error! Reference source not found.]. Also, Jing and colleagues reported the lymphopenia is mainly related to the decrease of CD4+ and CD8+ T cells [16]. Thus, it is likely that lymphocytes play distinct roles in COVID-19, which deserves further investigation.
Nevertheless, this study has several notable limitations. First of all, since the proposed machine learning method is purely data driven, its model may vary given a different set of training and validation dataset. Given the limit number of samples in this study, we strike a balance between model complexity and performance. Yet the whole procedure should follow when more data is available. Secondly, this is a single-centered, retrospective study, which provides a preliminary assessment of the clinical course and outcome of severe patients. Although this database covers more than 3,000 patients, most clinical outcomes have not yet been released. As we have a pool of more than 300 clinical measurements, here our modeling principle is a trade-off between the minimal number of features and the capacity of good prediction. Obviously, if a larger number of features are selected, the model may perform better. In this regard, we look forward to subsequent large sample and multicenter studies.
In summary, in this study, we have identified three indicators (LDH, hs-CRP, and lymphocytes) and even found the early warning thresholds (LDH: 365U/l, hs-CRP: 41.2mg/L, and lymphocytes%: 14.7%) for COVID-19 prognostic prediction and developed an XGBoost machine learning-based prognostic model that can precisely predict the survival rates of
. CC-BY-NC-ND 4.0 International licenseIt is made available under a is the author/funder, who has granted medRxiv a license to display the preprint in perpetuity. (which was not certified by peer review)
The copyright holder for this preprint this version posted March 1, 2020. .https://doi.org/10.1101/2020.02.27.20028027doi: medRxiv preprint
severe patients with more than 90% accuracy, enabling the early detection, the early intervention and the reduction of mortality in high-risk patients with COVID-19. From technical point of view, this work helps pave the way for using machine learning method in COVID-19 prediction and diagnosis in the triage of the large scale explosive epidemic COVID-19 cases. Further studies are needed to consider more clinical confounding factors and to increase the sample size for further refining our model.
Reference
[1] C. Huang, Y. Wang, X. Li, L. Ren, J. Zhao, Y. Hu, L. Zhang, G. Fan, J. Xu, X. Gu, et al. Clinical features of patients infected with 2019 novel coronavirus in wuhan, china. The
Lancet, 395(10223):497–506, 2020.
[2] N. Chen, M. Zhou, X. Dong, J. Qu, F. Gong, Y. Han, Y. Qiu, J. Wang, Y. Liu, Y. Wei, et al. Epidemiological and clinical characteristics of 99 cases of 2019 novel coronavirus pneumonia in wuhan, china: a descriptive study. The Lancet, 2020.395(10223): p. 507-513.
[3] X. Yang*, Y. Yu*, J. Xu*, H. Shu*, J.A. Xia*, H. Liu*, Y. Wu, L. Zhang, Z. Yu, M. Fang, T. Yu, Y. Wang, S. Pan, X. Zou, S. Yuan, Y. Shang. Lancet Respir Med. 2020 Feb 24. pii: S2213-2600(20)30079-5. doi: 10.1016/S2213-2600(20)30079-5. [Epub ahead of print].
[4] Diagnosis and treatment of pneumonia infected by the new novel coronavirus (the trial fifth edition). National Health Commission of the people’s Republic of China, The
medical letter from the National Health Office, 2020.Nr.103.
[5] T. Chen and C. Guestrin. Xgboost: A scalable tree boosting system. arxiv e-prints. arXiv
preprint arXiv:1603.02754, 2016.
[6] D. Wang, B. Hu, C. Hu, F. Zhu, X. Liu, J. Zhang, B. Wang, H. Xiang, Z. Cheng, Y. Xiong, et al. Clinical characteristics of 138 hospitalized patients with 2019 novel coronavirus–infected pneumonia in wuhan, china. Jama, 2020.
[7] Z. Xu, L. Shi, Y. Wang, J. Zhang, L. Huang, C. Zhang, S. Liu, P. Zhao, H. Liu, L. Zhu, et al. Pathological findings of covid-19 associated with acute respiratory distress syndrome. The Lancet. Respiratory medicine, 2020.
[8] X Liu, RS Wang, GQ Qu et al. A general report on the systematic anatomy of COVID-19. Journal of Forensic Medicine, 36(1):1–3, 2020.
[9] T. Kishaba, H. Tamaki, Y. Shimaoka, H. Fukuyama, and S. Yamashiro. Staging of acute exacerbation in patients with idiopathic pulmonary fibrosis. Lung, 192(1):141–149, 2014
[10] P.M. Ridker, E. Danielson, F.A. Fonseca, J. Genest, A.M. Jr Gotto, J.J. Kastelein et al. Rosuvastatin to prevent vascular events in men and women with elevated C-reactive protein. N Engl J Med 2008; 359 : 2195-207.
. CC-BY-NC-ND 4.0 International licenseIt is made available under a is the author/funder, who has granted medRxiv a license to display the preprint in perpetuity. (which was not certified by peer review)
The copyright holder for this preprint this version posted March 1, 2020. .https://doi.org/10.1101/2020.02.27.20028027doi: medRxiv preprint
[11] K.S. Surendra, G. Anunay, B. Ashutosh et al. Aetiology, outcomes & predictors of mortality in acute respiratory distress syndrome from a tertiary care centre in north India. Indian J Med Res 143, June 2016, pp 782-792.
[12] E.K. Bajwa, U.A. Khan, J.L. Januzzi, M.N. Gong, et al. Plasma C-reactive protein levels are associated with improved outcome in ARDS. Chest 2009; 136 : 471-80.
[13] Chan JF, Yuan S, Kok KH, et al. A familial cluster of pneumonia associated with the 2019 novel coronavirus indicating person-toperson transmission: a study of a family cluster. Lancet 2020;395: 514–23
[14] Li, F., et al., Structure of SARS coronavirus spike receptor-binding domain complexed with receptor. 2005. 309(5742): p. 1864-1868.
[15] Ge, X.-Y., et al., Isolation and characterization of a bat SARS-like coronavirus that uses the ACE2 receptor. 2013. 503(7477): p. 535-538.
[16] Jing Liu, Sumeng Li, Jia Liu, Boyun Liang, Xiaobei Wang, Hua Wang, Wei Li, Qiaoxia Tong, JianhuaYi, Lei Zhao, Lijuan Xiong, Chunxia Guo, Jin Tian, Jinzhuo Luo, Jinghong Yao, Ran Pang, Hui Shen,Cheng Peng, Ting Liu, Qian Zhang, Jun Wu, Ling Xu, Sihong Lu, Baoju Wang, Zhihong Weng,Chunrong Han, Huabing Zhu, Ruxia Zhou, Helong Zhou, Xiliu Chen, Pian Ye, Bin Zhu, ShengsongHe, Yongwen He, Shenghua Jie, Ping Wei, Jianao Zhang, Yinping Lu, Weixian Wang, Li Zhang,Ling Li, Fengqin Zhou, Jun Wang, Ulf Dittmer, Mengji Lu, Yu Hu, Dongliang Yang, Xin Zheng. Longitudinal characteri -stics of lymphocyte responses and cytokine profiles in the peripheral blood of SARS-CoV-2infected patients. medRxiv 2020.02. 16.20023671; Doi: https://doi.org/ 10.1101/2020.02.16.20023671.
. CC-BY-NC-ND 4.0 International licenseIt is made available under a is the author/funder, who has granted medRxiv a license to display the preprint in perpetuity. (which was not certified by peer review)
The copyright holder for this preprint this version posted March 1, 2020. .https://doi.org/10.1101/2020.02.27.20028027doi: medRxiv preprint
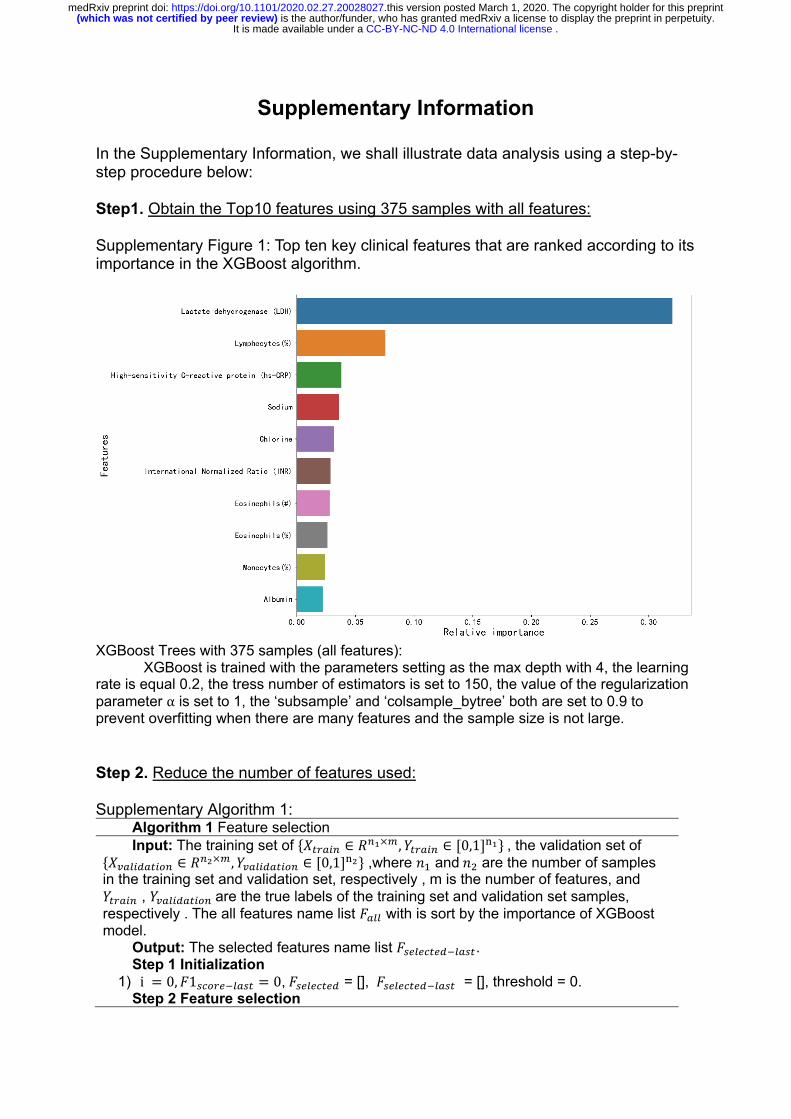
Supplementary Information In the Supplementary Information, we shall illustrate data analysis using a step-by-step procedure below: Step1. Obtain the Top10 features using 375 samples with all features: Supplementary Figure 1: Top ten key clinical features that are ranked according to its importance in the XGBoost algorithm.
XGBoost Trees with 375 samples (all features):
XGBoost is trained with the parameters setting as the max depth with 4, the learning rate is equal 0.2, the tress number of estimators is set to 150, the value of the regularization parameter α is set to 1, the ‘subsample’ and ‘colsample_bytree’ both are set to 0.9 to prevent overfitting when there are many features and the sample size is not large. Step 2. Reduce the number of features used: Supplementary Algorithm 1:
Algorithm 1 Feature selection Input: The training set of {#$%&'( ∈ *(+×-, /$%&'( ∈ [0,1]4+}, the validation set of
{#7&8'9&$':( ∈ *(;×-, /7&8'9&$':( ∈ [0,1]
4;} ,where <= and<> are the number of samples in the training set and validation set, respectively , m is the number of features, and /$%&'( , /7&8'9&$':(are the true labels of the training set and validation set samples, respectively . The all features name list ?&88 with is sort by the importance of XGBoost model.
Output: The selected features name list ?@A8AB$A9C8&@$. Step 1 Initialization
1) i = 0, ?1@B:%AC8&@$ = 0,?@A8AB$A9 = [], ?@A8AB$A9C8&@$ = [], threshold = 0. Step 2 Feature selection
. CC-BY-NC-ND 4.0 International licenseIt is made available under a is the author/funder, who has granted medRxiv a license to display the preprint in perpetuity. (which was not certified by peer review)
The copyright holder for this preprint this version posted March 1, 2020. .https://doi.org/10.1101/2020.02.27.20028027doi: medRxiv preprint
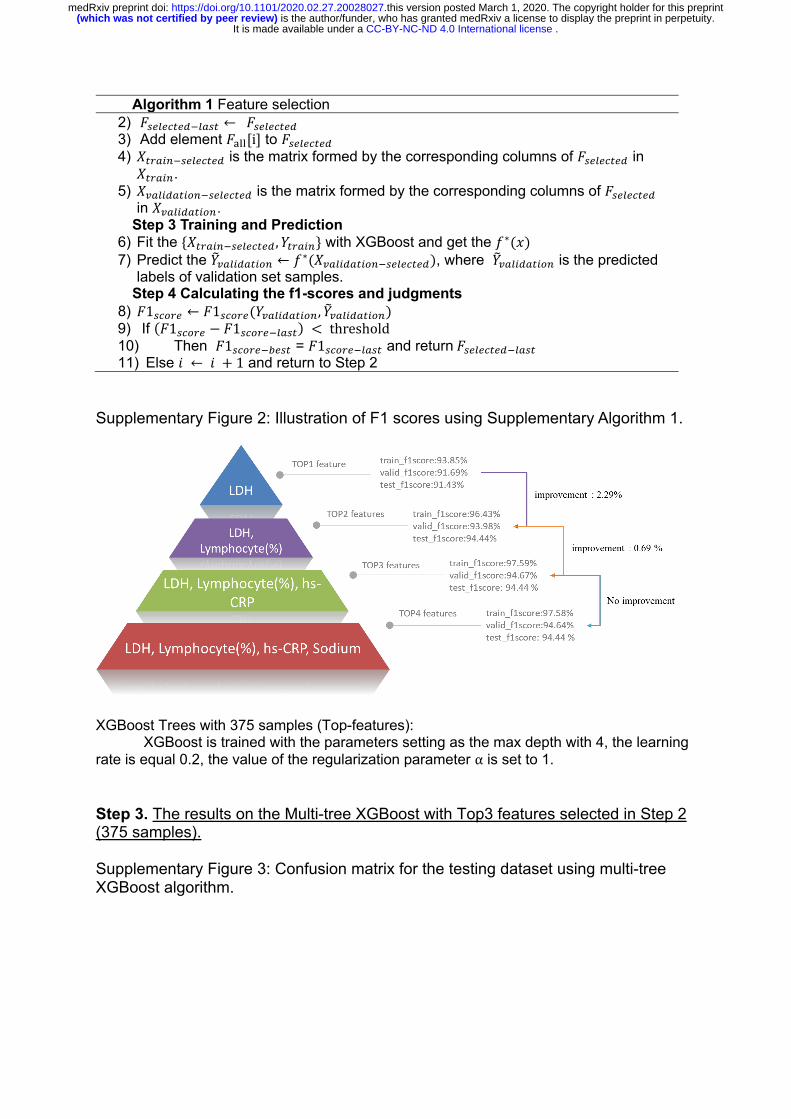
Algorithm 1 Feature selection 2) ?@A8AB$A9C8&@$ ← ?@A8AB$A9 3) Add element ?GHH[i] to ?@A8AB$A9 4) #$%&'(C@A8AB$A9 is the matrix formed by the corresponding columns of ?@A8AB$A9 in #$%&'(.
5) #7&8'9&$':(C@A8AB$A9 is the matrix formed by the corresponding columns of ?@A8AB$A9 in #7&8'9&$':(.
Step 3 Training and Prediction 6) Fit the {#$%&'(C@A8AB$A9, /$%&'(} with XGBoost and get the I∗(L) 7) Predict the /N7&8'9&$':( ← I∗(#7&8'9&$':(C@A8AB$A9), where /N7&8'9&$':( is the predicted
labels of validation set samples. Step 4 Calculating the f1-scores and judgments
8) ?1@B:%A ← ?1@B:%A(/7&8'9&$':(, /N7&8'9&$':() 9) If (?1@B:%A − ?1@B:%AC8&@$) < threshold 10) Then ?1@B:%ACYA@$ = ?1@B:%AC8&@$ and return?@A8AB$A9C8&@$ 11) Else Z ← Z + 1 and return to Step 2
Supplementary Figure 2: Illustration of F1 scores using Supplementary Algorithm 1.
XGBoost Trees with 375 samples (Top-features):
XGBoost is trained with the parameters setting as the max depth with 4, the learning rate is equal 0.2, the value of the regularization parameter α is set to 1. Step 3. The results on the Multi-tree XGBoost with Top3 features selected in Step 2 (375 samples). Supplementary Figure 3: Confusion matrix for the testing dataset using multi-tree XGBoost algorithm.
. CC-BY-NC-ND 4.0 International licenseIt is made available under a is the author/funder, who has granted medRxiv a license to display the preprint in perpetuity. (which was not certified by peer review)
The copyright holder for this preprint this version posted March 1, 2020. .https://doi.org/10.1101/2020.02.27.20028027doi: medRxiv preprint
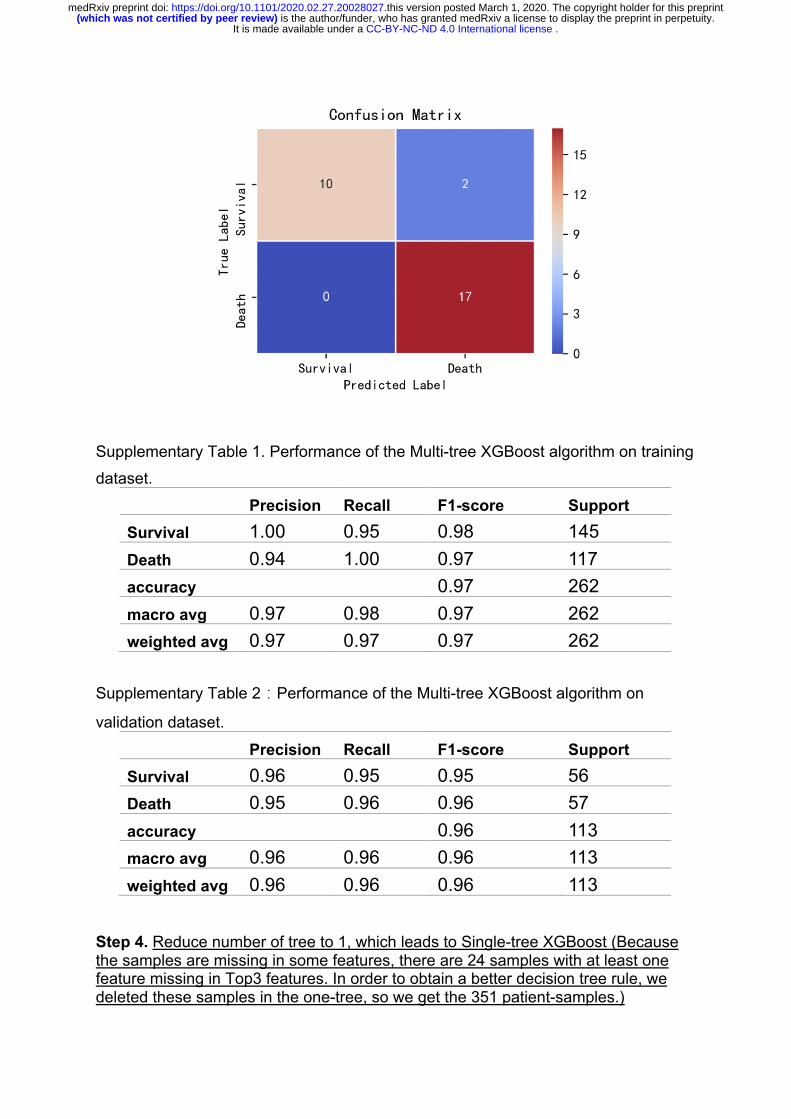
Supplementary Table 1. Performance of the Multi-tree XGBoost algorithm on training
dataset.
Precision Recall F1-score Support
Survival 1.00 0.95 0.98 145 Death 0.94 1.00 0.97 117 accuracy 0.97 262 macro avg 0.97 0.98 0.97 262 weighted avg 0.97 0.97 0.97 262
Supplementary Table 2�Performance of the Multi-tree XGBoost algorithm on
validation dataset.
Precision Recall F1-score Support
Survival 0.96 0.95 0.95 56 Death 0.95 0.96 0.96 57 accuracy 0.96 113 macro avg 0.96 0.96 0.96 113 weighted avg 0.96 0.96 0.96 113
Step 4. Reduce number of tree to 1, which leads to Single-tree XGBoost (Because the samples are missing in some features, there are 24 samples with at least one feature missing in Top3 features. In order to obtain a better decision tree rule, we deleted these samples in the one-tree, so we get the 351 patient-samples.)
. CC-BY-NC-ND 4.0 International licenseIt is made available under a is the author/funder, who has granted medRxiv a license to display the preprint in perpetuity. (which was not certified by peer review)
The copyright holder for this preprint this version posted March 1, 2020. .https://doi.org/10.1101/2020.02.27.20028027doi: medRxiv preprint
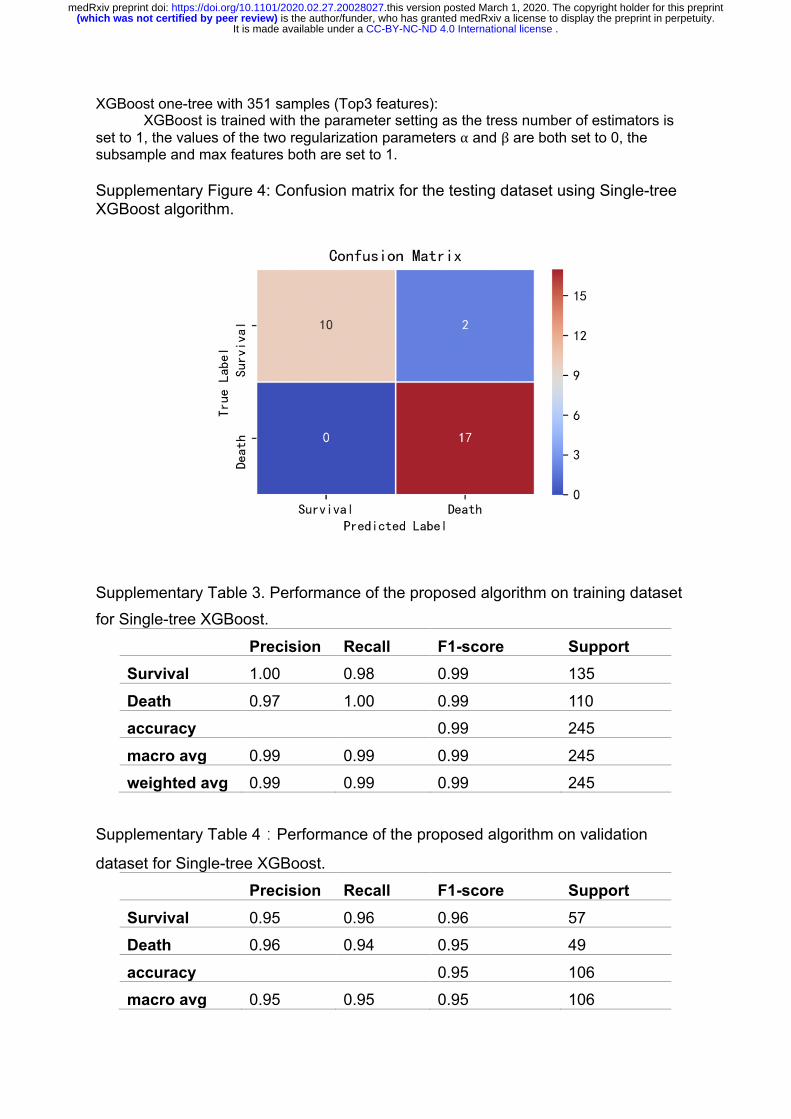
XGBoost one-tree with 351 samples (Top3 features): XGBoost is trained with the parameter setting as the tress number of estimators is
set to 1, the values of the two regularization parameters α and β are both set to 0, the subsample and max features both are set to 1. Supplementary Figure 4: Confusion matrix for the testing dataset using Single-tree XGBoost algorithm.
Supplementary Table 3. Performance of the proposed algorithm on training dataset
for Single-tree XGBoost.
Precision Recall F1-score Support
Survival 1.00 0.98 0.99 135
Death 0.97 1.00 0.99 110
accuracy 0.99 245
macro avg 0.99 0.99 0.99 245
weighted avg 0.99 0.99 0.99 245
Supplementary Table 4�Performance of the proposed algorithm on validation
dataset for Single-tree XGBoost.
Precision Recall F1-score Support
Survival 0.95 0.96 0.96 57
Death 0.96 0.94 0.95 49
accuracy 0.95 106
macro avg 0.95 0.95 0.95 106
. CC-BY-NC-ND 4.0 International licenseIt is made available under a is the author/funder, who has granted medRxiv a license to display the preprint in perpetuity. (which was not certified by peer review)
The copyright holder for this preprint this version posted March 1, 2020. .https://doi.org/10.1101/2020.02.27.20028027doi: medRxiv preprint

weighted avg 0.95 0.95 0.95 106
Supplementary Figure 5: Single-tree structure:
Supplementary Figure 6: Visualization of data over three selected features.
. CC-BY-NC-ND 4.0 International licenseIt is made available under a is the author/funder, who has granted medRxiv a license to display the preprint in perpetuity. (which was not certified by peer review)
The copyright holder for this preprint this version posted March 1, 2020. .https://doi.org/10.1101/2020.02.27.20028027doi: medRxiv preprint