predicting tomorrow’s cryptocurrency price using a lstm
TRANSCRIPT
Predicting tomorrow’s cryptocurrency price using
a LSTM model, historical prices and Reddit
comments
Gerlof Bremmer
| u743346
Internal supervisor: prof. dr. ir. P.H.M. Spronck
Second reader: dr. ing. S.C.J. Bakkes
Master thesis | Data Science: Business & Governance
Tilburg University| School of Humanities and Digital Sciences
Tilburg, The Netherlands
July 2018

Preface
Writing this thesis has thought me a lot about the technology behind Data Science
and cryptocurrencies. I believe that these technologies will change the world, and I
am happy to be a part of it.
I would like to thank my thesis supervisor prof. dr. ir. Pieter Spronck for his
flexibility in the process of finding a research topic and the given insights during our
feedback sessions. I also want to thank the second reader, dr. ing. Sander Bakkes.
Finally, I wish to express my gratitude towards my parents for their unconditional
support during my study. Obtaining this academic degree would not have been
possible without them.

Abstract
Being able to predict tomorrow’s stock or cryptocurrency price can be seen as the holy
grail for financial investors. In order to find this grail, this research aims to explore
the relationship between comments that are made on social media website Reddit
and the daily prices or market direction of the cryptocurrencies Ethereum, Litecoin
and Ripple. Furthermore, the predictive value of these relationships is analysed
using the Long Short-Term Memory model.
This research shows that these relationships exist for Litecoin and Ripple,
but not for Ethereum. This research also shows that such relationships can, for the
relevant cryptocurrencies, be used to predict tomorrow’s price or market direction
with some accuracy. However, the models created do not have a sufficiently high
accuracy to use them for trading purposes.

Contents
1 Introduction ........................................................................................................ 6
1.1 Motivation................................................................................................................ 6
1.2 Prior Research ......................................................................................................... 7
1.3 Problem statement and research question .............................................................. 8
1.4 Outline ..................................................................................................................... 9
2 Related work ..................................................................................................... 10
2.1 Cryptocurrencies ................................................................................................... 10
2.1.1 ETH (Ethereum) ........................................................................................... 11
2.1.2 XRP (Ripple) ................................................................................................. 11
2.1.3 LTC (Litecoin) ............................................................................................... 12
2.2 Reddit .................................................................................................................... 12
2.3 Sentiment .............................................................................................................. 14
2.3.1 VADER sentiment analyser ......................................................................... 14
2.4 Recurrent Neural Network: LSTM ....................................................................... 15
3 Methods .............................................................................................................. 18
3.1 Data ....................................................................................................................... 18
3.1.1 Reddit comment data.................................................................................... 18
3.1.2 Cryptocurrency price data ............................................................................ 19
3.2 Pre-processing ....................................................................................................... 19
3.2.1 Reddit comment data.................................................................................... 19
3.2.2 Cryptocurrency price data ............................................................................ 20
3.2.3 Merging ......................................................................................................... 21
3.2.4 Normalisation ............................................................................................... 21
3.2.5 Supervised learning ...................................................................................... 21
3.2.6 Correlation and visualization ....................................................................... 22
3.3 Predictive model .................................................................................................... 22
3.3.1 Train-test split .............................................................................................. 22
3.3.2 Base LSTM model ......................................................................................... 23
3.3.3 LSTM including sentiment ........................................................................... 25
3.3.4 LSTM including number of comments ......................................................... 26
3.3.5 LSTM 3-day lag ............................................................................................ 26
3.3.6 LSTM including sentiment and number of comments ................................. 26
3.3.7 LSTM including volume and explorative variables ..................................... 26

4 Results ................................................................................................................ 28
4.1 Exploratory correlations and plots ........................................................................ 28
4.1.1 Ethereum ...................................................................................................... 28
4.1.2 Litecoin ......................................................................................................... 29
4.1.3 Ripple ............................................................................................................ 30
4.2 Predictive models Ethereum ................................................................................. 32
4.3 Predictive model Litecoin ...................................................................................... 33
4.4 Predictive model Ripple ......................................................................................... 34
5 Discussion .......................................................................................................... 36
5.1 Interpretation of results ........................................................................................ 36
5.2 Shortcomings ......................................................................................................... 38
5.3 Future research ..................................................................................................... 39
6 Conclusion ......................................................................................................... 41
6.1 RQ1: the possible relationship .............................................................................. 41
6.2 RQ2: nature of the relationship............................................................................. 41
6.3 RQ3: possibilities for prediction ............................................................................ 41
6.4 Problem statement ................................................................................................ 42
References ................................................................................................................ 43
Appendices ............................................................................................................... 47
A Reddit comment scraping script ............................................................................ 47
B Weblink to full script in GitHub repository .......................................................... 49
C Results LSTM models ............................................................................................ 50
6
1 Introduction
1.1 Motivation
Since the creation of the first digital currency, called Bitcoin (Nakamoto, 2008), there
has been an enormous rise in the number of digital assets, so called cryptocurrencies.
In less than ten years, the total market capitalization of cryptocurrencies has
increased from 1.6 billion dollars to 814 billion dollars at the all-time high, divided
over a total of 1575 unique currencies (Coinmarketcap, 2018). Consequentially, the
rise in a certain new financial market attracts a lot of new investors looking for
positive interest. In 2017 there was estimated to be between 5.8 million and 11.5
million active cryptocurrency wallets, with these numbers still increasing (Hileman
& Rauchs, 2017).
Since the emergence of internet, news and information about financial
markets is always available and up-to-date. Investors are able to educate themselves
through a variety of digital sources such as social media and other online platforms
creating a possible correlation between online content and asset price fluctuation.
Previous research found evidence of such relationship between stock price movement
and social media (Chen, De, Hu, & Hwang, 2014). One online media that investors
rely on to educate themselves is the website Reddit, defined as a news aggregation,
web content rating, and discussion website platform with almost 1.66 billion unique
visits in a nine month timeframe between April 2017 and December 2017 (Reddit,
2018b; Statista, 2018). The characteristics of Reddit are that it is divided in so called
‘subreddits’, which are smaller, topic specific sub-communities. These subreddits
tend to have a wide variety of topics, for example “r/CryptoCurrency”, a subreddit
solely dedicated to cryptocurrency news and discussions on the topic of
cryptocurrencies, with over 600.000 subscribed users (Reddit, 2018b). Furthermore,
subreddits created for a specific cryptocurrency are rising in the number of active
members. Three of the cryptocurrency related subreddits that belong to the most
active communities on Reddit are r/Ethereum, r/Litecoin and r/Ripple, with over
348.000, 198.000 and 189.000 subscribed users respectively.
From societal perspective, this research topic can shed light on social
behaviour in the cryptocurrency market. Cryptocurrency price fluctuations caused by
the sentiment on social media reflect investment decision making which are fuelled
by negative emotions, such as fear, or positive emotions, such as trust. From a
scientific perspective, this research is interesting since the predictive value of
sentiment on cryptocurrencies price fluctuations has not yet been addressed for

7
Reddit, in contrast to Twitter and other online media (Y. Bin Kim et al., 2016;
Pimprikar, Ramachadran, & Senthilkumar, 2017). Additionally, the relationship
between Reddit comments and cryptocurrency fluctuations can be expected to be
smaller than the relationship between Twitter and cryptocurrency fluctuations due
to much bigger number of Twitter users compared to Reddit. Finally, machine
learning techniques are used to test the prediction capabilities on various topics.
Therefore, from explorative perspective it is relevant to test the predictive power of
machine learning techniques when trying to predict cryptocurrency price
fluctuations.
1.2 Prior Research
Prior research into prediction of the stock market is relatively common and
conducted on several financial assets. In their research, Patel, Shah, Thakkar, &
Kotecha (2015) show predictive accuracy scores between 86% and 90% for various
machine learning models when predicting the up or down movement of two Indian
stock price indices (CNX Nifty, S&P BSE Sensex) and the up or down movement of
two Indian stocks (Reliance Industries, Infosys Ltd.). Furthermore, Huang,
Nakamori, & Wang (2005) show that using various machine learning models to
predict the weekly market direction of the Japanese NIKKEI 225 index, the Support
Vector Machine yields the best performance with 75% accuracy. In addition to these
papers, Nelson, Pereira, & De Oliveira (2017) use the LSTM model to correctly
predict with 55.9% accuracy whether the price will go up or down for an interval of
15 minutes from BM&F Bovespa stocks.
With respect to the relationship between stock prices and social media,
Bollen, Mao, & Zeng (2011) found an accuracy of 87.6% in predicting the daily up and
down changes in the closing values of the Dow Jones Industrial Average using a
neural network and daily Twitter feeds as extra predictor. Furthermore, Pimprikar
et al. (2017) use various machine learning methods combined with a Twitter
sentiment analysis to predict the exact stock price of tomorrow with the Long Short-
Term Model (LSTM) outperforming other machine learning models such as Linear
Regression, Support Vector Machine or Naïve Bayes classifier.
In contrast with these five papers, price movement predictions in the
cryptocurrency market are not studied often.
With respect to cryptocurrencies and social media, prior research has shown
that social media sentiment has an important, yet complex relationship with Bitcoin
price fluctuations (Mai, Shan, Bai, Wang, & Chiang, 2018). Additionally, Mai, Shan,

8
Bai, Wang, & Chiang (2018) conclude inconsistency in prior research regarding this
relationship. Despite this complex relationship, Y. Bin Kim et al. (2016) found that
user comments and replies affect the number of transactions in several
cryptocurrencies. However, this research limits itself to an Averaged one-dependence
estimator’s classification model and excludes Litecoin from the analysis. Moreover,
the timeframe of the crawled data in the research by Y. Bin Kim et al. (2016) ended
in the beginning of 2016. Since then, communities have grown and trading of
cryptocurrencies became more known.
In addition to the research conducted by Pimprikar et al. (2017), when
choosing the LSTM model for prediction, it also showed the best performance when
applied to the prediction of cryptocurrency prices, specifically Bitcoin (McNally,
2016).
Since cryptocurrencies and machine learning combined is a relatively new
topic of research, numerous of blog posts and non-academic articles can be found
online. Research on the predictive value of Reddit comments on cryptocurrency prices
has not yet been conducted.
1.3 Problem statement and research question
As stated before, cryptocurrency markets are influenced by social media. To gain
insight into the effect of social media on cryptocurrency markets, this thesis will
investigate the relationship between social media and fluctuations in cryptocurrency
prices. Specifically, this research will investigate whether the comments in the
Ethereum, Litecoin or Ripple subreddit have a predictive value towards the
fluctuations of the corresponding cryptocurrency. Furthermore, price related
variables were taken into account when exploring the best predictive features.
The problem statement of this thesis is:
To what extent is there a relationship between subreddit comments and
cryptocurrency price fluctuations?
To address this problem statement, the problem statement will be divided into the
following research questions:

9
RQ1: Is there a relation between subreddit comments and cryptocurrency price
fluctuations?
RQ2: What is the nature of the relationship between subreddit comments and
cryptocurrency price fluctuations?
RQ3: Can machine learning methods be used to predict cryptocurrency prices based
on subreddit comments?
1.4 Outline
The outline of this thesis is as follows. In chapter 2 the theoretical background that is
necessary for performing this research is discussed. Chapter 3 will provide the
methods that are used for the collection of the data and the analysis which have been
performed. In chapter 4 the results will be presented. Chapter 5 aims to evaluate the
results with regard to the research questions. Furthermore, shortcomings and
directions of further research will also be discussed in chapter 5. In chapter 6 the
conclusion of the research will be provided and the research questions will be
answered.

10
2 Related work
2.1 Cryptocurrencies
In the history of mankind, countless goods and assets have been used as money to
trade goods or pay for certain services. The Oxford Dictionary (2018) defines money
as “A current medium of exchange in the form of coins and banknotes”. In a historical
setting, the trading of goods or assets is made possible if the buyer and seller are
physically at the same location. However, in current time, trading of goods and the
exchange of money often happens digitally. With digital transactions, a problem
arises when two parties are not able to physically arrange a settlement. Traditionally
this problem is solved through centralized systems such as e-banking or other digital
payment services like PayPal (PayPal, 2018). A rather new and alternative rising
form of digitally tradable assets are cryptocurrencies, with Bitcoin being the most
widely adopted. Cryptocurrencies aim to omit the centralized party such as banks by
using a technology called blockchain. These new technologies use a distributed
network of nodes, each contributing to the security of the network creating the
opportunity of a distributed ledger.
This ‘digital money’ gets a lot of attention due to its volatility which provides
the opportunity for high-return trading.
To determine if a certain transferable asset defines as money, one can employ
the traditional approach of determining which function it performs. An extensive
amount of literature defines three rules of which a certain asset or good must fulfil.
(Jevons, 1859; McLeay, Radia, & Thomas, 2014; Mises, 1953)
Firstly, money should fulfil the role as a medium of exchange. In this role,
money functions as something a person possesses with the purpose of trading it for
something else. In contrast to a barter system where goods are directly traded to
different goods, the role of medium of exchange of money results in the second role:
store of value. The store of value of money ensures that money retains its value
over time. For example, food or certain finite product has a disadvantage for storing
value when compared to gold or banknotes. Thirdly, money should fulfil the role as a
unit of account. The unit of account represents the ‘thing’ certain goods or a service
is priced in, for example, a price tag in US Dollars.
According to Ramis, Sherwin, & Pantoja (2016), most cryptocurrencies do not
serve the traditional functions of a currency. Since cryptocurrencies are highly
volatile, it undermines the store of value and unit of account functions since it lacks
a centralized price aggregation mechanism. Nevertheless, cryptocurrencies are

11
traded on exchanges worldwide with 24 hour volumes exceeding 50 billion US
Dollars (Coinmarketcap, 2018). These volumes reflect a certain degree of trust and
support by cryptocurrency adopters.
2.1.1 ETH (Ethereum)
Ethereum (ETH) is the second crypto asset worldwide in terms of market
capitalization and daily trade volume (Coinmarketcap, 2018). In contrast to Bitcoin,
Ethereum is not designed to function as a currency but is described by one of the
creators Buterin (2014) as: “a blockchain with a built-in Turing-complete
programming language, allowing anyone to write smart contracts and decentralized
applications where they can create their own arbitrary rules of ownership, transaction
formats and state transition functions”. The Ethereum network requires an intrinsic
currency called “Ether” to pay for transaction fees or the creation of smart contracts
(Wood, 2017). This currency Ether, with the ticker ‘ETH’, is the tradable asset that
investors are able to buy and trade on cryptocurrency exchanges.
The Ethereum network is verified by a concept called Proof of Work (PoW)
which translates to people solving computational complex cryptographic puzzles
using computer power to confirm blocks on the blockchain which results in securing
the network, a process better known as mining. The complexity of these puzzles
makes it nearly impossible for a malicious party to attack the Ethereum network,
therefore making the network more secure. The reward for successfully mining one
block on the Ethereum blockchain is 3 Ether (Ethereum, 2018). In the near future,
Ethereum will switch to the concept of Proof of Stake (PoS) which will result in more
security, reduced risk of centralization and energy efficiency (Ray, 2018).
Since the deployment of the Ethereum network, the intrinsic currency Ether
is tradable on exchanges. In 2017 the value of one Ether gained over 7000% in value,
showing the degree of volatility that cryptocurrencies reflect (Coinmarketcap, 2018).
2.1.2 XRP (Ripple)
Ripple (XRP) is the third cryptocurrency in terms of market capitalization behind
Ethereum (ETH) and Bitcoin (BTC) (Coinmarketcap, 2018). XRP is a cryptocurrency
created by the venture capital funded company Ripple. The Ripple network is a
decentralized network based on a consensus between Ripple and network
participants that facilitates transactions in financial markets. Due to the volatility of
the XRP currency, most of these transactions on the Ripple network are in

12
traditional fiat, but have an advantage over traditional systems because it has a
transaction speed of 4 seconds and the scalability to match VISA’s transactions speed
of 50.000 transactions per second (Ripple, 2018b). However, the characteristics of
decentralization of Ripple are questioned since most transaction validating servers
are run by Ripple Labs instead of decentralized parties. Furthermore, over 60% of
the 100 billion created XRP is held by Ripple, making it the largest hold-back of any
cryptocurrency (Armknecht, Karame, Mandal, Youssef, & Zenner, 2015; Ripple,
2018a).
Nevertheless, XRP is available on exchanges and therefore traded on a large scale,
with daily volumes exceeding 9 billion US Dollars and a percentage gain in price per
XRP of over 1750% in less than a month, making it highly volatile (Coinmarketcap,
2018).
2.1.3 LTC (Litecoin)
Litecoin is a cryptocurrency created in 2013 as a source code fork from Bitcoin,
meaning the original code from Bitcoin was copied to create a new cryptocurrency on
its own blockchain. Performing a source code fork provides the possibility to alter
some aspects of this currency with the goal of improving Bitcoin. In comparison to
Bitcoin, the generation time of a new Litecoin block takes on average 2.5 minutes
instead of 10 minutes for Bitcoin, resulting in faster transaction confirmations.
Furthermore, PoW of Litecoin uses a different encryption method called ‘scrypt’
which makes it possible for everyone with a computer and internet access to mine
Litecoin and therefore securing the network. The lower entry costs for participating
in Litecoin’s PoW implies decentralized mining power. Moreover, securing the
Litecoin network consumes significantly less energy when compared to Bitcoin
(Vries, 2018).
Metaphorically a comparison can be made by viewing Litecoin as silver to Bitcoin’s
gold in the sense that it is less valuable, more easily to obtain and to transact with
(Litecoin, 2018).
In 2017, the price for one Litecoin increased from 4,33 USD to 364 USD at all-
time high, which translates to a percentage gain of over 8000% making it highly
volatile (Coinmarketcap, 2018).
2.2 Reddit
Reddit is a social media platform described by the creators as: ‘The front-page of the
internet” (Reddit, 2018b). With over 330 Million monthly users (Reddit, 2018a),

13
Reddit is the 7th most popular website worldwide according to Amazon’s Alexa
(Alexa, 2018). Reddit allows users to share text, visual content or web-links as
separate domains. In addition to content posting, users are able to comment on the
concerned post, and even comment on each other’s comments, therefore starting a
discussion in the specific post domain. Both the posted content as the comments can
be up- or down-voted by users to express their opinion as positive or negative.
Content or comments with a high up-vote score will be displayed higher in the list of
posts or comments, hence popular content will end up high in the list of posts. Reddit
is divided into many thousands of smaller communities called subreddits where the
subject of these subreddits can vary from entertainment purposes to academic topics
allowing the user to interact on the topic they are interested in.
In their research, Bogers & Wernersen (2014), found that most Reddit users
visit the website for entertainment purposes. However, the research has also shown
that information gain is another predominant motive to visit Reddit. In addition to
Bogers & Wernersen (2014), Reddit can be classified as a curated news recourse due
to the wide variety in quality and the way that high quality content reaches the top
of the page by up-voting. Moreover, in their research, Becker (2013) positively
discusses Reddit as an online learning environment.
Despite these findings, caution is warranted when using Reddit as a reliable
news or educational source. Research shows that two types of users can be classified:
the silent majority and the vocal minority, where the vocal minority is a small
proportion, yet highly active part of all the users (Mustafaraj, Finn, Whitlock, &
Metaxas, 2011). With respect to cryptocurrency subreddits, Mai et al. (2018) found
that the silent majority of Reddit users primarily drive fluctuations in Bitcoin.
Furthermore, Singer, Flöck, Meinhart, Zeitfogel, & Strohmaier (2014, p1) suggest
that: “Reddit has transformed itself from a dedicated gateway to the Web to an
increasingly self-referential community that focusses on and reinforces its own user-
generated image- and textual content over external sources”. Hence, when using
Reddit for educational purposes, the user might have to reconsider the value of
content since the silent majorities contribute less in subreddits and the information
is often self-referential. Moreover, regarding sentiment, the possibility arises that in
fact the silent minority of opinions in a subreddit, counts for the majority of the
concerned subreddit and will not be representative for the mass or day to day
fluctuations in cryptocurrencies.

14
2.3 Sentiment
Detecting and expressing emotions is something that is learned in the early stages of
human life. A vast amount of research has been conducted on how people express
these emotions or opinions trough verbal and non-verbal communication and how to
asses these expressions (Bradley & Lang, 1994). Since the rise of the internet,
communication is predominantly digital. Naturally, communication through the
ether, often where communication partners are thousands of kilometres apart,
requires an alternative way of expressing emotions or opinions. One of these
alternatives for expressing or assessing emotions in text-based communications are
emoticons (Derks, Bos, & von Grumbkow, 2007; Walther & D’addario, 2001). Today,
emoticons, such as smileys, are integrated with our day to day communication
through the internet. However, research has shown that emoticons are mostly
complementary and text including emoticons is not interpreted differently compared
to the same text without emoticons (Walther & D’addario, 2001). Therefore, the
challenge arises for alternative and accurate detection of emotions and opinions in
text-based communication such as internet forums. New methods for the detection of
emotions in text has been a topic of research for many years and researchers have
made considerable progress addressing this problem of ‘opinion mining’ or ‘sentiment
analysis’. (S.-M. Kim & Hovy, 2004; Melville, Gryc, & Lawrence, 2009; Nasukawa,
Nasukawa, Yi, & Yi, 2003; Zhang & Liu, 2016). However, a complete and accurate
solution for emotion detection in text-based communication might still be far away
(Zhang & Liu, 2016).
Yet, successful examples of sentiment analysis are reported often, for
example, using movie reviews to predict movie revenue (Joshi, Das, Gimpel, &
Smith, 2010), analysing sentiment towards US presidential candidates in 2012
(Wang, Can, Kazemzadeh, Bar, & Narayanan, 2012), and (more relevant to this
thesis) the prediction in stock markets using sentiment obtained from twitter (Bollen
et al., 2011; Mittal & Goel, 2012; Pimprikar et al., 2017; Rao & Srivastava, 2012).
2.3.1 VADER sentiment analyser
Research has been conducted on various ways of sentiment analysis. One approach
for sentiment analysis is the Valence Aware Dictionary and sEntiment Reasoner
(VADER) (C. J. Hutto & Gilbert, 2014). VADER is a freely downloadable package
written in the programming language Python, which is capable of analysing
sentiment in English written text. Specifically, VADER is designed to classify
sentiment in microblog-like context such as internet forums like Reddit. It is

15
constructed using both qualitative and quantitative methods combined with multiple
web specific lexicons and is capable of outperforming eleven sentiment analysis tools
with respect to classification accuracy. The VADER package allows the user to
calculate the polarity scores of the input text in terms of negativity, positivity,
neutrality and a compound score. The compound score is a normalised and weighted
score and described as: “the most useful metric if you want a single unidimensional
measure of sentiment for a given sentence” (C. Hutto, 2018). Since VADER is
specifically designed for sentiment classification in microblog-like context such as
internet forums, this method is particularly suitable for sentiment classification for
Reddit comments.
2.4 Recurrent Neural Network: LSTM
Recurrent Neural Networks (RNN) are a well-known technique in the field of
artificial intelligence and data science and are used to perform predictions on unseen
data. Where Neural Networks use feed forward signals, a RNN is a type of Neural
Network where neurons provide feedback to each other via a loop. Hence, a RNN is
capable of learning sequences and temporal processing and can therefore be applied
to forecasting problems (Connor, Martin, & Atlas, 1994). Prior research has shown
that RNN’s yield impressive performance in several applications; for example,
Google’s Deepmind RNN outperformed a complex Convolutional Neural Network in a
multi-digit house number recognition problem (Ba, Mnih, & Kavukcuoglu, 2014).
Furthermore, researchers have successfully used RNN’s for end-to-end speech
recognition and long term wind speed and power forecasting (Barbounis, Theocharis,
Alexiadis, & Dokopoulos, 2006; Graves & Jaitly, 2014).
A type of RNN is the Long Short-Term Memory (LSTM) model which was
first introduced by Hochreiter & Urgen Schmidhuber (1997). The advantage of the
LSTM over traditional RNN’s is that it is capable of learning long time lag problems
and additionally generalizes well for smaller lag problems (Hochreiter & Urgen
Schmidhuber, 1997). Furthermore, learning these long time sequences is default
behaviour for a LSTM (Olah, 2015). When compared to a traditional RNN, which
uses one activation layer (figure 1), the LSTM has four activation layers in each
LSTM cell (figure 2). Additionally, an input gate, output gate and a LSTM specific
‘forget gate’, allows the LSTM to forget irrelevant information, selectively update
cells based on new input and decide which part of the cell to output (Suresh, 2016).

16
Figure 1: Traditional RNN with one activation layer in each cell. Reprinted from
Understanding LSTM networks, by Colah, 2015, retrieved from
http://colah.github.io/posts/2015-08-Understanding-LSTMs
Figure 2: LSTM with four activation layers in each cell. Reprinted from
Understanding LSTM networks, by Colah, 2015, retrieved from
http://colah.github.io/posts/2015-08-Understanding-LSTMs
Figure 3: Notation used in figure 1 and 2. Reprinted from Understanding LSTM
networks, by Colah, 2015, retrieved from http://colah.github.io/posts/2015-08-
Understanding-LSTMs

17
The prediction of financial assets using a LSTM is a rather new research
topic. Yet, using these techniques, researchers have found that a LSTM provides
superior results in prediction of stock market price movement when compared to
traditional statistical methods (Nelson et al., 2017). Furthermore, using a LSTM for
cryptocurrency price prediction results in improved performance in comparison with
the ARIMA statistical model and traditional machine learning models respectively
(Karakoyun & Çibikdiken, 2018; Snihovyi, Ivanov, & Kobets, 2015).
18
3 Methods
This chapter will provide the methods that were used in order to produce results.
First, chapter 3.1 describes the collection and characteristics of the two datasets that
are used. The steps that were taken in pre-processing the data are discussed in
section 3.2. In the last section, 3.3, the methods of the machine learning model are
discussed.
3.1 Data
For the analysis, the programing language Python was used in a Jupyter
environment. The prediction analysis was performed on the combined dataset,
Reddit comment data and cryptocurrency price data respectively. Each of the three
datasets from the cryptocurrencies (Ethereum, Litecoin and Ripple) were kept
separate to perform analysis per cryptocurrency. The steps that were taken in this
analysis were identical for each of the cryptocurrencies. The used timeframe for the
analysis was between 1st of January 2016 to 31st of December 2017.
3.1.1 Reddit comment data
The website www.reddit.com provides an API (Application Programming Interface)
designed for developers to build automated tools such as moderation bots and
programs which interact with Reddit. Since Reddit restricted the timeframe for
searching submissions and comments using their API, the website www.pushshift.io
was used for data collection (Baumgartner, n.d.). This website provides detailed
documentation for using an API in order to gain access to a database which holds
every public comment and submission made in the history of Reddit. The Reddit
comment data was scraped separately for each cryptocurrency subreddit using a
script written in the programming language Python (appendix A) and was saved as a
json file for further analysis.
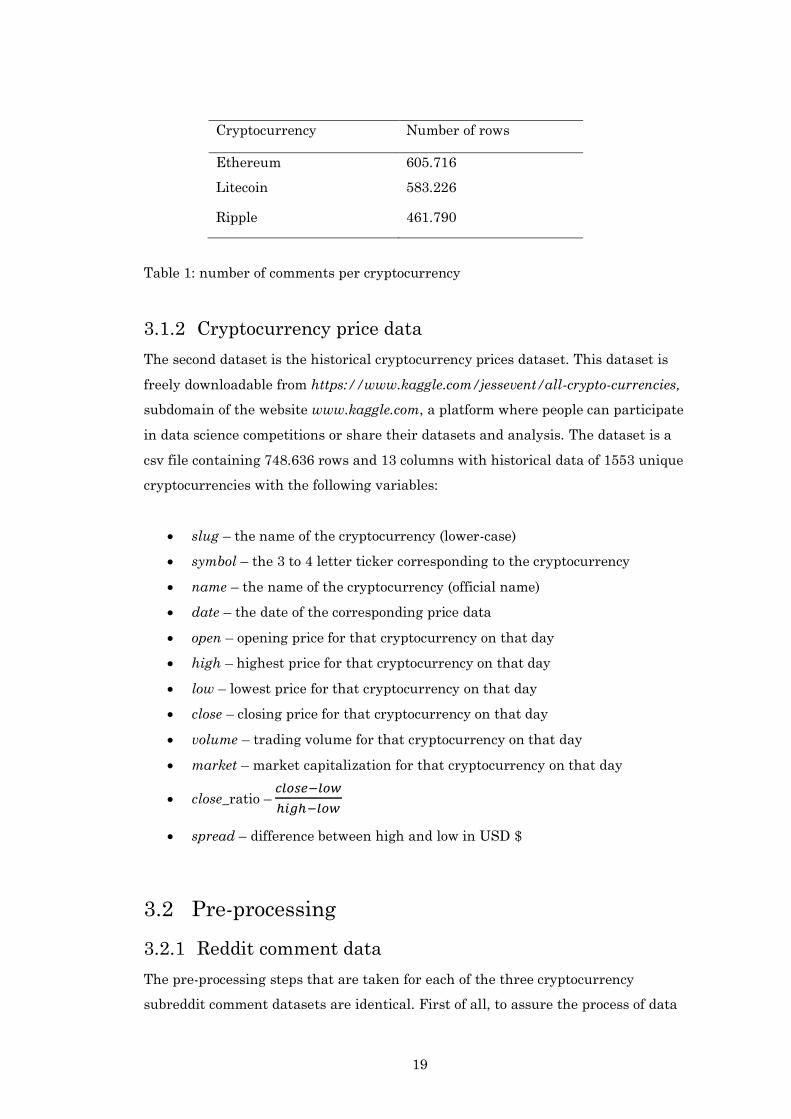
In total, the Reddit comment data consisted of three separate datasets, one
for each respective cryptocurrency subreddit. Each of the datasets contain 40
columns with detailed information on every comment. Each separate row
corresponds to a unique comment made in the history of the subreddit. Information
regarding the number of rows, hence separate comments, can be found in table 1.
19
Cryptocurrency Number of rows
Ethereum 605.716
Litecoin 583.226
Ripple 461.790
Table 1: number of comments per cryptocurrency
3.1.2 Cryptocurrency price data
The second dataset is the historical cryptocurrency prices dataset. This dataset is
freely downloadable from https://www.kaggle.com/jessevent/all-crypto-currencies,
subdomain of the website www.kaggle.com, a platform where people can participate
in data science competitions or share their datasets and analysis. The dataset is a
csv file containing 748.636 rows and 13 columns with historical data of 1553 unique
cryptocurrencies with the following variables:
• slug – the name of the cryptocurrency (lower-case)
• symbol – the 3 to 4 letter ticker corresponding to the cryptocurrency
• name – the name of the cryptocurrency (official name)
• date – the date of the corresponding price data
• open – opening price for that cryptocurrency on that day
• high – highest price for that cryptocurrency on that day
• low – lowest price for that cryptocurrency on that day
• close – closing price for that cryptocurrency on that day
• volume – trading volume for that cryptocurrency on that day
• market – market capitalization for that cryptocurrency on that day
• close_ratio – 𝑐𝑙𝑜𝑠𝑒−𝑙𝑜𝑤
ℎ𝑖𝑔ℎ−𝑙𝑜𝑤
• spread – difference between high and low in USD $
3.2 Pre-processing
3.2.1 Reddit comment data
The pre-processing steps that are taken for each of the three cryptocurrency
subreddit comment datasets are identical. First of all, to assure the process of data

20
scraping has been without error, the datasets were checked for unique comment id’s.
Subsequently, irrelevant columns were dropped to maintain overview of the data.
The data was then filtered on created_utc to fit the required two-year timeframe
between 1st of January 2016 to 31st of December 2017 and transformed from UNIX
epoch time to a more easily readable datetime format. Furthermore, comments with
a comment body containing ‘[removed]’ or ‘[deleted]’ were removed since these
comments influence the calculation of sentiment.
Using the open-source Python package VADER Sentiment analysis, the
sentiment for each individual comment is calculated. These sentiment scores, being
negative, neutral, positive, and compound score, as described in 2.3.1, were then
added as new columns to each corresponding comment. After calculation of the
sentiment scores for each comment, the dataset was grouped on date and the mean of
the sentiment scores for that day was calculated and added to the column compound.
Furthermore, the amount of comments for that day were summed and added to a
new column numcomments. After these pre-processing steps, the three
cryptocurrency subreddit comment datasets contain the following variables:
• created_utc – the date
• score – mean karma score of comments on that day
• compound – mean of daily compound score of sentiment calculation
• neg – mean of daily negative sentiment score
• neu – mean of daily neutral sentiment score
• pos – mean of daily positive sentiment score
• numcomments – daily number of comments
Finally, the three datasets each corresponding to a cryptocurrency subreddit were
saved in a pickle file format for further analysis.
3.2.2 Cryptocurrency price data
The historical cryptocurrency price data was divided into three datasets where each
dataset corresponds to a unique cryptocurrency, Ethereum, Litecoin and Ripple
respectively. Subsequently, each of the datasets was filtered on date to fit the two-
year timeframe between 1st of January 2016 to 31st of December 2017. Furthermore,
for explorative purposes, several price related metrics were calculated and added as
the following new variables:

21
• prices – open, high, low and close average (OHLC average)
• delta_day – ℎ𝑖𝑔ℎ − 𝑙𝑜𝑤
• pct_change – daily percentage change of prices
• log_pct_change – logarithm of pct_change
Finally, the three price datasets each corresponding to a specific cryptocurrency were
saved in a pickle file format for further analysis.
3.2.3 Merging
After pre-processing of the cryptocurrency subreddit comment dataset and the
cryptocurrency price dataset, the two datasets were merged on the date as index. The
merge results in datasets containing 730 rows for Ethereum and Litecoin. Due to
days without comment activity in the subreddit, the merged dataset of Ripple
resulted in 583 rows, each row corresponding to one day.
3.2.4 Normalisation
Using the sklearn preprocessing package MinMaxScaler, the data was normalised to
coherent values between 0 and 1 to minimize errors in the model that are caused by
a wide variety of prices.
3.2.5 Supervised learning
The LSTM model learns from time series such as historical values of a
cryptocurrency. Therefore, the data must be reframed to a supervised learning
dataset, from a sequence, to pairs of input and output sequences.
The reframing was done using a script written in the programming language Python.
Depending on which input variables and the number of days in the past that are
considered for prediction, the data was reframed using the variable n_days and
n_features to match the required input shape for the model. The output format of the
supervised learning function results in data that is usable for multi-day lag time step
forecasting (t-n) to predict the current time step (t), where n is the number of days
(table 2). Subsequently, due to the t-n shift, the first n observation in each column of
each dataset became a NaN value and was therefore removed. Example output from
the supervised learning function can be found in table 2.

22
Row X input value (t-2) X input value (t-1) y target value (t)
1 NaN NaN 1
2 NaN 1 2
3 1 2 3
4 2 3 4
5 3 4 5
Table 2: Explanatory table for supervised reframing
3.2.6 Correlation and visualization
In order to decide which variables will be used in the models and for explorative
purposes, the variables prices, volume, delta_day and numcomments were tested on
the value of Pearson’s correlation coefficient . The values of the correlation
coefficient were printed in a correlation matrix for a precise overview. Furthermore,
since the variable compound has values in range -1 to 1, the Pearson correlation
could not be tested on a linear relationship. Hence, Spearman’s correlation was used
to test the correlation coefficient for a non-linear relationship. Finally, using the
Python matplotlib package, several plots were generated to investigate certain
relationships between variables.
3.3 Predictive model
In order to evaluate the predictive value of several variables on the fluctuations and
price of a cryptocurrency for the next day, five analysis and one baseline analysis
were performed. Each of the LSTM model analysis made use of the same parameters.
The following paragraphs will discuss the steps that were taken to choose the best
parameters for the model and to perform each of the analyses. To ensure
reproducibility of the experiments, the random seed was set to the fixed number
1337. Furthermore, all of the necessary Python packages were installed at the
beginning of the analysis.
3.3.1 Train-test split
Previous research has shown that sklearn TimeSeriesSplit results in no improvement
for the performance of a time series model with a small number of elements. (Peralta,
Gutierrez, & Sanchis, 2009; Peralta, Li, Gutierrez, & Sanchis, 2010). Hence, a
traditional way of train-test split was used. The data was split into a train and test

23
set with 80% being allocated to the train set and 20% to the test set. Since this is a
time series problem and the model learns from sequences in time, the train-test split
was done by allocating the train and test sets trough chronological order. This
resulted in the first 583 samples as train data and the last 146 samples as test data
for the Ethereum and Litecoin data, and the first 465 samples as train data and the
last 117 samples as test data for the Ripple data. In combination with the supervised
learning function, the dimensions of the input data are transformed to a time series
format: (samples, timesteps, features).
3.3.2 Base LSTM model
To evaluate the predictive score of the historical prices variable on the direction and
the exact price of tomorrow, for each of the cryptocurrencies, a Long Short-Term
Model (LSTM) with one layer was trained and fitted. Before the model could be
trained, the data was reframed to supervised learning dimensions as discussed in
3.2.5. After the reframing, the input variable was: prices (t-1) from the day before.
The data was then split in train and test sets, were the input shape of the array was
( n, 1, 1 ) with n being the number of samples as described in 3.3.1. After explorative
training of the model, the range of optimal parameters were found. Using
KerasRegressor from scikit-learn in combination with GridsearchCV from sklearn,
the optimal parameters for the model were found using the training set. Setting
GridsearchCV n_jobs parameter to -1 in order to maximize parallel computing power
of the quad core processor that was used, all combinations of the following
parameters were considered as shown in table 3:
Optimizer Epochs Batch
size
Units
LSTM
cell
Dropout
rate
L1, L2
regularization
Adam 100 70 1 0.0 none
Softmax 130 72 2 0.1 L1 0.0
Relu 150 74 3 0.2 L1 0.01
tanh 76 5 L2 0.0
10 L2 0.01
20 L1L2 0.0
50 L1L2 0.01
Table 3: Parameters tested for LSTM using GridsearchCV
24
After evaluation, the model with the lowest mean absolute error was chosen:
optimizer: Adam, number of epochs: 130, batch size: 72, units in LSTM cell: 20,
dropout rate: 0.0 and regularization: none.
The base LSTM model was trained and fitted with the shuffle parameter set
to False since this is a time series problem which requires non-shuffled data as input
for the model. The model was evaluated by minimizing the mean absolute error as a
loss function. Furthermore, the model was used to make a prediction on the test set.
To evaluate the performance of the model, the array with predicted values was first
inverse transformed by using the sklearn MinMaxScaler package to match the scale
of original price values. Since this is a regression problem, classification performance
metrics are not applicable for exact price prediction. Therefore, the performance of
the model on the test set for the prediction of exact prices, was evaluated using the
Root Mean Squared Error metric together with the Mean Absolute Percentage Error
as error metrics, since MAPE is the preferred metric for forecast accuracy
classification due to its simplicity (Hyndman & Koehler, 2006):
𝑅𝑀𝑆𝐸 = √∑(𝑦�̂� − 𝑦𝑖)2
𝑛
𝑛
𝑖=1
𝑀𝐴𝑃𝐸 = 1
𝑛 ∑
|𝑡𝑟𝑢𝑒 − 𝑝𝑟𝑒𝑑𝑖𝑐𝑡𝑒𝑑|
|𝑡𝑟𝑢𝑒|
𝑛
𝑖=1
Moreover, the predicted values were stored in a Pandas dataframe and were
compared to the real values in terms of percentage deviation. Subsequently, the
direction (up, down) of the predicted variables were compared to the direction of the
real cryptocurrency market and were evaluated in terms of the percentage of correct
predicted market direction (accuracy). Additionally, to extend the results that can be
used for trading decisions, the percentage of absolute variance of incorrect predictions
was calculated to indicate how far off the incorrect predictions are.
Finally, output classes were created to indicate how good the model would
perform when used for positive return in trades only, which translates to only buying
the cryptocurrency when the price will go up the next day, hence being a buy
indicator. The True Positive class corresponds to a correct prediction of the market
going up were as True Negative corresponds to a correct prediction of the market not
going up as shown in table 4. The F1-score could be calculated using the precision
and recall metric as follows:

25
𝐹1 = 2 ∗𝑅𝑒𝑐𝑎𝑙𝑙 ∗ 𝑃𝑟𝑒𝑐𝑖𝑠𝑖𝑜𝑛
𝑅𝑒𝑐𝑎𝑙𝑙 + 𝑃𝑟𝑒𝑐𝑖𝑠𝑖𝑜𝑛
Where precision is the model’s ability to return only relevant instances (up/up):
𝑃𝑟𝑒𝑐𝑖𝑠𝑖𝑜𝑛 = 𝑇𝑃
𝑇𝑃 + 𝐹𝑃
And recall is the model’s ability to classify all relevant instances (up/up and
down/down):
𝑅𝑒𝑐𝑎𝑙𝑙 = 𝑇𝑃
𝑇𝑃/𝐹𝑁
Predicted
Class = Up Class = Not up
True Class = Up True Positive False Negative
Class = Not up False Positive True Negative
Table 4: Created classes for direction of cryptocurrency rate
3.3.3 LSTM including sentiment
To evaluate the predictive value of cryptocurrency subreddit sentiment, the base
LSTM model was trained and fitted with the sentiment for that previous day as an
extra input feature. The sentiment of the specific day was calculated using the
methods discussed in 2.3.1 and 3.2.1. Before the model could be trained, the data had
to be reframed to supervised learning dimensions as discussed in 3.2.5. After the
reframing, the input variables were compound (t-1) from the day before, and prices (t-
1), from the day before. The data was then split in train and test sets, were the input
shape of the array was (n, 1, 2). Finally, the model was trained and fitted using the
parameters descried in 3.3.2 and evaluated using the metrics identical to the base
LSTM model described in 3.3.2

26
3.3.4 LSTM including number of comments
To evaluate the predictive value of the number of comments made daily in a
cryptocurrency subreddit, the base LSTM model was trained and fitted with the
number of comments as extra input feature.
Before the model could be trained, the data had to be reframed to supervised
learning dimensions as discussed in 3.2.5. After the reframing, the input variables
were numcomments (t-1) and prices (t-1) similarly, from the day before. The data was
then split in train and test sets, were the input shape of the array was (n, 1, 2).
Finally, the model was trained and fitted using the parameters descried in 3.3.2 and
evaluated using the metrics identical to the base LSTM model described in 3.3.2.
3.3.5 LSTM 3-day lag
To evaluate to what extent multiple lag timesteps have a predictive value on the
direction and the exact price of tomorrow, a 3-day lag input-output pair was created.
Using the supervised learning function discussed in 3.2.5, the input data was
reframed, resulting in the variables: price (t-3) from three days before, price (t-2)
from two days before and price (t-1) from the day before. The data was then split in
train and test sets, were the input shape of the array was (n, 3, 1). Finally, the model
was trained and fitted using the parameters descried in 3.3.2 and evaluated using
the metrics identical to the base LSTM model described in 3.3.2.
3.3.6 LSTM including sentiment and number of comments
For explorative purposes, the combination of number of comments and the sentiment
as predictive variables was evaluated. Before the model could be trained, the data
had to be reframed to supervised learning dimensions as discussed in 3.2.5. After the
reframing, the input variables were numcomments (t-1) from the day before,
compound (t-1) from the day before and prices (t-1) from the day before. The data was
then split in train and test sets, were the input shape of the array was (n, 1, 3).
Finally, the model was trained and fitted using the parameters descried in 3.3.2 and
evaluated using the metrics identical to the base LSTM model described in 3.3.2.
3.3.7 LSTM including volume and explorative variables
For explorative purposes, the total trade volume for the previous day as a predictive
variable was evaluated. Before the model could be trained, the data had to be
reframed to supervised learning dimensions as discussed in 3.2.5. After the

27
reframing, the input variables were volume (t-1) and prices (t-1) similarly, from the
day before. The data was then split in train and test sets, were the input shape of the
array was (n, 1, 2).
Secondly, the predictive value of volume together with compound was
evaluated. The data was first reframed to supervised learning dimensions as
discussed in 3.2.5. After the reframing, the input variables were volume (t-1) from
the day before, compound (t-1) from the day before and prices (t-1) from the day
before. The data was then split in train and test sets, were the input shape of the
array was (n, 1, 2).
Thirdly, the predictive value of volume together with numcomments was
evaluated. The data was first reframed to supervised learning dimensions as
discussed in 3.2.5. After the reframing, the input variables were volume (t-1) from
the day before, numcomments (t-1) from the day before and prices (t-1) from the day
before. The data was then split in train and test sets, were the input shape of the
array was (n, 1, 2).
Finally, the models were trained and fitted using the parameters described in
3.3.2 and evaluated using the metrics identical to the base LSTM model described in
3.3.2.

28
4 Results
This chapter will provide the results of the study in this thesis. In 4.1 the correlation
between variables will be reported. Furthermore, explorative plots will be depicted.
In 4.2 the results of the LSTM model for every setup on the Ethereum dataset will be
discussed. Section 4.3 will then in turn discuss the results of an identical analysis
discussed in 4.2 but applied on the Litecoin dataset. The last section, 4.4, will discuss
the results of an identical analysis of the one discussed in 4.2 and 4.3, but in this
case applied on the Ripple dataset.
4.1 Exploratory correlations and plots
In order to decide which variables will be used in the models, and for explorative
purposes, Pearson’s correlation was tested for the variables prices, volume,
delta_day and numcomments. Furthermore, the variables prices, volume, delta_day
and compound were tested on Spearman’s correlation coefficient due to the non-
linearity of the variable compound.
4.1.1 Ethereum
The Ethereum dataset showed correlations between price related variables (prices,
volume, delta_day) as shown in table 5. The highest Pearson correlation comes from
price related variables volume – delta_day (0.917, p < .001). Furthermore,
numcomments did not show any strong correlation with other variables.
Variables Correlation Sig. (2-tailed)
prices – volume 0.867 < 0.001
prices – delta_day 0.756 < 0.001
prices – numcomments 0.232 < 0.001
volume – delta_day 0.917 < 0.001
volume – numcomments 0.265 < 0.001
delta_day – numcomments 0.241 < 0.001
Table 5: Pearson’s correlations for the Ethereum dataset
29
Finally, when testing for Spearman’s correlation coefficient in the Ethereum dataset,
the variables prices and compound showed a significant but weak negative 2-tailed
Spearman correlation (-0.311, p < .001)
4.1.2 Litecoin
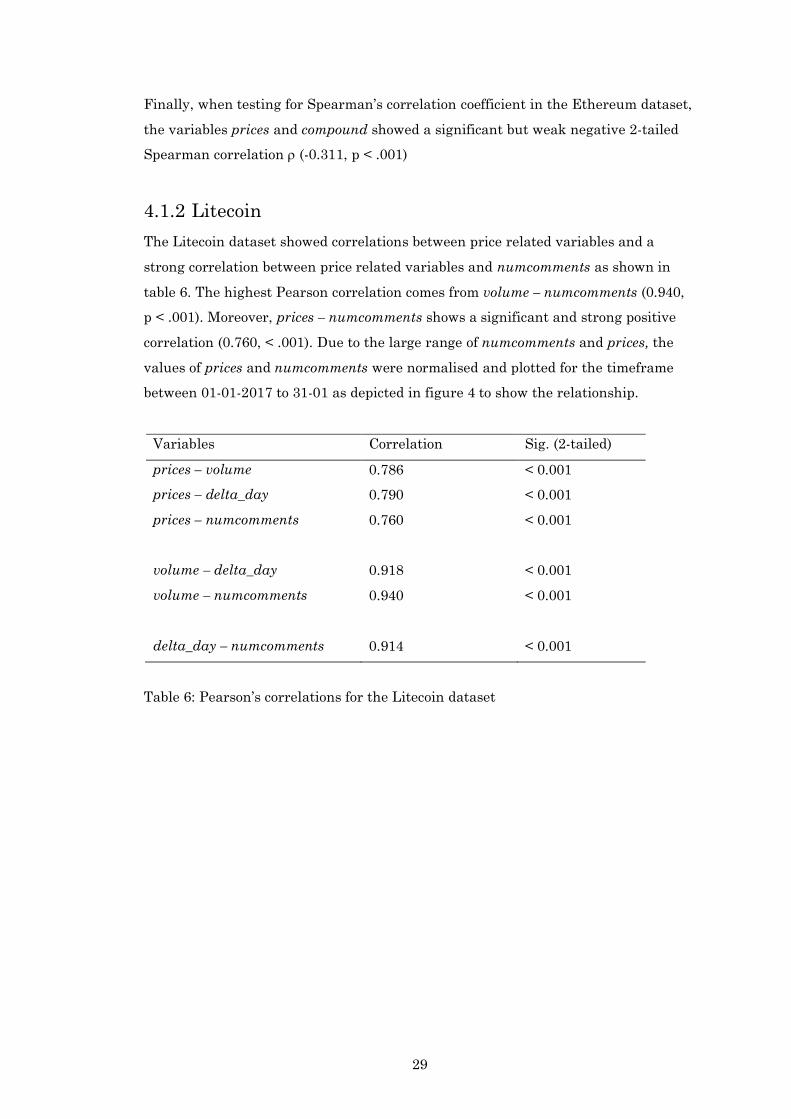
The Litecoin dataset showed correlations between price related variables and a
strong correlation between price related variables and numcomments as shown in
table 6. The highest Pearson correlation comes from volume – numcomments (0.940,
p < .001). Moreover, prices – numcomments shows a significant and strong positive
correlation (0.760, < .001). Due to the large range of numcomments and prices, the
values of prices and numcomments were normalised and plotted for the timeframe
between 01-01-2017 to 31-01 as depicted in figure 4 to show the relationship.
Variables Correlation Sig. (2-tailed)
prices – volume 0.786 < 0.001
prices – delta_day 0.790 < 0.001
prices – numcomments 0.760 < 0.001
volume – delta_day 0.918 < 0.001
volume – numcomments 0.940 < 0.001
delta_day – numcomments 0.914 < 0.001
Table 6: Pearson’s correlations for the Litecoin dataset

30
Figure 4: Plot of normalised values of prices and numcomments for Litecoin between
01-01-2017 and 31-12-2017
Furthermore, testing for Spearman’s correlation coefficient in the Litecoin dataset,
the variables prices and compound showed no correlation.
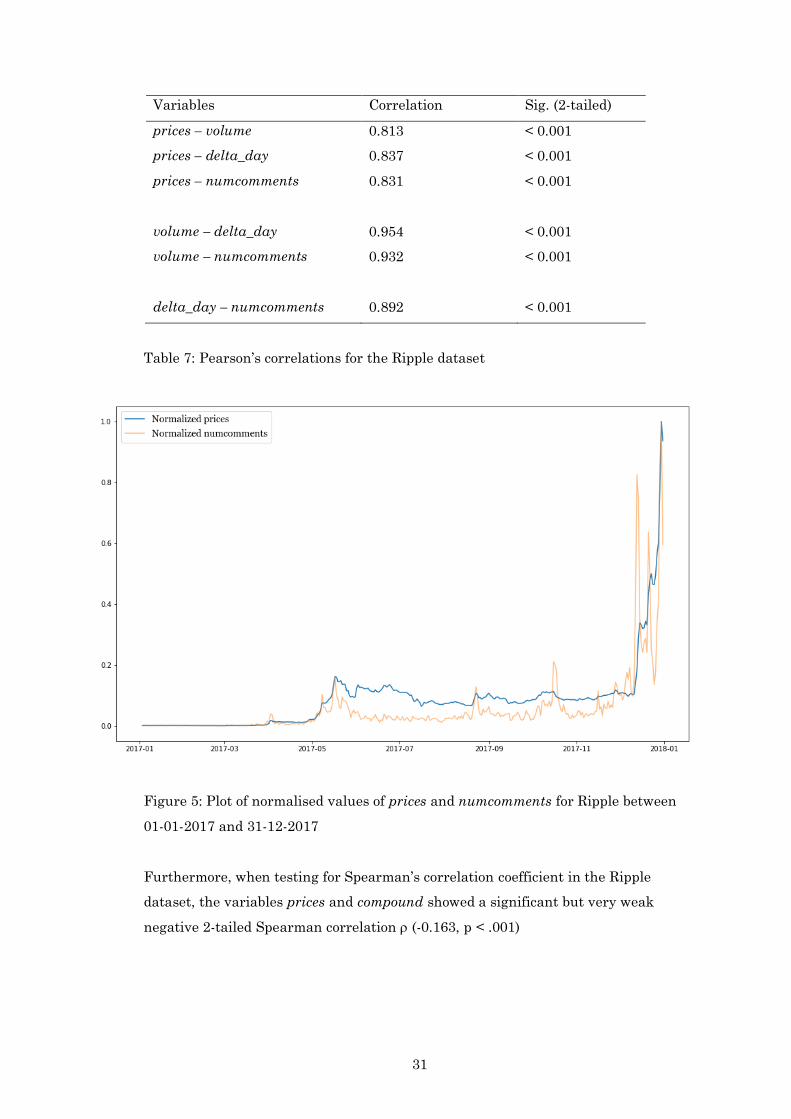
4.1.3 Ripple
The Ripple dataset showed correlation between price related variables and a strong
correlation between price related variables and numcomments as shown in table 7.
The highest Pearson correlation comes from volume – delta_day (0.940, p < .001).
Moreover, prices – numcomments shows a significant and strong positive correlation
(0.831, < .001). Similar to Litecoin, the values of prices and numcomments were
normalised and plotted for the timeframe between 01-01-2017 to 31-01 as depicted in
figure 5 to show the relationship.
31
Variables Correlation Sig. (2-tailed)
prices – volume 0.813 < 0.001
prices – delta_day 0.837 < 0.001
prices – numcomments 0.831 < 0.001
volume – delta_day 0.954 < 0.001
volume – numcomments 0.932 < 0.001
delta_day – numcomments 0.892 < 0.001
Table 7: Pearson’s correlations for the Ripple dataset
Figure 5: Plot of normalised values of prices and numcomments for Ripple between
01-01-2017 and 31-12-2017
Furthermore, when testing for Spearman’s correlation coefficient in the Ripple
dataset, the variables prices and compound showed a significant but very weak
negative 2-tailed Spearman correlation (-0.163, p < .001)
32
4.2 Predictive models Ethereum
To evaluate and compare the predictive value of the input variables of the Ethereum
dataset, a base LSTM model was trained using prices (t-1) from the day before as
input variable X and prices (t) as target variable y as described in 3.3.2.
Subsequently, the model was fitted on the test set with 146 samples. The predicted
values in the base LSTM model showed a RMSE of 30.111 (MAPE = 3.98%) which
indicates the difference between the predicted values and the real market values.
Furthermore, the base LSTM model correctly classified the direction of tomorrows
market with 60% accuracy as either going up or going down with an incorrect
prediction absolute percentage variance of 4.8%. In terms of correct predicted this is
a small improvement over the majority baseline prediction accuracy for Ethereum
(54%).
The model with the best predictive value towards the exact price in terms of
RMSE, is the model with volume (t-1) added as an extra variable as described in
3.3.7. This model showed a RMSE of 22.216 (MAPE = 3.26%). The plot of the
predicted Ethereum prices against the true market prices for the best performing
model in terms of RMSE is shown in figure 6.
When addressing the accuracy of the correct prediction of the market
direction, the model with numcomments (t-1) added as an extra variable showed the
same score of 60% accuracy but a slightly higher absolute percentage variance for
incorrect predictions of 4.8% as the base model.
Furthermore, when evaluating the prediction accuracy in terms of F1-score,
the model with numcomments (t-1) added as an extra variable was able to correctly
predict 67% of the market going up, hence being positive trades. This F1 accuracy
score is the same for the base LSTM model.
The table with all the results of the tested models for Ethereum can be found
in appendix B.

33
Figure 6: Plot of best performing model in terms of RMSE for predicted values
against the true values of Ethereum
4.3 Predictive model Litecoin
As the analysis are identical for the three cryptocurrencies, the base LSTM model
was trained using prices (t-1) from the day before as input variable X and prices (t) as
target variable y as described in 3.3.2 to compare and evaluate the predictive value of
input variables for Litecoin. Subsequently, the model was fitted on the test set with
146 samples. The predicted values in the base LSTM model showed a RMSE of
18.527 (MAPE = 5.54%) which indicates the difference between the predicted values
and the real market values. Furthermore, the base LSTM model correctly classified
the direction of tomorrows market with 62% accuracy as either going up or going
down which is an improvement over the majority baseline prediction accuracy for
Litecoin (54%). In terms of absolute percentage variance for incorrect predictions, the
base LSTM model had a variance of 5.0%
The model with the best predictive value towards the exact price in terms of
RMSE, is the model with volume (t-1) and compound (t-1) added as extra variables as
described in 3.3.7. This model showed a RMSE of 13.629 (MAPE = 6.86%). The plot of
the predicted Litecoin prices against the true market prices for the best performing
model in terms of RMSE is shown in figure 7.

34
When addressing the accuracy of the correct prediction of the market
direction, the model with compound (t-1) and numcomments (t-1) added as extra
variables as described in 3.3.6 showed 65% accuracy with 6.0% absolute percentage
variance of incorrect predictions .
Furthermore, when evaluating the best prediction accuracy in terms of F1-
score, the model with compound (t-1) added as an extra variable was able to correctly
predict 68% of the market going up, hence being positive trades.
The table with all the results of the tested models for Litecoin can be found in
appendix C.
Figure 7: Plot of best performing model in terms of RMSE for predicted values
against the true values of Litecoin
4.4 Predictive model Ripple
Finally, to evaluate and compare the predictive value of the input variables of the
Ripple dataset, a base LSTM model was trained using prices (t-1) from the day before
as input variable X and prices (t) as target variable y as described in 3.3.2.
Subsequently, the model was fitted on the test set with 117 samples due to the
missing data in the Ripple dataset as described in 3.2.3. The predicted values in the
base LSTM model showed a RMSE of 0.069 (MAPE = 4.48%) which indicates the
difference between the predicted values and the real market values. Furthermore,
35
the base LSTM model correctly classified the direction of tomorrows market with
59% accuracy as either going up or going down. Therefore, the base LSTM model
made an improvement over the majority baseline prediction accuracy score (52%). In
terms of absolute percentage variance for incorrect predictions, the base model had a
variance of 3.6%
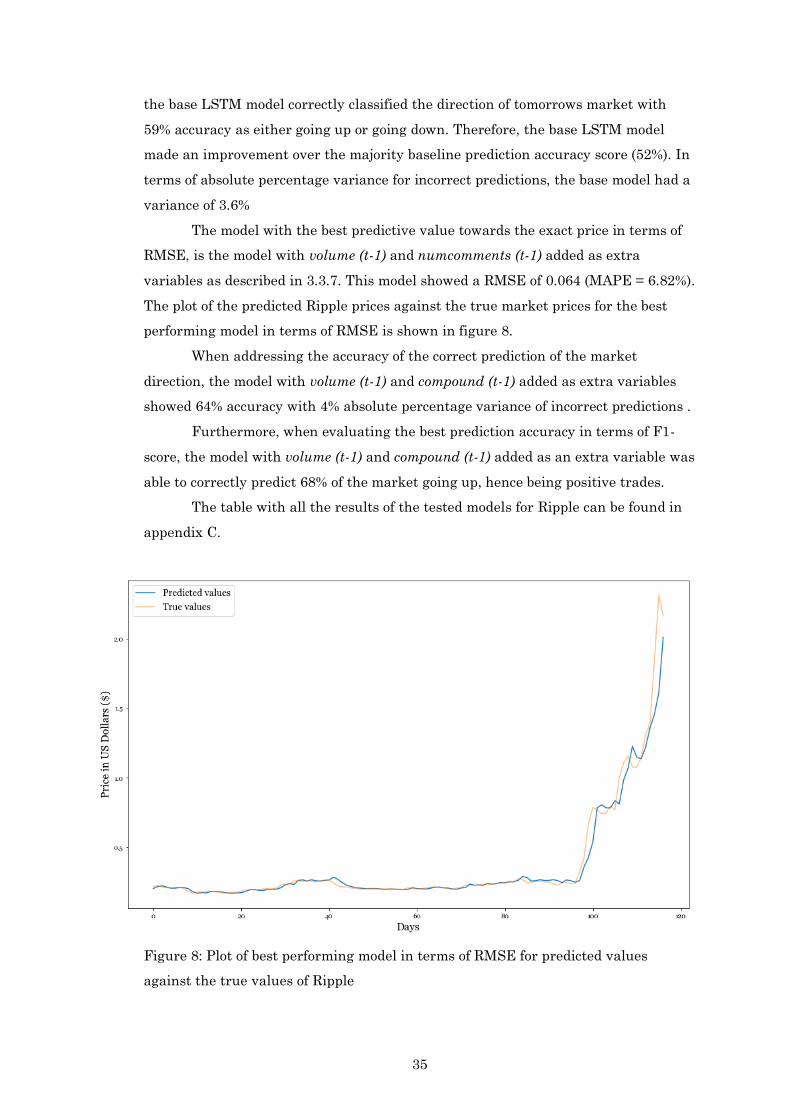
The model with the best predictive value towards the exact price in terms of
RMSE, is the model with volume (t-1) and numcomments (t-1) added as extra
variables as described in 3.3.7. This model showed a RMSE of 0.064 (MAPE = 6.82%).
The plot of the predicted Ripple prices against the true market prices for the best
performing model in terms of RMSE is shown in figure 8.
When addressing the accuracy of the correct prediction of the market
direction, the model with volume (t-1) and compound (t-1) added as extra variables
showed 64% accuracy with 4% absolute percentage variance of incorrect predictions .
Furthermore, when evaluating the best prediction accuracy in terms of F1-
score, the model with volume (t-1) and compound (t-1) added as an extra variable was
able to correctly predict 68% of the market going up, hence being positive trades.
The table with all the results of the tested models for Ripple can be found in
appendix C.
Figure 8: Plot of best performing model in terms of RMSE for predicted values
against the true values of Ripple

36
5 Discussion
In this chapter, the interpretation of the given results in chapter 4 will be presented.
An interpretation of the results will be given in 5.1 for each cryptocurrency
individually. Furthermore, section 5.2 will discuss the shortcomings and limitations
of this research. Finally, in section 5.3 the possibilities for future research will be
discussed.
5.1 Interpretation of results
The goal of this study was to evaluate the possible relationship between comments
on Reddit and cryptocurrency prices. Before performing the prediction analysis, the
variables in each dataset were tested on Pearson’s or Spearman’s correlations to
discover possible relationships.
For Ethereum, the Pearson correlation tests show that the price related
variables correlated the most. Furthermore, when testing the sentiment variable
compound on Spearman’s correlations due to non-linearity, the analysis showed a
weak correlation. This indicates that there is no relationship between the comments
that are made in the subreddit r/Ethereum, and that these comments might not have
a predictive value towards the price of Ethereum. When performing the prediction
analysis, all of the extra added variables, except for the 3-day lag model, showed
small improvements in terms of RMSE. Moreover, when addressing the accuracies
and F1-scores, the base model prices (t-1), together with numcomments (t-1) added as
extra variable showed the same performance as the base LSTM model (67%
accuracy). This indicates that the number of comments in the subreddit r/Ethereum
lack predictive value towards Ethereum’s price. An explanation for the little to no
improvement over the base model, is that Ethereum is a significantly larger
cryptocurrency in terms of market cap and trading volume when compared to Ripple
and Litecoin. Therefore, Ethereum’s prices are influenced less by one social media
source such as Reddit or is mainly driven by other factors.
For Litecoin, the Pearson correlation tests show that, in contrast to
Ethereum and against expectations, the variable numcomments correlated highly
positive with price related variables. This indicates that there is a relationship
between the number of comments that are made daily with the trade volume and
price of Litecoin. Since this is a positive correlation, this means that if the number of
comments increase, the price of Litecoin increases or when the price of Litecoin
increase, the number of comments increase. Furthermore, the Spearman’s

37
correlation test showed no correlation between price related variables and the
sentiment variable compound which indicates there is no relationship between
today’s prices and todays sentiment in the subreddit r/Litecoin. However, when
performing the prediction analysis, the addition of yesterday’s volume (t-1) and
compound (t-1) resulted in an improvement towards the base model in terms of
RMSE. Moreover, the variable compound (t-1) improved the prediction in terms of
accuracy, and together with numcomments (t-1) as extra variable it made an
improvement in the models F1-score despite the fact that there is no correlation
between prices and compound. A possible explanation for this extra predictive value
of compound (t-1) together with numcomments (t-1) can be that yesterday’s
sentiment and number of comments does have a predictive value towards prices as
used in the analysis by shifting the variables t-1. In addition to these findings, one
can explain this predictive value due to the fact that Litecoin’s subreddit has over
300.000 comments in the year 2017, where Ethereum’s subreddit has just over
225.000 comments in the same year, despite the higher market capitalization and
trade volume. This translates to Litecoin having a more active community on Reddit.
For Ripple, correlation tests show similar results as the Litecoin dataset.
Pearson’s correlation shows that the variable numcomments correlates highly
positive with price related variables, which indicates that there is a relationship
between the amount of comments posted and the trade volume or price of Ripple.
Furthermore, Spearman’s correlation tests show a significant but very weak
correlation between prices and compound which indicates no clear relationship
between these variables. When addressing the predictive performance of the LSTM
model combined with extra input variables, the base model with volume (t-1) and
compound (t-1) show an improvement in accuracy (64%) as well as in F1-score (67%).
These scores indicate that yesterday’s trade volume (volume t-1) combined with
yesterday’s sentiment (compound t-1) show extra predictive value over the base
model. Remarkably, Ripple’s model with volume (t-1) and numcomments (t-1)
underperformed the base LSTM model despite the high Pearson’s correlation. A
possible explanation for this exception might be that trading volume does not imply
that fluctuations in price will happen. Yet the model will falsely predict these
fluctuations based on the number of comments together with trading volume. Apart
from the 3-day lag model and the abovementioned model, all of the extra input
variables show improvements in the model in terms of correct direction accuracy and
F1 scores, indicating a certain degree of predictive value in comment related
variables for the subreddit r/Ripple.

38
In conclusion, all of the base models show small improvements in terms of
accuracy, and F1-score when compared to the 1-day cryptocurrency price prediction
results in the research performed by Y. Bin Kim et al. (2016) and Nelson et al.
(2017), but underperforms on the accuracy scores in stock price market predictions
found by Bollen et al. (2011) and Patel et al. (2015). Fewer fluctuations in traditional
stock prices might be the reason for these differences in performance between
predictions in the cryptocurrency markets and predictions in the stock market.
Furthermore, complexity of the stock market prediction model and more extensive
research conducted by Bollen et al. (2011) and Patel et al. (2015) in the stock market
contributes to this.
5.2 Shortcomings
One of the main weaknesses of this research is the concept of predicting the next
day’s prices of cryptocurrencies based on external factors. As shown by Mai et al.
(2018), the relationship between social media and cryptocurrencies is present, yet
complex. Furthermore, cryptocurrency prices are influenced by numerous other
factors like: general news, sentiment on other internet forums or harmful events in
the world of cryptocurrencies such as hacks. For example, a sudden drop of more
than 35% in Ethereum’s price around 21 December 2017 can be observed when
inspecting the price graph for Ethereum. A logical explanation for this price drop, is
a malicious attack on a cryptocurrency exchange on 20 December 2017. Events like
these have a considerable impact on the trust and general sentiment towards the
market and are unaccounted for by a model which is trained on data with less
extreme and absolute fluctuations. Due to the complexity and the vast amount of
possible additional factors, this research had to be limited to four predictive variables
(prices, compound, numcomments and volume).
Regarding the data that was used in these analyses, the density of the data
can be considered a shortcoming. When analysing traditional stock markets,
researchers often use day to day historical price data for these analyses since
traditional stocks tend not to fluctuate as much. However, with the volatility of the
cryptocurrency market, researchers might prefer more dense data with smaller time
intervals as input. Additionally, sentiment on internet forums can change by the
hour so the same shortcoming of density might apply to the sentiment input data.
Creating and training a complex LSTM model requires heavy computing
power. Despite the rather good specifications of the system that was used to perform
the analyses of this research, a simple implementation of the LSTM was chosen

39
because of the time-consuming and computational extensive training process.
Moreover, since the prediction analysis was a time-series problem, a chronological
way of train-test split had to be used as described in 3.3.1. This way of train-test split
resulted in the test data having more fluctuation in prices than the train data due to
a highly volatile period of December 2017. Therefore, sudden upward or downward
motions in the market are not expected by the model.
5.3 Future research
One of the shortcomings in this research is that it limits itself to Reddit as a source
of sentiment towards cryptocurrency markets. Previous research has shown that the
relationship between cryptocurrency prices and social media is complex (Mai et al.,
2018). A challenging topic for feature research is therefore to investigate these
relationships in more detail. Additionally, relevant future research can investigate
the relationship between cryptocurrency prices and external factors like market
manipulation or general news. Furthermore, as discussed in 2.2, the silent majority
might be a better indication of the sentiment on social media. Therefore, an
interesting topic for future research is to investigate the relationship between the
silent majority’s sentiment and cryptocurrency prices.
To investigate if the simple LSTM model is capable of producing higher
accuracy scores, future research can use denser data for cryptocurrency prices as
well as Reddit sentiment. Instead of using day to day time intervals, future
researchers can use smaller time intervals, like hour to hour, which leads to an
increase in training and test data. Furthermore, with more computational power, the
performance of a more complex model with more hidden layers and longer sequences
should be considered. This increase in the complexity of the model may lead to a
model that is able to take market lag and momentum into account.
Finally, a general interesting topic is that of predicting the future price of
financial assets. Naturally, when succeeding such a challenge, the results can lead to
a huge financial advantage. However, if a model predicts that the price of a certain
cryptocurrency will go up, users of this model will start buying this cryptocurrency
which leads to a higher demand. Subsequently, a higher demand for a certain
cryptocurrency will cause the price to go up, resulting in a self-fulfilling prophecy of
the model. A rather interesting phenomenon can therefore occur when a model is
being able to predict future prices highly accurately based on historical prices and
other factors, when these models are being used to actually trade based on these

40
predictions. This may lead to a battle of the bots: who started using a model first or
which of the models is best in adapting the trade behaviour of other models.

41
6 Conclusion
The purpose of this research was to investigate a possible relationship between
cryptocurrency prices and comments made on the social media website Reddit. In
this chapter, a summary will be made of the three research questions and the
problem statement.
6.1 RQ1: possible relationship
Research question one was as follows: To what extent is there a relationship between
subreddit comments and cryptocurrency price fluctuations?
Correlation tests were performed between price related variables and comment
related variables for each cryptocurrency individually. There was no clear
relationship found between Ethereum prices and the sentiment or number of
comments of Ethereum’s subreddit. For both Litecoin and Ripple, the correlation
tests showed that the number of comments that were made on that day correlated
highly with price related variables. Regarding sentiment, no strong correlation was
found for any of the cryptocurrencies.
6.2 RQ2: nature of the relationship
Research question two was as follows: What is the nature of the relationship between
subreddit comments and cryptocurrency price fluctuations.
The relationship between Reddit comments and Ethereum’s price barely seem to
exist. However, Litecoin and Ripple prices do seem to be related to the number of
comments that are made on that day. More specifically, the relationship indicates
causality of the number of comments rising when prices rise and vice versa. This
relationship derives from the desire to discuss the concerned cryptocurrency when
the prices are rising, or not discussing it when prices are dropping.
6.3 RQ3: possibilities for prediction
Research question three was as follow: Can machine learning methods be used to
predict cryptocurrency prices based on subreddit comments?

42
Using a LSTM model, additionally with Reddit comment variables, the exact price of
tomorrow, and direction of tomorrows cryptocurrency market were predicted. The
results and the interpretation of these results show that it is possible to predict
tomorrows exact prices or the direction of the market to some extent. In general, the
model where the number of comments made on the previous were day added as an
extra variable (possibly with other extra variables), shows the best predictive value.
Yet, the model’s performance, while significant, is not sufficiently accurate to base
trading decisions on.
6.4 Problem statement
The problem statement of this research was: To what extent there exists a
relationship between subreddit comments and cryptocurrency price fluctuations?
The results have shown that such relationships exist for Litecoin and Ripple, but not
for Ethereum. Furthermore, this research has shown that this relationship can, for
the relevant cryptocurrencies, be used to predict tomorrow’s price or market direction
with some accuracy. However, the models used, do not have a sufficiently high
accuracy to use them for trading purposes.

43
References
Alexa. (2018). Reddit.com Traffic, Demographics and Competitors - Alexa. Retrieved June 25,
2018, from https://www.alexa.com/siteinfo/reddit.com
Armknecht, F., Karame, G. O., Mandal, A., Youssef, F., & Zenner, E. (2015). Ripple: Overview
and outlook. Lecture Notes in Computer Science (Including Subseries Lecture Notes in
Artificial Intelligence and Lecture Notes in Bioinformatics), 9229, 163–180.
http://doi.org/10.1007/978-3-319-22846-4_10
Ba, J., Mnih, V., & Kavukcuoglu, K. (2014). Multiple Object Recognition with Visual Attention,
1–10. Retrieved from http://arxiv.org/abs/1412.7755
Barbounis, T. G., Theocharis, J. B., Alexiadis, M. C., & Dokopoulos, P. S. (2006). Long-term wind
speed and power forecasting using local recurrent neural network models. IEEE
Transactions on Energy Conversion, 21(1), 273–284. http://doi.org/10.1109/TEC.2005.847954
Baumgartner, J. (n.d.). pushshift.io - Learn about Big Data and Social Media Ingest and
Analysis. Retrieved June 14, 2018, from https://pushshift.io/
Becker, B. (2013). Learning Analytics: Insights Into the Natural Learning Behavior of Our
Students. Behavioral and Social Sciences Librarian, 32(1), 63–67.
http://doi.org/10.1080/01639269.2013.751804
Bogers, T., & Wernersen, R. (2014). How `Social’ are Social News Sites? Exploring the
Motivations for Using Reddit.com. IConference 2014 Proceedings, 329–344.
http://doi.org/10.9776/14108
Bollen, J., Mao, H., & Zeng, X. (2011). Twitter mood predicts the stock market. Journal of
Computational Science, 2(1), 1–8. http://doi.org/10.1016/j.jocs.2010.12.007
Bradley, M., & Lang, P. J. (1994). Measuring Emotion: The Self-Assessment Semantic
Differential Manikin and the. Journal of Behavior Therapy and Experimental Psychiatry,
25(I), 49–59. http://doi.org/10.1016/0005-7916(94)90063-9
Buterin, V. (2014). A next-generation smart contract and decentralized application platform.
Etherum, (January), 1–36. http://doi.org/10.5663/aps.v1i1.10138
Chen, H., De, P., Hu, Y., & Hwang, B. H. (2014). Wisdom of crowds: The value of stock opinions
transmitted through social media. Review of Financial Studies, 27(5), 1367–1403.
http://doi.org/10.1093/rfs/hhu001
Coinmarketcap. (2018). All Cryptocurrencies | CoinMarketCap. Retrieved April 18, 2018, from
https://coinmarketcap.com/all/views/all/
Connor, J., Martin, R., & Atlas, L. (1994). Recurrent Neural Networks and Robust Time Series
Prediction. Neural Networks, IEEE …, 5(2), 240–254. http://doi.org/10.1109/72.279188
Derks, D., Bos, A. E. R., & von Grumbkow, J. (2007). Emoticons and Online Message
Interpretation, 1–10. http://doi.org/10.1177/0894439307311611
Ethereum. (2018). Mining. Retrieved from https://github.com/ethereum/wiki/wiki/Mining
Graves, A., & Jaitly, N. (2014). Towards End-To-End Speech Recognition with Recurrent Neural

44
Networks. JMLR Workshop and Conference Proceedings, 32(1), 1764–1772.
http://doi.org/10.1145/1143844.1143891
Hileman, G., & Rauchs, M. (2017). 2017 Global Cryptocurrency Benchmarking Study. SSRN
Electronic Journal. http://doi.org/10.2139/ssrn.2965436
Hochreiter, S., & Urgen Schmidhuber, J. (1997). Long Short-Term Memory. Neural Computation,
9(8), 1735–1780. http://doi.org/10.1162/neco.1997.9.8.1735
Huang, W., Nakamori, Y., & Wang, S. Y. (2005). Forecasting stock market movement direction
with support vector machine. Computers and Operations Research, 32(10), 2513–2522.
http://doi.org/10.1016/j.cor.2004.03.016
Hutto, C. (2018). vaderSentiment. Retrieved July 1, 2018, from
https://github.com/cjhutto/vaderSentiment/blob/master/README.rst
Hutto, C. J., & Gilbert, E. (2014). Vader: A parsimonious rule-based model for sentiment analysis
of social media text. Eighth International AAAI Conference on Weblogs and …, 216–225.
Retrieved from
http://www.aaai.org/ocs/index.php/ICWSM/ICWSM14/paper/view/8109%5Cnhttp://comp.soci
al.gatech.edu/papers/icwsm14.vader.hutto.pdf
Hyndman, R. J., & Koehler, A. B. (2006). Another look at measures of forecast accuracy.
International Journal of Forecasting, 22(4), 679–688.
http://doi.org/10.1016/j.ijforecast.2006.03.001
Jevons, W. (1859). Money and the mechanism of exchange. Oxford University.
http://doi.org/10.1016/0003-6870(73)90259-7
Joshi, M., Das, D., Gimpel, K., & Smith, a. N. (2010). Movie Reviews and Revenues: An
Experiment in Text Regression. Human Language Technologies: The 2010 Annual
Conference of the North American Chapter of the Association for Computational Linguistics,
293–296.
Karakoyun, E. \cSeyma, & Çibikdiken, A. O. (2018). Comparison of ARIMA Time Series Model
and LSTM Deep Learning Algorithm for Bitcoin Price Forecasting. Proceedings of MAC
2018 in Prague, 171.
Kim, Y. Bin, Kim, J. G., Kim, W., Im, J. H., Kim, T. H., Kang, S. J., & Kim, C. H. (2016).
Predicting fluctuations in cryptocurrency transactions based on user comments and replies.
PLoS ONE, 11(8), 1–17. http://doi.org/10.1371/journal.pone.0161197
Kim, S.-M., & Hovy, E. (2004). Determining the sentiment of opinions. Proceedings of the 20th
International Conference on Computational Linguistics - COLING ’04, 1367–es.
http://doi.org/10.3115/1220355.1220555
Litecoin. (2018). Litecoin Wiki. Retrieved May 21, 2018, from
https://litecoin.info/index.php/Main_Page
Mai, F., Shan, Z., Bai, Q., Wang, X. (Shane), & Chiang, R. H. L. (2018). How Does Social Media
Impact Bitcoin Value? A Test of the Silent Majority Hypothesis. Journal of Management
Information Systems, 35(1), 19–52. http://doi.org/10.1080/07421222.2018.1440774

45
McLeay, M., Radia, A., & Thomas, R. (2014). Money in the modern economy: an introduction.
Bank of England Quarterly Bulletin, 54(1), 4–13. Retrieved from
http://search.ebscohost.com/login.aspx?direct=true&db=bth&AN=95261805&site=ehost-live
McNally, S. (2016). Predicting the price of Bitcoin using Machine Learning.
Melville, P., Gryc, W., & Lawrence, R. D. (2009). Sentiment analysis of blogs by combining lexical
knowledge with text classification. Proceedings of the 15th ACM SIGKDD International
Conference on Knowledge Discovery and Data Mining - KDD ’09, 1275.
http://doi.org/10.1145/1557019.1557156
Mises, L. Von. (1953). The Theory of Money and Credit. Library, 493.
Mittal, A., & Goel, A. (2012). Stock prediction using twitter sentiment analysis. Standford
University, CS229 (2011 Http://Cs229. Stanford. Edu/Proj2011/GoelMittal-
StockMarketPredictionUsingTwitterSentimentAnalysis. Pdf), (June). Retrieved from
http://tomx.inf.elte.hu/twiki/pub/Tudas_Labor/2012Summer/GoelMittal-
StockMarketPredictionUsingTwitterSentimentAnalysis.pdf
Mustafaraj, E., Finn, S., Whitlock, C., & Metaxas, P. (2011). Vocal minority versus silent
majority: discovering the opinions of the long tail. SocialCom.
Nakamoto, S. (2008). Bitcoin: A Peer-to-Peer Electronic Cash System. Www.Bitcoin.Org, 9.
http://doi.org/10.1007/s10838-008-9062-0
Nasukawa, T., Nasukawa, T., Yi, J., & Yi, J. (2003). Sentiment analysis: Capturing favorability
using natural language processing. Proceedings of the 2nd International Conference on
Knowledge Capture, 70–77. http://doi.org/10.1145/945645.945658
Nelson, D. M. Q., Pereira, A. C. M., & De Oliveira, R. A. (2017). Stock market’s price movement
prediction with LSTM neural networks. Proceedings of the International Joint Conference on
Neural Networks, 2017–May(Dcc), 1419–1426. http://doi.org/10.1109/IJCNN.2017.7966019
Olah, C. (2015). Understanding lstm networks. GITHUB Blog, Posted on August, 27, 2015.
Patel, J., Shah, S., Thakkar, P., & Kotecha, K. (2015). Predicting stock and stock price index
movement using Trend Deterministic Data Preparation and machine learning techniques.
Expert Systems with Applications, 42(1), 259–268. http://doi.org/10.1016/j.eswa.2014.07.040
PayPal. (2018). PayPal. Retrieved May 17, 2018, from https://www.paypal.com/us/home
Peralta, J., Gutierrez, G., & Sanchis, A. (2009). Shuffle design to improve time series forecasting
accuracy. 2009 IEEE Congress on Evolutionary Computation, CEC 2009, 741–748.
http://doi.org/10.1109/CEC.2009.4983019
Peralta, J., Li, X., Gutierrez, G., & Sanchis, A. (2010). Time series forecasting by evolving
artificial neural networks using genetic algorithms and differential evolution. Neural
Networks (IJCNN), …, 18–23. http://doi.org/10.1109/IJCNN.2010.5596892
Pimprikar, R., Ramachadran, S., & Senthilkumar, K. (2017). Use of machine learning algorithms
and twitter sentiment analysis for stock market prediction. International Journal of Pure
and Applied Mathematics, 115(6), 521–526.
Ramis, J., Sherwin, L., & Pantoja, R. (2016). Cryptocurrency | Digital asset class of the future –
46
Bitcoin vs Ethereum? The Economist, 1–19. Retrieved from
http://www.economist.com/sites/default/files/economist_case_comp_ivey.pdf
Rao, T., & Srivastava, S. (2012). Analyzing Stock Market Movements Using Twitter Sentiment
Analysis. Proceedings of the 2012 International Conference on Advances in Social Networks
Analysis and Mining, 119–123. http://doi.org/10.1109/ASONAM.2012.30
Ray, J. (2018). Proof of Stake FAQ. Retrieved from https://github.com/ethereum/wiki/wiki/Proof-
of-Stake-FAQ
Reddit. (2018a). Homepage - Reddit. Retrieved June 24, 2018, from https://www.redditinc.com/
Reddit. (2018b). reddit: the front page of the internet. Retrieved April 4, 2018, from
https://www.reddit.com/
Ripple. (2018a). Market Performance | Ripple. Retrieved May 19, 2018, from
https://ripple.com/xrp/market-performance/
Ripple. (2018b). XRP | Ripple. Retrieved May 19, 2018, from https://ripple.com/xrp/
Singer, P., Flöck, F., Meinhart, C., Zeitfogel, E., & Strohmaier, M. (2014). Evolution of Reddit:
From the Front Page of the Internet to a Self-referential Community?
http://doi.org/10.1145/2567948.2576943
Snihovyi, O., Ivanov, O., & Kobets, V. (2015). Cryptocurrencies Prices Forecasting With
Anaconda Tool Using Machine Learning Techniques, 1–4.
Statista. (2018). • Reddit users: unique monthly visits 2017 | Statista. Retrieved April 4, 2018,
from https://www.statista.com/statistics/443332/reddit-monthly-visitors/
Suresh, H. (2016). Vanishing Gradients & LSTMs. Retrieved July 3, 2018, from
http://harinisuresh.com/2016/10/09/lstms/
Vries, A. De. (2018). Bitcoin ’ s Growing Energy Problem. Joule, 2(5), 801–805.
http://doi.org/10.1016/j.joule.2018.04.016
Walther, J. B., & D’addario, K. P. (2001). The Impacts of Emoticons on Message Interpretation in
Computer-Mediated Communication, 19(December), 1998–2000.
Wang, H., Can, D., Kazemzadeh, A., Bar, F., & Narayanan, S. (2012). A System for Real-time
Twitter Sentiment Analysis of 2012 U . S . Presidential Election Cycle. Proceedings of the
50th Annual Meeting of the Association for Computational Linguistics, (July), 115–120.
Wood, G. (2017). Ethereum: A Secure Decentralised Generalised Transaction Ledger, 1–32.
Zhang, L., & Liu, B. (2016). Sentiment Analysis and Opinion Mining. Encyclopedia of Machine
Learning and Data Mining, (May), 1–10. http://doi.org/10.1007/978-1-4899-7502-7_907-1

47
Appendices
A Reddit comment scraping script
import requests
import ujson as json
import re
import time
import pandas as pd
PUSHSHIFT_REDDIT_URL = "http://api.pushshift.io/reddit"
def fetchObjects(**kwargs):
# Default params values
params = {"sort_type":"created_utc","sort":"asc","size":1000}
for key,value in kwargs.items():
params[key] = value
print(params)
type = "comment"
if 'type' in kwargs and kwargs['type'].lower() == "submission":
type = "submission"
r = requests.get(PUSHSHIFT_REDDIT_URL + "/" + type +
"/search/",params=params)
if r.status_code == 200:
response = json.loads(r.text)
data = response['data']
sorted_data_by__id = sorted(data, key=lambda x: int(x['id'],36))
return sorted_data_by__id
def process(**kwargs):
max_created_utc = 0
max_id = 0
file = open("data.json","w")
while 1:
something_processed = False
objects = fetchObjects(**kwargs,after=max_created_utc)
for object in objects:
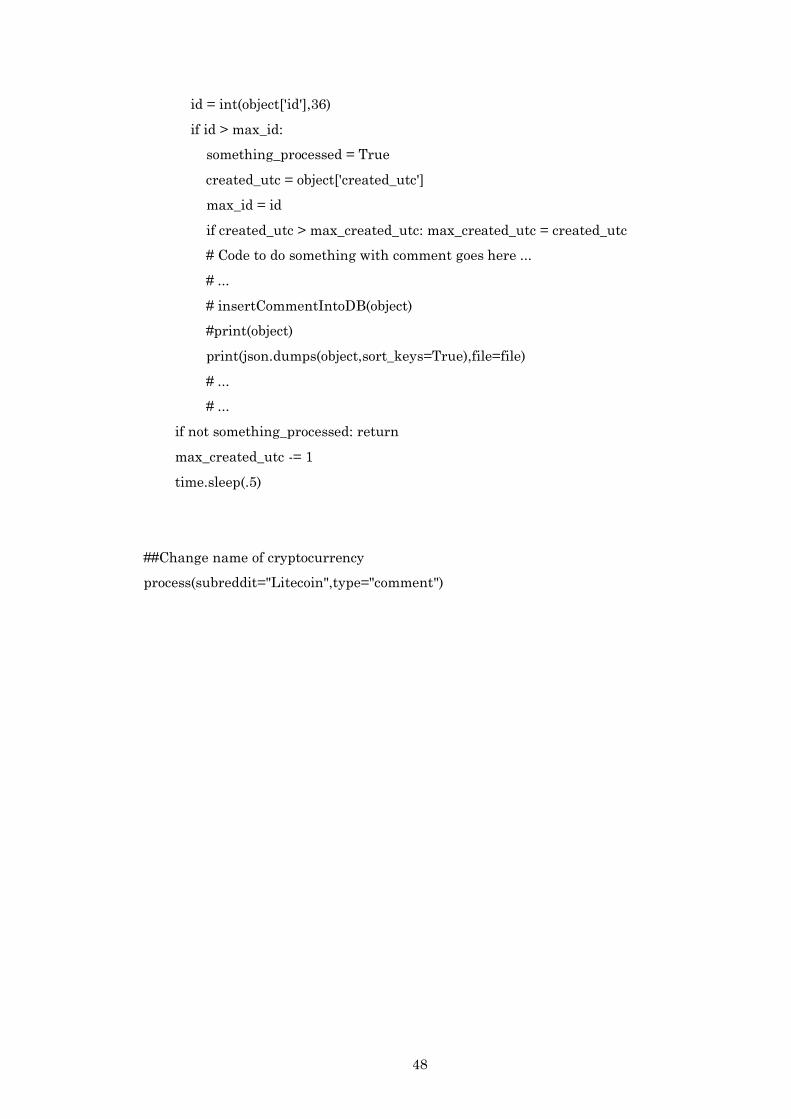
48
id = int(object['id'],36)
if id > max_id:
something_processed = True
created_utc = object['created_utc']
max_id = id
if created_utc > max_created_utc: max_created_utc = created_utc
# Code to do something with comment goes here ...
# ...
# insertCommentIntoDB(object)
#print(object)
print(json.dumps(object,sort_keys=True),file=file)
# ...
# ...
if not something_processed: return
max_created_utc -= 1
time.sleep(.5)
##Change name of cryptocurrency
process(subreddit="Litecoin",type="comment")

49
B Web link to full script in GitHub repository
https://github.com/u743346/LSTM-Cryptocurrencies/blob/master/Full%20script.ipynb

50
C Results LSTM models
Table 1: Results LSTM models for Ethereum dataset
Ethereum Base
model
Base +
compound
Base +
numcomments
Base +
compound and
numcomments
Base 3-
day lag
Base +
volume
Base +
volume
and
compound
Base + volume
and
numcomments
RMSE
(Root Mean
Squared Error)
30.311 29.156 30.196 27.826 31.357 22.216 27.250 22.405
MAPE (Mean
Absolute
Percentage Error)
3.98% 3.30% 3.51% 3.37% 5.65% 3.26% 5.40% 3.68%
Accuracy 59.59% 56.16% 59.59% 54.80% 56.85% 56.85% 51.37% 56.85%
F1-score 67.05% 63.59% 67.05% 61.99% 65.56% 63.95% 64.57% 63.95%
Variance wrong
predictions
4.80% 5.28% 4.95% 3.99% 5.59% 3.04% 4.84% 2.75%
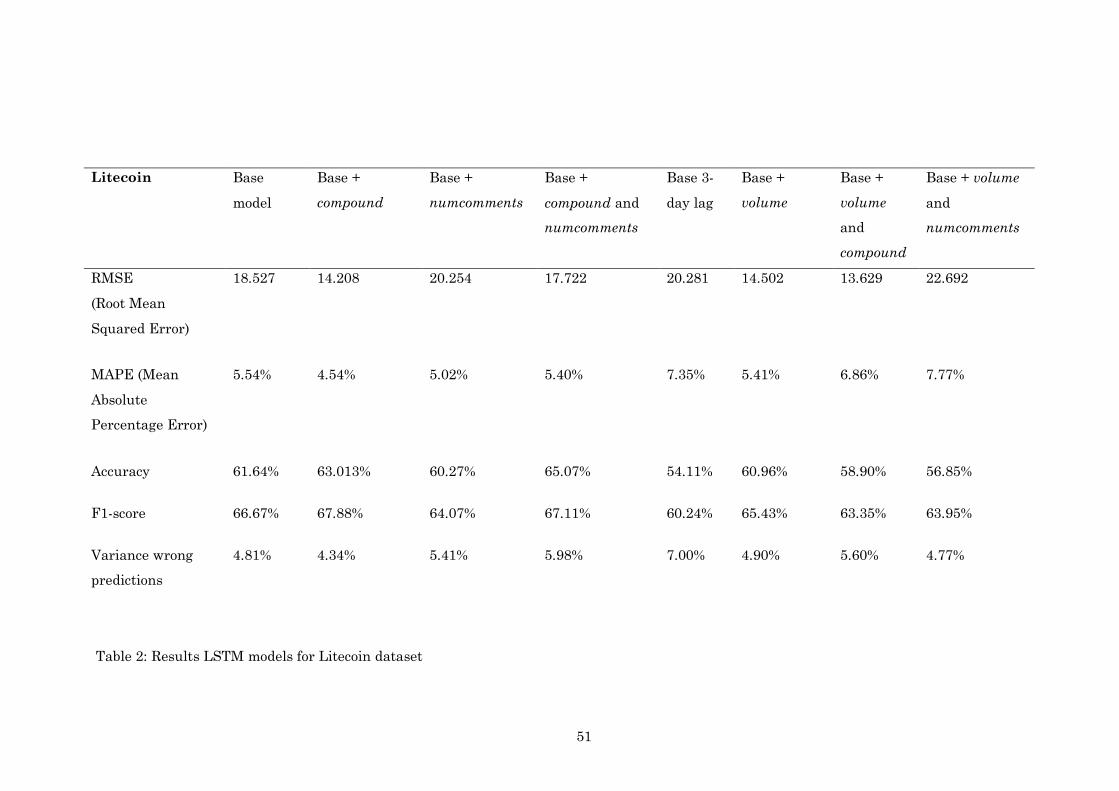
51
Table 2: Results LSTM models for Litecoin dataset
Litecoin Base
model
Base +
compound
Base +
numcomments
Base +
compound and
numcomments
Base 3-
day lag
Base +
volume
Base +
volume
and
compound
Base + volume
and
numcomments
RMSE
(Root Mean
Squared Error)
18.527 14.208 20.254 17.722 20.281 14.502 13.629 22.692
MAPE (Mean
Absolute
Percentage Error)
5.54% 4.54% 5.02% 5.40% 7.35% 5.41% 6.86% 7.77%
Accuracy 61.64% 63.013% 60.27% 65.07% 54.11% 60.96% 58.90% 56.85%
F1-score 66.67% 67.88% 64.07% 67.11% 60.24% 65.43% 63.35% 63.95%
Variance wrong
predictions
4.81% 4.34% 5.41% 5.98% 7.00% 4.90% 5.60% 4.77%
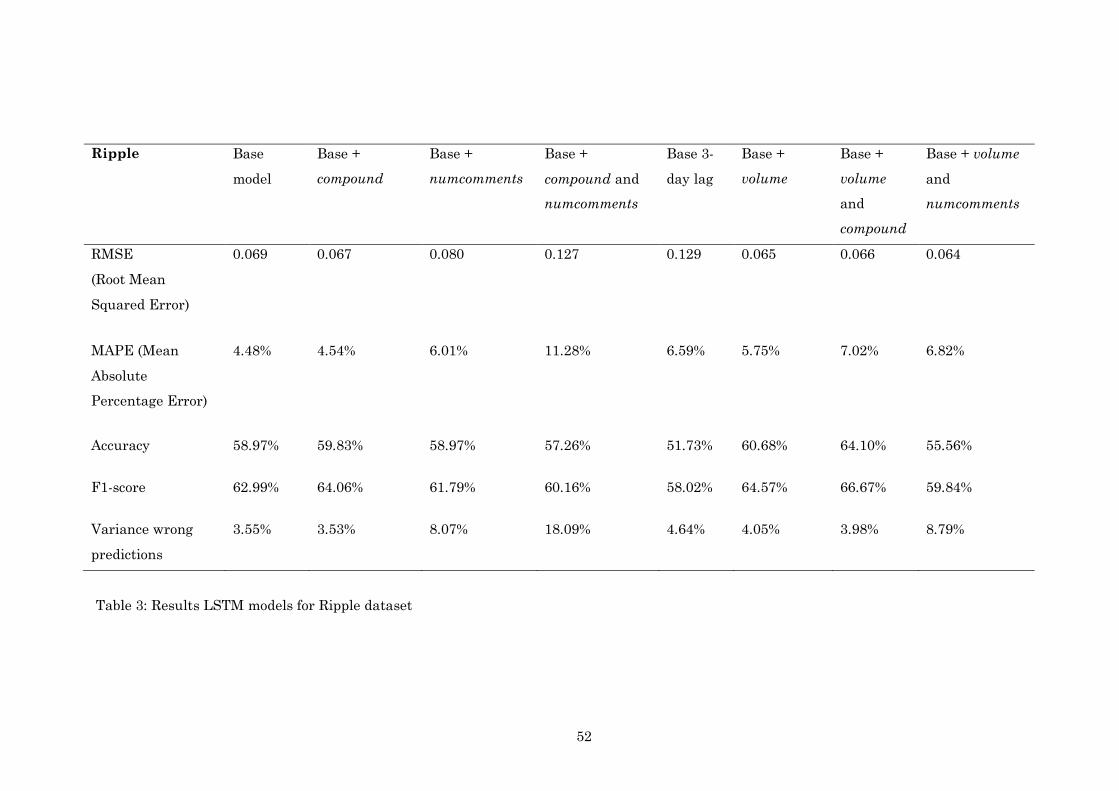
52
Table 3: Results LSTM models for Ripple dataset
Ripple Base
model
Base +
compound
Base +
numcomments
Base +
compound and
numcomments
Base 3-
day lag
Base +
volume
Base +
volume
and
compound
Base + volume
and
numcomments
RMSE
(Root Mean
Squared Error)
0.069 0.067 0.080 0.127 0.129 0.065 0.066 0.064
MAPE (Mean
Absolute
Percentage Error)
4.48% 4.54% 6.01% 11.28% 6.59% 5.75% 7.02% 6.82%
Accuracy 58.97% 59.83% 58.97% 57.26% 51.73% 60.68% 64.10% 55.56%
F1-score 62.99% 64.06% 61.79% 60.16% 58.02% 64.57% 66.67% 59.84%
Variance wrong
predictions
3.55% 3.53% 8.07% 18.09% 4.64% 4.05% 3.98% 8.79%