predicting the potential habitat of the harmful cyanobacteria lyngbya majuscula in the canary...
TRANSCRIPT

Harmful Algae 34 (2014) 76–86
Predicting the potential habitat of the harmful cyanobacteria Lyngbyamajuscula in the Canary Islands (Spain)
Laura Martın-Garcıa a,*, Rogelio Herrera b, Leopoldo Moro-Abad c, Carlos Sangil d,Jacinto Barquın-Diez a
a Animal Biology Department, University of La Laguna, Avda. Astrofısico Francisco Sanchez s/n, CP 38205 La Laguna, S/C de Tenerife, Spainb Servicio de Biodiversidad, Viceconsejerıa de Medio Ambiente, Edif. Usos Multiples II, C/Profesor Agustın Millares Carlo 18, CP 35071 Las Palmas de Gran
Canaria, Spainc Servicio de Biodiversidad, Viceconsejerıa de Medio Ambiente, Edif. Usos Multiples I, Avda. Anaga 35, Santa Cruz de Tenerife (S/C de Tenerife) CP 38071, Spaind Smithsonian Tropical Research Institute, Smithsonian Institution, 0843-03092 Ancon, Panama City, Panama
A R T I C L E I N F O
Article history:
Received 11 February 2013
Received in revised form 27 February 2014
Accepted 27 February 2014
Keywords:
Harmful algae
Ecological niche modeling
Canary Islands
Potential habitat
Maxent
A B S T R A C T
This study presents the ecological niche and the potential distribution of Lyngbya majuscula in the Canary
Islands (Spain) based on a bloom of this species on the eastern side of the Canarian Archipelago, in the
Marine Reserve of La Graciosa (MRG). This finding represents the first L. majuscula bloom recorded in
waters around the Canary Islands and this side of the Atlantic Ocean. The modeled suitability map
revealed a potential distribution of L. majuscula in rocky and sandy habitats within shallow and sheltered
areas exposed to sedimentation; where L. majuscula blooms had not previously been reported. The L.
majuscula bloom detected in MRG is affecting rocky and sandy communities in this area. The possible
expansion of these blooms may have harmful effects on important communities in the Canary Islands,
including some of high ecological importance such as the Cymodocea nodosa meadows. Results of the L.
majuscula distribution model presented here can be used to develop management strategies that avoid
or minimize the risk of future bloom occurrences or expansions and their negative effects on the
environment. The causes of L. majuscula blooms in MRG are being investigated.
� 2014 Elsevier B.V. All rights reserved.
Contents lists available at ScienceDirect
Harmful Algae
jo u rn al h om epag e: ww w.els evier .c o m/lo cat e/ha l
1. Introduction
Benthic cyanobacterial blooms appear to be becoming morenumerous, widespread, and persistent in some tropical andsubtropical marine bays, estuaries, and reef environmentsworldwide (Ahern et al., 2007, O’Neil et al., 2012). Such bloomshave also been found to negatively impact both the environmentand human health (Paerl and Fulton, 2006; Ahern et al., 2007).Benthic mats dominated by a mixed assemblage of filamentousnitrogen fixing and non-nitrogen fixing cyanobacteria, such as
Abbreviations: MRG, Marine reserve of la graciosa; DEMs, Digital elevation models;
Maxent, Maximum entropy; BPI, Benthic position index; VRM, Vector ruggedness
measure; REI, Relative exposition index; ROC, Receiver operating characteristic
analysis; AUC, Area under the ROC curve.
* Corresponding author. Tel.: +34 677 21 80 10.
E-mail addresses: [email protected], [email protected] (L. Martın-Garcıa),
[email protected] (R. Herrera), [email protected]
(L. Moro-Abad), [email protected] (C. Sangil), [email protected]
(J. Barquın-Diez).
http://dx.doi.org/10.1016/j.hal.2014.02.008
1568-9883/� 2014 Elsevier B.V. All rights reserved.
species of the genera Microcoleus, Oscillatoria, and Lyngbya, are animportant and highly productive component of marine intertidaland subtidal habitats (Paerl and Millie, 1996; Ahern et al., 2007).However, their capacity for rapid growth and spatial expansion inresponse to climatic and environmental stimuli (such as increasedwater temperature or nutrient input) can lead to the formation ofextensive, monospecific blooms that dominate the benthiccommunity (Stielow and Ballantine, 2003; Albert et al., 2005;Paul et al., 2005; Ahern et al., 2007).
One alga capable of forming harmful blooms is L. majuscula
Harvey ex Gomont 1892, previously cited in the literature asMicrocoleus lyngbyaceus (Kutzing). This non-heterocystous nitro-gen fixing cyanobacterium (family Oscillatoriaceae) (Diaz et al.,1990; Albert et al., 2005) forms benthic mats that grow either onthe sediment or loosely attached to substrates such as seagrass,macroalgae, corals, and rocky outcrops (Diaz et al., 1990; Stielowand Ballantine, 2003; Albert et al., 2005). L. majuscula occurs inintertidal and subtidal shallow zones and has a worldwidedistribution in subtropical, and especially tropical, estuarine,and coastal waters (Ahern et al., 2007). Blooms of L. majuscula have

L. Martın-Garcıa et al. / Harmful Algae 34 (2014) 76–86 77
been reported in several locations around Australia, mainly on theeastern coast of Queensland where blooms have in some casesbeen observed to continue for up to four months (Dennison et al.,1999; Albert et al., 2005; Arthur et al., 2006). L. majuscula bloomshave also been recorded in various locations around Florida,Hawaii, and in the Caribbean Sea (O’Neil et al., 2012).
Blooms of L. majuscula are known to negatively impact marineecosystems, for example, by overgrowing and smothering inter-tidal and subtidal benthic communities such as seagrasses andcoral communities (Stielow and Ballantine, 2003; Watkinson et al.,2005; Paul et al., 2005; Ahern et al., 2007). L. majuscula is alsoconsidered harmful to human health because it producesdermatitis and breathing difficulties in those who come intocontact with it. The species can also produce over 70 secondarymetabolites including tumor promoters, immunosuppressants,and cytotoxic compounds (Arthur et al., 2006; Ahern et al., 2007).In addition, blooms have an impact on economic activities incoastal zones, affecting both commercial and recreational indus-tries (O’Neil and Dennison, 2005; Ahern et al., 2007b).
Cyanobacterial blooms are brought about by complexprocesses, typically where many environmental factors actsynergistically (Heisler et al., 2008; O’Neil et al., 2012). Theappearance of L. majuscula blooms has been associated withphysical factors (warmer water temperatures, vertical stratifica-tion of the water column, higher irradiance, increased day length,the redox state of the sediments), chemical factors (increasedconcentration of organic matter and nutrients, trace elementenrichment), as well as biotic factors (lack of grazers, bacterialsynergism, symbionts; Ahern et al., 2007; Arthur et al., 2006; Belland Elmetri, 2007; Johnson et al., 2010; O’Neil et al., 2012).Despite that this algae is a benthic species, it has not beenconsidered the effect of the characteristics of a benthic habitatthat includes the topographic features, in the possible expansionof the algae.
Given the serious detrimental impacts of L. majuscula, it isnecessary to develop management strategies that prevent orminimize the risk of future blooms, their expansion and theireffects on the environment. Modeling techniques allow theintegration of multiple environmental variables to determinethe degree of influence each has over a species or even the dispersalability of a species (Elith et al., 2011). Currently, there is a widevariety of information available for use in modeling of marinespecies distribution: oceanographic data (surface sea temperature,chlorophyll levels, currents), climatic data (the occurrence andincidence of dust storms, winds), topographic data (bathymetry,slope, aspect, roughness), and anthropic data (presence orproximity of aquaculture areas, outfalls). The selection of variablesincorporated into any given model depends on many factorsincluding the spatial scale of the study, the availability of data, thespecies examined, and the objectives of the investigation. Instudies of benthic species and communities, regardless of whichmodeling technique is used, the main source of information is ahost of topographic variables created from digital elevation models(DEMs; Guisan and Zimmermann, 2000). These topographicvariables represent the most accurate information available aboutmarine environments and the most relevant predictors for benthicspecies distributions (Kostylev et al., 2001; Wilson et al., 2007;Martın-Garcıa et al., 2013). In most cases, information derivedfrom DEMs has a large influence on marine species distribution anddetermines the spatial resolution of the resulting model. Oceano-graphic variables, such as temperature or concentration ofnutrients, have previously been employed for modeling thedistribution of L. majuscula (Ahern et al., 2007; Hamilton et al.,2009; Kehoe et al., 2012). However, these variables (oceanograph-ic) can also produce erroneous results when used in local studies.Most oceanographic information is derived from remote sensing
data with a coarse spatial resolution of 2 km or more; their usewould be detrimental to a finer resolution study.
Currently, there are numerous methods for modeling thedistribution of species (Guisan and Zimmermann, 2000; Elith et al.,2006). The maximum entropy model (Maxent; Phillips et al., 2006)is one of the most commonly used tools for modeling marinespecies (Ready et al., 2010; Hermosilla et al., 2011; Howell et al.,2011; Jones et al., 2012; Martın-Garcıa et al., 2013). The Maxentsoftware package was designed to assess the geographic distribu-tion of species in relation to environmental variables with limitedpresence-only data (Phillips et al., 2006; Pearson et al., 2007;Phillips and Dudık, 2008). Moreover, various studies have provedthat Maxent tends to present the best results when ranked againstother methods (Elith et al., 2006; Hermosilla et al., 2011;Hernandez et al., 2008; Jones et al., 2012; Rupprecht et al.,2011; Martın-Garcıa et al., 2013). Maxent models are useful forpredicting how a native species might be distributed if they appearin a new geographical region or under different environmentalconditions. The model can therefore be used to forecast thepotential behavior of a species in response to environmentalchanges (Elith et al., 2006; Thuiller et al., 2004). Since the modelcan project a species’ distribution over a new area of interest, it canbe used to test whether such areas are suitable for the occurrenceof a species (Elith et al., 2011).
This article provides an insight to the ecological niche andpotential distribution of L. majuscula on a regional scale using a fineresolution. It also demonstrates how distribution models, based onthe species occurrence records and environmental layers repre-senting topographic and wave exposure information, can be usedto identify the areas of suitable habitat where L. majuscula could bedistributed across in the Canary Islands, using Maxent. Thedistribution model of L. majuscula is used to simulate how anexisting bloom might spread in the Canary Islands and potentiallyaffect other communities in the archipelago competing for thesame habitats or overgrowing and smothering them.
2. Material and methods
2.1. Description of the study area
The Canary Islands are a subtropical archipelago of volcanicorigin, located off the northwestern coast of Africa (Fig. 1a); thenearest island is 100 km from the mainland. Due to its relativelyclose proximity to Africa and the Sahara desert, the archipelago isinfluenced by coastal upwelling that produces complex mesoscalevariation in temperature and organic matter (Fig. 1b). Thearchipelago is made up of seven major islands and a group ofislets in the northeast where Marine Reserve of La Graciosa (MRG)is located. MRG is one of the largest marine reserves in Europe andcovers 706.34 km2 (Fig. 1c).
Wave exposure also varies within the islands according toshoreline orientation. The northern and northeastern coasts of theislands are the most exposed to waves action due to dominantwinds from the NE and fetch (a measure of coastal exposure towind and waves that corresponds to the length of water over whicha given wind blows).Western–southwestern shores are moresheltered in comparison. The volcanic origin of the Canary Islandsand associated geological processes mean the islands stand onnarrow platforms and between the islands waters reach depths ofup to 3000 m. The shallow bottoms immediately surrounding theislands are characterized by a seascape of rocky platforms, largestones, pebbles, and sandy patches. Erosion has generated a higherproportion of sandy or mixed substrates on the northern andeastern shores, especially around the two oldest islands of thearchipelago Lanzarote and Fuerteventura. By contrast, La Palmaand El Hierro, the western islands, have narrower platforms and

Figure 1. (A) Location of the Canary Islands and of Lyngbya majuscula blooms in relation to the global annual mean of sea surface temperature in 2010, supplied by satellite
data of Aqua-MODIS and SeaWiFS (http://oceancolor.gsfc.nasa.gov/). (B) Map of annual average SST, provided and adapted from CREPAD products, INTA, over the Canary
Islands in 2010 and the MRG (square). (C) Location of MRG and all sites sampled between 2010 and 2011.
L. Martın-Garcıa et al. / Harmful Algae 34 (2014) 76–8678
are dominated by rocky bottoms. The Canarian Archipelagobelongs to the Northeastern Atlantic Warm Temperate Region,the biogeographic region with the highest seaweed richness on thisside of the Atlantic (Hoek, 1984; Luning, 1990). Benthic flora andfauna around the Canary Islands consists of an ensemble of speciesfrom both warm temperate and tropical regions (Sanson et al.,2001; Brito and Ocana, 2004; Sangil et al., 2011). A number ofdifferent ephemeral species and cyanobacteria, including L.
majuscula, are part of the benthic community and algal assemblagein shallow water areas of all the islands (Haroun et al., 2002).
2.2. Species occurrence data
Two sampling surveys were undertaken in the MRG, one inOctober–November 2010 and a second in May 2011 to completethe sampling. The sampling process for data collection wasconsistent with the method described by Barquın-Diez et al.,2003, and used video samples in the MRG taken with anunderwater television system. Visual samples or video cameraimages were acquired to describe which communities andsubstrate types were present. The precise location of each samplewas recorded using an on-board Global Positioning System (GPS)and the mapping software Ozi Explorer (www.oziexplorer.com/).Video samples were recorded and exported as sample points inArcGIS 9.3 software. In total, 972 samples were taken, with anaverage distance of 78 m between sample sites (Fig. 1c).
2.3. Environmental data
Six topographical variables derived from the DEM of shallowbottoms (0–50 m depth) were used in the modeling frameworkusing ArcGIS v9.3 software (ESRI, California, USA). These variableswere bathymetry, slope, northness, eastness, benthic positionindex (BPI), and vector ruggedness measure (VRM). Theseparameters are commonly used in the modeling studies of benthicspecies (Wilson et al., 2007; Bekkby et al., 2009; Degraer et al.,
2008; Galparsoro et al., 2009; Martın-Garcıa et al., 2013). Byinterpreting the topographic information and video samples, it waspossible to classify (supervised classification) seafloor types aseither hard bottoms (rock, cobble, and boulder) or soft bottoms(mud, sand, and gravel). The classification of the substrates wasdifferent for each island, so we only consider the two generalcategories of soft and hard bottoms. The minimum distance fromhard to soft substrate was calculated for the entire study area, likethe measure of sedimentation, using the Spatial Analyst extensionof ArcGIS. Two different relative exposition indices (REI and REIb)were used to analyze the level of exposure to wind and waves; afundamental parameter for species distribution that can be ahighly significant predictor of physical and biological habitatconditions. For both indices, it was first necessary to create a fetchraster of the study area. Fetch values were calculated as theaverage distance in meters from each site to the nearest coastlinein the 16 direction wind rose, with 200 km as the maximumdistance (Burrows et al., 2008), and using a script in Avenuelanguage developed by the authors for ArcView 3.2. This scriptsignificantly reduces the computation time compared with otherESRI tools published in http://arcscripts.esri.com/given that thisscript was specified for the sort of input data used. REI wascalculated according to the method described by Ekebom et al.,2002, using the fetch raster and values of wind energy published byThe Technological Institute of Canary Islands (Canary Government,available at: www.itccanarias.org/recursoeolico/) in ArcGISformat. For each point, REI data were calculated as the averageof the product from each fetch and wind energy value, in the 16directions of the wind rose. Finally, we used the Wave ExposureModel (WEMo; Malhotra and Fonseca, 2007) to determine REIb
based on wind speed, fetch, and bathymetry. All the variables wereresampled to a common pixel size or resolution of 5 m throughoutthe Canary Islands and stored as GIS raster in ArcGIS. To avoidmulticollinearity and redundancy between variables in thedataset, preliminary analyses (results not included) of a selectionprocess based on the Pearson’s correlation index were applied in
L. Martın-Garcıa et al. / Harmful Algae 34 (2014) 76–86 79
ArcGIS. Variables were eliminated if they achieved a correlationindex higher than 0.7, which left a total of nine variables. Thecategorical variable about soft and hard substrate showed a highcorrelation with distance to soft substrate, therefore, we used onlythe last one for the modeling process. Other oceanographicvariables (e.g., superficial temperature, productivity, and watermass properties) provide essential information for modeling thedistribution of species on broader spatial scales, but they were notused here in the modeling process because the data were not ofadequate resolution for the regional spatial scale of the presentstudy. The descriptions and values of the variables used in themodeling are included in Table 1.
2.4. Habitat distribution modeling
Maxent v3.3.3. (Phillips et al., 2006; Phillips and Dudık, 2008)was used to model the distribution of L. majuscula in MRG and toassess the species’ response to the environmental variables listedin Table 1. Maxent is a general-purpose method for makingpredictions or inferences from incomplete information. It esti-mates the probability distribution (spatial distribution) of a target(L. majuscula) using presence-only data to give maximum entropy(the most uniform or spread-out distribution) subject to theconstraints of the variables, such as the known observations of thespecies. Continuous and categorical variables or predictors can beused in Maxent to define linear, quadratic, product, hinge, andthreshold terms. The regularization parameter of Maxent (in thisstudy, the default setting was maintained) ensures that the averagevalues of a given predictor in the estimated distribution match theempirical average. Predicted distribution is estimated by thelogistic format; the output map which shows pixel values rangingfrom 0 to 1 to indicate the probability of occurrence (where 1 is thehighest probability and 0 the lowest). The importance of eachenvironmental variable in the model was evaluated using responsecurves and jackknife tests that reflect the dependence of thepredicted probability on each variable. The evaluation analysis wasexecuted by initially running the model excluding one variable,then running the model with only one variable, and finally byincluding all variables in the model.
2.5. Model evaluation
Model accuracy was evaluated using the area under the receiveroperating characteristic (ROC) analysis (Liu et al., 2005). For that,the model was run using approximately 70% of the occurrencerecords as training points and 30% as independent test points, arecommended partition (Phillips et al., 2006), selected at randomin Maxent. The ROC curve plots the proportion of correctlypredicted presences against the fractional area predicted presence(in the case of presence-only models). The measure of predictiveperformance is the area under the ROC curve (AUC); values varybetween 0 and 1 and values above 0.5 (the area under the nullexpectations line) are indicative of predictions that are better thanrandom.
Finally, to validate the distribution model, visual inspections byscuba diving were carried out in 2011 and 2012 in shallow watersaround Lanzarote, Gran Canaria, Tenerife, and La Palma. Itexamined whether the visited locations had high coverage of L.
majuscula in order to be classified as absence or presence data. Avariation of the AUC method described by Benito et al. (2009) wasused with these observations to validate the distribution models ofL. majuscula in the archipelago. This method needs presence data,absence data, and a number of iterations (10,000) to compute AUCvalues. The mean of the 10,000 AUC values (AUCm) expresses theprobability that the suitability value of the presence record will behigher than the suitability value of the random plot.
2.6. Mapping areas of suitable habitat and analysis of the effects on
benthic communities
The resulting continuous probability map was exported as araster layer of ArcGIS 9.3. To delineate areas of suitable habitat,fixed thresholds of 0.8 and 0.6 were applied to the logisticsuitability map to create a discrete map which facilitatedecological interpretation. These thresholds were applied accordingto VanDerWal et al., 2009. The suitability value at a given pixel orsite is correlated with abundance or the maximum achievablebiomass; a high suitability value therefore represents a pixel wherea bloom could potentially be sustained (Pauly et al., 2011).Subsequently, in ArcGIS 9.3, discrete maps of suitability wereintersected with maps of the benthic communities in Canarianwaters 0–50 m depth. These maps of communities were createdusing the data from 2000 to 2008 based on video transects and theinterpretation of acoustic data from echosounders, provided by theSpanish Ministry of Environment (unpublished data). The resultswere used to determine which benthic communities are found insites with high suitability for L. majuscula blooms.
3. Results
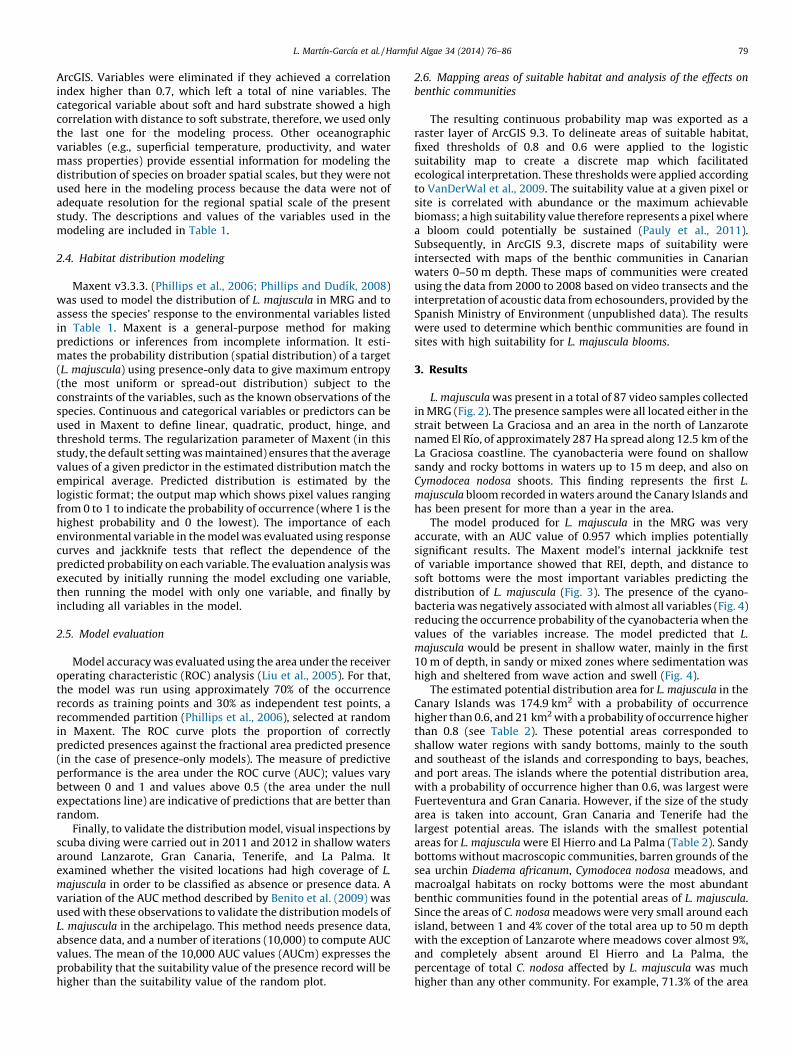
L. majuscula was present in a total of 87 video samples collectedin MRG (Fig. 2). The presence samples were all located either in thestrait between La Graciosa and an area in the north of Lanzarotenamed El Rıo, of approximately 287 Ha spread along 12.5 km of theLa Graciosa coastline. The cyanobacteria were found on shallowsandy and rocky bottoms in waters up to 15 m deep, and also onCymodocea nodosa shoots. This finding represents the first L.
majuscula bloom recorded in waters around the Canary Islands andhas been present for more than a year in the area.
The model produced for L. majuscula in the MRG was veryaccurate, with an AUC value of 0.957 which implies potentiallysignificant results. The Maxent model’s internal jackknife testof variable importance showed that REI, depth, and distance tosoft bottoms were the most important variables predicting thedistribution of L. majuscula (Fig. 3). The presence of the cyano-bacteria was negatively associated with almost all variables (Fig. 4)reducing the occurrence probability of the cyanobacteria when thevalues of the variables increase. The model predicted that L.
majuscula would be present in shallow water, mainly in the first10 m of depth, in sandy or mixed zones where sedimentation washigh and sheltered from wave action and swell (Fig. 4).
The estimated potential distribution area for L. majuscula in theCanary Islands was 174.9 km2 with a probability of occurrencehigher than 0.6, and 21 km2 with a probability of occurrence higherthan 0.8 (see Table 2). These potential areas corresponded toshallow water regions with sandy bottoms, mainly to the southand southeast of the islands and corresponding to bays, beaches,and port areas. The islands where the potential distribution area,with a probability of occurrence higher than 0.6, was largest wereFuerteventura and Gran Canaria. However, if the size of the studyarea is taken into account, Gran Canaria and Tenerife had thelargest potential areas. The islands with the smallest potentialareas for L. majuscula were El Hierro and La Palma (Table 2). Sandybottoms without macroscopic communities, barren grounds of thesea urchin Diadema africanum, Cymodocea nodosa meadows, andmacroalgal habitats on rocky bottoms were the most abundantbenthic communities found in the potential areas of L. majuscula.Since the areas of C. nodosa meadows were very small around eachisland, between 1 and 4% cover of the total area up to 50 m depthwith the exception of Lanzarote where meadows cover almost 9%,and completely absent around El Hierro and La Palma, thepercentage of total C. nodosa affected by L. majuscula was muchhigher than any other community. For example, 71.3% of the area

Table 1Mean and standard deviation (SD) for all variables considered in the modeling process for each island and the Canarian Archipelago as a whole. The names of the islands are abbreviated: MRG, Marine Reserve of La Graciosa; LZ,
Lanzarote; FV, Fuerteventura; GC, Gran Canaria; TF, Tenerife; LG, La Gomera; LP, La Palma; EH, El Hierro.
Parameter Description MRG LZ FV GC TF LG LP EH Canary Islands
Bathymetry Raster grid of the
bathymetric DEM with a
resolution of 5 m.
Calculated in meters (m).
�26.2�15.3 �27.9�17.5 �25.5�16.3 �24.0�14.6 �27.3�14.4 �28.5�15.6 �26.6�14.7 �20.6�14.7 �25.8�15.4
Slope The maximum rate of
change between each cell
or pixel and its neighbors.
Calculated in degrees (8).
2.4�3.3 3.0�4.6 1.4�2.2 1.5�2.1 3.2�3.6 3.1�3.5 5.0�6.6 9.5�9.2 3.8�4.4
Eastness Continuous indices to
measure the orientation of
the slopes relative to East
(�1 to +1).
0.08�0.69 0.0� 0.7 �0.09� 0.67 �0.06� 0.71 �0.04�0.69 �0.05�0.68 �0.14�0.73 0.01� 0.69 �0.05� 0.7
Northness Continuous indices to
measure the orientation of
the slopes relative to
North (�1 to +1).
0.28�0.67 �0.02� 0.72 0.12� 0.72 �0.08� 0.69 0.08�0.72 0.06�0.73 0.2�0.63 0.02� 0.72 0.05�0.7
VRM*100 Vector of roughness
measure. Terrain
complexity grid which
combines variation in
slope and aspect into a
single measure.
0.02�0.16 0.03� 0.15 0.02� 0.03 0.01�0.0001 0.02�0.09 0.04�0.29 0.07�0.4 0.24�0.91 0.07�0.29
BPI Benthic position index. A
quantitative
characterization of
bathymetric features in
their local/regional
context based on the DEM.
0.19�1.11 0.22�1.09 0.08� 0.58 0.08�0.66 0.18�1.37 0.20�1.03 0.18�2.88 0.38�1.15 0.19�1.23
Distance to soft substrate Distance map calculated
by minimal distance from
point to soft substrate (m).
186�478 125�222 168�351 29�93 78�214 11�34 61�135 100�157 81�210
REI/1000 Relative exposure index
related to the wave
exposure which combines
the values of fetch with
wind energy.
810� 388 418�335 665�340 380�313 610�414 683�505 586�405 606�437 564�392
REIb A relative exposure index
using an empirical
approach that combine
the effect of wind, fetch,
and bottom depth.
187�111 261�227 248�185 350�299 223�224 129�87 215�202 316�272 249�201
L. M
artın
-Ga
rcıa et
al.
/ H
arm
ful
Alg
ae
34
(20
14
) 7
6–
86
80
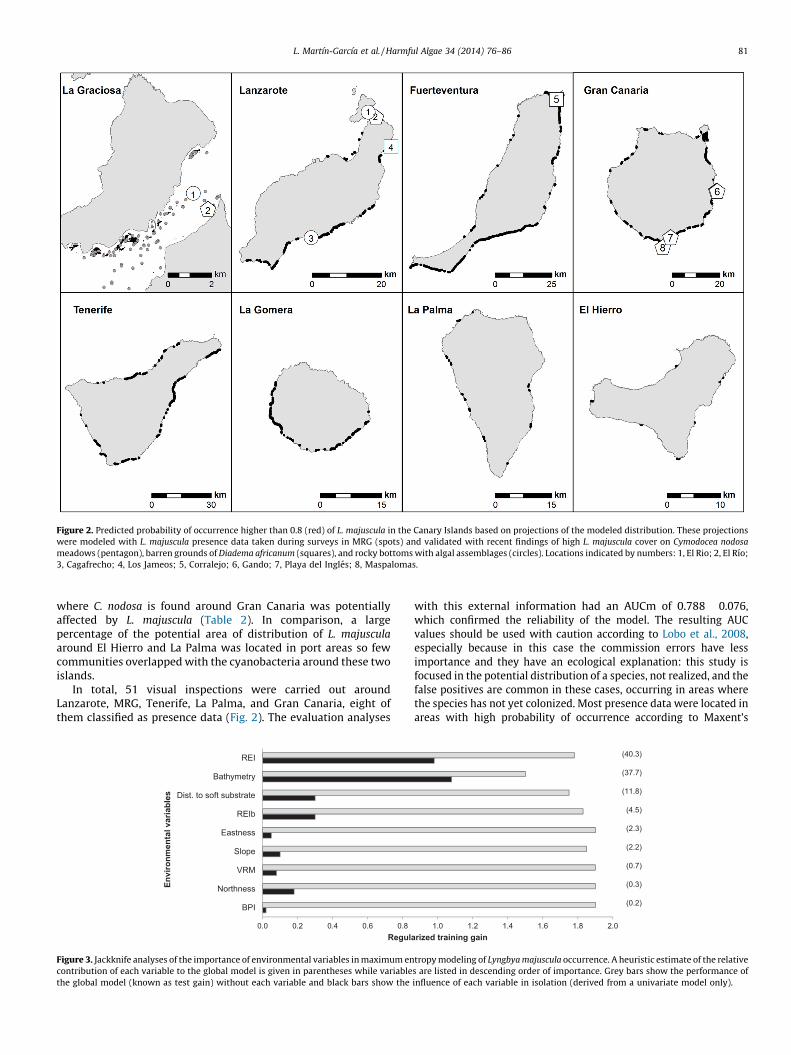
Figure 2. Predicted probability of occurrence higher than 0.8 (red) of L. majuscula in the Canary Islands based on projections of the modeled distribution. These projections
were modeled with L. majuscula presence data taken during surveys in MRG (spots) and validated with recent findings of high L. majuscula cover on Cymodocea nodosa
meadows (pentagon), barren grounds of Diadema africanum (squares), and rocky bottoms with algal assemblages (circles). Locations indicated by numbers: 1, El Rio; 2, El Rıo;
3, Cagafrecho; 4, Los Jameos; 5, Corralejo; 6, Gando; 7, Playa del Ingles; 8, Maspalomas.
L. Martın-Garcıa et al. / Harmful Algae 34 (2014) 76–86 81
where C. nodosa is found around Gran Canaria was potentiallyaffected by L. majuscula (Table 2). In comparison, a largepercentage of the potential area of distribution of L. majuscula
around El Hierro and La Palma was located in port areas so fewcommunities overlapped with the cyanobacteria around these twoislands.
In total, 51 visual inspections were carried out aroundLanzarote, MRG, Tenerife, La Palma, and Gran Canaria, eight ofthem classified as presence data (Fig. 2). The evaluation analyses
0.0 0.2 0. 4 0.6 0. 8 BPI
Northnes s
VRM
Slope
Eastness
REIb
Dist. t o soft subs tra te
Bathymetry
REI
Regul
Envi
ronm
enta
l var
iabl
es
Figure 3. Jackknife analyses of the importance of environmental variables in maximum en
contribution of each variable to the global model is given in parentheses while variable
the global model (known as test gain) without each variable and black bars show the
with this external information had an AUCm of 0.788 � 0.076,which confirmed the reliability of the model. The resulting AUCvalues should be used with caution according to Lobo et al., 2008,especially because in this case the commission errors have lessimportance and they have an ecological explanation: this study isfocused in the potential distribution of a species, not realized, and thefalse positives are common in these cases, occurring in areas wherethe species has not yet colonized. Most presence data were located inareas with high probability of occurrence according to Maxent’s
1.0 1. 2 1.4 1. 6 1.8 2. 0arized training g ain
(4.5)
(2.3)
(0.7)
(0.2)
(40.3)
(37.7)
(2.2)
(0.3)
(11.8)
tropy modeling of Lyngbya majuscula occurrence. A heuristic estimate of the relative
s are listed in descending order of importance. Grey bars show the performance of
influence of each variable in isolation (derived from a univariate model only).
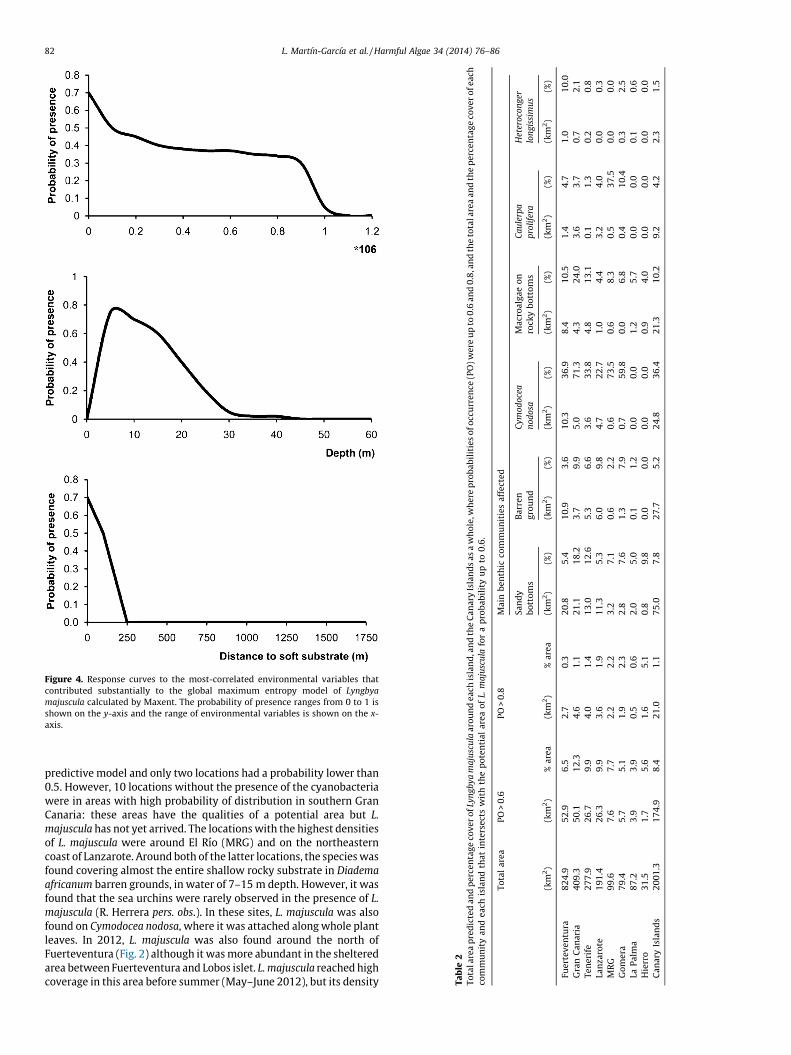
Figure 4. Response curves to the most-correlated environmental variables that
contributed substantially to the global maximum entropy model of Lyngbya
majuscula calculated by Maxent. The probability of presence ranges from 0 to 1 is
shown on the y-axis and the range of environmental variables is shown on the x-
axis.
Ta
ble
2T
ota
lare
ap
red
icte
da
nd
pe
rce
nta
ge
cov
er
of
Lyn
gb
ya
ma
jusc
ula
aro
un
de
ach
isla
nd
,an
dth
eC
an
ary
Isla
nd
sa
sa
wh
ole
,wh
ere
pro
ba
bil
itie
so
fo
ccu
rre
nce
(PO
)w
ere
up
to0
.6a
nd
0.8
,an
dth
eto
tala
rea
an
dth
ep
erc
en
tag
eco
ve
ro
fe
ach
com
mu
nit
ya
nd
ea
chis
lan
dth
at
inte
rse
cts
wit
hth
ep
ote
nti
al
are
ao
fL.
ma
jusc
ula
for
ap
rob
ab
ilit
yu
pto
0.6
.
To
tal
are
aP
O>
0.6
PO
>0
.8M
ain
be
nth
icco
mm
un
itie
sa
ffe
cte
d
Sa
nd
y
bo
tto
ms
Ba
rre
n
gro
un
d
Cy
mo
do
cea
no
do
sa
Ma
cro
alg
ae
on
rock
yb
ott
om
s
Ca
ule
rpa
pro
life
ra
Het
ero
con
ger
lon
gis
sim
us
(km
2)
(km
2)
%a
rea
(km
2)
%a
rea
(km
2)
(%)
(km
2)
(%)
(km
2)
(%)
(km
2)
(%)
(km
2)
(%)
(km
2)
(%)
Fue
rte
ve
ntu
ra8
24
.95
2.9
6.5
2.7
0.3
20
.85
.41
0.9
3.6
10
.33
6.9
8.4
10
.51
.44
.71
.01
0.0
Gra
nC
an
ari
a4
09
.35
0.1
12
.34
.61
.12
1.1
18
.23
.79
.95
.07
1.3
4.3
24
.03
.63
.70
.72
.1
Te
ne
rife
27
7.9
26
.79
.94
.01
.41
3.0
12
.65
.36
.63
.63
3.8
4.8
13
.10
.11
.30
.20
.8
Lan
zaro
te1
91
.42
6.3
9.9
3.6
1.9
11
.35
.36
.09
.84
.72
2.7
1.0
4.4
3.2
4.0
0.0
0.3
MR
G9
9.6
7.6
7.7
2.2
2.2
3.2
7.1
0.6
2.2
0.6
73
.50
.68
.30
.53
7.5
0.0
0.0
Go
me
ra7
9.4
5.7
5.1
1.9
2.3
2.8
7.6
1.3
7.9
0.7
59
.80
.06
.80
.41
0.4
0.3
2.5
LaP
alm
a8
7.2
3.9
3.9
0.5
0.6
2.0
5.0
0.1
1.2
0.0
0.0
1.2
5.7
0.0
0.0
0.1
0.6
Hie
rro
31
.51
.75
.61
.65
.10
.89
.80
.00
.00
.00
.00
.94
.00
.00
.00
.00
.0
Ca
na
ryIs
lan
ds
20
01
.31
74
.98
.42
1.0
1.1
75
.07
.82
7.7
5.2
24
.83
6.4
21
.31
0.2
9.2
4.2
2.3
1.5
L. Martın-Garcıa et al. / Harmful Algae 34 (2014) 76–8682
predictive model and only two locations had a probability lower than0.5. However, 10 locations without the presence of the cyanobacteriawere in areas with high probability of distribution in southern GranCanaria: these areas have the qualities of a potential area but L.
majuscula has not yet arrived. The locations with the highest densitiesof L. majuscula were around El Rıo (MRG) and on the northeasterncoast of Lanzarote. Around both of the latter locations, the species wasfound covering almost the entire shallow rocky substrate in Diadema
africanum barren grounds, in water of 7–15 m depth. However, it wasfound that the sea urchins were rarely observed in the presence of L.
majuscula (R. Herrera pers. obs.). In these sites, L. majuscula was alsofound on Cymodocea nodosa, where it was attached along whole plantleaves. In 2012, L. majuscula was also found around the north ofFuerteventura (Fig. 2) although it was more abundant in the shelteredarea between Fuerteventura and Lobos islet. L. majuscula reached highcoverage in this area before summer (May–June 2012), but its density

L. Martın-Garcıa et al. / Harmful Algae 34 (2014) 76–86 83
decreased in October–November with the first storms. L. majuscula
blooms were not observed around La Palma or Tenerife.
4. Discussion
The results of this study demonstrate the importance oftopographical and wave exposure variables in modeling thedistribution of L. majuscula at a regional level. The distributionmodel has therefore highlighted areas around the Canary Islandswhere there is suitable habitat for the potential development of L.
majuscula blooms; areas that may be prone to blooms in the future.The latest data collected about the presence of L. majuscula inCanarian waters corroborate the validity of the model.
Depth and directly derived topographic variables (slope, aspect,topographic position, or ruggedness) usually do have a strongrelationship with the presence and distribution of benthiccommunities and species (Kostylev et al., 2001). These variablesalso tend to be available at relatively high spatial resolution and aregenerated without much loss of precision (Guisan and Zimmer-mann, 2000). The scale of the present study area meant that thesetopographic variables showed enough variability across thearchipelago to characterize the environment where L. majuscula
was found. Larger-scale predictive models are generally basedsolely on oceanographic parameters; however, we do not haveenough data on the coastal zone due to the effect of the resolutionand the accumulation of clouds in the terrestrial zone that maskedthe coastal area. Besides, local changes of these parameters (mainlywater productivity) could be higher than those obtained viasatellite images and may have more influence on the proliferationL. majuscula and the modeling results of our study area withregional scale. Hence, we consider they do not have any predictivepower at a finer resolution such as that used in this study whichruled out their use here.
Variables relating to wave exposure are usually found to haveprimary importance in the distribution of marine species inshallow water areas (Davies and Moss, 2004; Costello andEmblow, 2005; Huang et al., 2011). The exposure influences onthe substrates of shallow areas, water stratification, as well as itaffects directly the presences of the species depending on theirresistant to abrasion or mechanical damage. In this study, REIwas the most important variable and the distribution modelsituated potential L. majuscula blooms in calm, sheltered waters,decreasing the probability of finding the cyanobacteria with highvalues of wave exposure. Some authors have commented thepossible effects of swell in the distribution of the species (Paulyet al., 2011) but no one has measured this variable quantitatively.Given the high rates of exposure in Canary Islands, waterstratification occurs infrequently and only in protected bays andbeaches on the comparatively sheltered south and southwestsides of the islands. On the contrary, REIb has a minor relationwith the distribution of the species. REIb includes the attenuationof the wave exposure with depth. In our particular case, thecyanobacteria distribute in shallow waters where the decline ofwave exposure with depth is irrelevant. Similar results about theimportance of REIb (or a similar index) were obtained in themodeling of other algae but they concluded that this parameterunderestimates the effect of ocean swell on waves (Bekkby et al.,2009).
Depth is the best single variable to explain the distribution ofL. majuscula according to jackknife test of Maxent. The modelencloses the distribution mainly in the first 10 m depth and thepresence probability decreases to 30 m. These results are consis-tent with the observations in this study, where the highestdensities of L. majuscula are recorded from 5–6 m to 20 m depth,and occasionally observed at 30 m. The distribution model anddirect observations are also consistent with other references that
locate L. majuscula from the intertidal zone (Arthur et al., 2006) to17 m in Florida (Paul et al., 2005). A medical article (Izumi andMoore, 1987) indicates a bathymetric distribution from theintertidal to 30 m depth in Hawaii, although this reference maynot be very reliable because of the type of study. Depth is a proxyfor light attenuation and the amount of light reaching the benthicenvironment (Kehoe et al., 2012). The amount of light depends alsoon incident light and the absorption properties of the water (Kirk,1994) but the Canarian Archipelago, as other tropical andsubtropical regions, have oligotrophic and clear waters that allowa deeper bathymetric distribution to most of algae compared withother regions (Luning, 1990). In this case, the bloom of L. majuscula
remains in very shallow waters in MRG, hence other variables witha direct relation with depth, as the sea temperature or nutrients,prevent the bloom reach deeper levels.
Distance to soft substrate is the third most important factor inthe model and reflects the close relationship of the speciesdistribution with soft bottoms. The observations of L. majuscula inMRG were located in both sandy areas and in rocky substrates,although they were more commonly found on soft bottoms with60% of the observations. In sandy bottoms, L. majuscula grew onlittle stones, macroalgae, the seagrass Cymodocea nodosa, or evenon the sands of the most sheltered areas. This result shows that L.
majuscula can occur in different types of stable substrates where itcan attach and grow on.
Many approaches have been used to model the distribution ofspecies (Guisan and Zimmermann, 2000), but there is growinginterest in making use of presence-only data, especially in marinespecies (Pearce and Boyce, 2006; Phillips et al., 2009). Generally, itis recommended the use of absence data whenever it is possible(Brotons et al., 2004, Jimenez-Valverde et al., 2008). However,absence data are hard to obtain, costly or unreliable in marineenvironment (Dolan et al., 2008). In our study, the methodologyused in the sampling requires the use of only presence-data: thesamples were based on video observation points sampled with anunderwater television system, and only took into account the threeor four most representative and abundant species. Therefore, wecould not assure the absence of unrecorded species. In any case, thegoal of this study was to determine the potential distribution of aspecies (not realized distribution), and thereby modeling techni-ques based on only presence-data are completely valid for thispurpose (Jimenez-Valverde et al., 2008).
Although suitable habitat exists around the Canary Islands, thisstill does not fully explain why a bloom was first initiated here. Theevent in MRG may have been related to changes in variablesidentified as important in the literature, for example, watertemperature, available nutrient pool, and irradiance (Johnson et al.,2010; Kehoe et al., 2012). In recent years, the abundance of bothnative and non-native ephemeral algae has undergone a notableincrease in the Canary Islands (Sangil et al., 2012). These recentproliferations of ephemeral algae have been associated withwarming sea water temperatures (Sangil et al., 2012). L. majuscula
occurs in tropical and subtropical environments and grows atmaximal rates when water temperature is between 24 and 30 8C(Watkinson et al., 2005). However, the L. majuscula bloom that isdescribed in this study occurs in a temperate region where seasurface temperature varies between 15 and 18 8C in winter and 23and 25 8C in summer (data obtained from MODIS AQUA sensor atthe web site http://poet.jpl.nasa.gov; Fig. 1b), and even it is locatedin the coldest waters around the Canary Islands (Fig. 1b).L. majuscula proliferations usually occur in summer months whensea temperatures reach their peaks, although some populationshave previously been observed to persist through winter months(O’Neil et al., 2012). In the present study, a L. majuscula bloom hasbeen observed that has lasted over a year, also persisting throughthe coldest months of winter. These results suggest there are other

L. Martın-Garcıa et al. / Harmful Algae 34 (2014) 76–8684
fundamental variables aside from water temperature that areaffecting proliferation of these cyanobacteria in the CanarianArchipelago.
The productivity of the water is other factor that must beconsidered as determinant in the expansion of L. majuscula. TheCanary Islands are located in oligotrophic waters, althoughfilaments of cold waters from the African upwelling maintain aflux of organic matter to the region and in general the eastern areaof the archipelago receives more organic matter than the west dueto proximity to this source (Garcıa-Munoz et al., 2004; Fig. 1b).Annual average chlorophyll data show a progressive decline inphytoplankton biomass from east to west across the Canary regionand slightly higher values in coastal waters around the islandscompared to in open water. This suggests that Lanzarote andFuerteventura coastlines are the richest in nutrients (Fig. 1) andthis may be one of the reasons why L. majuscula proliferationoccurred around MRG. Anthropogenic eutrophication can alsoincrease the levels of phosphorus and nitrogen and stimulatesblooms of L. majuscula, increasing their abundance, severity, andduration of the event (O’Neil et al., 2012; Ahern et al., 2007).However, these circumstances have not occurred in our study area.There are no water quality data available in MRG and watersampling would be required for further analyses and monitoring totake place. In any case, the MRG is a protected area in open waterswhere no industrial activity exists and has a low density of thehuman population and boats, coupled with the relatively highwave activity over the year, mean that eutrophication conditionsare very unlikely here.
Another key nutrient to consider is iron (Fe), a component ofthe nitrogenase enzyme responsible for nitrogen fixation (Kustkaet al., 2003; O’Neil et al., 2012). The archipelago is subjected toone of the highest rates of airborne dust deposition anywhere inthe world, reaching values of concentrations in the air of1300 mg/m3 (Torres-Padron et al., 2002). These dust storms,locally called ‘‘calimas,’’ occur throughout the year from theSahara Desert and cover the NE Atlantic area (Torres-Padronet al., 2002; Ramos et al., 2005) depositing Fe-rich particles inthe water. This Fe-rich dust has a significant impact on thebiogeochemical cycle of trace elements and stimulates growth ofdiazotrophic heterocystous and non-heterocystous cyanobac-teria (Ramos et al., 2005; O’Neil et al., 2012). An example is theeventual blooms of the marine free-floating cyanobacteriumTrichodesmium erythraeum (Family Phormidiaceae) on thenorthwest African coast, which occurred due to the exceptionallywarm weather and dust storms from the Sahara Desert (Ramoset al., 2005). It is possible that L. majuscula blooms may occurafter such dust events and the temporal consistency of thesephenomena could be the mechanism that supports the bloomthroughout the year.
A combination of the variables mentioned above (sea watertemperature and nutrients concentration) may be involved inthe local proliferation of L. majuscula in the MRG. However, thelack of consistent monitoring of benthic communities withinthe marine reserve makes it impossible to determine the exactmoment when the L. majuscula bloom began. The timing of itsinitiation cannot therefore be related to local environmentalchanges.
Despite not knowing how the bloom began, the potential areaof L. majuscula distribution identified by the distribution modelsuggests that the bloom does have the capacity to expand into newareas around the Canarian Archipelago. Such spread may haveharmful consequences for coastal biodiversity around the CanaryIslands, especially by impacting Cymodocea nodosa meadows. Thisspecies is the main seagrass found throughout the Canary Islands;it has the largest range and forms the most important ecosystemon soft bottoms (Reyes et al., 1995, Barquın-Diez et al., 2005).
Observations carried out in the MRG in 2011 showed that themeadows of Cymodocea nodosa had suffered a drastic reduction.The underwater video samples and the observations showed thatthe extension of some Cymodocea meadows decreased and otherspresented a decrease in density. In recent years, a markedregression of Cymodocea meadows has been observed in GranCanaria (Martınez-Samper, 2011). The most affected meadowsaround Gran Canaria were located in bays and beaches around thesouth and southwest of the island, where the leaves of Cymodocea
were heavily epiphytized by L. majuscula; even some meadows inthese areas had disappeared altogether (Herrera pers. obs.). Despitehaving potential habitat where L. majuscula could spread to, in thewestern islands of Tenerife, La Palma, La Gomera, and El Hierro, noextreme coverage or evidence of blooms have yet been found,which confirms the involvement of water conditions commentedabove (nutrients) in the proliferation of the cyanobacteria.However, local changes, for example, produced by organic matterinputs, can cause blooms in these potential areas.
Not only is it necessary to consider the ecological impacts of L.
majuscula blooms in the Canary Islands, it is also important toconsider the effects on economic, and public health. Most of thepotential areas identified by this study as regions where thecyanobacteria could form blooms correspond to beach areas thathave a high number of visits by both members of the localpopulation and tourists. The eastern islands which are at greaterrisk of exposure to L. majuscula blooms, have a larger number ofpopular beaches and are highly dependent on tourism as a sourceof regional income. The results of this study may help inform futurepreventive management tools to control the species in and aroundthese areas. The distribution model of L. majuscula could beimproved with the availability of a complete water qualitydatabase, which would be required to develop appropriatemanagement plans. It would also be necessary to investigate theeffects of additional parameters on L. majuscula, such as increasingCO2 levels in water (O’Neil et al., 2012). The methodology used inthe present study could be adapted to study other benthicintroduced species.
Acknowledgements
The authors would like to acknowledge with thanks thescientist Marıa Candelaria Gil Rodrıguez and The Spanish Bankof Algae (BEA-Banco Espanol de Algas) for the identification andconfirmation of L. majuscula. We are grateful to the TechnologicalInstitute of the Canary Islands (Canary Government) for wind dataand the CREPAD Center (INTA) for remote sensing information, BlasM. Benito for providing the tool for the ROC analysis, and theDepartment of the Environment of the Canary Government(Viceconsejerıa de Medio Ambiente del Gobierno de Canarias)for providing the data from the monitoring campaigns of NATURA2000 in the Canary Islands. We are also grateful to Miguel Abella(Dive Center Corralejo), Silvia Gonzalez, Ezequiel Rodrıguez, sailorsand skippers of La Graciosa Marine Reserve for field logisticalsupport, Marta Sanson for her helpful comments and MartaRodrıguez Plata for her kind linguistic revision. This research wasfunded under the SIGMACAN project (PI 2007/004) co-financed bythe European Regional Development Fund (ERDF) and CanarianAgency for Research, Innovation and Information Society (AgenciaCanaria de Investigacion, Innovacion y Sociedad de la Informacion,ACISII) of the Canary Government.[SS]
Appendix A. Supplementary data
Supplementary data associated with this article can be found, in
the online version, at http://dx.doi.org/10.1016/j.hal.2014.02.008.

L. Martın-Garcıa et al. / Harmful Algae 34 (2014) 76–86 85
References
Ahern, K.S., Ahern, C.R., Savige, G.M., Udy, J.W., 2007. Mapping the distribution,biomass and tissue nutrient levels of a marine benthic cyanobacteria bloom(Lyngbya majuscula). Mar. Freshwater Res. 58, 883–904.
Albert, S., O’Neil, J.M., Udy, J.W., Ahern, K.S., O’Sullivan, C., Dennison, W.C., 2005.Blooms of the cyanobacterium Lyngbya majuscula in coastal Queensland,Australia: disparate sites, common factors. Mar. Pollut. Bull. 51, 428–437.
Arthur, K.E., Limpus, C.J., Roelfsema, C.M., Udy, J.W., Shaw, G.R., 2006. A bloom ofLyngbya majuscula in Shoalwater Bay, Queensland, Australia: An importantfeeding ground for the green turtle (Chelonia mydas). Harmful Algae 5, 251–265.
Barquın-Diez, J., Gonzalez-Lorenzo, G., Gil-Rodrıguez, M.C., 2003. Un metodo deestudio de bionomıa bentonica utilizado en las costas canarias para fondos pocoprofundos. Vieraea 31, 219–231.
Barquın-Diez, J., Gonzalez-Lorenzo, G., Martın-Garcıa, L., Gil-Rodrıguez, M.C., Brito-Hernandez, A., 2005. Distribucion espacial de las comunidades bentonicassubmareales de los fondos someros de Canarias. I: Las comunidades de sustratoblando de las costas de Tenerife. Vieraea 33, 435–438.
Bekkby, T., Rinde, E., Erikstad, L., Bakkestuen, V., 2009. Spatial predictive distribu-tion modelling of the kelp species Laminaria hyperborea ICES. J. Mar. Sci. 66,2106–2115.
Bell, P.R.F., Elmetri, I., 2007. Some chemical factors regulating the growth of Lyngbyamajuscula in Moreton Bay, Australia: importance of sewage discharges. Hydro-biologia 592, 359–371.
Benito, B.M., Martınez-Ortega, M.M., Mu?noz, L.M., Lorite, J., Penas, J., 2009. Asses-sing extinction-risk of endangered plants using species distribution models: acase study of habitat depletion caused by the spread of greenhouses. Biodivers.Conserv. 18, 2509–2520.
Brito, A., Ocana, O., 2004. Corales de las Islas Canarias. In: Lemus, Francisco (Ed.), LaLaguna, p. 477.
Brotons, L., Thuiller, W., Araujo, M.B., Hirzel, A.H., 2004. Presence-absence versuspresence-only modelling methods for predicting bird habitat suitability. Eco-graphy 27, 437–448.
Burrows, M.T., Harvey, R., Robb, L., 2008. Wave exposure indices from digitalcoastlines and the prediction of rocky shore community structure. Mar. Ecol-Prog. Ser. 353, 1–12.
Costello, M.J., Emblow, C., 2005. A classification of inshore marine biotopes. In:Wilson, J.G. (Ed.), The Intertidal Ecosystem: The Value of Ireland’s Shores. RoyalIrish Academy, Dublin, pp. 25–37.
Davies, C.E., Moss, D., 2004. Eunis Habitat Classification Marine Habitat Types:Revised Classification and Criteria. Centre for Ecology & Hydrology, NaturalEnvironment Research Council, Dorchester, 84.
Degraer, S., Verfaillie, E., Willems, W., Adriaens, E., Vincx, M., Landcker, V., 2008.Habitat suitability modeling as a mapping tool for macrobenthic communities:an example from the Belgian part of the North Sea. Cont. Shelf Res. 28, 369–379.
Dennison, W. C., O’Neil, J. M., Duffy, E., Oliver, P., Shaw, G., 1999. Blooms of thecyanobacterium Lyngbya majuscula, in Coastal waters of Queensland. In:Charpy, L., Larkum, A. W. D. (Eds.), Proceedings of the International Symposiumon Marine Cyanobacteria, Bulletin de l’Institut Oceanographique, Monaco, p.632.
Diaz, M.R., Corredor, J.E., Morell, J.M., 1990. Nitrogenase activity of MicrocoleusLyngbyaceus mat communities in a eutrophic, tropical marine environment.Limnol. Oceanogr. 35 (8) 1788–1795.
Dolan, M.F., Grehan, A.J., Guinan, J.C., Brown, C., 2008. Modelling the local distribu-tion of cold-water corals in relation to bathymetric variables: adding spatialcontext to deep-sea video data. Sea Res. Pt. I 55, 1564–1579.
Ekebom, J., Laihonen, P., Suominen, T., 2002. Measuring fetch and estimating waveexposure in coastal areas. In: Gomes, F.V., Pinto, F.T., das Neves, L. (Eds.), Littoral2002, 6th International Symposium Proceedings: a multi-disciplinary Sympo-sium on Coastal Zone Research, Management and Planning, Porto, pp. 155–160.
Elith, J., Graham, C.H., Anderson, R.P., Dudık, M., Ferrier, S., Guisan, A., Hijmans, R.J.,Huettmann, F., Leathwick, J.R., Lehmann, A., Li, J., Lohmann, L.G., Loiselle, B.A.,Manion, G., Moritz, C., Nakamura, M., Nakazawa, Y., Overton, J.McC., Peterson,A.T., Phillips, S.J., Richardson, K.S., Scachetti-Pereira, R., Schapire, R.E., Soberon,J., Williams, S., Wisz, M.S., Zimmermann, N.E., 2006. Novel methods improveprediction of species’ distributions from occurrence data. Ecography 29, 129–151.
Elith, J., Phillips, S.J., Hastie, T., Dudık, M., Cheel, Y.E., Yates, C.J., 2011. A statisticalexplanation of MaxEnt for ecologists. Diversity Distrib. 17, 43–57.
Galparsoro, I., Borja, A., Bald, J., Liria, P., Chust, G., 2009. Predicting suitable habitatfor the European lobster (Homarus gammarus), on the Basque continental shelf(Bay of Biscay), using Ecological-Niche Factor Analysis. Ecol. Model. 220, 556–567.
Garcıa-Munoz, M., Arıstegui, J., Montero, M.F., Barton, E.D., 2004. Distribution andtransport of organic matter along a filament-eddy system in the Canaries–NWAfrica coastal transition zone region. Prog. Oceanogr. 62, 115–129.
Guisan, A., Zimmermann, N.E., 2000. Predictive habitat distribution models inecology. Ecol. Model. 135, 147–189.
Hamilton, G., McVinish, R., Mengersen, K., 2009. Bayesian model averaging forharmful algal bloom prediction. Ecol. Appl. 19, 1805–1814.
Haroun, R.J., Gil-Rodrıguez, M.C., Dıaz de Castro, J., Prud’homme van Reine, W.F.,2002. A checklist of the marine plants from the Canary Islands (central easternAtlantic Ocean). Bot. Mar. 45, 139–169.
Heisler, J., Glibert, P.M., Burkholder, J.M., Anderson, D.M., Cochlan, W., Dennison,W.C., Dortch, Q., Gobler, C.J., Heil, C.A., Humphries, E., Lewitus, A., Magnien, R.,Marshall, H.G., Sellner, K., Stockwell, D.A., Stoecker, D.K., Suddleson, M., 2008.Eutrophication and harmful algal blooms: A scientific consensus. Harmful Algae8, 3–13.
Hermosilla, C., Rocha, F., Valavanis, V.D., 2011. Assessing Octopus vulgaris distribu-tion using presence-only model methods. Hydrobiologia 670, 35–47.
Hernandez, P.A., Franke, I., Herzog, S.K., Pacheco, V., Paniagua, L., Quintana, H.L.,Soto, A., Swenson, J.J., Tovar, C., Valqui, T.H., Vargas, J., Young, B.E., 2008.Predicting species distributions in poorly-studied landscapes. Biodivers. Con-serv. 17, 1353–1366.
Hoek, C., 1984. World-wide latitudinal and longitudinal seaweed distributionpatterns and their possible causes, as illustrated by the distribution of Rhodo-phytan genera. Helgolander Meeresun. 38 (2) 227–257.
Howell, K.L., Holt, R., Pulido-Endrino, I., Stewart, H., 2011. When the species is also ahabitat: Comparing the predictively modelled distributions of Lophelia pertusaand the reef habitat it forms. Biol. Conserv. 144 (11) 2656–2665.
Huang, Z., Brooke, B.P., Harris, P.T., 2011. A new approach to mapping marinebenthic habitats using physical environmental data. Cont. Shelf Res. 31, S4–S16.
Izumi, A.K., Moore, R.E., 1987. Seaweed (Lyngbya majuscula) dermatitis. Clin.Dermatol. 5, 92–100.
Jimenez-Valverde, A., Lobo, J.M., Hortal, J., 2008. Not as good as they seem: theimportance of concepts in species distribution modelling. Divers. Distrib. 14,885–890.
Johnson, S., Fielding, F., Hamilton, G., Mengersen, K., 2010. An integrated Bayesiannetwork approach to Lyngbya majuscula bloom initiation. Mar. Environ. Res. 69,27–37.
Jones, M.C., Dye, S.R., Pinnegar, J.K., Warren, R., Cheung, W.W.L., 2012. Modellingcommercial fish distributions: Prediction and assessment using differentapproaches. Ecol. Model. 225, 133–145.
Kehoe, M., O‘Brien, K., Grinham, A., Rissik, D., Ahern, K.S., Maxwell, P., 2012. Randomforest algorithm yields accurate quantitative prediction models of benthic lightat intertidal sites affected by toxic Lyngbya majuscula blooms. Harmful Algae 19,46–52.
Kirk, J.T.O., 1994. Light and Photosynthesis in Aquatic Ecosystems. CambridgeUniversity Press, Cambridge, 509 pp.
Kostylev, V.E., Todd, B.J., Fader, G.B.J., Courtney, R.C., Cameron, G.D.M., Pickrill, R.A.,2001. Benthic habitat mapping on the Scotian shelf, based on multibeambathymetry, surficial geology and sea floor photographs. Mar. Ecol Prog. Ser.219, 121–137.
Kustka, A., Sanudo-Wilhelmy, S., Carpenter, E.J., Capone, D.G., Raven, J.A., 2003. Arevised estimate of the iron use efficiency of nitrogen fixation, with specialreference to the marine cyanobacterium Trichodesmium spp. (Cyanophyta). J.Phycol. 39, 12–25.
Liu, C.R., Berry, P.M., Dawson, T.P., Pearson, R.G., 2005. Selecting thresholds ofoccurrence in the prediction of species distributions. Ecography 28, 385–393.
Lobo, J.M., Jimenez-Valverde, A., Real, R., 2008. AUC: a misleading measure of theperformance of predictive distribution models. Global Ecol. Biogeogr. 17, 145–151.
Luning, K., 1990. Seaweeds. Their Environment, Biogeography and Ecophysiology.-Wiley, New York, 527pp.
Malhotra, A., Fonseca, M.S., 2007. WEMo (Wave Exposure Model): Formulation,Procedures and Validation. National Oceanic and Atmospheric Administration(NOAA) Technical Memorandum, Beaufort, DC, 28 pp.
Martın-Garcıa, L., Gonzalez-Lorenzo, G., Brito-Izquierdo, I.T., Barquın-Diez, J., 2013.Use of topographic predictors for macrobenthic community mapping in theMarine Reserve of La Palma (Canary Islands, Spain). Ecol. Model. 263, 19–31.
Martınez-Samper, J., 2011. Analisis espacio-temporal de las praderas de Cymodoceanodosa (Ucria) Ascherson en la isla de Gran Canaria. Master Project in CoastalManagement. University of Las Palmas de Gran Canaria, p. 120.
O’Neil, J.M., Dennison, W.C., 2005. Lyngbya majuscula in Southeast Queenslandwaterways. In: Abal, E., Dennison, W.C. (Eds.), Healthy Catchment, HealthyWaterways: South East Queensland Regional Water Quality Strategy. BrisbaneCity Council, Brisbane, p. 143.
O’Neil, J.M., Davis, T.W., Burford, M.A., Gobler, C.J., 2012. The rise of harmfulcyanobacteria blooms: The potential roles of eutrophication and climatechange. Harmful Algae 14, 313–334.
Paerl, H.W., Fulton, R.S., 2006. Ecology of harmful cyanobacteria. In: Graneli, E.,Turner, J.Y., Jefferson, T. (Eds.), Ecology of Harmful Algae. Springer BerlinHeidelberg, Berlin, pp. 95–109.
Paerl, H.W., Millie, D.F., 1996. Physiological ecology of toxic aquatic cyanobacteria.Phycologia 35, 160–167.
Paul, V.J., Thacker, R.W., Banks, K., Stjepko, G., 2005. Benthic cyanobacterial bloomimpacts the reefs of South Florida (Broward County, USA). Coral Reefs 24, 693–697.
Pauly, K., Jupp, B.P., De Clerck, O., 2011. Modelling the distribution and ecology ofTrichosolen blooms on coral reefs worldwide. Mar. Biol. 158, 2239–2246.
Pearce, J.L., Boyce, M.S., 2006. Modelling distribution and abundance with presence-only data. J. Appl. Ecol. 43, 405–412.
Phillips, S.J., Dudık, M., 2008. Modeling of species distributions with Maxent: newextensions and a comprehensive evaluation. Ecography 31, 161–175.
Phillips, S.J., Dudık, M., Elith, J., Graham, C.H., Lehmann, A., Leathwick, J., Ferrier, S.,2009. Sample selection bias and presence-only distribution models: implica-tions for background and pseudo-absence data. Ecol. Appl. 19 (1) 181–197.
L. Martın-Garcıa et al. / Harmful Algae 34 (2014) 76–8686
Phillips, S.J., Anderson, R.P., Schapire, R.E., 2006. Maximum entropy modeling ofspecies geographic distributions. Ecol. Model. 190, 231–259.
Ramos, A.G., Martel, A., Codd, G.A., Soler, E., Coca, J., Redondo, A., Morrison, L.F.,Metcalf, J.S., Ojeda, A., Suarez, S., Petit, M., 2005. Bloom of the marine diazo-trophic cyanobacterium Trichodesmium erythraeum in the Northwest AfricanUpwelling. Mar. Ecol-Prog. Ser. 301, 303–305.
Ready, J., Kaschner, K., South, A.B., Eastwood, P.D., Rees, T., Rius, J., Agbayani, E.,Kullander, S., Froese, R., 2010. Predicting the distributions of marine organismsat the global scale. Ecol. Model. 221, 467–478.
Reyes, J., Sanson, M., Afonso-Carrillo, J., 1995. Distribution and reproductive phe-nology of the seagrass Cymodocea nodosa (Ucria) Ascherson in the CanaryIslands. Aquat. Bot. 50, 171–180.
Rupprecht, F., Oldeland, J., Finckh, M., 2011. Modelling potential distribution of thethreatened tree species Juniperus oxycedrus: how to evaluate the predictions ofdifferent modelling approaches? J. Veg. Sci. 22, 647–659.
Sangil, C., Sanson, M., Afonso-Carrillo, J., 2011. Spatial variation patterns of subtidalseaweed assemblages along a subtropical oceanic archipelago: thermalgradient vs herbivore pressure. Estuarine. Coast. Shelf Sci. 94, 322–333.
Sangil, C., Sanson, M., Afonso-Carrillo, J., Herrera, R., Rodrıguez, A., Martın-Garcıa, L.,Dıaz-Villa, T., 2012. Changes in subtidal assemblages in a scenario of warming:Proliferations of ephemeral benthic algae in the Canary Islands (eastern AtlanticOcean). Mar. Environ. Res. 77, 120–128.
Sanson, M., Reyes, J., Afonso-Carrillo, J., 2001. Flora marina. In: Fernandez- Palacios,J. M., Martın Esquivel, J. L. (Eds.), Naturaleza de las Islas Canarias: Ecologıa yConservacion. Turquesa, Santa Cruz de Tenerife, pp. 193–198.
Stielow, S., Ballantine, D.L., 2003. Benthic cyanobacterial, Microcoleus Lyngbyaceus,blooms in shallow, inshore Puerto Rican seagrass habitats, Caribbean Sea.Harmful Algae 2, 127–133.
Thuiller, W., Brotons, L., Araujo, M.B., Lavorel, S., 2004. Effects of restrictingenvironmental range data to project current and future species distributions.Ecography 27, 165–172.
Torres-Padron, M.E., Gelado-Caballero, M.D., Collado-Sanchez, C., Siruela-Matos,V.F., Cardona-Castellano, P.J., Hernandez-Brito, J.J., 2002. Variability of dustinputs to the CANIGO zone. Deep-Sea Res. Pt. II. 49, 3455–3464.
VanDerWal, J., Shoo, L.P., Johnson, C.N., Williams, S.E., 2009. Abundance and theenvironmental niche: environmental suitability estimated from niche modelspredicts the upper limit of local abundance. Am. Nat. 174, 282–291.
Watkinson, A.J., O’Neil, J.M., Dennison, W.C., 2005. Ecophysiology of the marinecyanobacterium, Lyngbya majuscula (Oscillatoriacea) in Moreton Bay, Queens-land. Harmful Algae 4 (4) 697–715.
Wilson, M.F.J., O’Connell, B., Brown, C., Guinan, J.C., Grehan, A.J., 2007. MultiscaleTerrain analysis of multibeam bathymetry data for habitat mapping on thecontinental slope. Mar. Geod. 30, 3–35.