predicting scenario doses for robust automated radiation
TRANSCRIPT

Predicting scenario doses for robust automatedradiation therapy treatment planning
Oskar Eriksson*†, Tianfang Zhang*†,‡
†RaySearch Laboratories, Sveavägen 44, Stockholm SE-103 65, Sweden‡Department of Mathematics, KTH Royal Institute of Technology, Stockholm SE-100 44, Sweden
October 20, 2021
Abstract
Purpose: We present a framework for robust automated treatment planning us-ing machine learning, comprising scenario-specific dose prediction and robust dosemimicking.
Methods: The scenario dose prediction pipeline is divided into the prediction ofnominal dose from input image and the prediction of scenario dose from nom-inal dose, each using a deep learning model with U-net architecture. By usinga specially developed dose–volume histogram–based loss function, the predictedscenario doses are ensured sufficient target coverage despite the possibility of thetraining data being non-robust. Deliverable plans may then be created by solving arobust dose mimicking problem with the predictions as scenario-specific referencedoses.
Results: Numerical experiments are performed using a dataset of 52 intensity-modulated proton therapy plans for prostate patients. We show that the predictedscenario doses resemble their respective ground truth well, in particular while hav-ing target coverage comparable to that of the nominal scenario. The deliverableplans produced by the subsequent robust dose mimicking were showed to be robustagainst the same scenario set considered for prediction.
Conclusions: We demonstrate the feasibility and merits of the proposed methodol-ogy for incorporating robustness into automated treatment planning algorithms.
Keywords: Knowledge-based planning, scenario dose prediction, robust optimization, dosemimicking.
*These authors contributed equally.
1
arX
iv:2
110.
0998
4v1
[ph
ysic
s.m
ed-p
h] 1
9 O
ct 2
021

1 IntroductionRadiation therapy treatment planning is a time-consuming process that typically requires multi-ple iterations between a dosimetrist and an oncologist [1]. In recent years, automated treatmentplanning methods have been developed to speed up the process while ensuring a consistentquality of treatment plans, using historically delivered treatment plans to aid in the process ofcreating plans for new patients. A common approach is using a machine learning model topredict a reference dose distribution for each new patient [2–4], which is then used in an opti-mization problem to find a configuration for a treatment machine that would deliver a similardose [5]. These parts are commonly referred to as dose prediction and dose mimicking, re-spectively. However, in many cases, especially in proton therapy, it is important to take intoaccount uncertainties in the treatment delivery such as patient setup and density calculations[6]. While robust optimization is the current state-of-the-art method of handling such uncertain-ties, optimizing on e.g. the near-worst-case over a set of sampled scenarios, current methodsfor automated planning in the literature have yet to be able to incorporate robustness. The con-tribution of this paper is a framework that unifies ideas from automated treatment planning androbust optimization by predicting a set of scenario reference doses, each corresponding to aspecific scenario, to be used in a robust dose mimicking problem.
Typically, for the non-robust case, machine learning–based automated treatment planning isdivided into two steps: predicting the achievable values of certain dose-related quantities fromthe patient geometry, and finding machine parameters of a plan to reconstruct the same values[2]. For example, the dose-related quantities may be the spatial dose distribution, dose–volumehistograms (DVHs), or a combination thereof. A common approach to spatial dose prediction isusing a neural network, often with a U-net architecture, to predict a dose value for each voxel inthe discretized dose grid [7–12]. Likewise, for DVH prediction, one may either use the DVHsevaluated on a spatially predicted dose distribution or employ separate models for the purpose[13–18]. Using the reference dose and the reference DVHs, a dose mimicking optimizationproblem is then constructed, where the goal is to find a set of machine parameters for a specifictreatment machine such that the delivered dose is as similar as possible to the reference doseand DVHs [5, 19, 20]. Thus, given that the plans used for training the models are clinicallyacceptable and follow the desired protocol, the idea is that the automated planning pipelineshould produce a high-quality plan for each new patient.
In robust optimization, reference dose levels are usually set for different regions of interest(ROIs), and the goal of the optimization is to find a resulting treatment plan that minimizessome cost functional that depends on the outcome in a number of fixed scenarios [21]. Thesescenarios may be seen as samples from some probability distribution specifying the geometricuncertainties in the treatment delivery that we want to account for. Typical examples of suchuncertainties include setup uncertainties, related to inaccuracies in the setup of the patient or theinaccuracy of the treatment machine, as well as range uncertainties, related to uncertainties in theCT imaging or the conversion from CT values to density values [6]. For particle modalities suchas protons, since the dose delivered is relatively sensitive to the density of the material throughwhich they pass, using margins around the clinical target volume (CTV) is often insufficient toaccount for density uncertainty effects. Hence, robust optimization is especially important insuch cases. In robust dose mimicking, one would use a reference dose corresponding to eachscenario, with the goal of finding a robust treatment plan that is good across most or all ofthese scenarios [22]. However, in a robust prediction–mimicking pipeline, how to choose thesescenario reference doses is a matter previously unaddressed in the literature.
In this paper, we present a method of performing robust automated treatment planning, com-bining spatial dose prediction and robust optimization through scenario dose prediction and ro-
2

bust dose mimicking. We propose to predict scenario doses using a two-step pipeline: by firstpredicting the nominal dose using a U-net model and subsequently deforming the nominal doseto scenario doses corresponding to a given set of scenarios. Specifically, starting from a non-robustly planned dataset, we propose to use a DVH-based loss function when training the sce-nario model to ensure that the predicted scenario doses have comparable target coverage to thatof the nominal dose. The predicted scenario doses are then used as scenario-specific referencedoses in a robust dose mimicking problem, creating a robust deliverable plan. Numerical ex-periments, designed for a proof-of-concept study, are performed on a dataset of prostate cancerpatients treated with intensity-modulated proton therapy. We show that the proposed scenariodose prediction pipeline fulfills its purpose satisfactorily, with predictions mostly following thenon-robust ground truth but with increased target coverage, and that the resulting deliverableplans are robust with respect to the considered scenario set. In particular, we demonstrate thefeasibility of a data-driven, robust automated treatment planning framework.
2 Materials and methodsLet X and Y be spaces of patient geometries and dose distributions, respectively, and S a givenset of scenarios representing realizations of systematic setup or range uncertainties. For eachs ∈ S, the patient geometry xs ∈ X is defined as its CT image with ROI delineations along withits spatial location under s. A dose distribution that has been delivered to this patient previouslyis referred to as the scenario dose, denoted by ys. The nominal scenario, corresponding to nosetup or range errors, is denoted by s0. Given a dataset {(xns0
, yns0)}n ⊂ X × Y of pairs of
nominal patient geometries and doses, our proposed pipeline follows the classical prediction–mimicking division, with a scenario-specific spatial dose prediction model followed by a robustdose mimicking optimization.
2.1 PipelineWe propose to extend the typical nominal spatial dose prediction and dose mimicking procedurewith a scenario-specific dose prediction component, as illustrated in Figure 1. First, a nominalmodel predicts the nominal dose ys0 ∈ Y from the nominal geometry xs0 . To predict thescenario dose ys for any scenario s ∈ S, ys0 is deformed in accordance with the change fromthe nominal geometry xs0 to the scenario geometry xs using a second scenario model. One suchscenario dose is predicted for each s ∈ S, yielding a set {ys}s∈S of predicted scenario doses.
To train such a scenario model, ideally, the training data would consist of robust treatmentplans—in particular, a set {(xns , yns )}n, s∈S of geometry–dose pairs where all doses are plannedrobustly with respect to the scenario set S. However, to remove the need of having accessto a complete dataset of robust plans, which is a relatively strict requirement, we propose analternative method of training the scenario model. In this framework, each plan in a dataset ofpreviously delivered non-robust treatment plans is deformed in accordance with a number ofscenarios. As we want the resulting robust treatment plans to have sufficient target coverage,we want our scenario reference doses to have sufficient target coverage as well. Therefore, wepropose to train the scenario model using a loss function that both penalizes deviation fromthe non-robust ground truth scenario dose, as well as deviation from the target coverage of thenominal dose. The training pipeline is illustrated in Figure 2.
3

Nominalmodel
Robustdose
mimicking
ScenariomodelDeformation
Figure 1: An illustration of the proposed pipeline. A nominal dose ys0 is predicted from a nominalgeometry xs0 using a nominal model. Furthermore, for each scenario s ∈ S, xs0 is deformed into ascenario geometry xs. The scenario model is then used to predict a scenario dose ys from these foreach scenario. The scenario doses are finally used in robust dose mimicking yielding a set of machineparameters η.
ScenariomodelDeformation
Dosecalculation
Lossfunction
Figure 2: An illustration of training the proposed pipeline. A deliverable nominal dose ys0 is deformed inaccordance with a scenario geometry xs, yielding a ground truth scenario dose ys. The scenario model istrained using a loss function consisting of a spatial loss that depends on the predicted scenario dose ys andys, as well as a DVH loss that depends on ys and ys0 .
4
2.2 AlgorithmTo maintain the target coverage equivalent to that of the nominal dose, but still predicting a re-alistic scenario dose, we propose to train the scenario model using a loss function that combinesa voxel-level spatial loss Lspat(y, y) : Y2 → R with a DVH loss LDVH(y, y) : Y2 → R definedon the targets. In particular, the spatial loss is given by the weighted mean-squared error
Lspat(y, y) =∑i
ωi(yi − yi)2, (1)
where the ωi are nonnegative voxel weights such that∑i ωi = 1. For the DVH loss, let R be
the set of all ROIs, each R ∈ R represented as index sets of voxels, and let yR = (yi)i∈R bethe local dose vector for each R. Let, furthermore Rtarget ⊆ R be the set of all target ROIswhich are to be covered robustly, typically chosen to comprise all CTVs. Denoting by Dv thedose-at-volume at volume level 0 ≤ v ≤ 1, which is given for each R by
Dv(yR) = inf{x ∈ R : 1
|R|∑i∈R
1yi ≥ x ≤ v
},
the DVH loss may be written as
LDVH(y, y) =∑
R∈Rtarget
ˆ 1
0(Dv(yR)−Dv(yR))2
dv.
The idea of utilizing a DVH loss for training dose prediction models has previously been ex-plored by Nguyen et al. [23] and Zhang et al. [24], but for other purposes. Upon predicting ysin a scenario s ∈ S with non-robust scenario ground truth ys and nominal ground truth ys0 , theloss contribution is then given by
L(ys, ys, ys0) = Lspat(ys, ys) + αLDVH(ys, ys0),
weighting the DVH loss by a factor α.For both the nominal and scenario models, we propose to use an architecture based on the
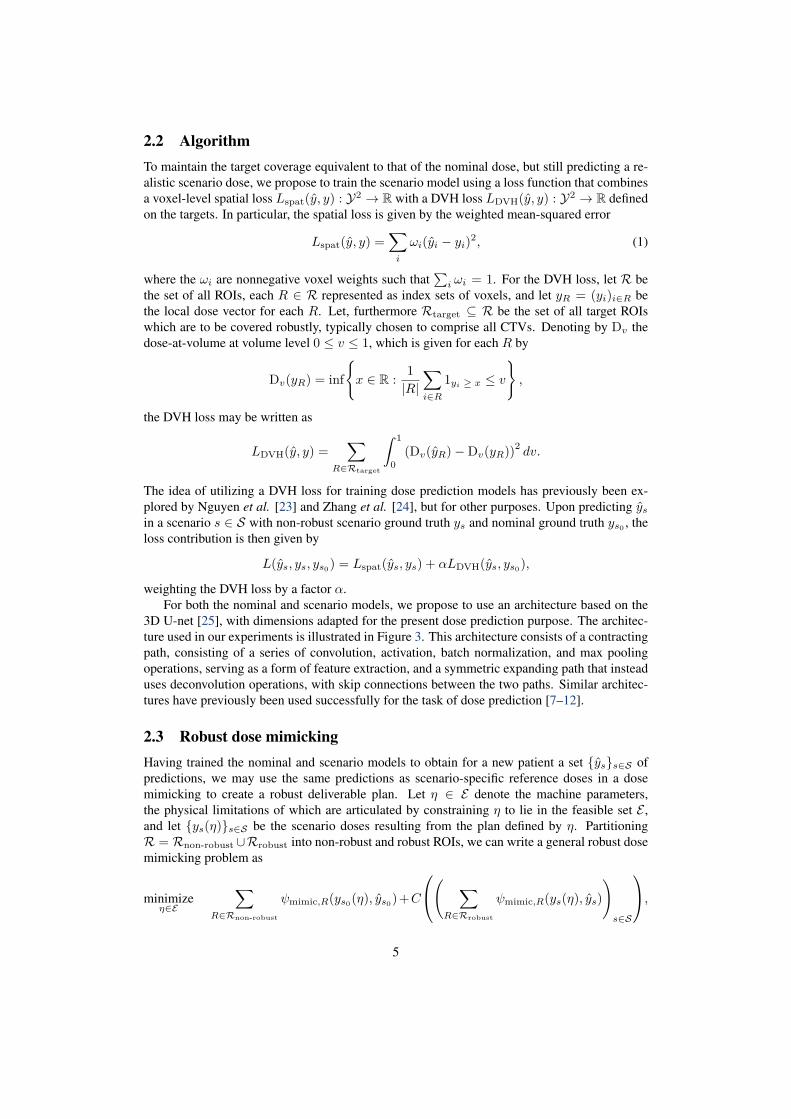
3D U-net [25], with dimensions adapted for the present dose prediction purpose. The architec-ture used in our experiments is illustrated in Figure 3. This architecture consists of a contractingpath, consisting of a series of convolution, activation, batch normalization, and max poolingoperations, serving as a form of feature extraction, and a symmetric expanding path that insteaduses deconvolution operations, with skip connections between the two paths. Similar architec-tures have previously been used successfully for the task of dose prediction [7–12].
2.3 Robust dose mimickingHaving trained the nominal and scenario models to obtain for a new patient a set {ys}s∈S ofpredictions, we may use the same predictions as scenario-specific reference doses in a dosemimicking to create a robust deliverable plan. Let η ∈ E denote the machine parameters,the physical limitations of which are articulated by constraining η to lie in the feasible set E ,and let {ys(η)}s∈S be the scenario doses resulting from the plan defined by η. PartitioningR = Rnon-robust∪Rrobust into non-robust and robust ROIs, we can write a general robust dosemimicking problem as
minimizeη∈E
∑R∈Rnon-robust
ψmimic,R(ys0(η), ys0)+C
( ∑R∈Rrobust
ψmimic,R(ys(η), ys))s∈S
,
5

1603
8 16
803
16 32
403
32 64
203 64 128
192 64
96 32
48 16 16 1N
Convolution + ReLU + BN
Deconvolution
Convolution (1x1x1)
Concatenation
Max pooling
Figure 3: The proposed 3D U-net architecture. The size of each row is denoted at the far left and thenumber of channels in each layer is denoted above the layer.
where C : R|S| → R is a cost functional expressing the conservativeness of the robust opti-mization and each ψmimic,R : Y2 → R is on the form
ψmimic,R(y, y) = wspat,Rψspat(yR, yR) + wDVH,RψDVH(yR, yR).
Here, the cost functional is commonly chosen as a weighted power mean functionC((ξs)s∈S) =(∑s∈S ξ
a)1/a
with exponent a ≥ 1, where a = 1 corresponds to stochastic programming anda = ∞ to minimax optimization [21]. As for ψspat and ψDVH, common choices are one-sidedquadratic functions penalizing deviations in spatial dose and DVH, respectively.
2.4 Computational studyWe applied our framework to a cohort of 52 retrospective treatment plans for prostate cancerpatients, divided into a training set of 37 patients, a test set of 10 patients, and a validation setof 5 patients. The patients originally received volumetric modulated arc therapy, so we utilizedthe framework proposed by Kierkels et al. [22] to convert them to proton pencil beam scanning(PBS) plans. We used two beams with isocenters in the middle of the CTV, i.e. the prostate,aimed at 90 and 270 degrees, going through the left and right femurs respectively. The organsat risk (OARs) considered were the rectum, bladder, anal canal, left and right femurs. Thedose prescribed to all the patients was a median dose of 7700 cGy (RBE = 1.1) to the CTV,delivered over 35 fractions.
For the uncertainties, similar to Fredriksson et al. [6], we used a density uncertainty of±3 %, and a slightly smaller setup uncertainty of 0.5 cm. For the setup uncertainty, the isocenterwas shifted in the unit directions as well as diagonally. The identity shift was also included forboth the density and setup uncertainties, resulting in a total of 45 scenarios for each patient.For both the nominal and scenario models, we used the architecture in Figure 3, with sizes andchannels adjusted for our purposes. The voxel size used was 0.25 × 0.25 × 0.25 cm3, and theinput and output resolution of the models were 160×160×160 voxels. For the nominal model,the input channels consisted of xs0 , i.e. the binary masks for the CTV and each OAR as wellas a CT image of the patient. Recall that the purpose of the scenario model is to deform thenominal dose in accordance with a specific scenario s—therefore, the scenario model had inputchannels consisting of both the nominal geometry xs0 and a scenario geometry xs, as well asthe nominal dose ys0 .
6

Both models were trained using the total loss described in Section 2.2. The DVH lossweighting factor α was chosen using grid search over the values in {0, 0.1, 0.2, 0.3, 0.4, 0.5}.The models were trained until the loss on the validation set converged, which was around 500epochs for the nominal model and 50 epochs for the scenario model. To select the weightingfactor α, we inspected the dose washes and DVH curves. For both models, depending on thevalue of α, we saw a tradeoff between the ability to predict a dose that gives a good DVH forthe CTV, and a realistic dose outside of the CTV. For the nominal and the scenario model, weused α = 0.1 and α = 0.3, respectively. We observed that these weighting factors gave asatisfactory CTV coverage, while still giving a realistic dose outside of the CTV. The spatialloss Lspat in (1) chosen for our experiments is a voxel-level mean squared error loss. As voxelscloser to the CTV are generally more important, we weighted the contribution of each voxeldepending on its distance from the CTV using the weighting ωi ∝ max{e−βDTCTV(i),ωmin},where DTCTV(i) is the Euclidean distance from the voxel i to the CTV, β > 0 is a constant andωmin is a minimum weight threshold. For our experiments, we used β = 0.05 and ωmin = 0.01.
The robust dose mimicking was performed using a research version of the treatment plan-ning system RayStation 11A (RaySearch Laboratories, Stockholm, Sweden) with sequentialquadratic programming–based optimization, creating deliverable proton PBS plans. The in-house dose mimicking algorithm was used, with one-sided quadratic loss functions ψspat andψDVH, voxel-level weights determined partly depending on the corresponding isodose level onthe nominal predicted dose, and a weighted-power-mean cost functional with exponent 8 ap-proximating minimax optimization. The mimicking optimization was divided into three runs of60, 60, and 8 iterations respectively. In particular, approximate doses during optimization werecomputed using a Monte Carlo algorithm using 104 ions per spot, and final doses using the samealgorithm with a statistical uncertainty of 0.5 %.
3 ResultsTo verify the feasibility of the proposed pipeline, we perform a qualitative analysis for one testpatient and a quantitative analysis based on the entire test dataset. In Figure 4, two scenariosfor a test patient are visualized. The non-robust ground truth dose fails to give a sufficient targetcoverage—in particular, in the transversal view, one can see that large parts of the CTV receiveless than 95 % of the prescribed dose. However, the scenario dose prediction model has beentrained to predict doses with a better target coverage, and we see indeed that the predicted dosesuccessfully covers the CTV in these scenarios. Finally, the robust deliverable dose is generatedby performing a robust dose mimicking using all the predicted scenario doses as reference dosesand is expected to ensure coverage of the CTV in most or all of the scenarios. For the twoscenarios displayed, the CTVs are well-covered, whereas the dose decays slower beyond theCTV outline than the corresponding predicted scenario doses—this is due to the robust planneeding to account for the outcome in all scenarios.
Furthermore, the DVHs corresponding to the scenarios in Figure 4 are displayed in Figure 5.The DVHs of the predicted scenario doses are relatively similar to those of the non-robust dosein all ROIs except for the CTV, where the target coverage is instead more similar to that of theprescribed dose. This is what we wanted to achieve with our scenario dose prediction since thespatial component of the loss function used to train the scenario model is expected to make thepredicted doses similar to the ground truth scenario doses, while the DVH component is aimedat maintaining the target coverage of the nominal dose. We can also see that the robust dosehas a similar target coverage as the predicted dose in both scenarios, meaning that the targetcoverage of the predicted doses successfully propagates to the robust dose—however, naturally,
7

Figure 4: Two different scenarios with the non-robust (top row), the predicted (middle row), and therobust (bottom row) doses. The left column shows a coronal slice of scenarioA where the patient has beentranslated down 0.5 cm with respect to the image. The right column shows a transversal slice of scenarioB where the patient has been translated down 0.5 cm with respect to the image and a density shift of+3 % has been applied.
8

0 1000 2000 3000 4000 5000 6000 7000 8000 9000Dose [cGy]
0
20
40
60
80
100Vo
lum
e [%
]CTVBladderRectum0-1 cm1-2 cm
Non-robustPredictedRobust
0 1000 2000 3000 4000 5000 6000 7000 8000 9000Dose [cGy]
0
20
40
60
80
100
Volu
me
[%]
CTVBladderRectum0-1 cm1-2 cm
Non-robustPredictedRobust
Figure 5: The DVHs for scenario A (left) and scenario B (right).
this comes with the cost of a slight increase in dosage to the rectum, bladder and the targetsurroundings.
0 2000 4000 6000 8000Value [cGy]
CTV, D98%
CTV, D2%
Bladder, D10%
Rectum, D10%
Ring 0 1 cm, Dmean
Ring 1 2 cm, Dmean
Dose
stat
istic
Non-robustPredictedRobust
Figure 6: Boxplot of dose statistics for the different dose types evaluated across the 45 scenarios for eachtest patient.
Moreover, in Figure 6 and Table 1, a number of dose statistics aggregated across all testpatients and scenarios are presented. For CTV D98 % and D2 %, we see that the predicted androbust dose has a lower spread and are more focused around the prescribed dose than the non-robust dose. This indicates that the robust dose is in fact robust with respect to the CTV giventhe specified uncertainty parameters. For bladder and rectum D10 %, we see that the robust dosegives a higher dose in general to the OARs, which is an expected effect of delivering moredose to the area around the CTV due to the overlap between these OARs and the CTV in thedifferent scenarios. Finally, we include two ring ROIs, 0−1 cm representing a border of 1 cmaround the CTV and 1−2 cm representing a border of 1 cm around the aforementioned ringROI, with the purpose of illustrating the decay of dose beyond the target. We can see here,as well as in Figures 4 and 5, that the decrease is slower for the robust dose than for the non-robust and predicted doses, which is an expected effect of delivering more of the prescribeddose. In summary, the proposed pipeline is able to generate doses that are robust with respectto the scenarios, while we see certain expected effects from delivering more dose than in thenon-robust case.
9

Table 1: The minimum, maximum, mean, and standard deviation of the dose statistics for the differentdose types evaluated across the 45 scenarios for each test patient.
Goal Type Min (cGy) Max (cGy) Mean (cGy) Std (cGy)
Non-robust 4697 7523 6488 542CTV, D98 % Predicted 7119 7512 7401 73
Robust 7213 7576 7430 75Non-robust 7836 8688 8117 159
CTV, D2 % Predicted 7887 8000 7939 25Robust 7813 7975 7877 30Non-robust 404 7555 3885 1793
Bladder, D10 % Predicted 70 7375 3500 1869Robust 1481 7629 5986 1451Non-robust 651 7029 3338 1586
Rectum, D10 % Predicted 371 6675 2947 1524Robust 2511 7739 6098 1210Non-robust 4795 6440 5742 369
Ring 0−1 cm, Dmean Predicted 5216 5862 5565 136Robust 6666 7384 7131 146Non-robust 1606 3101 2297 350
Ring 1−2 cm, Dmean Predicted 1902 2315 2104 104Robust 3536 4964 4355 356
4 DiscussionIn this work, we have presented a data-driven approach to robust automated radiation therapytreatment planning. Using a dataset of non-robust proton plans and a two-step scenario doseprediction model with a DVH-based loss function term, we were able to predict relatively real-istic scenario doses with target coverage comparable to that of the nominal ground truth dose.By using them as scenario-specific reference doses in a robust dose mimicking problem, wewere able to create robust deliverable plans consistently delivering sufficient target coverage atthe cost of an expectedly higher dosage to surrounding tissue than the predicted and non-robustdoses. While additional post-processing of the created plans may be needed in order to be con-sidered clinical, as is the case with automated planning algorithms in general, the results serveto showcase the feasibility of our type of workflow—that is, the combination of scenario doseprediction and robust dose mimicking.
Among the advantages of our method are the non-requirement of a robustly planned datasetfor training, the generality and flexibility associated with separating the task of scenario doseprediction into a nominal and scenario model, and the more rigorous handling of setup and rangeuncertainties through robust optimization rather than through, for example, margins. Althoughexperiments were performed on proton plans, for photons, especially, one may want to have thechoice of whether or not to use robust planning. In such cases, access to a completely robusttraining dataset may be too high a requirement. By separating the dose prediction pipeline intothe image-to-nominal and nominal-to-scenario parts, we may use instead use data obtained fromrobust evaluation to learn the physical deformations associated with each scenario. Along withthe DVH loss aimed at controlling target coverage of the scenario model outputs, the result is a
10

highly general framework for handling robustness in automated treatment planning. However,one disadvantage of the method is that there is a lack of theoretical rigor for predicting realis-tic scenario doses with better target coverage. With our loss functions, the optimal output ofthe scenario model is a dose that is identical to the non-robust ground truth outside the CTVand identical to the nominal dose within the CTV, which is a discontinuous dose. In practice,smoothness is introduced by the convolutional design of the neural network, but this notion ishard to control exactly.
Apart from addressing the smoothness issue, future research may include evaluating theproposed methodology on datasets with different treatment modalities, delivery techniques, androbustness parameters. For protons and heavy ions, one may also generalize the current scenariodose prediction to a version in which beam doses are predicted separately, with the addition ofbeam-specific objective functions in the dose mimicking optimization problem. The scenariodose prediction may also be used in other contexts than automated planning, e.g. for qualityassurance purposes. Moreover, one may try to combine the current framework with a semi-automatic multicriteria optimization methodology such as in Zhang et al. [24]. All in all, theincorporation of robustness into machine learning–automated treatment planning enables amplenew opportunities to be explored.
5 ConclusionsWe have presented a new data-driven approach to robust automated treatment planning, com-bining prediction of spatial scenario doses with robust dose mimicking. By dividing the formerpart into a nominal and a scenario dose prediction model, and using a DVH loss during train-ing, we are able to predict for each new patient scenario doses with a robustly covered targetusing a non-robust training dataset. Subsequently, through robust dose mimicking, we obtainplans robust against the same scenario set. The numerical results serve to demonstrate the feasi-bility of the proposed methodology, which has the potential of facilitating the incorporation ofrobustness into automated planning.
AcknowledgmentsThe authors thank Mats Holmström for help with setting up the dose mimicking optimizationproblem in RayStation, and for fruitful discussions along with Fredrik Löfman.
References[1] Nguyen D, Long T, Jia X, Lu W, Gu X, Iqbal Z and Jiang S. A feasibility study for
predicting optimal radiation therapy dose distributions of prostate cancer patients frompatient anatomy using deep learning. Sci. Rep. 9 (2019).
[2] Ge Y and Wu QJ. Knowledge-based planning for intensity-modulated radiation therapy:a review of data-driven approaches. Med. Phys. 46.6 (2019), pp. 2760–2775.
[3] Siddique S and Chow JCL. Artificial intelligence in radiotherapy. Rep. Pract. Oncol.Radiother. 25.4 (2020), pp. 656–666.
[4] Ng F, Jiang R and Chow JCL. Predicting radiation treatment planning evaluation parame-ter using artificial intelligence and machine learning. IOP SciNotes 1.1 (2020), p. 014003.
11

[5] Fan J, Wang J, Chen Z, Hu C, Zhang Z and Hu W. Automatic treatment planning based onthree-dimensional dose distribution predicted from deep learning technique. Med. Phys.46.1 (2019), pp. 370–381.
[6] Fredriksson A, Forsgren A and Hårdemark B. Minimax optimization for handling rangeand setup uncertainties in proton therapy. Med. Phys. 38.3 (2011), pp. 1672–1684.
[7] Kearney V, Chan JW, Haaf S, Descovich M and Solberg TD. DoseNet: a volumetricdose prediction algorithm using 3D fully-convolutional neural networks. Phys. Med. Biol.63.23 (2018), p. 235022.
[8] Kajikawa T, Kadoya N, Ito K, Takayama Y, Chiba T, Tomori S, Nemoto H, Dobashi S,Takeda K and Jingu K. A convolutional neural network approach for IMRT dose distri-bution prediction in prostate cancer patients. J. Radiat. Res. 60.5 (2019), pp. 685–693.
[9] Zhou J, Peng Z, Song Y, Chang Y, Pei X, Sheng L and Xu XG. A method of using deeplearning to predict three-dimensional dose distributions for intensity-modulated radio-therapy of rectal cancer. J. Appl. Clin. Med. Phys. 21.5 (2020), pp. 26–37.
[10] Liu Z, Fan J, Li M, Yan H, Hu Z, Huang P, Tian Y, Miao J and Dai J. A deep learn-ing method for prediction of three-dimensional dose distribution of helical tomotherapy.Med. Phys. 46.5 (2019), pp. 1972–1983.
[11] Nguyen D, Jia X, Sher D, Lin MH, Iqbal Z, Liu H and Jiang S. 3D radiotherapy doseprediction on head and neck cancer patients with a hierarchically densely connected U-net deep learning architecture. Phys. Med. Biol. 64.6 (2019), p. 065020.
[12] Barragán-Montero AM, Nguyen D, Lu W, Lin MH, Norouzi-Kandalan R, Geets X, Ster-pin E and Jiang S. Three-dimensional dose prediction for lung IMRT patients with deepneural networks: Robust learning from heterogeneous beam configurations. Med. Phys.46.8 (2019), pp. 3679–3691.
[13] Appenzoller LM, Michalski JM, Thorstad WL, Mutic S and Moore KL. Predictingdose–volume histograms for organs-at-risk in IMRT planning. Med. Phys. 39.12 (2012),pp. 7446–7461.
[14] Jiao SX, Chen LX, Zhu JH, Wang ML and Liu XW. Prediction of dose–volume his-tograms in nasopharyngeal cancer IMRT using geometric and dosimetric information.Phys. Med. Biol. 64 (2019), 23NT04.
[15] Wu B, Ricchetti F, Sanguineti G, Kazhdan M, Simari P, Jacques R, Taylor R and McNuttT. Data-driven approach to generating achievable dose–volume histogram objectives inintensity-modulated radiotherapy planning. Int. J. Radiat. Oncol. Biol. Phys. 79.4 (2011),pp. 1241–1247.
[16] Ma M, Kovalchuk N, Buyyounouski MK, Xing L and Yang Y. Dosimetric features–driven machine learning model for DVH prediction in VMAT treatment planning. Med.Phys. 46.2 (2019), pp. 857–867.
[17] Yuan L, Yaorong G, Lee WR, Yin FF, Kirkpatrick JP and Wu QJ. Quantitative analysisof the factors which affect the interpatient organ-at-risk dose sparing variation in IMRTplans. Med. Phys. 39.11 (2012), pp. 6868–6878.
[18] Zhang T, Bokrantz R and Olsson J. Probabilistic feature extraction, dose statistic predic-tion and dose mimicking for automated radiation therapy treatment planning. Med. Phys.48.9 (2021), pp. 4730–4742.
12

[19] Fredriksson A. Automated improvement of radiation therapy treatment plans by opti-mization under reference dose constraints. Phys. Med. Biol. 57.23 (2012), pp. 7799–7811.
[20] McIntosh C, Welch M, McNiven A, Jaffray DA and Purdie TG. Fully automated treat-ment planning for head and neck radiotherapy using a voxel-based dose prediction anddose mimicking method. Phys. Med. Biol. 62.15 (2017), pp. 5926–5944.
[21] Fredriksson A, Forsgren A and Hårdemark B. Maximizing the probability of satisfyingthe clinical goals in radiation therapy treatment planning under setup uncertainty. Med.Phys. 42.7 (2015), pp. 3992–3999.
[22] Kierkels RGJ, Fredriksson A, Both S, Langendijk JA, Scandurra D and Korevaar EW.Automated robust proton planning using dose–volume histogram–based mimicking ofthe photon reference dose and reducing organ at risk dose optimization. Int. J. Radiat.Oncol. Biol. Phys. 103.1 (2019), pp. 251–258.
[23] Nguyen D, McBeth R, Barkousaraie AS, Bohara G, Shen C, Jia X and Jiang S. Incor-porating human and learned domain knowledge into training deep neural networks: adifferentiable dose–volume histogram and adversarial inspired framework for generatingPareto optimal dose distributions in radiation therapy. Med. Phys. 47.3 (2020), pp. 837–849.
[24] Zhang T, Bokrantz R and Olsson J. Probabilistic Pareto plan generation for semiau-tomated multicriteria radiation therapy treatment planning. 2021. arXiv: 2110 . 05410[physics.med-ph].
[25] Çiçek Ö, Abdulkadir A, Lienkamp SS, Brox T and Ronneberger O. 3D U-Net: learningdense volumetric segmentation from sparse annotation. Med. Image. Comput. Comput.Assist. Interv. (2016), pp. 424–432.
13