predicting on-time delivery in the trucking industry · predicting on-time delivery in the trucking...
TRANSCRIPT

Predicting On-time Delivery in the Trucking Industry
MIT SCM RESEARCH FESTMay 25, 2017
Authors: Rafael Duarte Alcoba, Kenneth W. OhlundAdvisor: Matthias Winkenbach

Agenda
2
Motivation
Methodology
Results
Conclusion

3
Motivation Methodology Results Conclusion
The US trucking industry…
Dominates the commercial transportation industry with 83.7% of the revenue
1.4%WATER1.5%RAIL INTERMODAL
3.2%AIR4.6%PIPELINE
5.6%RAIL
83.7%TRUCK
Is expected to grow 21% over the next 10 years
Connects the entire US territory

4
Motivation Methodology Results Conclusion
Ø How can companies engaged in logistics optimizeresources while improving customer service levels?
Ø Can a predictive analytics model indicate whichcombinations of variables lead to delays?
Ø Can on-time delivery in trucking be predicted?
Research Questions

5
Motivation Methodology Results Conclusion
Gathering DataØ Loads within the United States (more than 6,000 locations)
Ø Restricted to FTL (full truckload)
Ø Data from October 1, 2014 to September 30, 2016
Ø Binary decision variable for on-time delivery (0 = delayed; 1= on-time)

6
Motivation Methodology Results Conclusion
Fishbone DiagramVariables Potentially Affecting On-time Delivery
On Time Delivery
LOAD LANE CARRIER
COYOTEPROCESS FACILITY
CommodityWeightMode/EquipmentContract vs SpotIndustry (dairy, paper…)Team vs Ind. DriverHigh risk / High Value
GeographyDistanceWeather# of stops
SizeHistory w/ CoyoteSafety ratingCSA ScoreTracking Method
Ops Team# FTEsTenure
Tender Lead TimeAppt SchedulingBouncesIncidentsPickup Time (buckets)Arrived Time PickupDeparted Time PickupLate dispatchOntime PickupDays of the weekSeason
Hours of OperationOrigin FacilityDestination Facility
OPERATIONS

7
Motivation Methodology Results Conclusion
Sampling & Partitioning
Undersampling Rule of Thumb
On-Time Delivery
Data Model
95% on-time5% delayed
50% on-time50% delayed
75% Training25% Validation
Imbalanced Overfitting

8
Motivation Methodology Results Conclusion
Model SelectionResponse Predictors
Categorical(0 or 1)
Categorical
Continuous
LogisticRegression
Neural Network
Bootstrap Forest
Ø Goal: find an explanatory model with high interpretability
Ø Main model: LR
Ø Assess Performance: NN and BF

9
Motivation Methodology Results Conclusion
Variable SelectionStepwise Regression OutputMulti-Collinearity
Ø Correlation Matrix
Ø PCA / MCA
!"#$"%&ℎ = − log./(1 − 23456)
Ø Standard forward search
Ø Starts from an empty model
Ø At each step the model selects a
variable that increases maximum
likelihood fit.

10
Motivation Methodology Results Conclusion
Performance EvaluationBuild models using six explanatory variables with statistical significance
!"" = %0,1 + %1,0%
misseddelays= +,,.+
Inc. per Volume
Historical Volume
Cont. (0) vs Spot (1)
Facility Type Appt
Duration Start Seg.
On-time Start Seg.
Confusion Matrix to assess the predictive power of the models

11
Motivation Methodology Results Conclusion
Predictive Performance (Validation dataset)
Ø Model interpretations vs “BlackBox” approach
Ø High visibility of the predictors
Ø Robust results
Main model: LR Assess Performance: NN and BF
0 1
0 243 186 429
1 2,058 6,084 8,142
2301 6270 8570
err = (n0,1 + n1,0 )/n 26.18%
missed delays = n0,1 /n 2.17%
BOOTSTRAP FOREST
Predicted
Act
ual
∑
∑

12
Motivation Methodology Results Conclusion
Predictive Performance (Testing dataset)New dataset to to gauge model’s accuracy and robustness
Ø Validation
Ø Test

13
Motivation Methodology Results Conclusion
Application - ResultsUsing model results to prioritize loads requiring attention
Critical Loads - DashboardImport Load
Sort Prob.

14
Motivation Methodology Results Conclusion
Application - ResultsUsing model results to drive actions
Inc. per Volume
Historical Volume
Cont. (0) vs Spot (1)
Facility Type Appt
Duration Start Seg.
On-time Start Seg.
known when the load is tendered known after pick-up

15
Motivation Methodology Results Conclusion
Conclusion
q Tracking 23.7% of the loads
q Missing only 2.4% of loads
that will be late
2.6% 2.4%
21.1% 73.9%
Prediction
Act
ual
1. Resources can be optimized using the Logistic Regression Model
2. On - time delivery can be predicted
3. Using a combination of six variables with high statistical
significance can deliver predictive power

16
Motivation Methodology Results Conclusion
Conclusion
q Tracking 23.7%
q Missing 2.4%
q Tracking 57.9%
q Missing 0.9%
q Tracking 91.5%
q Missing 0.1%
Trade-off: Resource Reduction vs Missing Error
2.6% 2.4%
21.1% 73.9%
Prediction
Actual
4.1% 0.9%
53.8% 41.2%
Prediction
Actual
4.9% 0.1%
86.6% 8.4%
Prediction
Actual
CUTT OFF = 0.5
CUTT OFF = 0.6
CUTT OFF = 0.7

17
Motivation Methodology Results Conclusion
Suggestion for Future ResearchØ Increased availability of online information through new technologies
Ø Readiness to store records on remote servers using (cloud servers)
Ø Predictive model able to capture information from online records could
bring new insights and complement the analysis presented in this study
Pick up
Delivery
Telemetry

18
Q&A

19
backup slides
20
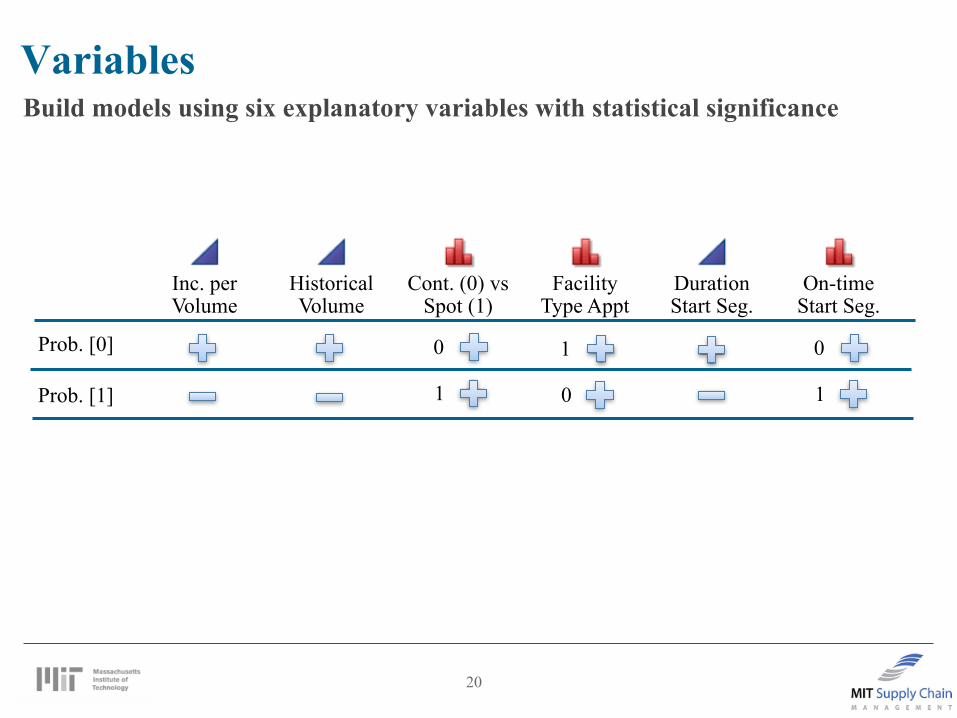
VariablesBuild models using six explanatory variables with statistical significance
Prob. [0]
Prob. [1]
Inc. per Volume
Historical Volume
Cont. (0) vs Spot (1)
Facility Type Appt
Duration Start Seg.
On-time Start Seg.
0
1
0
1
1
0

OriginalConfusionMatrix
0 10 2,192 2,093 4,2851 950 3,335 4,285
3142 5428 8570err=(n0,1 +n1,0 )/n 35.51%
Errforpredicting1andactual=0 24.42%
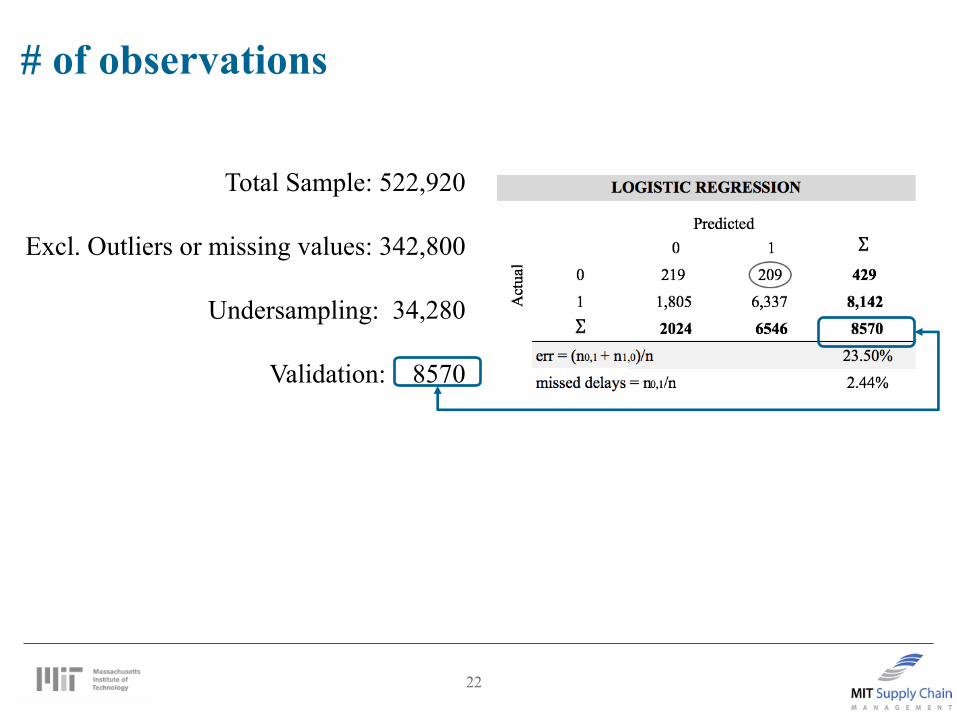
ReweightedConfusionMatrix
0 10 219 209 4291 1,805 6,337 8,142
2024 6546 8570err=(n0,1 +n1,0 )/n 23.50%
Errforpredicting1andactual=0 2.44%
Actual
LOGREGRESSION
PredictedActual
Predicted
∑
∑
∑
∑
21
Reweighted Confusion Matrix0 1
OriginalData 5% 95%Undersampling 50% 50%
10.00 0.53
Reweighting
Divided by 10
Divided by 0.53
22
# of observations
Total Sample: 522,920
Excl. Outliers or missing values: 342,800
Undersampling: 34,280
Validation: 8570

23
Predictive ModelsLogistic
Regression
Neural Network
Bootstrap Forest
Ø Variation of Random Forests. It combines results from
multiple trees to improve predictive power
Ø Machine Learning technique. It mimics the activity in
the brain, where neurons are interconnected and learn
from experience
Ø Simply saying, it works with the same ideas as linear
regression, but for a categorical output.
Ø Relies on mathematical equation relating predictors with
the outcome.