predicting nonlinear properties of metamaterials from the...
TRANSCRIPT
LETTERSPUBLISHED ONLINE: 9 FEBRUARY 2015 | DOI: 10.1038/NMAT4214
Predicting nonlinear properties of metamaterialsfrom the linear responseKevin O’Brien1†, Haim Suchowski1,2†, Junsuk Rho1,2, Alessandro Salandrino1, Boubacar Kante1,Xiaobo Yin1,2 and Xiang Zhang1,2,3*The discovery of optical second harmonic generation in 1961started modern nonlinear optics1–3. Soon after, R. C. Millerfound empirically that the nonlinear susceptibility could bepredicted from the linear susceptibilities. This importantrelation, knownasMiller’s Rule4,5, allows a rapid determinationof nonlinear susceptibilities from linear properties. In recentyears,metamaterials, artificialmaterials thatexhibit intriguinglinear optical properties not found in natural materials6, haveshownnovelnonlinearpropertiessuchasphase-mismatch-freenonlinear generation7, new quasi-phase matching capabili-ties8,9 and large nonlinear susceptibilities8–10. However, theunderstanding of nonlinear metamaterials is still in its infancy,with no general conclusion on the relationship between linearand nonlinear properties. The key question is then whetherone can determine the nonlinear behaviour of these artificialmaterials from their exotic linear behaviour. Here, we showthat the nonlinear oscillator model does not apply in generalto nonlinear metamaterials. We show, instead, that it ispossible to predict the relative nonlinear susceptibility oflarge classes of metamaterials using a more comprehensivenonlinear scattering theory, which allows e�cient designof metamaterials with strong nonlinearity for importantapplications such as coherent Raman sensing, entangledphoton generation and frequency conversion.
The broad applicability of Miller’s rule, which holds for a widevariety of natural materials, stems from the fact that it is a directresult of the Lorentz oscillator description of material nonlinearity,in which a charge is moving in a non-quadratic potential4. Anestimate for Miller’s delta, the proportionality between the non-linear and the linear susceptibilities, can be obtained by assumingthat the linear and nonlinear restoring forces will be of similarmagnitudes when the displacement of the charge is of the orderof the inter-atomic distance, leading to an approximate value ofMiller’s delta of1M≈a2/e, where a is the inter-atomic distance ande is the electron charge. Experimentally, Miller’s delta was foundto be nearly constant, with a value of 0.45± 0.07m2 C−1 for manysemiconductor crystals, even though the linear and nonlinear sus-ceptibilities spanned over four orders of magnitude11,12. Miller’s rulewas originally proposed for the transparency region of nonlinearcrystals, where the losses were minimal, but was later extended toabsorptive regions13. Themodelwas shown to apply to awide varietyof materials, from semiconductor crystals to atomic vapours14,15 andnoble metals16. In a quantum mechanical treatment, the derivativeof the potential is replaced with an average of the wavefunction overthe ground state17. The development of metamaterials in the pastdecade allows the exploration of the nonlinear properties of such
materials at optical18–23 and microwave24 frequencies. Researchershave found that in some cases, such as the third harmonic emissionfrom bow-tie and double-bar nanostructures18,19, Miller’s rule or itsequivalent nonlinear oscillator model25 fairly accurately predicts thenonlinear susceptibilities. However, the general validity of Miller’srule in optical metamaterials for arbitrary nonlinear processes, andspecifically for second-order susceptibilities, is not known. Here weshow experimentally that Miller’s rule fails to describe the second-order susceptibility of metamaterials and predicts an incorrect opti-mum geometry for generating the highest second-order nonlinear-ity. We however demonstrate the optimal geometry can be correctlypredicted with a more general nonlinear scattering theory. Thisgeneral principle describes not only second-order but also higher-order nonlinear optical responses of plasmonic nanostructures overa broad wavelength range. The predictive capability of nonlinearscattering theory enables rapid design of optimal nonlinear nanos-tructures for sensing and integrated photonics.
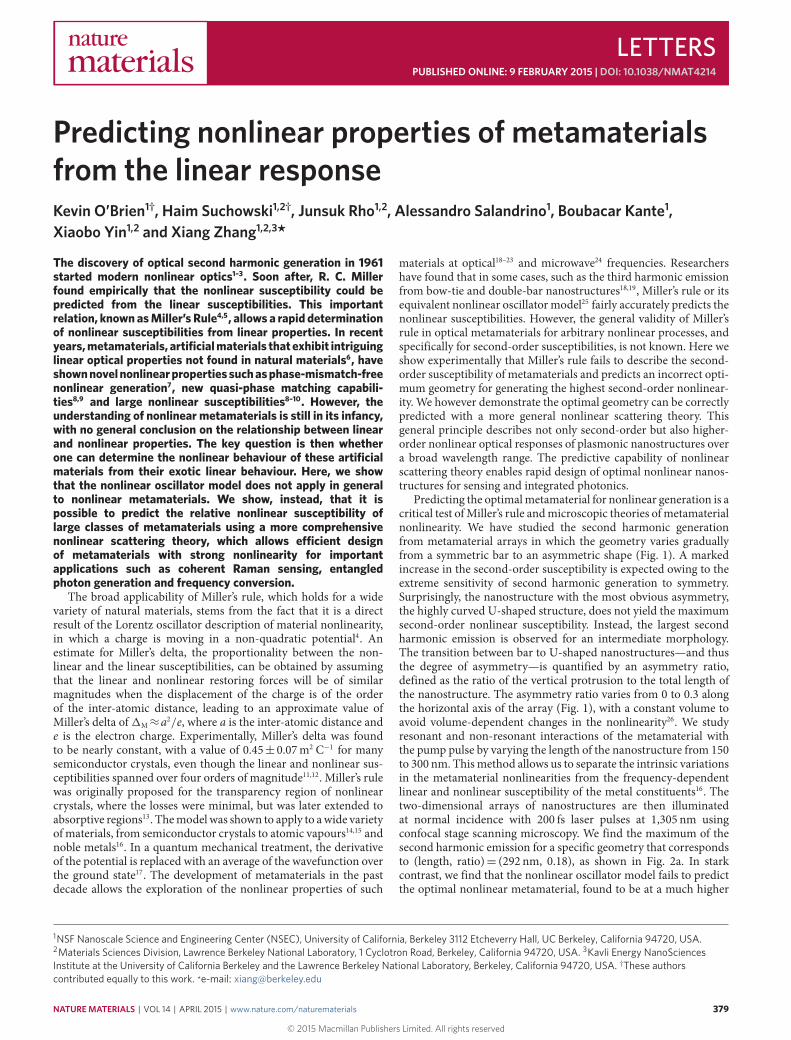
Predicting the optimalmetamaterial for nonlinear generation is acritical test ofMiller’s rule andmicroscopic theories ofmetamaterialnonlinearity. We have studied the second harmonic generationfrom metamaterial arrays in which the geometry varies graduallyfrom a symmetric bar to an asymmetric shape (Fig. 1). A markedincrease in the second-order susceptibility is expected owing to theextreme sensitivity of second harmonic generation to symmetry.Surprisingly, the nanostructure with the most obvious asymmetry,the highly curved U-shaped structure, does not yield the maximumsecond-order nonlinear susceptibility. Instead, the largest secondharmonic emission is observed for an intermediate morphology.The transition between bar to U-shaped nanostructures—and thusthe degree of asymmetry—is quantified by an asymmetry ratio,defined as the ratio of the vertical protrusion to the total length ofthe nanostructure. The asymmetry ratio varies from 0 to 0.3 alongthe horizontal axis of the array (Fig. 1), with a constant volume toavoid volume-dependent changes in the nonlinearity26. We studyresonant and non-resonant interactions of the metamaterial withthe pump pulse by varying the length of the nanostructure from 150to 300 nm. Thismethod allows us to separate the intrinsic variationsin the metamaterial nonlinearities from the frequency-dependentlinear and nonlinear susceptibility of the metal constituents16. Thetwo-dimensional arrays of nanostructures are then illuminatedat normal incidence with 200 fs laser pulses at 1,305 nm usingconfocal stage scanning microscopy. We find the maximum of thesecond harmonic emission for a specific geometry that correspondsto (length, ratio)= (292 nm, 0.18), as shown in Fig. 2a. In starkcontrast, we find that the nonlinear oscillator model fails to predictthe optimal nonlinear metamaterial, found to be at a much higher
1NSF Nanoscale Science and Engineering Center (NSEC), University of California, Berkeley 3112 Etcheverry Hall, UC Berkeley, California 94720, USA.2Materials Sciences Division, Lawrence Berkeley National Laboratory, 1 Cyclotron Road, Berkeley, California 94720, USA. 3Kavli Energy NanoSciencesInstitute at the University of California Berkeley and the Lawrence Berkeley National Laboratory, Berkeley, California 94720, USA. †These authorscontributed equally to this work. *e-mail: [email protected]
NATURE MATERIALS | VOL 14 | APRIL 2015 | www.nature.com/naturematerials 379
© 2015 Macmillan Publishers Limited. All rights reserved

LETTERS NATUREMATERIALS DOI: 10.1038/NMAT4214
Asymmetry ratio
a b c
500 nm
Morphology
Length
= Ly/Leff
Ly
Leff
ω
2ω3ω
Figure 1 | Schematic of the metamaterial array. Nonlinear light generation from metamaterial arrays in which the geometry of the nanostructures variesgradually from a symmetric bar to an asymmetric U-shape. The second-order susceptibility is expected to be extremely sensitive to the symmetry of themetamaterial. a, Definition of the parameter space: the total length and asymmetry ratio of the nanostructures is changed throughout the array. Furtherdetails on the sample design are given in Supplementary Fig. 4. b, Schematic of the second and third harmonic generation as a function of thenanostructure length and morphology. A confocal microscope is used to excite the nanostructures with infrared laser pulses (1,305 nm). The nonlinearemission is measured in transmission and the linear transmission is characterized using a supercontinuum laser. c, Scanning electron microscope image ofthe nanostructures. To avoid particle–particle coupling, a period of 500 nm was used. This spectroscopy method allows us to separate the intrinsicvariations in the nanostructure nonlinearities from the frequency-dependent linear and nonlinear susceptibility of the metal constituents.
ratio in the experiment (0.18± 0.02) than predicted by Miller’srule (0.12± 0.02), as seen in Fig. 2b. In addition, as seen in bothmodels, the most asymmetric structures do not yield the highestsecond-order nonlinearity, as might be thought intuitively fromsimple spatial symmetry considerations. The optimum nonlinearmetamaterial can be fully predicted by applying nonlinear scatteringtheory, which as we will show allows an accurate prediction ofthe correct far-field nonlinear susceptibility using the microscopicrather than the far-field linear response of the metamaterial.
Whereas the far-field linear response fails to predict thenonlinear properties of the metamaterial as Miller’s rule prescribes,we find that the microscopic description can effectively predictthe nonlinear susceptibility. In nonlinear scattering theory, thenonlinear emission is described by assuming a local nonlinearsusceptibility tensor on the surface of the noble metal. Thisrelationship can be quantified using the Lorentz reciprocitytheorem27 as
Enl(2ω)∝∫ ∫
χnnnE2n(ω) ·En(2ω)dS
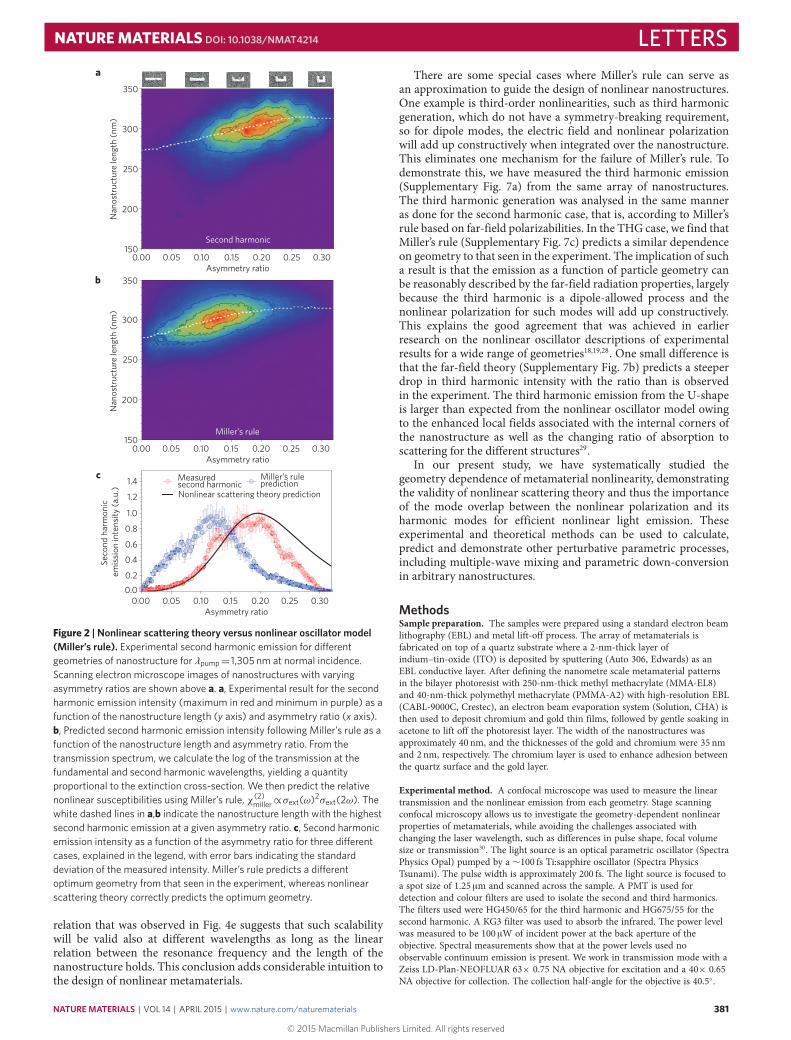
where Enl(2ω) is the nonlinear emission, χnnn is the local nonlinearsusceptibility, and En(ω) and En(2ω) are the linear fields ofthe fundamental mode and the mode at the second harmonicfrequency normal to the surface of the nanostructure. This processis illustrated schematically in Fig. 3a. The value of the overlapintegral depends on the local field and the relative sign of thecontributions: destructive interference between contributions caneasily occur, resulting in low nonlinear emission. In contrast,good mode overlap, meaning constructive interference betweenthe nonlinear polarization mode and its harmonics, will lead tovery high far-field nonlinear emission, resulting in an intimateconnection between themicroscopic linear polarization and the far-field emission. By examining the microscopic origin of the far-fieldnonlinear emission, we can quantify this relationship and get anintuitive physical understanding of the violation of Miller’s rule. Incontrast, the numerical simulation using nonlinear scattering theorypredicts an asymmetry ratio (∼0.19) that is consistent with theexperimental results, as shown in Fig. 2c.
The microscopic contributions, which are complex valued, addup from each region of the nanostructure, creating constructive ordestructive interference in the far-field emission. A physically
intuitive understanding of the net nonlinear emission inmetamaterials can be obtained by plotting the value of P ·E on apath around the nanostructure in a complex plane representation.The net nonlinear emission is proportional to the magnitude ofthe vector sum of the microscopic nonlinear sources. A large finalmagnitude corresponds to high nonlinear emission, which is aconsequence of large polarizability and good overlap between themodes, whereas poor nonlinear emission can result fromweak localfields as well as poor overlap or destructive interference betweennonlinear generations in different regions. Four nanostructureswith varying asymmetry ratios are plotted in Fig. 3b. For ‘bar-like’nanostructures with a low asymmetry ratio (purple), the trajectoryin the complex plane is not straight, illustrating the destructiveinterference of the microscopic nonlinear sources. In the oppositelimit, for the greatest asymmetry ratio of 0.33 (dark green), the lineintegral follows a straight path in the complex plane, but the overalllength of the vectors is smaller than the optimal nanostructure.The reason for this effect is the smaller absorption cross-section ofthe highly curved U-shaped structure than that of the bar. For theoptimal nanostructure with an asymmetry ratio of 0.19 (brown),the path integral exhibits some curvature, but has the largestfinal radius. The optimal nanostructure for second harmonicemission represents a compromise between the absorption atthe fundamental, the second harmonic, and the ability for themicroscopic sources to combine constructively.
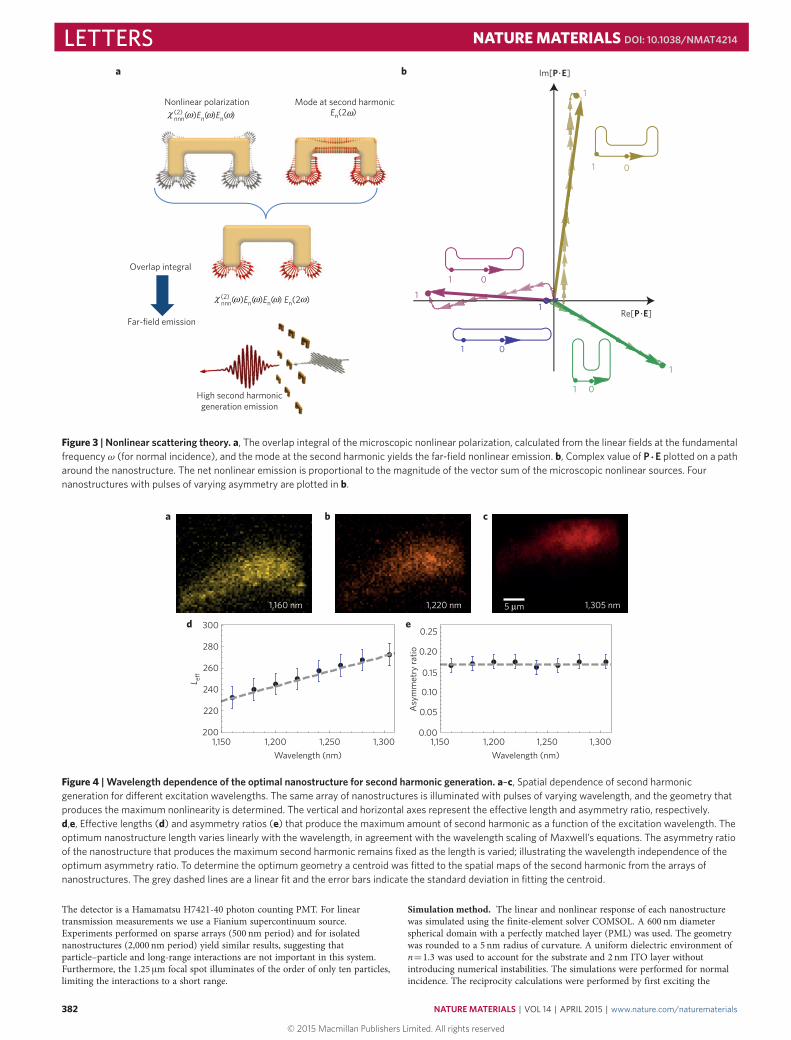
In the experiment, the second harmonic has a single peak alongthe vertical axis, indicating that the wavelength dependence is dom-inated by the resonance of one specific eigenmode at the fundamen-tal frequency. To test the wavelength scaling, the nonlinear responsewas measured for different pump wavelengths. The second har-monic versus position on the array is shown in Fig. 4a–c for pumpwavelengths of 1,160 nm, 1,220 nm and 1,305 nm, respectively. Therelation between the position of the second harmonic emission peakand the excitation wavelength is linear (Fig. 4d), which correspondsto the linear relation between effective length and resonant wave-length. We find that, although the optimum length shifts with thepump wavelength, the optimum asymmetry ratio remains fixed.This optimum ratio depends on a delicate balance between theability of the nanostructure to absorb light, which decreases roughlylinearly with the length of the horizontal arm, and its ability togenerate an asymmetric near-field current pattern, which dependson the length in the vertical direction (LY in Fig. 1). The constant
380 NATURE MATERIALS | VOL 14 | APRIL 2015 | www.nature.com/naturematerials
© 2015 Macmillan Publishers Limited. All rights reserved
NATUREMATERIALS DOI: 10.1038/NMAT4214 LETTERS
Second harmonic
Miller’s rule
350
300
250
200
150
Measuredsecond harmonic
Miller’s rule prediction
Nonlinear scattering theory prediction
Nan
ostr
uctu
re le
ngth
(nm
)N
anos
truc
ture
leng
th (n
m)
Seco
nd h
arm
onic
em
issi
on in
tens
ity (a
.u.)
a
b
c1.4
1.2
1.0
0.8
0.6
0.4
0.2
0.00.00 0.05 0.10 0.15
Asymmetry ratio0.20 0.25 0.30
0.00 0.05 0.10 0.15Asymmetry ratio
0.20 0.25 0.30
Asymmetry ratio0.00 0.05 0.10 0.15 0.20 0.25 0.30
350
300
250
200
150
Figure 2 | Nonlinear scattering theory versus nonlinear oscillator model(Miller’s rule). Experimental second harmonic emission for di�erentgeometries of nanostructure for λpump= 1,305 nm at normal incidence.Scanning electron microscope images of nanostructures with varyingasymmetry ratios are shown above a. a, Experimental result for the secondharmonic emission intensity (maximum in red and minimum in purple) as afunction of the nanostructure length (y axis) and asymmetry ratio (x axis).b, Predicted second harmonic emission intensity following Miller’s rule as afunction of the nanostructure length and asymmetry ratio. From thetransmission spectrum, we calculate the log of the transmission at thefundamental and second harmonic wavelengths, yielding a quantityproportional to the extinction cross-section. We then predict the relativenonlinear susceptibilities using Miller’s rule, χ (2)
miller∝σext(ω)2σext(2ω). Thewhite dashed lines in a,b indicate the nanostructure length with the highestsecond harmonic emission at a given asymmetry ratio. c, Second harmonicemission intensity as a function of the asymmetry ratio for three di�erentcases, explained in the legend, with error bars indicating the standarddeviation of the measured intensity. Miller’s rule predicts a di�erentoptimum geometry from that seen in the experiment, whereas nonlinearscattering theory correctly predicts the optimum geometry.
relation that was observed in Fig. 4e suggests that such scalabilitywill be valid also at different wavelengths as long as the linearrelation between the resonance frequency and the length of thenanostructure holds. This conclusion adds considerable intuition tothe design of nonlinear metamaterials.
There are some special cases where Miller’s rule can serve asan approximation to guide the design of nonlinear nanostructures.One example is third-order nonlinearities, such as third harmonicgeneration, which do not have a symmetry-breaking requirement,so for dipole modes, the electric field and nonlinear polarizationwill add up constructively when integrated over the nanostructure.This eliminates one mechanism for the failure of Miller’s rule. Todemonstrate this, we have measured the third harmonic emission(Supplementary Fig. 7a) from the same array of nanostructures.The third harmonic generation was analysed in the same manneras done for the second harmonic case, that is, according to Miller’srule based on far-field polarizabilities. In the THG case, we find thatMiller’s rule (Supplementary Fig. 7c) predicts a similar dependenceon geometry to that seen in the experiment. The implication of sucha result is that the emission as a function of particle geometry canbe reasonably described by the far-field radiation properties, largelybecause the third harmonic is a dipole-allowed process and thenonlinear polarization for such modes will add up constructively.This explains the good agreement that was achieved in earlierresearch on the nonlinear oscillator descriptions of experimentalresults for a wide range of geometries18,19,28. One small difference isthat the far-field theory (Supplementary Fig. 7b) predicts a steeperdrop in third harmonic intensity with the ratio than is observedin the experiment. The third harmonic emission from the U-shapeis larger than expected from the nonlinear oscillator model owingto the enhanced local fields associated with the internal corners ofthe nanostructure as well as the changing ratio of absorption toscattering for the different structures29.
In our present study, we have systematically studied thegeometry dependence of metamaterial nonlinearity, demonstratingthe validity of nonlinear scattering theory and thus the importanceof the mode overlap between the nonlinear polarization and itsharmonic modes for efficient nonlinear light emission. Theseexperimental and theoretical methods can be used to calculate,predict and demonstrate other perturbative parametric processes,including multiple-wave mixing and parametric down-conversionin arbitrary nanostructures.
MethodsSample preparation. The samples were prepared using a standard electron beamlithography (EBL) and metal lift-off process. The array of metamaterials isfabricated on top of a quartz substrate where a 2-nm-thick layer ofindium–tin-oxide (ITO) is deposited by sputtering (Auto 306, Edwards) as anEBL conductive layer. After defining the nanometre scale metamaterial patternsin the bilayer photoresist with 250-nm-thick methyl methacrylate (MMA-EL8)and 40-nm-thick polymethyl methacrylate (PMMA-A2) with high-resolution EBL(CABL-9000C, Crestec), an electron beam evaporation system (Solution, CHA) isthen used to deposit chromium and gold thin films, followed by gentle soaking inacetone to lift off the photoresist layer. The width of the nanostructures wasapproximately 40 nm, and the thicknesses of the gold and chromium were 35 nmand 2 nm, respectively. The chromium layer is used to enhance adhesion betweenthe quartz surface and the gold layer.
Experimental method. A confocal microscope was used to measure the lineartransmission and the nonlinear emission from each geometry. Stage scanningconfocal microscopy allows us to investigate the geometry-dependent nonlinearproperties of metamaterials, while avoiding the challenges associated withchanging the laser wavelength, such as differences in pulse shape, focal volumesize or transmission30. The light source is an optical parametric oscillator (SpectraPhysics Opal) pumped by a ∼100 fs Ti:sapphire oscillator (Spectra PhysicsTsunami). The pulse width is approximately 200 fs. The light source is focused toa spot size of 1.25 µm and scanned across the sample. A PMT is used fordetection and colour filters are used to isolate the second and third harmonics.The filters used were HG450/65 for the third harmonic and HG675/55 for thesecond harmonic. A KG3 filter was used to absorb the infrared. The power levelwas measured to be 100 µW of incident power at the back aperture of theobjective. Spectral measurements show that at the power levels used noobservable continuum emission is present. We work in transmission mode with aZeiss LD-Plan-NEOFLUAR 63× 0.75 NA objective for excitation and a 40× 0.65NA objective for collection. The collection half-angle for the objective is 40.5◦.
NATURE MATERIALS | VOL 14 | APRIL 2015 | www.nature.com/naturematerials 381
© 2015 Macmillan Publishers Limited. All rights reserved
LETTERS NATUREMATERIALS DOI: 10.1038/NMAT4214
Nonlinear polarization(2)
Mode at second harmonic
1
1 0
01
1
Overlap integral
a b
1
Im[P E]
Re[P E]
High second harmonicgeneration emission
nnn( )En( )En( ) En(2 )χ ω ω ωω
(2)nnn( )En( )En( ) En(2 )χ ω ω ω ω
Far-field emission
01
1
01
Figure 3 | Nonlinear scattering theory. a, The overlap integral of the microscopic nonlinear polarization, calculated from the linear fields at the fundamentalfrequency ω (for normal incidence), and the mode at the second harmonic yields the far-field nonlinear emission. b, Complex value of P ·E plotted on a patharound the nanostructure. The net nonlinear emission is proportional to the magnitude of the vector sum of the microscopic nonlinear sources. Fournanostructures with pulses of varying asymmetry are plotted in b.
a
d e
b c
1,160 nm 1,220 nm 5 µm 1,305 nm
1,150 1,200 1,250 1,300 1,150 1,200 1,250 1,300
Asy
mm
etry
ratio
L eff
0.25
0.20
0.15
0.10
0.05
0.00
300
280
260
240
220
200
Wavelength (nm) Wavelength (nm)
Figure 4 | Wavelength dependence of the optimal nanostructure for second harmonic generation. a–c, Spatial dependence of second harmonicgeneration for di�erent excitation wavelengths. The same array of nanostructures is illuminated with pulses of varying wavelength, and the geometry thatproduces the maximum nonlinearity is determined. The vertical and horizontal axes represent the e�ective length and asymmetry ratio, respectively.d,e, E�ective lengths (d) and asymmetry ratios (e) that produce the maximum amount of second harmonic as a function of the excitation wavelength. Theoptimum nanostructure length varies linearly with the wavelength, in agreement with the wavelength scaling of Maxwell’s equations. The asymmetry ratioof the nanostructure that produces the maximum second harmonic remains fixed as the length is varied; illustrating the wavelength independence of theoptimum asymmetry ratio. To determine the optimum geometry a centroid was fitted to the spatial maps of the second harmonic from the arrays ofnanostructures. The grey dashed lines are a linear fit and the error bars indicate the standard deviation in fitting the centroid.
The detector is a Hamamatsu H7421-40 photon counting PMT. For lineartransmission measurements we use a Fianium supercontinuum source.Experiments performed on sparse arrays (500 nm period) and for isolatednanostructures (2,000 nm period) yield similar results, suggesting thatparticle–particle and long-range interactions are not important in this system.Furthermore, the 1.25 µm focal spot illuminates of the order of only ten particles,limiting the interactions to a short range.
Simulation method. The linear and nonlinear response of each nanostructurewas simulated using the finite-element solver COMSOL. A 600 nm diameterspherical domain with a perfectly matched layer (PML) was used. The geometrywas rounded to a 5 nm radius of curvature. A uniform dielectric environment ofn=1.3 was used to account for the substrate and 2 nm ITO layer withoutintroducing numerical instabilities. The simulations were performed for normalincidence. The reciprocity calculations were performed by first exciting the
382 NATURE MATERIALS | VOL 14 | APRIL 2015 | www.nature.com/naturematerials
© 2015 Macmillan Publishers Limited. All rights reserved

NATUREMATERIALS DOI: 10.1038/NMAT4214 LETTERSnanostructure with a plane wave at the pump wavelength, then calculating thenonlinear polarization at every point on the nanostructure surface for the secondharmonic and bulk for the third harmonic. Another simulation was thenperformed by sending in a second wave from the detector at the emissionwavelength. The overlap integral was then performed, thus calculating theeffective nonlinear susceptibility.
Received 14 January 2014; accepted 9 January 2015;published online 9 February 2015
References1. Franken, P. A., Hill, A. E., Peters, C. W. &Weinreich, G. Generation of optical
harmonics. Phys. Rev. Lett. 7, 118–119 (1961).2. Armstrong, J. A., Bloembergen, N., Ducuing, J. & Pershan, P. S. Interactions
between light waves in a nonlinear dielectric. Phys. Rev. 127,1918–1939 (1962).
3. Bloembergen, N. & Pershan, P. S. Light waves at the boundary of nonlinearmedia. Phys. Rev. 128, 606–622 (1962).
4. Garrett, C. & Robinson, F. Miller’s phenomenological rule for computingnonlinear susceptibilities. IEEE J. Quantum Electron. 2, 328–329 (1966).
5. Miller, R. C. Optical second harmonic generation in piezoelectric crystals.Appl. Phys. Lett. 5, 17–19 (1964).
6. Shalaev, V. M. Optical negative-index metamaterials. Nature Photon. 1,41–48 (2007).
7. Suchowski, H. et al. Phase mismatch-free nonlinear propagation in opticalzero-index materials. Science 342, 1223–1226 (2013).
8. Rose, A., Huang, D. & Smith, D. R. Controlling the second harmonic in aphase-matched negative-index metamaterial. Phys. Rev. Lett. 107,063902 (2011).
9. Rose, A., Larouche, S., Poutrina, E. & Smith, D. R. Nonlinear magnetoelectricmetamaterials: Analysis and homogenization via a microscopic coupled-modetheory. Phys. Rev. A 86, 033816 (2012).
10. Sukhorukov, A. A., Solntsev, A. S., Kruk, S. S., Neshev, D. N. & Kivshar, Y. S.Nonlinear coupled-mode theory for periodic plasmonic waveguides andmetamaterials with loss and gain. Opt. Lett. 39, 462–465 (2014).
11. Byer, R. L. Nonlinear optical phenomena and materials. Annu. Rev. Mater. Sci.4, 147–190 (1974).
12. Scandolo, S. & Bassani, F. Miller’s rule and the static limit for second-harmonicgeneration. Phys. Rev. B 51, 6928–6931 (1995).
13. Bell, M. I. Frequency dependence of Miller’s rule for nonlinear susceptibilities.Phys. Rev. B 6, 516–521 (1972).
14. Cataliotti, F. S., Fort, C., Hänsch, T. W., Inguscio, M. & Prevedelli, M.Electromagnetically induced transparency in cold free atoms: Test of a sum rulefor nonlinear optics. Phys. Rev. A 56, 2221–2224 (1997).
15. Miles, R. & Harris, S. Optical third-harmonic generation in alkali metal vapors.IEEE J. Quantum Electron. 9, 470–484 (1973).
16. Matranga, C. & Guyot-Sionnest, P. Absolute intensity measurements of theoptical second-harmonic response of metals from 0.9 to 2.5 eV. J. Chem. Phys.115, 9503–9512 (2001).
17. Rapapa, N. P. & Scandolo, S. Universal constraints for the third-harmonicgeneration susceptibility. J. Phys. Condens. Matter 8, 6997–7004 (1996).
18. Hentschel, M., Utikal, T., Giessen, H. & Lippitz, M. Quantitative modeling ofthe third harmonic emission spectrum of plasmonic nanoantennas. Nano Lett.12, 3778–3782 (2012).
19. Metzger, B., Hentschel, M., Lippitz, M. & Giessen, H. Third-harmonicspectroscopy and modeling of the nonlinear response of plasmonicnanoantennas. Opt. Lett. 37, 4741–4743 (2012).
20. Niesler, F. B. P., Feth, N., Linden, S. & Wegener, M. Second-harmonic opticalspectroscopy on split-ring-resonator arrays. Opt. Lett. 36, 1533–1535 (2011).
21. Canfield, B. K. et al. Local field asymmetry drives second-harmonic generationin noncentrosymmetric nanodimers. Nano Lett. 7, 1251–1255 (2007).
22. Husu, H. et al.Metamaterials with tailored nonlinear optical response.Nano Lett. 12, 673–677 (2012).
23. Dadap, J. I., Shan, J. & Heinz, T. F. Theory of optical second-harmonicgeneration from a sphere of centrosymmetric material: Small-particle limit.J. Opt. Soc. Am. B 21, 1328–1347 (2004).
24. Poutrina, E., Huang, D., Urzhumov, Y. & Smith, D. R. Nonlinear oscillatormetamaterial model: Numerical and experimental verification. Opt. Express 19,8312–8319 (2011).
25. Bassani, F. & Lucarini, V. General properties of optical harmonic generationfrom a simple oscillator model. Nuovo Cimento D 20, 1117–1125 (1998).
26. Lippitz, M., van Dijk, M. A. & Orrit, M. Third-harmonic generation fromsingle gold nanoparticles. Nano Lett. 5, 799–802 (2005).
27. Roke, S., Bonn, M. & Petukhov, A. V. Nonlinear optical scattering: The conceptof effective susceptibility. Phys. Rev. B 70, 115106 (2004).
28. Gentile, M. et al. Investigation of the nonlinear optical properties ofmetamaterials by second harmonic generation. Appl. Phys. B 105,149–162 (2011).
29. Husnik, M. et al. Quantitative experimental determination of scattering andabsorption cross-section spectra of individual optical metallic nanoantennas.Phys. Rev. Lett. 109, 233902 (2012).
30. Castro-Lopez, M., Brinks, D., Sapienza, R. & van Hulst, N. F. Aluminum fornonlinear plasmonics: Resonance-driven polarized luminescence of Al, Ag,and Au nanoantennas. Nano Lett. 11, 4674–4678 (2011).
AcknowledgementsThis work was supported by the US Department of Energy, Office of Science, BasicEnergy Sciences, Materials Sciences and Engineering Division undercontract no. DE-AC02-05CH11231. J.R. acknowledges a fellowship from theSamsung Scholarship Foundation, Republic of Korea.
Author contributionsK.O. and H.S. conducted the experiments. K.O. performed the theoretical calculations.J.R. fabricated the samples. K.O., H.S., X.Y. and X.Z. prepared the manuscript. X.Z.guided the research. All authors contributed to discussions.
Additional informationSupplementary information is available in the online version of the paper. Reprints andpermissions information is available online at www.nature.com/reprints.Correspondence and requests for materials should be addressed to X.Z.
Competing financial interestsThe authors declare no competing financial interests.
NATURE MATERIALS | VOL 14 | APRIL 2015 | www.nature.com/naturematerials 383
© 2015 Macmillan Publishers Limited. All rights reserved