predicting energy balance status of holstein cows using
TRANSCRIPT

Predicting Energy BalanceStatus of Holstein Cows usingMid-Infrared Spectral Data
Sinéad Mc Parland,G.Banos, E.Wall, M.P.Coffey, H.Soyeurt,
R.F.Veerkamp & D.P.Berry

Introduction Energy balance (output-input) is a heritable
indicator of health & fertility in dairy cows Useful for multi-trait breeding programme BUT
Expensive to measure (correctly) Measurement not feasible on commercial herds Little data available
Methods to model energy balance exist Require expensive phenotypes Rely on phenotypes not always available
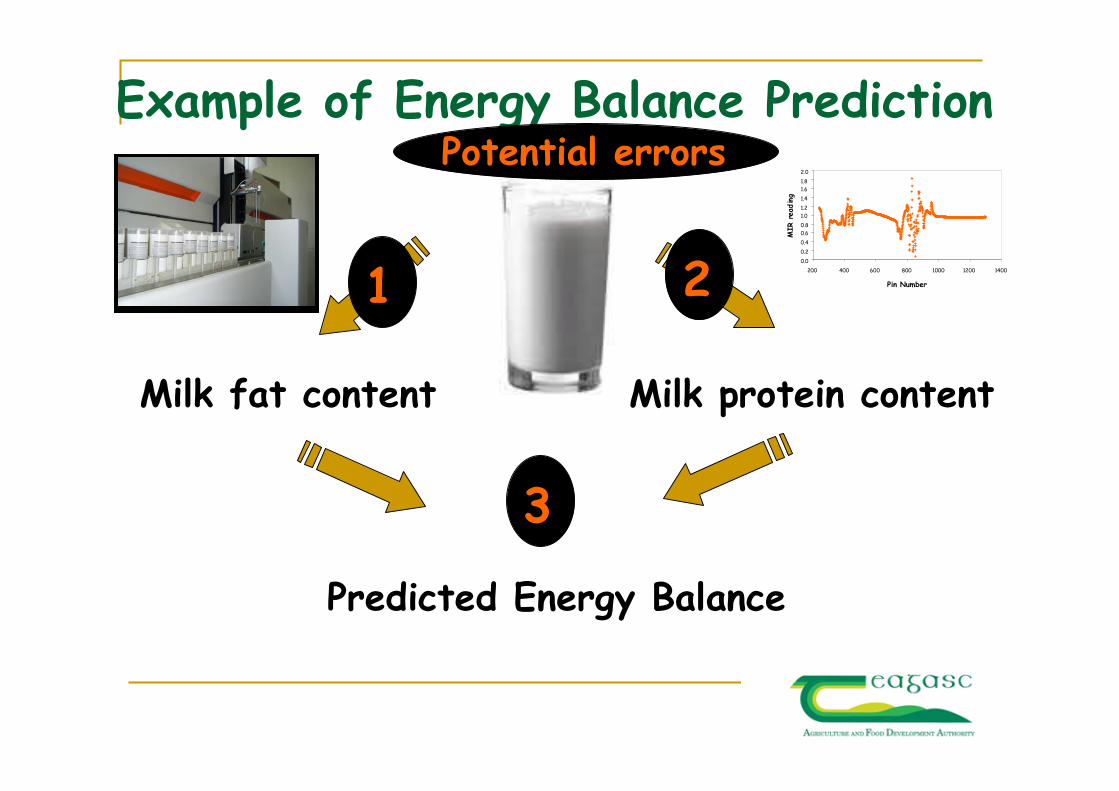
Example of Energy Balance Prediction
Milk fat content Milk protein content
:Predicted Energy Balance
1 2
3
Potential errors
0.0
0.2
0.4
0.60.8
1.01.2
1.4
1.61.8
2.0
200 400 600 800 1000 1200 1400
Pin Number
MIR
read
ing

Objective
Predicted Energy Balance
•Predict energy balancedirectly from milk usingMIR spectral data
•Can we improve theaccuracy of prediction? 0.0
0.2
0.4
0.6
0.8
1.0
1.2
1.4
1.6
1.8
2.0
200 400 600 800 1000 1200 1400
Pin Number
MIR
read
ing
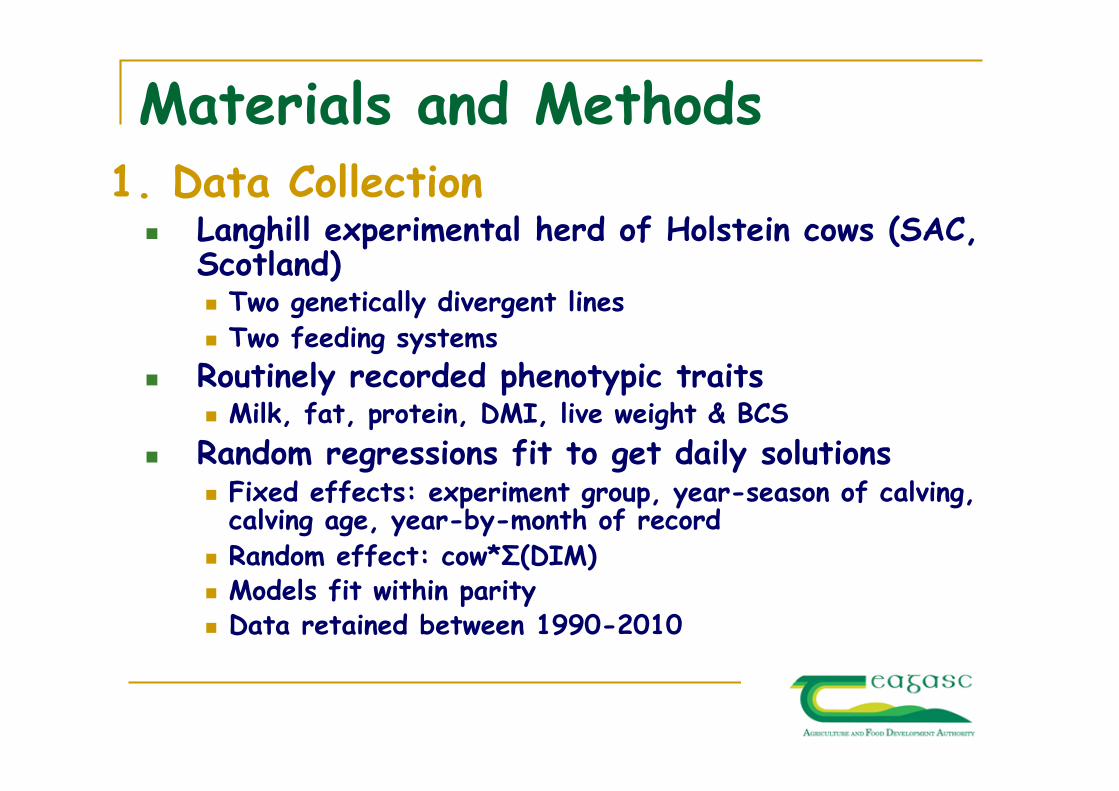
Materials and Methods1. Data Collection
Langhill experimental herd of Holstein cows (SAC,Scotland) Two genetically divergent lines Two feeding systems
Routinely recorded phenotypic traitsMilk, fat, protein, DMI, live weight & BCS
Random regressions fit to get daily solutions Fixed effects: experiment group, year-season of calving,
calving age, year-by-month of record Random effect: cow*Σ(DIM)Models fit within parity Data retained between 1990-2010

Materials and Methods2. Calculation of energy balance Two separate measures (Banos & Coffey, 2010)
Direct_EB = inputs – outputsincl. milk production, DMI, weight, BCS & diet
Body energy content (EC) = predicted protein andlipid weights from BCS and LWT
ALSO
Daily deviation from mean direct_EB (dev_EB)Cows own deviation within parity

Materials and Methods3. Mid Infrared Spectral (MIR) data
Monthly samples from all cows sent for MIRanalysis September 2008 – December 2009 Light shone through each milk sample 1,060 wavelength readings for each sample

Materials and Methods3. Mid Infrared Spectral (MIR) data
Monthly samples from all cows sent for MIRanalysis September 2008 – December 2009 Light shone through each milk sample 1,060 wavelength readings for each sample
0.0
0.2
0.4
0.6
0.8
1.0
1.2
1.4
1.6
1.8
2.0
925 1425 1925 2425 2925 3425 3925 4425 4925
Wavelength
MIR
read
ing

Materials and Methods4. Prediction equations
Partial least squares analysis (PROC PLS, SAS)
Two models – MIR onlyMIR + milk yield
AM, PM & MD yields analysed separately1,199 AM, 1,127 PM and 1,148 MD records available
Cross validation method (max 20 factors) Also external validation
25% of data set independently tested Best model has the highest R2 for EXT. validation

RESULTS

Energy Balance Lactation Curves
-70
-60
-50
-40
-30
-20
-10
0
10
20
5 25 45 65 85 105
125
145
165
185
205
225
245
265
285
305
Days in Milk
Ener
gyBa
lanc
e(M
J/da
y)
Parity 1 Parity 2 Parity 3

Energy Balance - Feed Group
-70
-60
-50
-40
-30
-20
-10
0
10
20
5 25 45 65 8510
512
514
516
518
520
5225 24
5265 285 30
5
Days in Milk
Ener
gyBa
lanc
e(M
J/d
ay)
High Concentrate Low Concentrate

Energy Content Lactation Curves
4000
4500
5000
5500
6000
6500
7000
5 55 105 155 205 255 305
Days in Milk
Ener
gyCon
tent
(MJ) Parity 1 Parity 2 Parity 3

Cross Validation Results
10210.38DEV_ EB1611290.24Energy Content12270.32Direct_EB
PM16210.37DEV_ EB1611440.23Energy Content16260.35Direct_EB
MD17200.40DEV_ EB1711310.25Energy Content18250.41Direct_EB
AM
FactorsRMSER2

Addition of milk yield as a predictor
0.440.38DEV_ EB0.240.24Energy Content0.420.32Direct_EB
PM0.410.37DEV_ EB0.220.23Energy Content0.430.35Direct_EB
MD0.440.40DEV_ EB0.250.25Energy Content0.500.41Direct_EB
AMMIR & YieldMIR onlyPredictors

Update
Data collection on-going
Since collation of results presented, data
size (MIR) has doubled
Analyses re-run

Results updated -
0.390.480.38DEV_ EB0.200.380.24Energy Content0.450.530.32Direct_EB
PM0.400.470.37DEV_ EB0.190.360.23Energy Content0.440.470.35Direct_EB
MD0.390.450.40DEV_ EB0.180.340.25Energy Content0.420.430.41Direct_EBR2R2R2AM
ExternalCrossCrossValidationNew ResultsPrevious Results

Conclusion
Predicting energy balance directly from milk ismore accurate than using fat:protein ratio
Greater predictive ability when milk yield includedin the model
New data aided improved predictive ability Predictive ability for external validation <50%
Still a lot of unexplained variation “Noisy” phenotype as measured here
Work on-going to improve equations

This work was carried out as part of theRobustMilk project that is financially supportedby the European Commission under the Seventh
Research Framework Programme, GrantAgreement KBBE-211708
www.robustmilk.eu
Acknowledgements