predicting economic sanctions: the roles of the...
TRANSCRIPT
Predicting Economic Sanctions:
The Roles of the Democratic Peace and UN Security
Council Membership
This version: 30/08/2013
William Seitz
Centre for the Study of African Economies
University of Oxford

2
Abstract
Investigating factors that predict countries using economic sanctions against one another is an
open research area. In this paper, I focus on the importance of UN Security Council membership
and democratic governance as determinants of the use of economic sanctions.
Using one traditional data source and two novel data sources, I show that a variety of rare
events corrected regression specifications confirm that democratic countries are significantly
less likely to use sanctions against one another, supporting similar findings from Cox & Drury
(2006). The results also show that the permanent members of the UN Security Council are
significantly more likely to use sanctions than non-members, and that these countries use
sanctions more often than their economic size, wealth and trade relationships would suggest.
These findings are robust to including several important controls in the regression models, and
remain both after redefining sanction events to include only the first sanction episode for a
country dyad, and when possibly endogenous variables are lagged in the regression analysis.

3
1 Introduction
Although an extensive literature has sought to understand the effects of economic sanctions
against target countries, a much smaller body of recent empirical work investigates the factors
that influence the likelihood that sanctions will be used by one country against another. In this
paper I focus on the latter question, and investigate the importance of two country dyad
relationships that I show likely influence the probability that a country will use economic
sanctions.
Firstly, I study the importance of shared democratic institutions, and specifically, test the
extent to which previous reports that democratic countries sanction one another less often are
robust to alternative definitions and additional controls. Secondly, I consider how and when
United Nations Security Council (UNSC) members use economic sanctions, and compare the
differences between members and non-members with respect to sanction events.
Another contribution of this paper is to introduce the use of two datasets that have not, to
my knowledge, been used for these purposes in the past. The majority of peer-reviewed
research concerning economic sanctions has used the influential Hufbauer et al. (2007) dataset,
which relies on case studies of sanction events going back to the early 1900s. In the following
analysis, I hope to compliment analyses of the traditional source using the King & Lowe (2006)
and Morgan, Bapat & Krustev (2009) datasets, both of which were created using automated
coding of news articles and other materials. The inclusion of these data offers two definitions of
economic sanctions that differ from the case study literature, and can potentially support (or
call into question) the robustness of previous findings.
In the following sections, I use standard regression techniques to show that after controlling
for determinants such as economic size, per-capita GDP, bilateral trade, and other
considerations, democracies are significantly less likely to use sanctions against one another
than they are to use sanctions against non-democracies. This finding supports previous
research on this question, and suggests that the results are robust to different specifications,
regression models, and data sources for the dependent variable of interest.
I also find that permanent members of the UN Security Council use sanctions substantially
more than non-UNSC members. The relationship is strong in each of the datasets I present

4
here, and is therefore not solely driven by the recent increase in UN-approved sanction
measures. These countries use sanctions more often than their economic size, bilateral trade
relationships, and per capita GDP would suggest.
In the following section, I briefly discuss the recent literature on UN Security Council
membership and the theory of democratic peace applied to economic sanctions. From this
basis I suggest two testable hypotheses. In Section 3 I describe the data used in the estimations
that follow. In Section 4 I describe the empirical approach and in Section 5 provide the
regression tables [PLEASE FIND TABLES FOLLOWING SECTION 6 IN THIS PRELIMINARY VERSION]
and discussion. Section 6 concludes.
2 Literature
2.1 Democracy and Sanctions
The earliest widely acknowledged discussion of a theory of democratic peace is credited to
Immanuel Kant, who suggested the idea in Perpetual Peace in 1795. In its modern form, the
argument was made explicit in statistical analysis that appeared in Moaz & Russett (1993) and
Russett et al. (1995) and was later supplemented in response to critiques (Chernoff, 2004;
Kinsella, 2005; Rousseau, 2005). These analyses find that, with few exceptions, democracies are
significantly less likely to go to war or be involved in violent conflict with one another.
Because democracies and armed conflicts are both relatively rare, the issue of causality is an
open question in this literature, and there are many theories that attempt to explain why
democracies choose to go to war against one another less often. The most mainstream points
of view are that domestic considerations, such as perceptions of shared norms, and
institutional constraints undermine any interest democratic countries may have for going to
war with other democracies (Russet et al., 1995).
These theories have companions in the literature on economic sanctions. The Kaemfer and
Lowenburg (1992) model suggests that domestic interests groups compete in a political market
in hopes of implementing (or refraining from implementing) economic sanctions. Other
analyses have assumed that democratic norms that are shared among democracies, including

5
respect for human rights and the rule of law, reduce the number of grievances that democratic
countries have against other democratic countries that may be cause for using economic
sanctions. Hufbauer et al. (2007) agree, and advance the perspective that the “political
character” of the target countries is a central consideration in the case study literature on the
use of economic sanctions.
Cox & Drury (2006) analyze cases of economic sanctions at the country dyad level1 to show
that this special case of peace between democratic regimes can be demonstrated statistically.
The authors suggest that democracies more often target non-democracies because doing so is
less politically costly, echoing the “shared values” reasoning to explain the relationship.
There are several reasons that we should seek confirmation of this finding however. Using
the Hubaur et al. (2000) dataset, Lektzian & Souva (2003) also find that democracies are less
likely to sanction other democracies, but show that according to their definition of success,
autocratic regimes are less easily harmed by economic sanctions. This would suggest that
although sanctions appear to be less common among democracies using case study data, there
is a plausible motivation for democracies to change this behavior. Sanctions made by
democracies against other democracies may be more effective than those that occur in other
circumstances.
Several other questions arise from the analysis in the Cox & Drury (2006) study. An
important sender and target characteristic that is not included their analyses is the total
economic size of the sender and target (rather than solely the ratio of per capita GDP between
the target and the sender), which is a strong predictor of sanction events, as noted by Hufbauer
et al. (2007).
These observations suggest the first hypothesis I consider:
Hypothesis 1: Pairs of democratic countries should sanction one another less often
than if one of the countries in the pair is not ruled by a democratic regime.
1 A dataset later published in Hufbauer et al. (2007)
6
In the following sections, I include controls for economic size, bilateral trade and per capita
GDP. To anticipate the results, I show that the democratic peace relationship reported in Cox &
Drury (2006) also exists in the two alternative datasets I use in the analysis below, and is
moreover robust to the inclusion of additional controls.
2.2 United Nations Security Council Membership
Until the end of the Cold War, a large share of international sanctions was launched by the
United States. Most of these sanctions were implemented unilaterally without ever being
referred to the UN Security Council. The US frequently sanctioned countries that were not
aligned with the West, and most of all the USSR. Other common targets of unilateral US policy
were countries that threatened to leave the West’s sphere of influence, such as Nicaragua, or
those countries that the US hoped to influence for specific policy objectives. In 1978 the US
launched sanctions against Argentina, India and Brazil for example, over concerns of nuclear
policy.
A similar practice was common for the Soviet Union, which commonly used economic
sanctions against adversaries such as the United States, but also against more amenable
regimes such as Yugoslavia, and countries that strayed from policies that benefited the USSR,
such as sanctions against Finland in 1958 (Hufbauer et al., 2007).
With the notable exceptions of sanctions against Rhodesia and embargoes against South
Africa, during the Cold War there were few sanctions programs that were authorized by the UN
Security Council. Veto powers for permanent members meant that economic sanctions that
were potentially damaging to one or more members were infeasible, leading to stalemates
between rivals on the Security Council.
Since the early 1990s however, and the end of the Cold War, the most high-profile sanction
events have been undertaken by members of the UN Security Council, and actions have been
taken collectively in several instances. Examples of this recent turn around include actions
against Iraq in 1990 and 1991, in addition sanctions against Yugoslavia and Haiti also in 1991.
Later examples include sanction programs against Sierra Leone, Cambodia and Afghanistan.
7
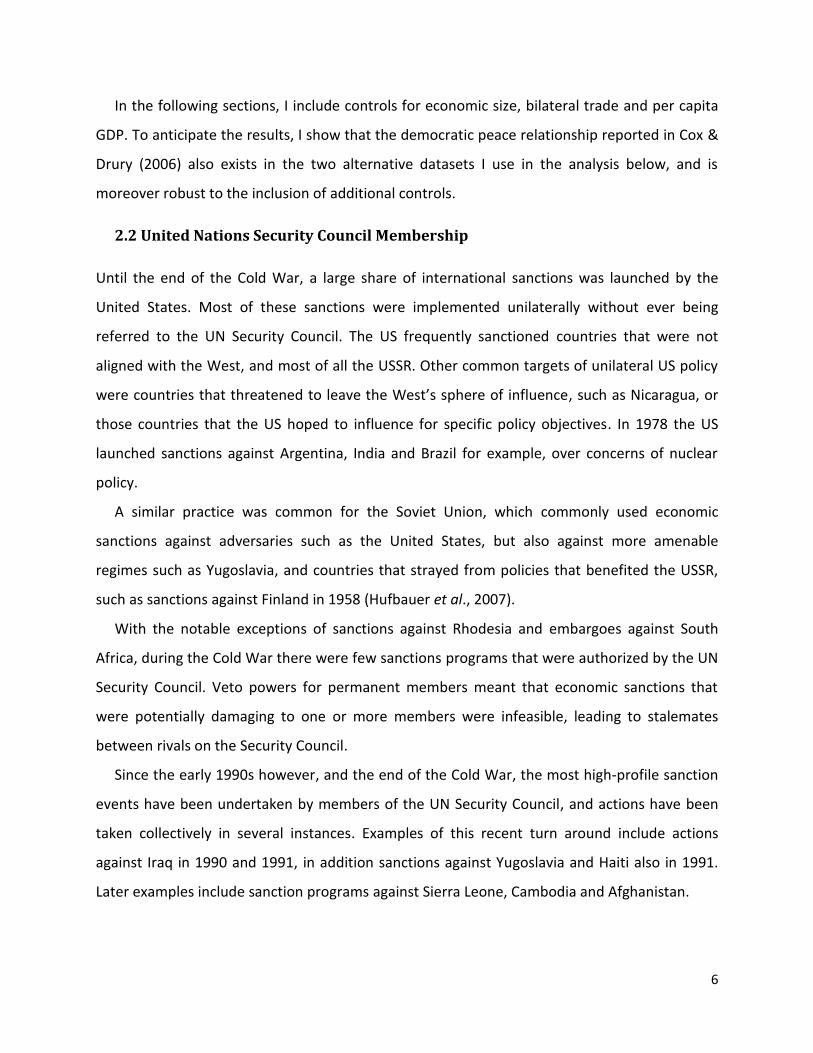
Figure 1
This group faces specific costs to undertaking actions, but also benefits from considerable
influence on the global stage. As each of the permanent member countries is able to veto
propositions made by other states within the UN system, these members are shielded from
sanction programs that have been legitimized via either the UN Security Council or General
Assembly. This is in contrast to the considerations that non-permanent members must take into
account. Although non-permanent members are tasked with increased responsibility
concerning global affairs during their tenures in the Security Council, they do not have access to
perpetual veto powers.
Simple descriptive statistics show that since the surge in UN-approved sanction use post-
1990, the permanent members of the UNSC have used sanctions more often than other
counties (Figure 1), and in addition have commonly resorted to unilateral action more often
than other countries. The need for consensus still limits the application of sanctions that have
been approved at the UN level however, and those few issues that do manage to rally sufficient
multilateral agreement are often in response to violence, humanitarian, or security concerns in
non-UNSC member countries.
These observations suggest the second hypothesis I consider:
Hypothesis 2: Members of the UN Security Council use sanctions more than non-
members.
8
3 Data
The most commonly used dataset in the empirical literature on economic sanctions comes
from Hufbauer et al. (2007), and previous versions of the dataset from the same authors.
Although re-estimating findings on this dataset is not my primary objective in this paper, I
include companion results using this data to show the similarities and differences between it,
and the two alternatives that I focus on here. In all cases, an observation includes a target
country, a sending country and the year. All countries with populations of more than 1 million
people are included for each year covered in each dataset individually; including countries that
have never or have not recently experienced sanctions.
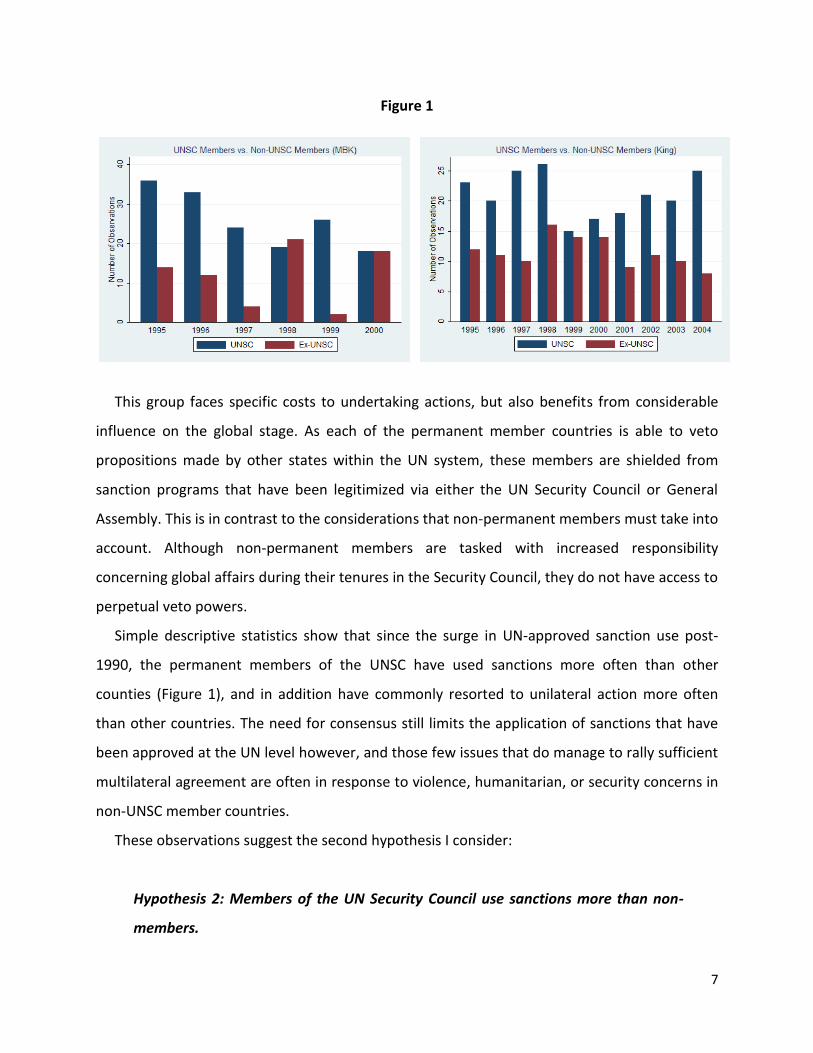
Figure 2: Total Sanction Sending by Country (Hufbauer et al., 2007)

9
Figure 3: Total Sanction Recipient Events by Country (Hufbauer et al., 2007)
The Hufbauer et al. (2007) data are organized on the sanction event level, and include
observations that were initiated by international organizations rather than undertaken
unilaterally by states. I have recoded international organizations in the version that I use in this
paper by creating a country pairing with each individual sending country that was a member of
the organization at the time that the sanction was initiated. The only exception to this approach
was the case of sanctions issued by the United Nations. In these cases, I have coded country
pairs using the members (both permanent and non-permanent) of the Security Council at the
time the sanction was initiated. Figure 2 provides a graphical representation of sanction events
for the Hufbauer et al. (2007) data, and Figure 3 provides a similar description of targets.
In addition to the Hufbauer et al. (2007) dataset, I use two data sources derived from news
articles to construct separate versions of a binary dependent variable describing the use or
threat of sanctions.
The first of these alternatives was created by Morgan, Bapat & Krustev (2009). Coding for
this dataset proceeded in two stages; a first ‘candidate’ list was created primarily from Lexis-
Nexis, Facts on File, and Keesing’s Record of Contemporary Events, searching for terms such as
“sanction”, “embargo”, “trade war”, “blockade”, and “foreign aid reduction”, among others.
The list was then supplemented by searches in both the New York Times and London Times
indexes. The search was limited to cover yearly event observations from 1970-2000.
The data were then amended by a human coder to fit the definition set out by the authors;
namely, that the events involve at least one sender state and a target state, and that actions
10
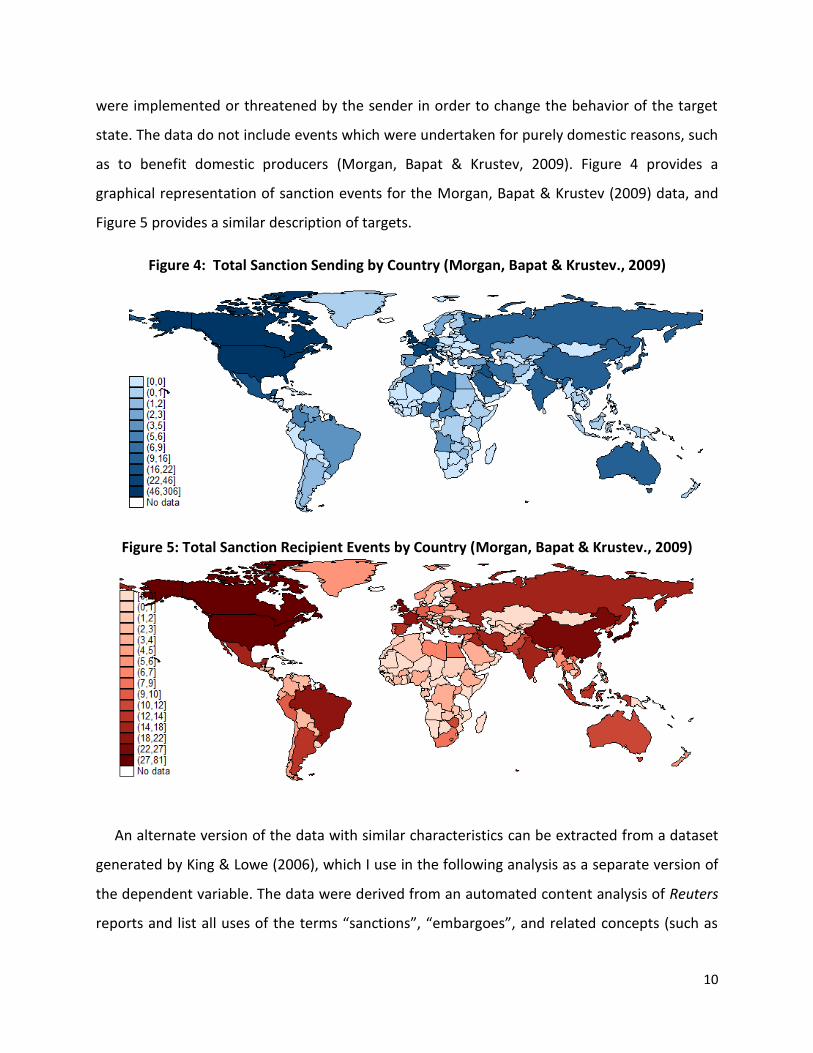
were implemented or threatened by the sender in order to change the behavior of the target
state. The data do not include events which were undertaken for purely domestic reasons, such
as to benefit domestic producers (Morgan, Bapat & Krustev, 2009). Figure 4 provides a
graphical representation of sanction events for the Morgan, Bapat & Krustev (2009) data, and
Figure 5 provides a similar description of targets.
Figure 4: Total Sanction Sending by Country (Morgan, Bapat & Krustev., 2009)
Figure 5: Total Sanction Recipient Events by Country (Morgan, Bapat & Krustev., 2009)
An alternate version of the data with similar characteristics can be extracted from a dataset
generated by King & Lowe (2006), which I use in the following analysis as a separate version of
the dependent variable. The data were derived from an automated content analysis of Reuters
reports and list all uses of the terms “sanctions”, “embargoes”, and related concepts (such as

11
“withdrawal of economic aid”). Like the Morgan, Bapat & Krustev dataset, the King & Lowe data
are not solely measures of the use of sanctions or embargoes, but include the threats of
economic coercion.2 The King & Lowe dataset covers the period between 1995 and 2004.
For all three versions of the dependent variable, a non-event indicates that at no point in a
given year was it reported in the news services (or in case studies) that the sending country
threatened or initiated a sanction against the target country. If multiple events are recorded
over a given year for a one sender against the same target, only a single observation per year
appears in the data I use. Each year is considered independently, so a previous sanction does
not preclude an analysis of additional sanctions in later years. Figure 6 provides a graphical
representation of sanction events for the King & Lowe data, and Figure 7 provides a similar
description of targets.
Figure 6: Total Sanction Sending by Country (King & Lowe, 2006)
2 For a full list of countries included in these data please see Appendix

12
Figure 7: Total Sanction Recipient Events by Country (King & Lowe, 2006)
The two alternative datasets are dissimilar in several respects. The Morgan, Bapat & Krustev
data include more trade-related sanctions, and human coders excluded cases when a sanction
was being undertaken for the benefit of domestic industries or for domestic concerns,
according to the interpretation of the human coder. The King & Lowe data presumably contain
some sanction events undertaken for the benefit of domestic industries, and trade-related
issues were treated as a separate category in the King & Lowe data. The difference between the
sources may also be an important consideration, as the news services used by the two sources
did not overlap.
The explanatory variables included in the analysis below come from a range of sources. To
investigate the democratic peace, I construct a binary variable which takes a value of 1 when
both the sender and the target countries are democracies, which I define using the Polity IV
dataset, as a polity2 score of greater than or equal to 6 (Marshall, Jaggers, & Gurr, 2010).
To investigate Hypothesis 2 concerning the likelihood that UNSC members use sanctions
more often than non-members, I match a dataset of both permanent and non-permanent UNSC
member countries by year, from 1946 to 2004.
The control variables included in the regressions analyses below also come from several
distinct sources. I use the value of trade (excluding services) between country pairs in millions
of USD from Barbieri & Keshk (2012), which is distributed as a compliment to Correlates of War
Project’s datasets. I also include total GDP and per capita GDP from the Penn World Tables

13
(2011). The distance between countries has been shown to be significant in some analyses, and
I use distance between capitals from Gleditsch (2012) as an additional control.
4 Empirical Approach
I estimate the probability of “the use or threat of sanctions” ( ), a binary outcome
that follows a Bernoulli probability function taking a value of 1 with probability and 0 with
probability 1- . The probability varies over as an inverse logistic function of a vector
that includes a constant term and explanatory variables:
( | ) ( )
The use of sanctions by one country against another is very rare; very small values of pose
challenges for estimating what would be, in a balanced outcome context, a simple logistic
regression problem. The difficulty arises due to the fact that with a larger number of non-cases,
the variance for positive cases will be smaller than for non-cases, as is demonstrated using
Monte Carlo simulations in King & Zeng (2001). Additional positive event observations are
therefore more informative than non-cases (Imbens, 1992).
I use the procedure outlined by King & Zeng (2001) to correct for the underestimation of the
coefficients. However, clustering standard errors at the dyad level is not easily implemented
using this approach. As a robustness check, I re-estimate each specification using the
complimentary log-log approach that similarly corrects for the rarity of a positive outcome of a
binary variable, and which moreover allows for straightforward standard error clustering. The
differences between the two approaches do not materially affect the results reported in the
following section, and the tables below include the results from both regression methods.
Temporal relation is also a concern in the context of this paper, as it is reasonable to assume
that the threat or use of sanctions between two countries depends to some extent on whether
the two countries have a history of using sanctions against one another. Such a relationship
leads to standard errors which systematically underestimate variability, invalidating a

14
regression model that does not include variables associated with the time passed since the last
realization of an event. Beck, Katz, & Tucker (1998) provide such a method using cubic splines,
which I include in all analyses reported in the following sections.
5 Results and Discussion
5.1 Results
Hypothesis 1: Pairs of democratic countries should sanction one another less often
than if one of the countries in the pair is not ruled by a democratic regime.
The analysis shows that democratic countries are significantly less likely to use economic
sanctions against other democracies. Although the strength of the relationship is slightly less in
the regressions reported here than in Cox & Drury (2006), the negative and statistically
significant coefficients indicate that the relationship is robust to including several additional
control explanatory variables and on three separate versions of the dependent variable.
Table 1 shows that using the King & Lowe data, dyads in which both countries are
democracies are significantly less likely to experience sanctions. The results are broadly similar
using corrected logistic regression (columns 1-3) and using complimentary log-log regression
(columns 4-6). Removing the control for total GDP in both the sender and target country from
the regression decreases the significance of the result on joint democracy, indicating the
importance of economic size as a covariate to explain the variance in sanction events. Table 2
shows similar results using the longer duration Morgan, Bapat & Krustev dataset.
Table 3 reports the regression results using the traditional Hufbauer et al. dataset, and show
a similar, negative and statistically significant coefficient. Cox & Drury (2006) report a smaller p-
value in their analysis of the same data source, but this difference is almost certainly due to
several modifications made in the analysis here. Firstly, the data I employ in this analysis
include sanction events from 1946, whereas Cox & Drury (2006) limit their data to the years
between 1978 and 2000. I have also recoded events that involved international organizations to
create country pairs for each country that was a member of the international organization at
the time that a sanction was initiated. Cox & Drury (2006) use an alternative method of ranking

15
the interests of members in the international organization, and include only those countries
that played leadership roles in initiating sanctions.
Nonetheless, a companion result to that described in Cox & Drury (2006) is robust and
apparent in all data sources I discuss here. An important point in this respect is that the
addition of several controls, and most notably the control for the size of the target and sending
economy, do not significantly undermine the core result.
Importantly, an additional analysis which includes separate variables for sender and target
polity 2 scores – reported in Tables 4 and 5 respectively – results in no systematic relationship
between democracy and sanction events in general. It appears that it is specifically the
coincidence of democracy in both the sender and target country which is related to lower
sanction incidence.
Hypothesis 2: Members of the UN Security Council use sanctions more than non-
members.
UN Security Council members indeed appear to be much more likely to use sanctions (and in
some cases, to be sanctioned), even after controlling for other determinants such as economic
size and the amount of bilateral trade. In Tables 1 and 2, showing the results on the King &
Lowe (2006) and Morgan, Bapat & Krustev (2009) data respectively, the positive coefficients
indicate that if one (or both) of the countries in a dyad is a member of the Security Council, a
sanction event is significantly more likely than otherwise. Tables 10 and 11 make this result
more explicit, showing that a dyad pair in which the sender is a Security Council member is
positive and statistically significant in both data sources. In the King & Lowe (2006) data, the
same regressions reveal that UNSC members are more often targeted by sanctions as well.
Over the longer time period in the Morgan, Bapat & Krustev (2009) data however, the
significance appears to be driven primary by the sender’s status as a member (or non-member)
of the Security Council. This may indicate that the trend to sanction UNSC members more often
is relatively recent.
Likewise, membership in the UNSC is statistically significant in the Hufbauer et al. (2007)
dataset. I am unaware of any other analysis using this dataset that has made the relationship

16
clear. In Table 3 the coefficient is positive and of similar magnitude to that of the alternative
datasets indicating that the relationship between a sending country’s membership on the UNSC
and behavior with respect to sanctions is a long-standing one, and not limited to post-Cold War
international policies or solely due to the recent increase in the use of the UN as a venue to
coordinate sanction policy.
It does not appear to be the case however that the non-permanent members of the Security
Council are more likely to use sanctions during their membership period. In contrast, limiting
the UNSC membership variable to only permanent seats results in a significant and positive
coefficient in the regression analysis, indicating that that China, the United States, Russia/the
Soviet Union, the United Kingdom and France use sanctions more often than their economic
size, trade, and wealth explain, and significantly more than non-permanent members on the
Security Council.
5.2 Endogeneity
Because the use of sanctions against a country can affect the target country’s trade patterns,
economic size, and other variables included in the regression analysis I preform, there is reason
to be concerned that reverse causality is a potential source of endogeneity. Indeed, Hufbauer et
al. (2007) estimate that successful sanctions have an average economic impact of a 2.4 per cent
decrease in total GDP for the target country. One should therefore suspect that the national
economies of targeted countries may be altered due to sanction policies.
As a first step to understanding the extent and importance of endogeneity in this analysis, I
re-estimate the corrected logistic and complementary log-log regression models while lagging
the values of possibly endogenous variables. The results of this approach are reported in Tables
6 and 7.
As a second step, I redefine a positive outcome as observations in which a sanction event is
recorded for the first time in the dataset for that country pair. Re-estimating the regression
thus excludes cases with a higher likelihood of endogeneity due to the lasting effects of
previous sanction events. The results of this procedure are reported in Tables 8 and 9.
17
There does not appear to be a substantial difference in the results due to these two
alterations in the empirical approach, although the degree of statistical significance does
change in some instances. This may indicate that endogeneity is not especially concerning in
this context; however, as the data do not provide a full history of sanctions, and possible
channels of reverse causality are potentially unaccounted for, the issue of possible endogeneity
is not completely answered here.
6 Conclusion
It has been argued in the recent literature that several issues directly affect the likelihood that
one country will use sanctions against another. In this paper I have investigated the extent to
which democracies refrain from using economic sanctions against one another and the
importance of membership in the UN Security Council with respect to sanction use
Using two variations of regression models that correct for rare events and three separate
datasets, I show several persistent regularities in the relationships between sanction events and
the variables of interest.
Countries that are permanent UN Security Council members are substantially more likely to
use sanctions. These results are robust to a range of controls and the data sources used. Several
variations of the regression models used in this paper indicate that democracies are
substantially less likely to initiate sanctions against other democracies, and that this result is not
driven by democracies using sanctions less often.
The results generally support claims made in the recent literature and suggest that these
findings are robust to the specific definitions used, the (modern) time period under study, and
the statistical approach employed. Preliminary investigations into possible endogeneity likewise
do not raise large concerns about the stability of these results, although more attention is
needed with respect to the possibility for endogeneity and missing variable biases.
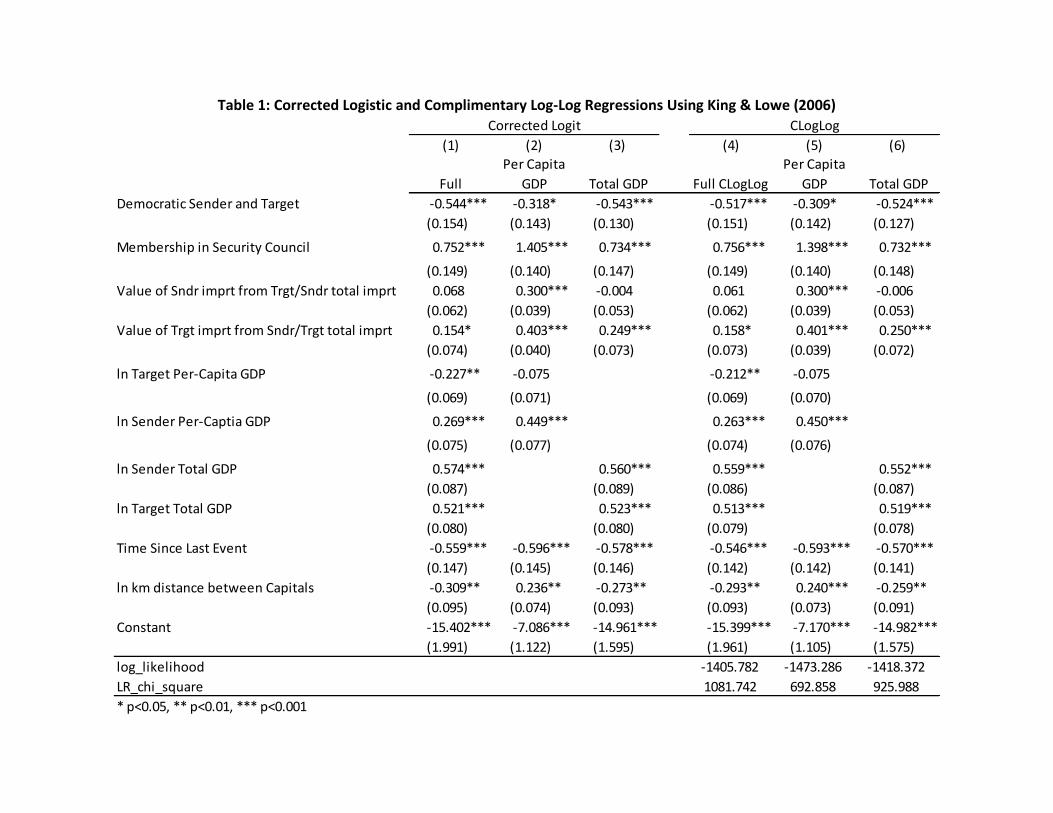
Table 1: Corrected Logistic and Complimentary Log-Log Regressions Using King & Lowe (2006)
(1) (2) (3) (4) (5) (6)
Full
Per Capita
GDP Total GDP Full CLogLog
Per Capita
GDP Total GDP
Democratic Sender and Target -0.544*** -0.318* -0.543*** -0.517*** -0.309* -0.524***
(0.154) (0.143) (0.130) (0.151) (0.142) (0.127)
Membership in Security Council 0.752*** 1.405*** 0.734*** 0.756*** 1.398*** 0.732***
(0.149) (0.140) (0.147) (0.149) (0.140) (0.148)
Value of Sndr imprt from Trgt/Sndr total imprt 0.068 0.300*** -0.004 0.061 0.300*** -0.006
(0.062) (0.039) (0.053) (0.062) (0.039) (0.053)
Value of Trgt imprt from Sndr/Trgt total imprt 0.154* 0.403*** 0.249*** 0.158* 0.401*** 0.250***
(0.074) (0.040) (0.073) (0.073) (0.039) (0.072)
ln Target Per-Capita GDP -0.227** -0.075 -0.212** -0.075
(0.069) (0.071) (0.069) (0.070)
ln Sender Per-Captia GDP 0.269*** 0.449*** 0.263*** 0.450***
(0.075) (0.077) (0.074) (0.076)
ln Sender Total GDP 0.574*** 0.560*** 0.559*** 0.552***
(0.087) (0.089) (0.086) (0.087)
ln Target Total GDP 0.521*** 0.523*** 0.513*** 0.519***
(0.080) (0.080) (0.079) (0.078)
Time Since Last Event -0.559*** -0.596*** -0.578*** -0.546*** -0.593*** -0.570***
(0.147) (0.145) (0.146) (0.142) (0.142) (0.141)
ln km distance between Capitals -0.309** 0.236** -0.273** -0.293** 0.240*** -0.259**
(0.095) (0.074) (0.093) (0.093) (0.073) (0.091)
Constant -15.402*** -7.086*** -14.961*** -15.399*** -7.170*** -14.982***
(1.991) (1.122) (1.595) (1.961) (1.105) (1.575)
log_likelihood -1405.782 -1473.286 -1418.372
LR_chi_square 1081.742 692.858 925.988
* p<0.05, ** p<0.01, *** p<0.001
Corrected Logit CLogLog
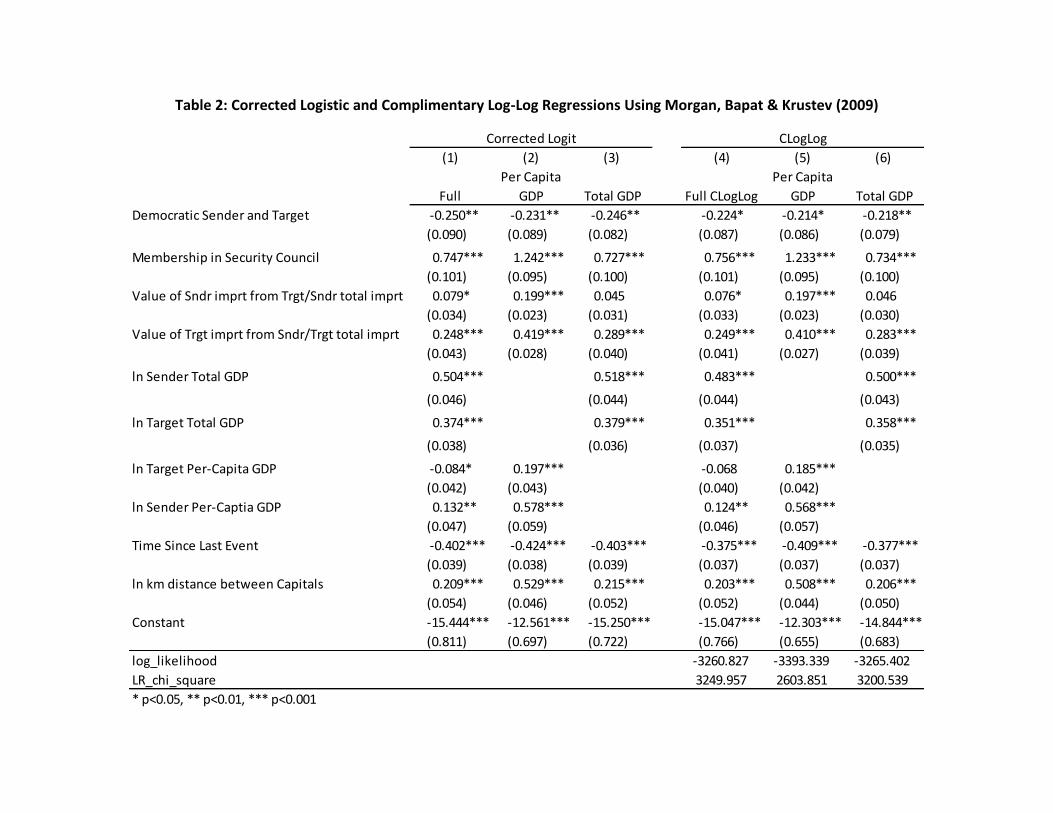
Table 2: Corrected Logistic and Complimentary Log-Log Regressions Using Morgan, Bapat & Krustev (2009)
(1) (2) (3) (4) (5) (6)
Full
Per Capita
GDP Total GDP Full CLogLog
Per Capita
GDP Total GDP
Democratic Sender and Target -0.250** -0.231** -0.246** -0.224* -0.214* -0.218**
(0.090) (0.089) (0.082) (0.087) (0.086) (0.079)
Membership in Security Council 0.747*** 1.242*** 0.727*** 0.756*** 1.233*** 0.734***
(0.101) (0.095) (0.100) (0.101) (0.095) (0.100)
Value of Sndr imprt from Trgt/Sndr total imprt 0.079* 0.199*** 0.045 0.076* 0.197*** 0.046
(0.034) (0.023) (0.031) (0.033) (0.023) (0.030)
Value of Trgt imprt from Sndr/Trgt total imprt 0.248*** 0.419*** 0.289*** 0.249*** 0.410*** 0.283***
(0.043) (0.028) (0.040) (0.041) (0.027) (0.039)
ln Sender Total GDP 0.504*** 0.518*** 0.483*** 0.500***
(0.046) (0.044) (0.044) (0.043)
ln Target Total GDP 0.374*** 0.379*** 0.351*** 0.358***
(0.038) (0.036) (0.037) (0.035)
ln Target Per-Capita GDP -0.084* 0.197*** -0.068 0.185***
(0.042) (0.043) (0.040) (0.042)
ln Sender Per-Captia GDP 0.132** 0.578*** 0.124** 0.568***
(0.047) (0.059) (0.046) (0.057)
Time Since Last Event -0.402*** -0.424*** -0.403*** -0.375*** -0.409*** -0.377***
(0.039) (0.038) (0.039) (0.037) (0.037) (0.037)
ln km distance between Capitals 0.209*** 0.529*** 0.215*** 0.203*** 0.508*** 0.206***
(0.054) (0.046) (0.052) (0.052) (0.044) (0.050)
Constant -15.444*** -12.561*** -15.250*** -15.047*** -12.303*** -14.844***
(0.811) (0.697) (0.722) (0.766) (0.655) (0.683)
log_likelihood -3260.827 -3393.339 -3265.402
LR_chi_square 3249.957 2603.851 3200.539
* p<0.05, ** p<0.01, *** p<0.001
Corrected Logit CLogLog

Table 3: Corrected Logistic and Complimentary Log-Log Regressions Using Hufbauer et al. (2007)
(1) (2)
Relogit CLogLog
Democratic Sender and Target -0.567** -0.574***
(0.175) (0.174)
Membership in Security Council 0.790*** 0.788***
(0.114) (0.114)
Value of Sndr imprt from Trgt/Sndr total imprt 0.042 0.042
(0.032) (0.032)
Value of Trgt imprt from Sndr/Trgt total imprt 0.062 0.063
(0.045) (0.045)
ln Sender Total GDP 0.531*** 0.530***
(0.054) (0.054)
ln Target Total GDP 0.055 0.054
(0.050) (0.050)
ln Target Per-Capita GDP -0.435*** -0.434***
(0.057) (0.057)
ln Sender Per-Captia GDP 0.003 0.005
(0.058) (0.058)
Time Since Last Event -0.149** -0.147**
(0.056) (0.056)
ln km distance between Capitals -0.454*** -0.452***
(0.079) (0.079)
Constant -5.314*** -5.379***
(0.918) (0.916)
log_likelihood -1923.486
LR_chi_square 451.163
* p<0.05, ** p<0.01, *** p<0.001
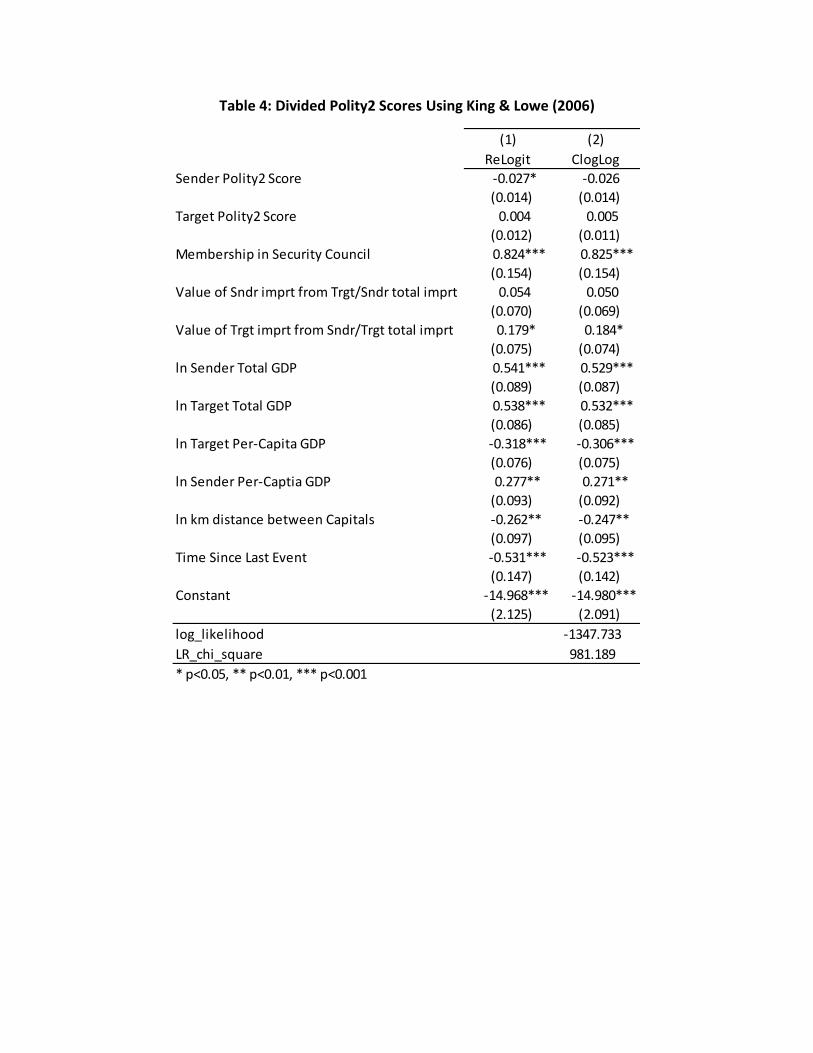
Table 4: Divided Polity2 Scores Using King & Lowe (2006)
(1) (2)
ReLogit ClogLog
Sender Polity2 Score -0.027* -0.026
(0.014) (0.014)
Target Polity2 Score 0.004 0.005
(0.012) (0.011)
Membership in Security Council 0.824*** 0.825***
(0.154) (0.154)
Value of Sndr imprt from Trgt/Sndr total imprt 0.054 0.050
(0.070) (0.069)
Value of Trgt imprt from Sndr/Trgt total imprt 0.179* 0.184*
(0.075) (0.074)
ln Sender Total GDP 0.541*** 0.529***
(0.089) (0.087)
ln Target Total GDP 0.538*** 0.532***
(0.086) (0.085)
ln Target Per-Capita GDP -0.318*** -0.306***
(0.076) (0.075)
ln Sender Per-Captia GDP 0.277** 0.271**
(0.093) (0.092)
ln km distance between Capitals -0.262** -0.247**
(0.097) (0.095)
Time Since Last Event -0.531*** -0.523***
(0.147) (0.142)
Constant -14.968*** -14.980***
(2.125) (2.091)
log_likelihood -1347.733
LR_chi_square 981.189
* p<0.05, ** p<0.01, *** p<0.001
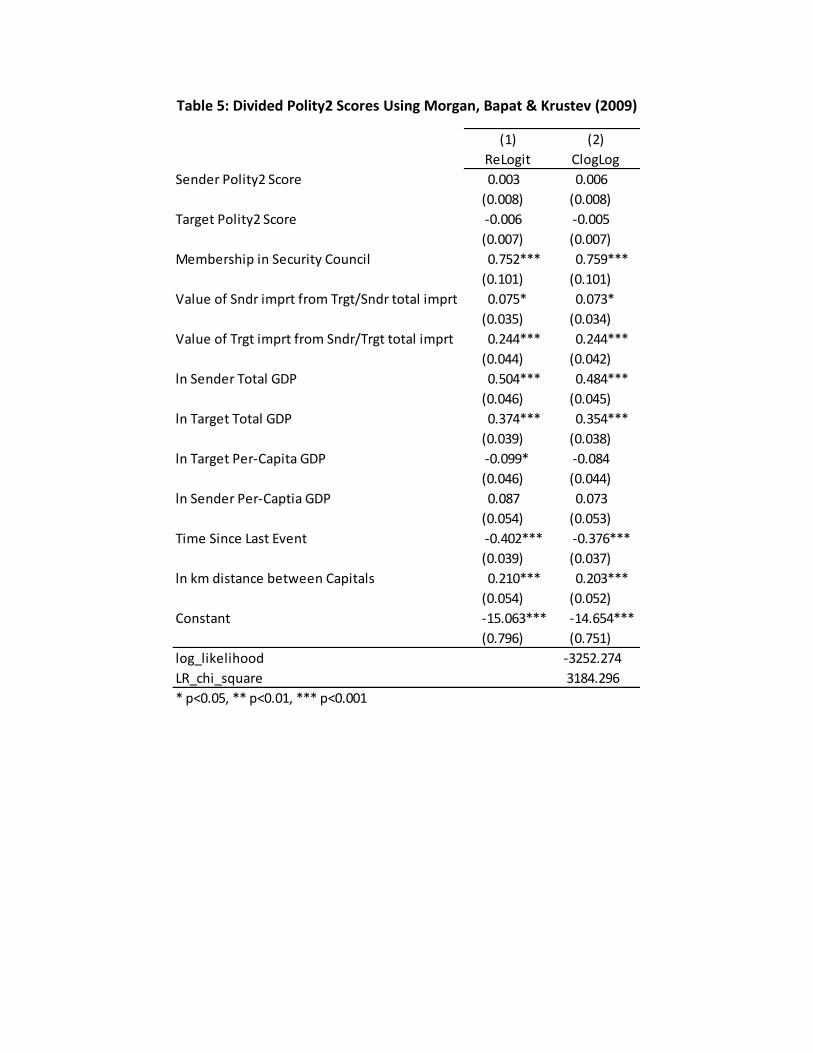
Table 5: Divided Polity2 Scores Using Morgan, Bapat & Krustev (2009)
(1) (2)
ReLogit ClogLog
Sender Polity2 Score 0.003 0.006
(0.008) (0.008)
Target Polity2 Score -0.006 -0.005
(0.007) (0.007)
Membership in Security Council 0.752*** 0.759***
(0.101) (0.101)
Value of Sndr imprt from Trgt/Sndr total imprt 0.075* 0.073*
(0.035) (0.034)
Value of Trgt imprt from Sndr/Trgt total imprt 0.244*** 0.244***
(0.044) (0.042)
ln Sender Total GDP 0.504*** 0.484***
(0.046) (0.045)
ln Target Total GDP 0.374*** 0.354***
(0.039) (0.038)
ln Target Per-Capita GDP -0.099* -0.084
(0.046) (0.044)
ln Sender Per-Captia GDP 0.087 0.073
(0.054) (0.053)
Time Since Last Event -0.402*** -0.376***
(0.039) (0.037)
ln km distance between Capitals 0.210*** 0.203***
(0.054) (0.052)
Constant -15.063*** -14.654***
(0.796) (0.751)
log_likelihood -3252.274
LR_chi_square 3184.296
* p<0.05, ** p<0.01, *** p<0.001
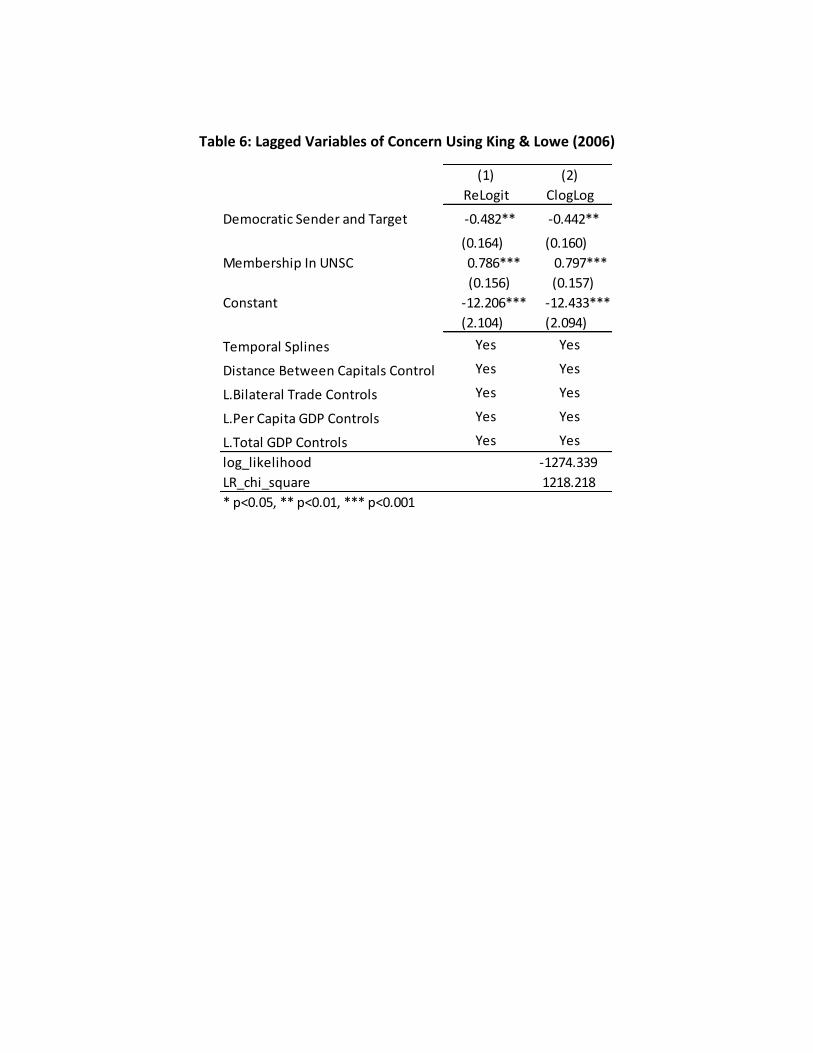
Table 6: Lagged Variables of Concern Using King & Lowe (2006)
(1) (2)
ReLogit ClogLog
Democratic Sender and Target -0.482** -0.442**
(0.164) (0.160)
Membership In UNSC 0.786*** 0.797***
(0.156) (0.157)
Constant -12.206*** -12.433***
(2.104) (2.094)
Temporal Splines Yes Yes
Distance Between Capitals Control Yes Yes
L.Bilateral Trade Controls Yes Yes
L.Per Capita GDP Controls Yes Yes
L.Total GDP Controls Yes Yes
log_likelihood -1274.339
LR_chi_square 1218.218
* p<0.05, ** p<0.01, *** p<0.001

Table 7: Lagged Variables of Concern Using Morgan, Bapat & Krustev (2009)
(1) (2)
Relogit Cloglog
Democratic Sender and Target -0.252** -0.225*
(0.092) (0.088)
Membership In UNSC 0.716*** 0.725***
(0.103) (0.103)
Constant -14.004*** -13.697***
(0.866) (0.821)
Temporal Splines Yes Yes
Distance Between Capitals Control Yes Yes
L.Bilateral Trade Controls Yes Yes
L.Per Capita GDP Controls Yes Yes
L.Total GDP Controls Yes Yes
LR_chi_square 3521.201
* p<0.05, ** p<0.01, *** p<0.001

Table 8: First Sanction Event Dependent Variable Using King & Lowe (2006)
(1) (2)
Cloglog Relogit
Democratic Sender and Target -0.400* -0.417*
(0.168) (0.170)
Membership In UNSC 0.720*** 0.718***
(0.158) (0.159)
Constant -14.239*** -14.200***
(2.103) (2.119)
Temporal Splines Yes Yes
Bilateral Trade Controls Yes Yes
Distance Between Capitals Control Yes Yes
Per Capita GDP Controls Yes Yes
Total GDP Controls Yes Yes
log_likelihood -1266.297
LR_chi_square 820.971
* p<0.05, ** p<0.01, *** p<0.001

Table 9: First Sanction Event Dependent Variable Using Morgan, Bapat & Krustev (2009)
(1) (2)
Cloglog Relogit
Democratic Sender and Target -0.209* -0.223*
(0.098) (0.099)
Membership In UNSC 0.757*** 0.754***
(0.107) (0.107)
Constant -14.396*** -14.512***
(0.889) (0.908)
Temporal Splines Yes Yes
Bilateral Trade Controls Yes Yes
Distance Between Capitals Control Yes Yes
Per Capita GDP Controls Yes Yes
Total GDP Controls Yes Yes
log_likelihood -3049.383
LR_chi_square 1914.927
* p<0.05, ** p<0.01, *** p<0.001
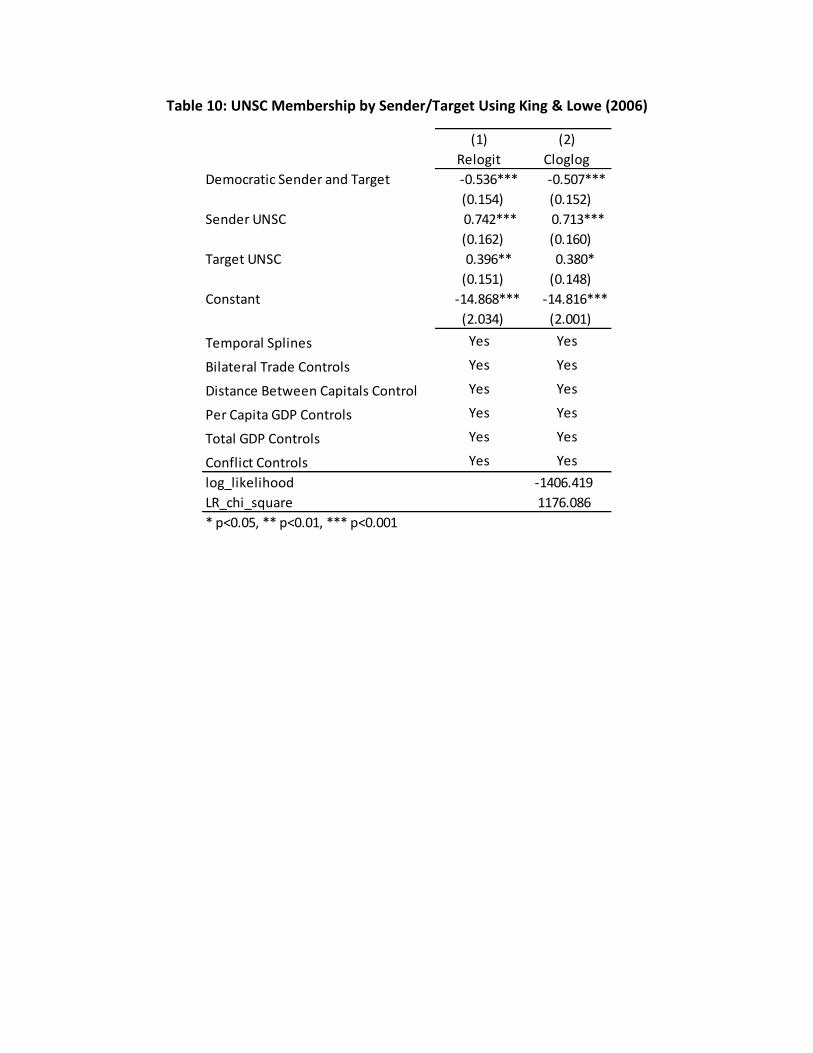
Table 10: UNSC Membership by Sender/Target Using King & Lowe (2006)
(1) (2)
Relogit Cloglog
Democratic Sender and Target -0.536*** -0.507***
(0.154) (0.152)
Sender UNSC 0.742*** 0.713***
(0.162) (0.160)
Target UNSC 0.396** 0.380*
(0.151) (0.148)
Constant -14.868*** -14.816***
(2.034) (2.001)
Temporal Splines Yes Yes
Bilateral Trade Controls Yes Yes
Distance Between Capitals Control Yes Yes
Per Capita GDP Controls Yes Yes
Total GDP Controls Yes Yes
Conflict Controls Yes Yes
log_likelihood -1406.419
LR_chi_square 1176.086
* p<0.05, ** p<0.01, *** p<0.001
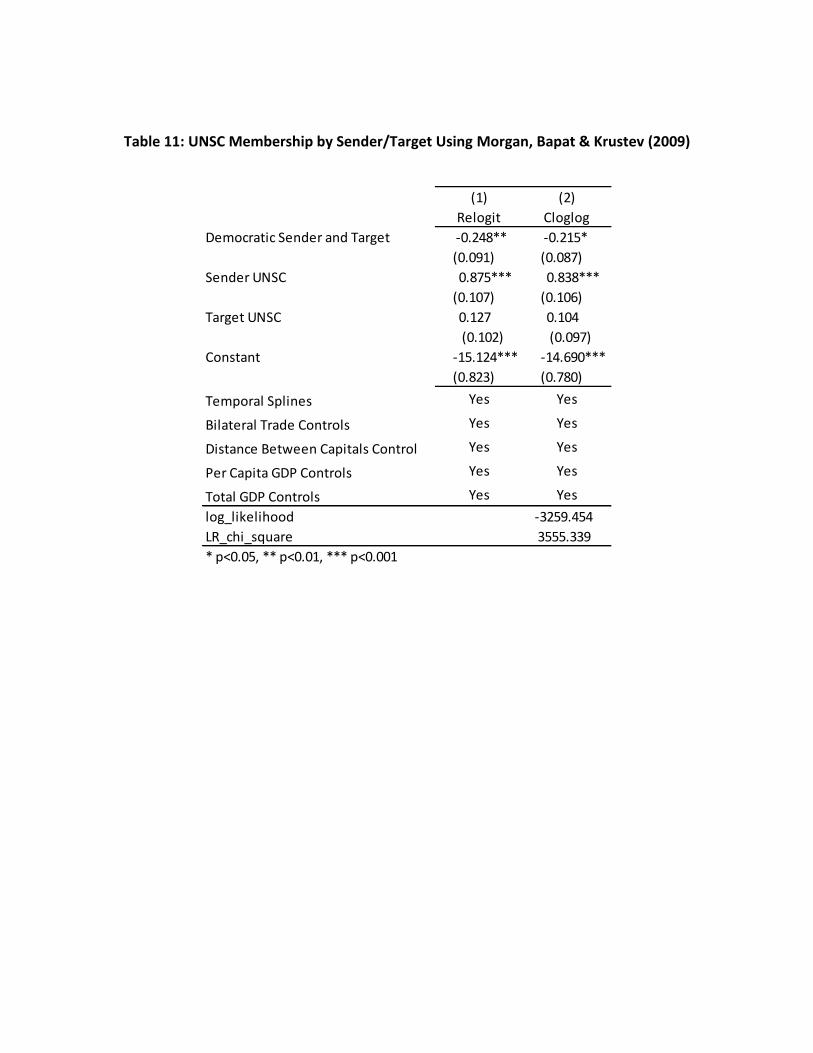
Table 11: UNSC Membership by Sender/Target Using Morgan, Bapat & Krustev (2009)
(1) (2)
Relogit Cloglog
Democratic Sender and Target -0.248** -0.215*
(0.091) (0.087)
Sender UNSC 0.875*** 0.838***
(0.107) (0.106)
Target UNSC 0.127 0.104
(0.102) (0.097)
Constant -15.124*** -14.690***
(0.823) (0.780)
Temporal Splines Yes Yes
Bilateral Trade Controls Yes Yes
Distance Between Capitals Control Yes Yes
Per Capita GDP Controls Yes Yes
Total GDP Controls Yes Yes
log_likelihood -3259.454
LR_chi_square 3555.339
* p<0.05, ** p<0.01, *** p<0.001

7 Bibliography
Alan Heston, R. S. (2011, June). Penn World Table Version 7.0. Retrieved from Center for International
Comparisons of Production, Income and Prices at the University of Pennsylvania.
Allen, S. H. (2008). The Domestic Political Costs of Economic Sanctions. The Journal of Conflict
Resolution, 916-944.
Askari, H., Forrer, J., Yang, J., & Hachem, T. (2005). Measuring Vulnerability to U.S. Foreign Economic
Sanctions. Business Economics, 41-55.
Baldwin, D. (1985). Economic Statecraft. Princeton, NJ: Princeton University Press.
Barber, J. (1979). Economic Sanctions as a Policy Instrument. International Affairs, 367-384.
Barbieri, K., & Keshk, O. (2012, October 10). International Trade, 1870-2009 (v3.0). Retrieved from
Correlates of War: http://www.correlatesofwar.org/COW2%20Data/Trade/Trade.html
Beck, N., Katz, J. N., & Tucker, R. (1998). Taking Time Seriously: Time-Series-Cross-Section Analysis with a
Binary Dependent Variable. American Journal of Political Science, 1260-1288.
Center for International Comparisons of Production, Income and Prices . (2012, October 10). Penn World
Tables. Philadelphia, PA, USA.
Chan, S. a. (2000). Sanctions as Economic Statecraft: Theory and Practice. London: Macmillan.
Chernoff, F. (2004). The Study of the Democratic Peace and Progress in International Relations.
International Studies Review, 49-78.
Cortright, D. a. (1995). Economic Sanctions: Panacea or Peacebuilding in a Post-Cold War World?
Boulder: Westview Press.
Cortright, D. a. (2000). The Sanctions Decade: Assessing UN Strategies in the 1990s. Boulder: Lynne
Rienner.
Cortright, D. a. (2002). Sanctions and the Search for Security: Challenges to UN Action. Boulder: Lynne
Rienner.
Cox, D. G., & Drury, A. C. (2006). Democratic Sanctions: Connecting the Democratic Peace and Economic
Sanctions. Journal of Peace Research.
Crawford, B. (1993). Economic Vulnerability in International Relations: East-West Trade, Investment and
Finance. New York: Columbia University Press.
Dashti-Gibson, J. P. (1997). On the Determinants of the Success of Economic Sanctions: an Empirical
Analysis. American Journal of Political Science, 608-618.
Deese, D. (1983). The Vulnerability of Modern Nations: Economic Diplomacy in East-West Relations. In e.
M. Nincic and P. Wallensteen, Dilemmas of Economic Coercion: Sanctions in World Politics (pp.
155-182). New York: Praeger.
Doxey, M. P. (1980). Economic Sanctions and International Enforcement. London: Oxford University
Press.
Doxey, M. P. (1980). International Sanctions in Contemporary Perspective. London: Oxford University
Press.
Drezner, D. (1997). Allies, Adversaries, and Economic Coercion: Russian Foreign Economics Policy since
1991. Security Studies, 65-111.
Drezner, D. (1999). Conflict Expectations and the Paradox of Economic Coercion. International Studies
Quarterly, 709-731.
Drezner, D. (1999). The Sanctions Paradox: Economic Statecraft and International Relations. Cambridge,
UK: Cambridge University Press.
Drury, A. C. (2001). Sanctions as Coercive Diplomacy: The U.S. President’s Decision to Initiate Economic
Sanctions. Political Research Quarterly, 485-508.
Galtung, J. (1967). On the Effects of International Economic Sanctions, with Examples from the Case of
Rhodesia. World Politics, 378-416.
Gary Clyde Hufbauer, J. S. (1985). Economic Sanctions Reconsidered: History and Current Policy.
Washington D.C.: Institute for International Economics.
George, A. (1993). Bridging the Gap: Theory and Practice in Foreign Policy. Washington, DC: United
States Institute for Peace.
Gleditsch, K. S. (2012, October 10). Distance Between Capital Cities. Retrieved from essex.ac.uk:
http://privatewww.essex.ac.uk/~ksg/data-5.html
Gleditsch, K. S., Harbom, L., Strand, H., Nygård, H. M., Wallensteen, P., Heldt, B., . . . Eriksson, M. (2009,
October 10). UCDP/PRIO Armed Conflict Dataset. Retrieved from PRIO Network:
http://www.prio.no/CSCW/Datasets/Armed-Conflict/UCDP-PRIO/
Green, J. (1983). Strategies for Evading Economic Sanctions. In M. a. Nincic, Dilemmas of Economic
Coercion: Sanctions in World Politics (pp. 61-85). New York: Praeger.
Hufbauer, G. &. (1985). Economic Sanctions Reconsidered History and Current Policy. Washington, DC:
Institute for International Economics.
Hufbauer, G., & Elliott, J. S. (1990). Economic Sanctions Reconsidered: Supplemental Case Histories.
Washington, DC: Institute for International Economics.
Hufbauer, G., Schott, J., & Elliott, K. A. (2007). Economic Sanctions Reconsidered. Washington, DC:
Institute for International Economics.
Imbens, G. (1992). An Efficient Method of Moments Estimator for Discrete Choice Models with Choice-
Based. Econometrica, 1187–1214.
Kaempfer, W. H. (1987). Divestment, Investment Sanctions, and Disinvestment: An Evaluation of Anti-
Apartheid Policy Instruments. International Organization, 457-73.
Kaempfer, W., & Lowenberg, A. (1992). International Economic Sanctions: A Public Choice Perspective.
Boulder: Westview Press.
King, G., & Lowe, W. (2006, October 10). 10 Million International Dyadic Events. Retrieved from
gking.harvard.edu:
http://gking.harvard.edu/data?dvn_subpage=/faces/study/StudyPage.xhtml?globalId=hdl:1902.
1/FYXLAWZRIA
King, G., & Zeng, L. (2001). Logistic Regression in Rare Events Data. Society for Political Methodology.
Kinsella, D. (2005). No Rest for the Democratic Peace. American Political Science Review.
Kirshner, J. (1997). The Microfoundations of Economic Sanctions. Security Studies, 32–64.
Knorr, K. (1975). The Power of Nations: The Political Economy of International Relations. New York: Basic
Books.
Lektzian, D., & Souva, M. (2007). An Institutional Theory of Sanctions Onset and Success. Journal of
Conflict Resolution, 848-869.
Li, C.-p. (1993). The Effectiveness of Sanction Linkages: Issues and Actors. International Studies
Quarterly, 349-370.
Losman, D. L. (1979). International Economic Sanctions: The Cases of Cuba, Israel, and Rhodesia.
Albuquerque: University of New Mexico Press.
Lundborg, P. (1987). The Economics of Export Embargoes: The Case of the US-Soviet Grain Suspension.
London: Croom Helm.
Maoz, Z., & Russett, B. (1993). Normative and Structural Causes of Democratic Peace. The American
Political Science Review, 624-638.
Marshall, M. G., Jaggers, K., & Gurr, T. R. (2010, October 10). Polity IV Project. Retrieved from Center for
Systemic Peace: http://www.systemicpeace.org/inscr/inscr.htm

Martin, L. L. (1992). Coercive Cooperation: Explaining Multilateral Economic Sanctions. Princeton, NJ:
Princeton University Press.
Morgan, C., Krustev, V., & Bapat, N. (2009, October 10). Data Page. Retrieved from Threat and
Imposition of Sanctions: http://www.unc.edu/~bapat/TIES.htm
Morgan, T. C. (1995). Clinton's Chinese Puzzle: Domestic Politics and the Effectiveness of Economic
Sanctions. Issues and Studies, 19-45.
Morgan, T. C. (1997). Fools Suffer Gladly: The Use of Economic Sanctions in International Crises.
International Studies Quarterly, 27-50.
Nincic, M. &. (1983). Dilemmas of Economic Coercion: Sanctions in World Politics. New York: Praeger.
Nossal, K. R. (1989). International Sanctions as International Punishment. International Organization,
301-322.
Olson, R. S. (1979). Economic Coercion in World Politics: With a Focus on North-South Relations. World
Politics, 471-494.
Pape, R. A. (1997). Why Economic Sanctions Do Not Work. The MIT Press, 90-136.
Petrescu, I. M. (2007). The Humanitarian Impact of Economic Sanctions. Job Market Paper, 1-25.
Poeter, R. C. (1979). International Trade and Investment Sanctions: Potential Impact on the South
African Economy. Journal of Conflict Resolution, 579-612.
Rodman, K. A. (1995). Sanctions at Bay? Hegemonic Decline, Multinational Corporations, and the US
Economic Sanctions Since the Pipeline Case. International Organization, 105-138.
Rousseau, D. L. (2005). Democracy and War: Institutions, Norms, and the Evolution of International
Conflict. Stanford, CA: Stanford University Press.
Russett, B., Layne, C., Spiro, D. E., & Doyle, M. W. (1995). The Democratic Peace. International Security,
164-184.

8 Appendix
Afghanistan Germany Norway
Albania Ghana Oman
Algeria Greece Pakistan
Andorra Grenada Palau
Angola Guatemala Panama
Antigua & Barbuda Guinea Papua New Guinea
Argentina Guinea-Bissau Paraguay
Armenia Guyana Peru
Australia Haiti Philippines
Austria Honduras Poland
Azerbaijan Hong Kong Portugal
Bahamas Hungary Qatar
Bahrain Iceland Romania
Bangladesh India Russia
Barbados Indonesia Rwanda
Belarus Iran Samoa
Belgium Iraq San Marino
Belize Ireland Sao Tome and Principe
Benin Israel Saudi Arabia
Bhutan Italy Senegal
Bolivia Ivory Coast Seychelles
Bosnia and Herzegovina Jamaica Sierra Leone
Botswana Japan Singapore
Brazil Jordan Slovakia
Brunei Kazakhstan Slovenia
Bulgaria Kenya Solomon Islands
Burkina Faso Kiribati Somalia
Burundi Kuwait South Africa
Cambodia Kyrgyzstan South Korea
Cameroon Laos Spain
Canada Latvia Sri Lanka
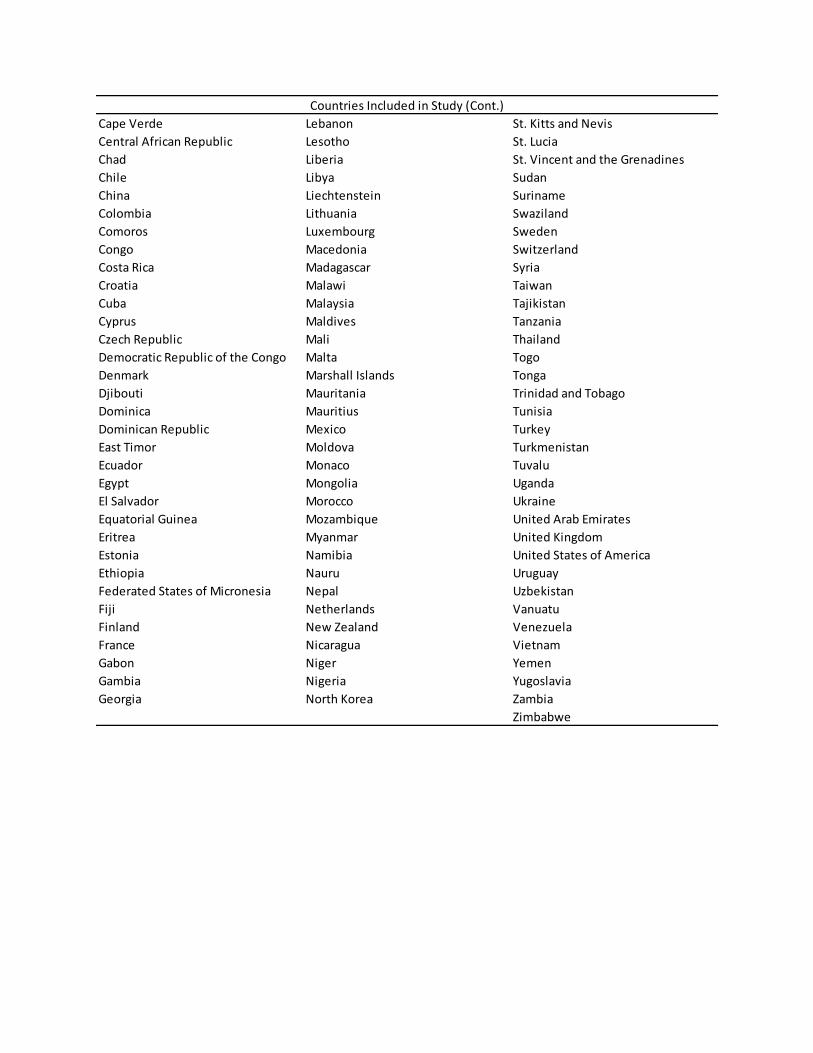
Countries Included in Study
Cape Verde Lebanon St. Kitts and Nevis
Central African Republic Lesotho St. Lucia
Chad Liberia St. Vincent and the Grenadines
Chile Libya Sudan
China Liechtenstein Suriname
Colombia Lithuania Swaziland
Comoros Luxembourg Sweden
Congo Macedonia Switzerland
Costa Rica Madagascar Syria
Croatia Malawi Taiwan
Cuba Malaysia Tajikistan
Cyprus Maldives Tanzania
Czech Republic Mali Thailand
Democratic Republic of the Congo Malta Togo
Denmark Marshall Islands Tonga
Djibouti Mauritania Trinidad and Tobago
Dominica Mauritius Tunisia
Dominican Republic Mexico Turkey
East Timor Moldova Turkmenistan
Ecuador Monaco Tuvalu
Egypt Mongolia Uganda
El Salvador Morocco Ukraine
Equatorial Guinea Mozambique United Arab Emirates
Eritrea Myanmar United Kingdom
Estonia Namibia United States of America
Ethiopia Nauru Uruguay
Federated States of Micronesia Nepal Uzbekistan
Fiji Netherlands Vanuatu
Finland New Zealand Venezuela
France Nicaragua Vietnam
Gabon Niger Yemen
Gambia Nigeria Yugoslavia
Georgia North Korea Zambia
Zimbabwe
Countries Included in Study (Cont.)