predicted climate change and its impact on agriculture in malaysia
TRANSCRIPT
Predicted climate change and its impact on agriculture in Predicted climate change and its impact on agriculture in MalaysiaMalaysia

MALAYSIA’S CLIMATEMALAYSIA’S CLIMATE
Malaysia has a tropical climate: hot and humid General characteristics
uniform air temperature high humidity high and heavy rainfall low wind speed cloudy
rarely clear skies even during drought periods

INCREASING CLIMATE VARIABILITY AND CHANGE: Reducing the Vulnerability of Agriculture and Forestry; Edited byJames Salinger, M.V.K. Sivakumar, and Raymond P. Motha; Springer, Netherlands, 2005

Köppen Climate Classification SystemKöppen Climate Classification System
5 climate regions A - Tropical Moist Climates: all months have average
temperatures above 18° Celsius B - Dry Climates: with deficient precipitation during
most of the year C - Moist Mid-latitude Climates with Mild Winters D - Moist Mid-Latitude Climates with Cold Winters E - Polar Climates: with extremely cold winters and
summers

Mean annual cloud cover (1983-2008)
International Satellite Cloud Climatology Project (ISCCP) http://isccp.giss.nasa.gov Rossow, W.B., and Schiffer, R.A., 1999: Advances in Understanding Clouds from ISCCP. Bull. Amer. Meteor. Soc., 80, 2261-2288.

http://www.scilogs.eu/en/blog/spacetimedreamer/2009-06-15/the-sunniest-and-darkest-places-on-earth
Mean for whole Earth = 240 Wm-2 per day

Monthly relative humidty (RH) mean monthly 70 to 90% difference between mean monthly min. and max. RH
about 3-15% usually min. RH in Jan-Feb
except east coast Kelatan and Terengganu, min RH during March
usually max. RH in Nov in Peninsular, average 84% in Feb. and 88% in Nov.
but Northwest states in Peninsular: 72% in Feb. and 87% in Nov

Daily RH Northwest states also has the highest diurnal variation
in RH in dry months, min daily RH can be 42% in wet months min daily RH can be as high as 70% max daily RH does not vary much from place to place
never below 94% RH

Annual air temperature Being near the equator, Malaysia has a uniform
temperature throughout the year annual variation less than 2 C except for the east
coast areas in Peninsular Malaysia which are affected by cold winds from Siberia during the northeast monsoon (< 3 C variation)
Daily air temperature typically varies between 20-30 C
5-10 C variation in coastal areas 8-12 C variation in inland areas very rarely above 38 C

Monthly air temperature Apr-May have the highest monthly air temperature Dec-Jan the lowest air temperature

Wind has four seasons: southwest monsoon, northeast monsoon, and two other shorter intermonsoon seasons southwest monsoon
May/June to Sept. < 15 knots (note 1 knot = 0.5 m s-1)
northeast monsoon Nov to March 10-20 knots may reach 30 knots in east coast areas in
Peninsular Malaysia cold winds from Siberia
Apr-Nov, typhoon in neighbouring countries, may bring strong winds to Sabah and Sarawak (>20 knots)

Rainfall 2500 mm mean annual rainfall (note: 1 mm = 1 L or 1
kg of water in 1 m2) affected by wind flow (monsoons) and topographic
features Seasonal rainfall in Peninsular Malaysia
A) East coast Nov-Jan: wettest & June-July: driest
B) Southwest areas Oct-Nov: wettest & Feb: driest
C) The rest 2 periods of maximum (Oct-Nov and Apr-May) and
2 periods of minimum (Jan-Feb and Jun-July) rainfall

Seasonal rainfall in Sabah and Sarawak A) Coastal Sarawak and northeast Sabah
Jan: wettest June/July is the driest in Sarawak but April in
Sabah Dec-Mar is the main source of rain for west
Sarawak B) Inland Sarawak
evenly distributed rain, slightly lower in Jun-Aug. hill slopes in inland Sarawak has the highest
rainfall in Malaysia (e.g., Long Akah has >5000 mm annual rain)

C) Northwest coast Sabah 2 periods of maximum (Oct and June) and 2
periods of minimum (Feb and Aug) rainfall D) Central Sabah
hilly and sheltered areas low rainfall and evenly distributed with less distinct
2 periods of maximum (May and Oct) and 2 periods of minimum (Feb and Aug) rainfall
E) Southern Sabah evenly distributed rain amount of rain received is like Central Sabah, but
Feb-Apr is slightly drier than the rest of the year

Sunshine and solar radiation average 6 hours of sunshine (>120 W m-2) per day Alor Setar and Kota Bharu
avg. 7 hours per day but 8.7 hours per day in Jan
Kuching avg. 5 hours per day but 3.7 hours per day in Jan
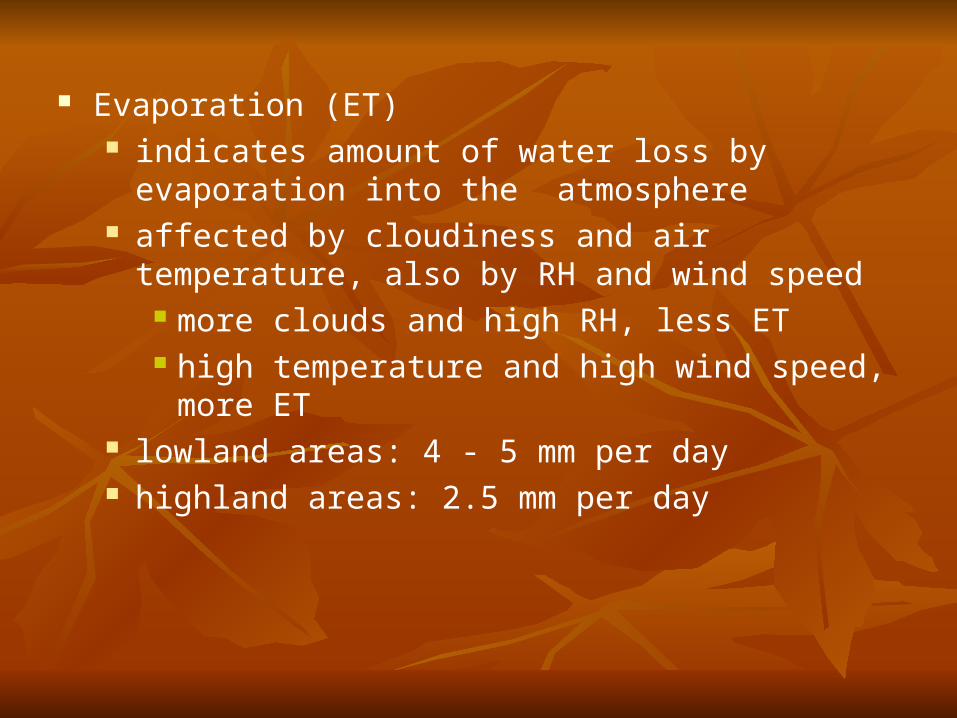
Evaporation (ET) indicates amount of water loss by evaporation into the
atmosphere affected by cloudiness and air temperature, also by
RH and wind speed more clouds and high RH, less ET high temperature and high wind speed, more ET
lowland areas: 4 - 5 mm per day highland areas: 2.5 mm per day

Trends in climate change in MalaysiaTrends in climate change in Malaysia
Temperature records in Malaysia in the last 50 years have shown warming trends
But insufficient data to determine whether the frequency of extreme events (e.g., drought, storms and floods) has indeed increased
Balanced scorecard for natural disaster management projects; Tun Lin Moe, Fritz Gehbauer and Stefan Senitz; Disaster Prevention and Management; Vol. 16 No. 5, 2007; 785-806

A total of 19 natural disasters in Malaysia (1968-2004)About one natural disaster every 2 years
Disaster types in Malaysia: an overview; Ibrahim Mohamed Shaluf, Fakhru'l-Razi Ahmadun; Disaster Prevention and Management Volume: 15 Issue: 2, 2006, 286-298
Landslide

Mean increase per decade = +0.18 C
Linear Regression Line
INCREASING CLIMATE VARIABILITY AND CHANGE: Reducing the Vulnerability of Agriculture and Forestry; Edited byJames Salinger, M.V.K. Sivakumar, and Raymond P. Motha; Springer, Netherlands, 2005

INCREASING CLIMATE VARIABILITY AND CHANGE: Reducing the Vulnerability of Agriculture and Forestry; Edited byJames Salinger, M.V.K. Sivakumar, and Raymond P. Motha; Springer, Netherlands, 2005

Climate Change Scenarios for Malaysia 2001-2099. Scientific Report; Malaysian Meteorological Dept. (2009)

Climate Change Scenarios for Malaysia 2001-2099. Scientific Report; Malaysian Meteorological Dept. (2009)

GLOBAL* MALAYSIA**
2050 2100 2050
Surface temperature (ºC)
1.61.6 2.82.8 1.51.5
Sea level rise (m) 0.21 to 0.21 to 0.480.48
--
Annual Rainfall +10% (Kelantan, Terengganu +10% (Kelantan, Terengganu & Pahang)& Pahang)
-5% (Selangor & Johor)-5% (Selangor & Johor)
* IPCC WG1 4TH ASESSMENT REPORT (AR4), 2007** STUDY ON IMPACT OF CLIMATE CHANGE ON HYDROLOGIC REGIME AND WATER RESOURCES OF PENISULAR MALAYSIA, NAHRIM, 2006NAHRIM (National Hydraulic Research Institute of Malaysia)

Region Mean monthly precipitation (mm)
Current 2025-2050
West Coast 179 176
Klang Valley 190 182
Selangor 190 181
Johor 187 180
Terengganu 289 299
Kelantan 222 240
Pahang 199 208
Perak 193 199
Kedah 174 177
Southern Peninsula 194 196
N. East Coast 260 282
Predicted monthly rainfall in Peninsular MalaysiaPredicted monthly rainfall in Peninsular Malaysia
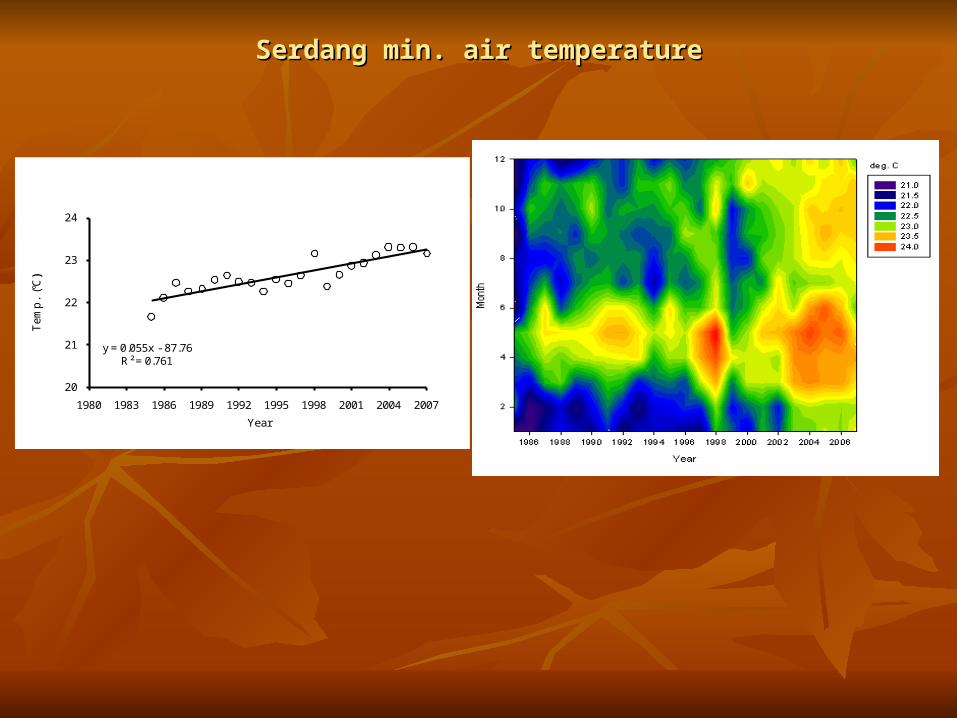
Serdang min. air temperatureSerdang min. air temperature
y = 0.055x - 87.76R² = 0.761
20
21
22
23
24
1980 1983 1986 1989 1992 1995 1998 2001 2004 2007
Tem
p.
(°C
)
Year

Serdang max. air temperatureSerdang max. air temperature
y = 0.043x - 53.14R² = 0.446
30
31
32
33
34
35
1980 1983 1986 1989 1992 1995 1998 2001 2004 2007
Tem
p. (
°C
)
Year

Serdang rainfallSerdang rainfall
y = 21.51x - 40498R² = 0.277
0
500
1000
1500
2000
2500
3000
3500
1980 1983 1986 1989 1992 1995 1998 2001 2004 2007 2010
To
tal R
ain
fall (m
m)
Year

Serdang wind speedSerdang wind speed
y = -0.013x + 28.07R² = 0.635
0
0.4
0.8
1.2
1980 1985 1990 1995 2000 2005 2010
Win
d s
peed
(m
s-1)
Year

Serdang sunshine hourSerdang sunshine hour
y = 0.032x - 59.17R² = 0.354
0
2
4
6
8
1980 1983 1986 1989 1992 1995 1998 2001 2004 2007
Sun
sh
ine h
our (h
)
Year

Generally, crop yields in Malaysia would increase in higher CO2 concentrations, lower air temperatures,
higher wind speeds, lower humidity more sunshine hours (or less clouds)
greater solar radiation, greater energy for photosynthesis
lower air pollutants more rainfall
in normally dry areas, but may increase pests and diseases incidences
or less rainfall in normally wet areas
But these above factors interact with each other to affect yields so what is the net effect of climate change on yields?

Yield in ton/ha/yr
Effect of climate change on rubberEffect of climate change on rubber
INCREASING CLIMATE VARIABILITY AND CHANGE: Reducing the Vulnerability of Agriculture and Forestry; Edited byJames Salinger, M.V.K. Sivakumar, and Raymond P. Motha; Springer, Netherlands, 2005

Rubber flourishes in a tropical climate with a high mean daily air temperature of 25-28 C high rainfall exceeding 2000 mm per year even distribution of rainfall with no dry seasons
exceeding one month at least 2100 h of sunshine per year
5.75 h per day

If the mean daily air temperature increases by 4.5 C above the mean annual temperature, more dry months and hence more moisture stress can occur
A crop decrease of 3–15% due to drought conditions is projected if mean annual temperature increases to 31 C
The degree of yield decrease will be dependent on clonal susceptibility, as well as the length and severity of the drought
Some states may experience a reduction in production. It is projected that 273,000 ha of land, or 15% of
current rubber land, may be affected

If rainfall increases, loss of tapping days and crop washout occur Yield losses can range from 13 to 30%
If sea level rises by 1 m, low-lying areas may be flooded and rubber cultivation would not be possible in these areas

Yield in ton/ha/yr
Effect of climate change on oil palmEffect of climate change on oil palm
INCREASING CLIMATE VARIABILITY AND CHANGE: Reducing the Vulnerability of Agriculture and Forestry; Edited byJames Salinger, M.V.K. Sivakumar, and Raymond P. Motha; Springer, Netherlands, 2005

Oil palm is best suited to a humid tropical climate in which rain occurs mostly at night and days are bright and
sunny minimum monthly rainfall is around 1500 mm with
absence of dry seasons an evenly distributed sunshine exceeding 2000 h per
year A mean maximum temperature of about 29–33 C and a
mean minimum temperature of 22–24 C favor the highest bunch production

A high mean annual temperature of 28–31 C is favorable for high production
If these higher temperatures lead to drought conditions, however, an estimated 208,000 ha of land or 12% of the present oil palm areas would be considered marginal-to-unsuitable for oil palm cultivation, particularly in drought-prone areas
Increased rainfall favors oil palm productivity unless it leads to flooding
With an anticipated sea level rise of 1 m, an estimated 100,000 ha of area, currently planted with oil palm, may be deemed unsuitable and would have to be abandoned

Yield in ton/ha/yr
Effect of climate change on cocoaEffect of climate change on cocoa
INCREASING CLIMATE VARIABILITY AND CHANGE: Reducing the Vulnerability of Agriculture and Forestry; Edited byJames Salinger, M.V.K. Sivakumar, and Raymond P. Motha; Springer, Netherlands, 2005

Cocoa is planted in areas where annual rainfall is in the range of 1250–2800 mm
Cocoa prefers areas where annual rainfall is in the range of 1500–2000 mm and the number of dry months is three or less
It should not be planted in areas with annual rainfall below 1250 mm, unless irrigation is provided
Areas with annual rainfall exceeding 2500 mm are also not favorable as it reduces yield by 10–20% due to water logging excessive rainfall causes high disease incidence,
especially Phytophthora and pink diseases

Temperatures exceeding 32 C may result in moisture stress, leading to yield loss of 10–20%
Based on these considerations, the states that experience a distinct dry season are marginal areas for cocoa cultivation Irrigation is required in these areas if cocoa is to be
cultivated Some areas, which register high rainfall, are not suited
for cocoa cultivation due to the high incidence of diseases This can result in yield loss of more than 20%

With climate change, a high incidence of drought is expected to reduce yield
On the other hand, excessive rainfall with reduced insolation can also result in low yields under such wet conditions, a high incidence of fungal
diseases such as vascular streak disease and black pod can depress yields

Yield in ton/ha/yr
Effect of climate change on riceEffect of climate change on rice
INCREASING CLIMATE VARIABILITY AND CHANGE: Reducing the Vulnerability of Agriculture and Forestry; Edited byJames Salinger, M.V.K. Sivakumar, and Raymond P. Motha; Springer, Netherlands, 2005

Rice constitutes 98% of total cereal production in Malaysia
Generally, long periods of sunshine are favorable for high rice yields
Growth is optimal when the daily air temperature is between 24 and 36 C. The difference between day and night temperatures must be minimal during flowering and grain production

Grain yields may decline by 9–10% for each 1 C rise in temperature
If drought conditions are prolonged, the current flooded rice ecosystem can not be sustained. It may be necessary to develop non-flooded and dry land rice ecosystem to increase the level of national rice sufficiency a threat to national food security

World’s ten largest producer of rice in 2008:
1. China (193.4 mil ton)
2. India (148.3 mil ton)
3. Indonesia (60.3 mil ton)
4. Bangladesh (46.9 mil ton)
5. Viet Nam (38.7 mil ton)
6. Myanmar (30.5 mil ton)
7. Thailand (30.5 mil ton)
8. Philippines (16.8 mil ton)
9. Brazil (12.1 mil ton)
10. Japan (11.0 mil ton)
…
25. Malaysia (2.4 mil ton)
50% of world’s rice
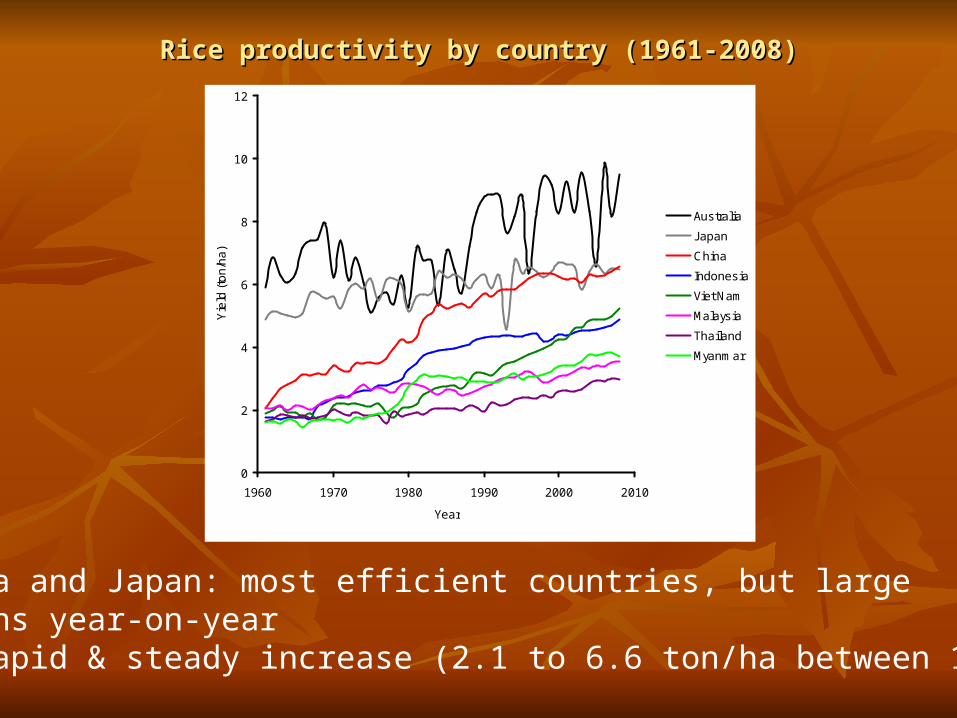
Rice productivity by country (1961-2008)Rice productivity by country (1961-2008)
0
2
4
6
8
10
12
1960 1970 1980 1990 2000 2010
Year
Yie
ld (
ton
/ha
)Australia
Japan
China
Indonesia
Viet Nam
Malaysia
Thailand
Myanmar
Australia and Japan: most efficient countries, but largevariations year-on-yearChina: rapid & steady increase (2.1 to 6.6 ton/ha between 1961-2008)

Average rice productivity (2000-2008)Average rice productivity (2000-2008)
8.7
6.4 6.3
4.7 4.6
3.7 3.6 3.5 3.5 3.3 3.3 3.1 3.12.8
2.3
0
1
2
3
4
5
6
7
8
9
10
Yie
ld (
ton/
ha)
Average Rice Productivity by Country (2000-2008)

Malaysia rice statisticsMalaysia rice statistics
2008:0.67 mil. ha
2008:2.5 mil. ton+28,300 tonper year
2008:3.6 ton/ha+0.04 ton/haper year
2008:86.0 kg/capita-1.0 kg/capitaper year
est. 2015
est. 2015
est. 2015
0
0.1
0.2
0.3
0.4
0.5
0.6
0.7
0.8
0.9
1960 1970 1980 1990 2000 2010 2020
mil.
ha
Year
Malaysia Rice Land Area
needed to obtain 100% in rice self-sufficiency
assuming no change in land area by 2015
0.0
0.5
1.0
1.5
2.0
2.5
3.0
3.5
4.0
1960 1970 1980 1990 2000 2010 2020
ton/
ha
Year
Malaysia Rice Yield Productivity
0.0
0.5
1.0
1.5
2.0
2.5
3.0
1960 1970 1980 1990 2000 2010 2020
mil.
ton
Year
Malaysia Rice Yield
0
20
40
60
80
100
120
140
160
180
200
1960 1970 1980 1990 2000 2010 2020
kg p
er ca
pita
Year
Malaysia Rice Yield Per Capita

Malaysia self-sufficiency levelsMalaysia self-sufficiency levels
Period % self-sufficiency
1956-60 54
1961-65 60
1966-70 80
1971-75 87
1976-80 92
1981-85 77
1986-90 75
1991-95 76
1996-2000 71
2001-05 71
2006-08 72
Target: 100% self-sufficient by 2015Possible?

Mean rice productivity increase per yearMean rice productivity increase per year
1.5
2.0
-0.2
1.1
2.0
-0.5
0.0
0.5
1.0
1.5
2.0
2.5
1961-1970 1971-1980 1981-1990 1991-2000 2001-2008
% m
ea
n c
ha
ng
e in
rice
yie
ld p
er
he
cta
re p
er
yea
r
Malaysia Rice Yield Productivity Change Per Year
+2.0% increase per year only(not 4.9% required for 100% self sufficiency by 2015)

Malaysia’s self sufficiency levelMalaysia’s self sufficiency level
Year Fruits Veg. Beef Mutton Pork Poultry Eggs Dairy Fish
1990 110.4 75.2 23.8 10.5 113.9 106.3 109 4.3 91.1
1995 103 87 22 6 101 114 114 4 91
2000 91.3 88.5 22.7 6.4 80 127.8 139 4 89
2005 117 74 23 8 107 121 113 5 91
2007 105 89 25 9 106 121 114 5 97
0
10
20
30
40
50
60
70
80
90
100
1960
1965
1970
1975
1980
1985
1990
1995
2000
2005
2010
Year
% la
nd
usa
ge
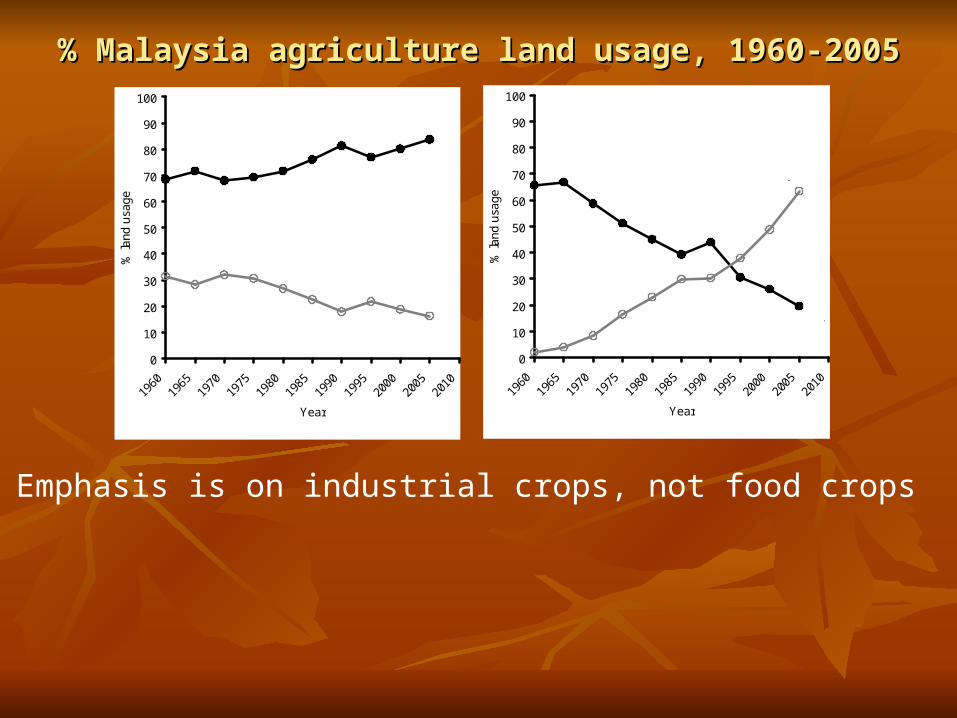
Industrial crops
Food crops
0
10
20
30
40
50
60
70
80
90
100
1960
1965
1970
1975
1980
1985
1990
1995
2000
2005
2010
Year
% la
nd
usa
ge
Oil palm
Rubber
% Malaysia agriculture land usage, 1960-2005% Malaysia agriculture land usage, 1960-2005
Emphasis is on industrial crops, not food crops