precision estimates of aashto t324, “hamburg wheel …
TRANSCRIPT
1
Project No. 10-87-2B DRAFT 6/06/14
PRECISION ESTIMATES OF AASHTO T324, “HAMBURG WHEEL-TRACK TESTING OFCOMPACTED HOT MIX ASPHALT
(HMA)”
APPENDICES
FOR FINAL REPORT
Prepared for
National Cooperative Highway Research Program
Transportation Research Board
National Research Council
TRANSPORTATION RESEARCH BOARD
NAS-NRC
PRIVILEGED DOCUMENT This report, not released for publication, is furnished only for review to members of or participants in the work of the National Cooperative Highway Research Program (NCHRP). It is to be regarded as fully privileged, and dissemination of information included herein must be approved by the NCHRP.
Dr. Haleh Azari AASHTO Materials Reference Laboratory
Gaithersburg, Maryland
June 2014

2
ACKNOWLEDGMENT OF SPONSORSHIP
This work was sponsored by the American Association of State Highway and Transportation Officials, in cooperation with the Federal Highway Administration, and was conducted in the National Cooperative Highway Research Program, which is administered by the Transportation Research Board of the National Research Council.
DISCLAIMER
This is an uncorrected draft as submitted by the research agency. The opinions and conclusions expressed or implied in the report are those of the research agency. They are not necessarily those of the Transportation Research Board, the National Research Council, the Federal Highway Administration, the American Association of State Highway and Transportation Officials, or the individual states participating in the National Cooperative Highway Research Program.

3
TABLE OF CONTENTS
TABLE OF CONTENTS ........................................................................................................................... 3
APPENDIX A- INSTRUCTIONS AND DATA SHEET FOR INTERLABORATORY STUDY.............................................................................................................................. 4
APPENDIX B- INDIVIDUAL GRAPHS OF DEFORMATION VERSUS NUMBER OF CYCLES FROM EACH LABORATORY IN THE ILS ........................................... 11
APPENDIX C- CAUSES OF VARIABILITY OF THE WHEEL TRACK TESTER MEASUREMENTS ....................................................................................................... 41
C-1- Effect of Cut on Gyratory Samples ........................................................................... 41
C-2- Effect of Position of the Wheel with Respect to Specimen ...................................... 42
C-3- Location of Deformation Measurements .................................................................. 42
C-4- Effect of Bolt Tightness ............................................................................................ 44
APPENDIX D- STATISTICS OF DEFORMATION OF 19-MM FIELD SPECIMENS .................. 45
APPENDIX E- STATISTICS OF NUMBER OF PASSES TO THRESHOLD RUT DEPTH OF WYOMING SPECIMENS ..................................................................................... 82
APPENDIX F- STATISTICS OF CREEP SLOPE.............................................................................. 107
APPENDIX G- STATISTICS OF STRIP SLOPE ............................................................................... 132
APPENDIX H- STATISTICS OF NUMBER OF PASSES TO INFLECTION POINT .................. 145
APPENDIX I- RECOMMENDED PRECISION ESTIMATES FOR AASHTO T324 .................... 158

4
APPENDIX A- INSTRUCTIONS AND DATA SHEET FOR INTERLABORATORY STUDY

5
INSTRUCTIONS FOR TESTING GYRATORY SPECIMENS
Dear Participants,
Thank you for participating in the AASHTO T324 interlaboratory study (ILS) for determining precision estimates of Hamburg wheel tracking device. You have received the first set of samples to be tested as part of the ILS. The set includes four 60-mm tall gyratory compacted cylinders for one application of Hamburg testing. Please test the samples within a week of receiving them. Here are the instructions for testing the samples:
1. Prior to Hamburg testing, dry the samples using “CoreDry” (if available) and measure Gmb of the samples using one or more of the listed methods: Saturated surface dry (SSD) following AASHTO T 166, Gilson (G4 device), or Corelok vacuum sealing method following AASHTO T 331. Record the data in the enclosed Excel file (second sheet of the “Hamburg Results Table-Gyr2”).
2. Place a specimen (marked side up) in the polyethylene cutting mold and use masonry saw to make a vertical cut parallel to the edge of the mold.
3. Cut the specimen to the dimensions shown in Figure 1 in order to fit in the molds required for performing the test.
4. Place the high-density polyethylene molds into the mounting tray and fit samples into each one.
5. After Securing the polyethylene molds and samples into the stainless steel mounting tray, the gap between the two polyethylene molds should be 7.5 mm.
6. Fasten the mounting trays into the empty water bath. 7. Start the software supplied with the Hamburg machine and enter the required test
information into the computer:
a. Date of the test
b. Testing temperature of 122 ± 1.8°F (50±1ºC) c. Load of 158 lb ± 1.0 lb
d. Rate of 52 pass/min
e. Maximum number of passes as 20,000
f. Deformation Stopping criteria of 24.0-mm
g. Sampling interval of
i. every 20-cycle for the first 1000 cycles
ii. every 50-cycle for the second 4000 cycles
iii. every 100-cycle for the third 5000 cycle
iv. every 100-cycle for the fourth 5000 cycles

6
v. every 100-cycle for the fifth 5000 cycles
8. Fill the water bath.
9. Monitor the temperature from the computer screen. Once the temperature of 122 ± 1.8°F (50±1ºC) has been reached, allow an additional 30 minutes for the test samples to be saturated in the water.
10. Start the test after the test samples have been in the water for 30 minutes at 122 ± 2°F (50±1ºC).
11. The test should automatically stop when 20,000 cycles have passed or if deformation of 24.0 mm has been reached.
12. Fill in the required data in the first sheet of the enclosed Excel file “Hamburg Results Table-Gry2”.
13. Email the original raw data file from the test as well as the “Hamburg Results Table-Gyr2” Excel file to Haleh Azari at [email protected].
Please do not hesitate to call me or send me an email if you have any questions.
Figure A-1- Top view of test specimen configuration for Hamburg wheel tracking Device [Courtesy of TEX-242-F Document]
7
INSTRUCTIONS FOR TESTING SLAB SPECIMENS
Dear Participants,
Thank you for participating in the interlaboratory study (ILS) for determining precision estimates of Hamburg wheel tracking device. You have received a set of slab specimens to be tested using the Hamburg device. The set includes two-60-mm tall slabs for one application of Hamburg testing. Please follow the instructions below for testing the specimens and returning the test results:
1. Prior to Hamburg testing, measure the bulk specific gravity of the Specimens using Saturated Surface Dry (SSD) method following AASHTO T 166 or Corelok vacuum sealing method following AASHTO T 331. Record the data in the enclosed Excel file (second sheet of the “Hamburg Results Table”).
2. Use plaster of Paris to rigidly mount the specimens in the mounting trays, compacted side up as indicated on the specimen. Center the Specimen in the mounting tray so the plaster margin surrounding the Specimen is of equal size. Pour the plaster to a height equal to that of the tray so that the space between the specimen and the tray is filled. Allow the plaster to set for at least one hour.
3. Fasten the mounting trays into the empty water bath. 4. Start the software supplied with the Hamburg machine and enter the required test
information into the computer:
a. Laboratory name
b. Date of the test
c. Testing temperature of 122 ± 2°F (50±1ºC) d. Load of 158 lb ± 1.0 lb
e. Speed of 52 pass/min
f. Maximum number of passes as 20,000
g. Deformation Stopping criteria of 24.0-mm
h. Sampling interval of
i. every 20-cycle for the first 1000 cycles
ii. every 50-cycle for the second 4000 cycles
iii. every 100-cycle for the third 5000 cycle
iv. every 100-cycle for the fourth 5000 cycles
v. every 100-cycle for the fifth 5000 cycles
5. Fill the water bath.

8
6. Monitor the temperature from the computer screen. Once the temperature has been reached 122 ± 2°F (50±1ºC), allow the test specimens to be saturated in the water for additional 30 minutes.
7. Start the test after the test specimens have been in the water for 30 minutes at 122 ± 2°F (50±1ºC).
8. The test should automatically stop when 20,000 cycles have passed or if deformation of 24.0 mm has been reached.
9. Fill in the required data in the first sheet of the enclosed Excel file “Hamburg Results Table”.
Email the original raw data file from the test and the “Hamburg Results Table” Excel file to Haleh Azari at [email protected].

9
RESULTS SHEET
Bulk Specific Gravity Measurement
Sample IDMaterialSample Type (gyratory, slab)Date ReceivedDate Tested
Sample IDDry Mass in Air, gSSD Mass, gMass in Water, gVolume, cm3
Bulk Specific Gravity
Sample IDDry Mass of Sample before Sealing, gMass of Bag, gMass of Sealed Sample in Water,gMass of Dry Sample after Submersion, gRatio of Dry Mass to Mass of bagBag Volume Correction FactorVolume, cm3 Bulk Specific Gravity
Sample IDDry Mass, gVolume, cm3 Bulk Specific Gravity
Data Sheet for the ILS of Hamburg Wheel Track Testing- Air Void Results
SSD Method
Gilson Method
Corelok Method

10
Hamburg Wheel Track Tester Measurements
Laboratry NameMaterialSample Type (gyratory, slab)Date ReceivedDate Tested
Sample IDSamples LocationTemperatureLoad, N (lbf)Rut Depth at 5000 Passes (mm)Rut Depth at 10,000 Passes (mm)Rut Depth at 15,000 Passes (mm)Rut Depth at 20,000 Passes (mm)Creep SlopeStrip SlopeStripping Inflection Point (Cycle)Visual Damage (0 to 5 rating, 5 being very damaged)
Right Left
Data Sheet for the ILS of Hamburg Wheel Track Testing- Hamburg Results

11
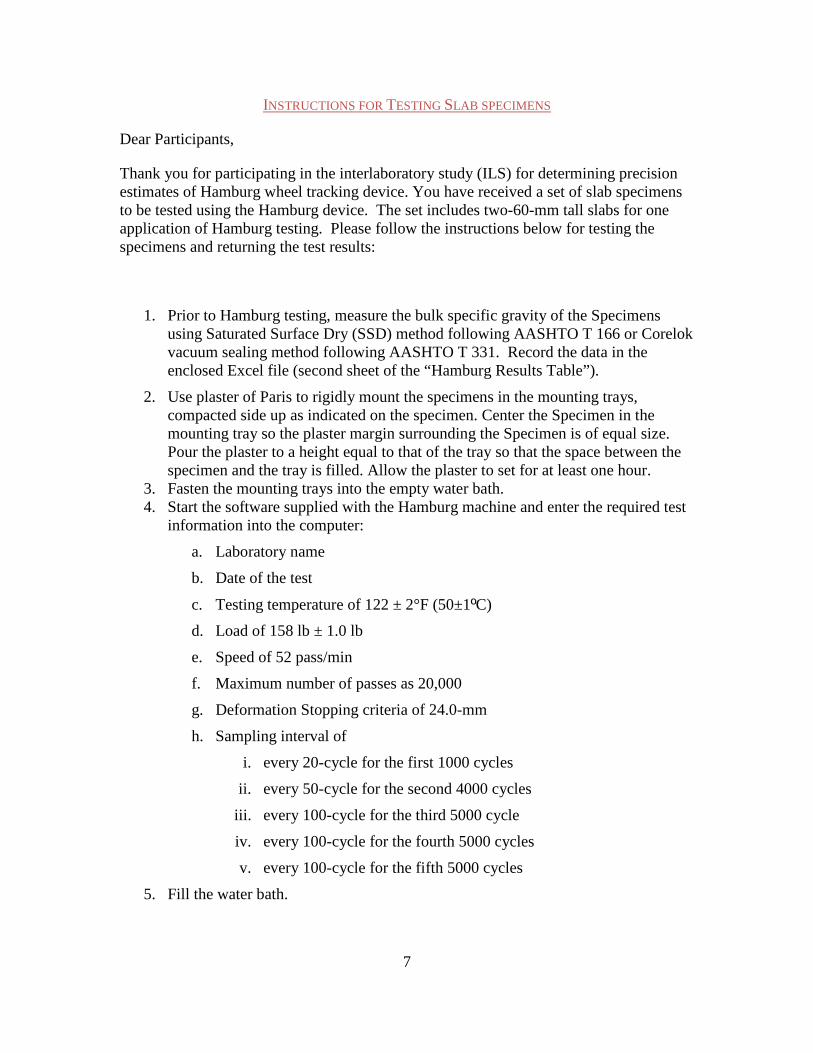
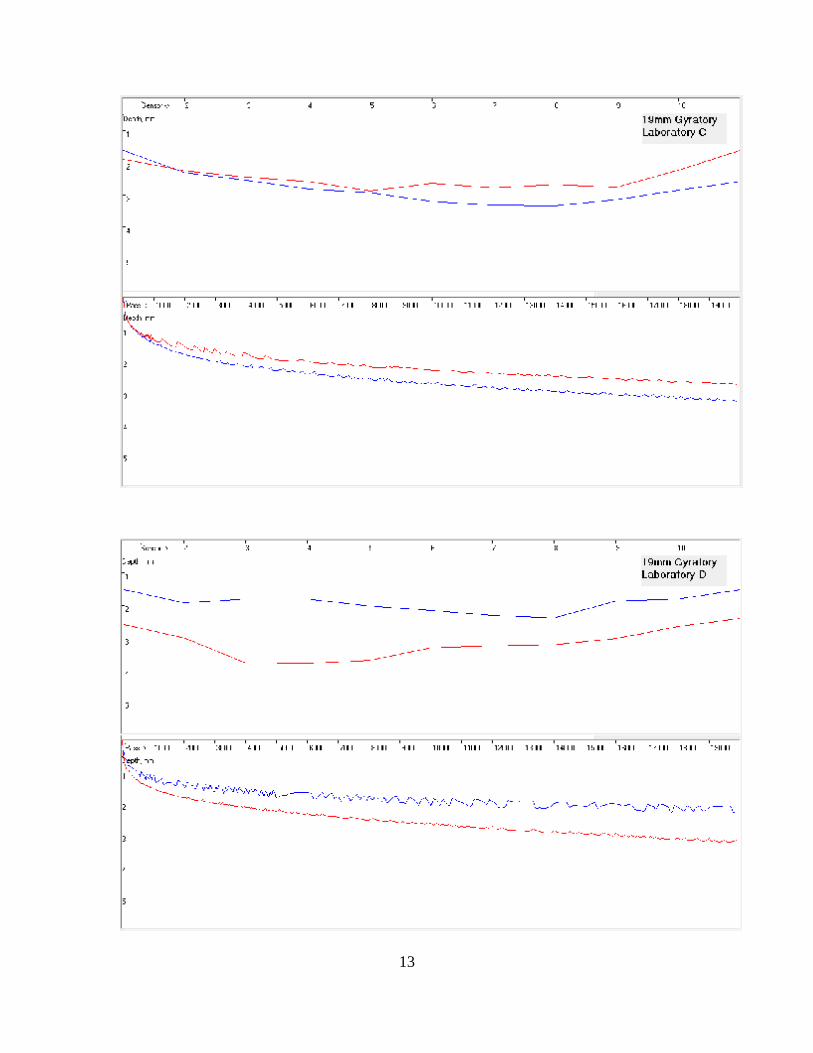
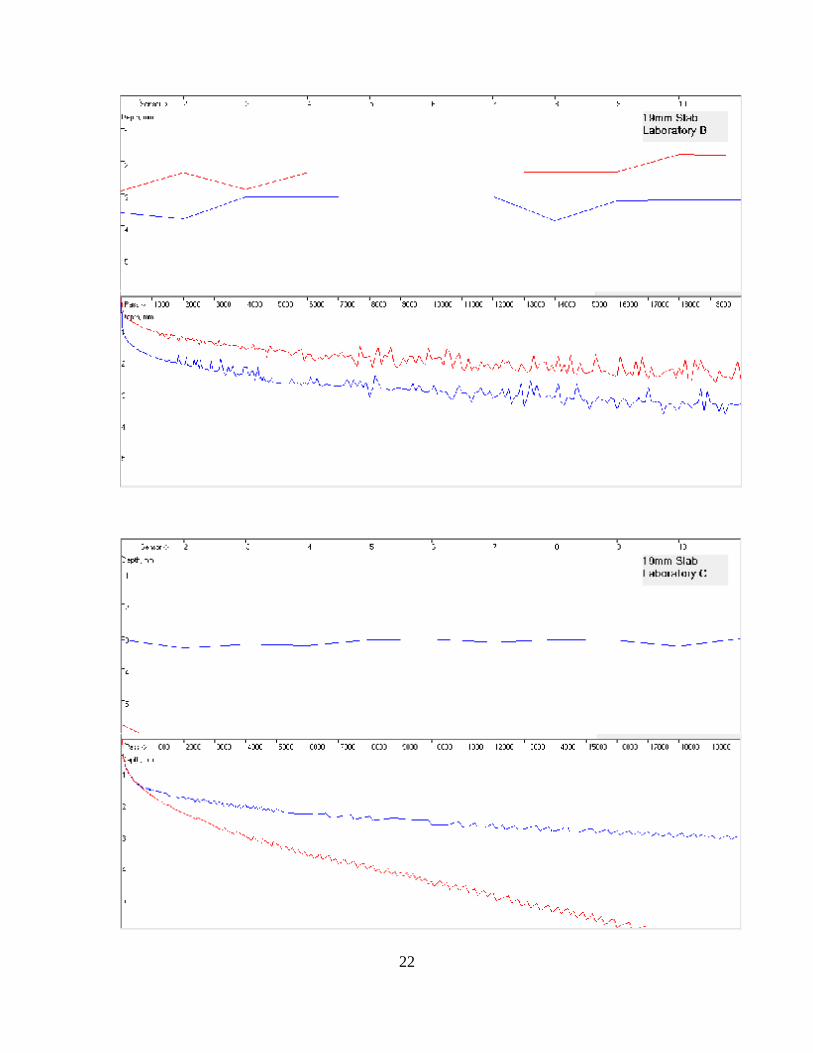
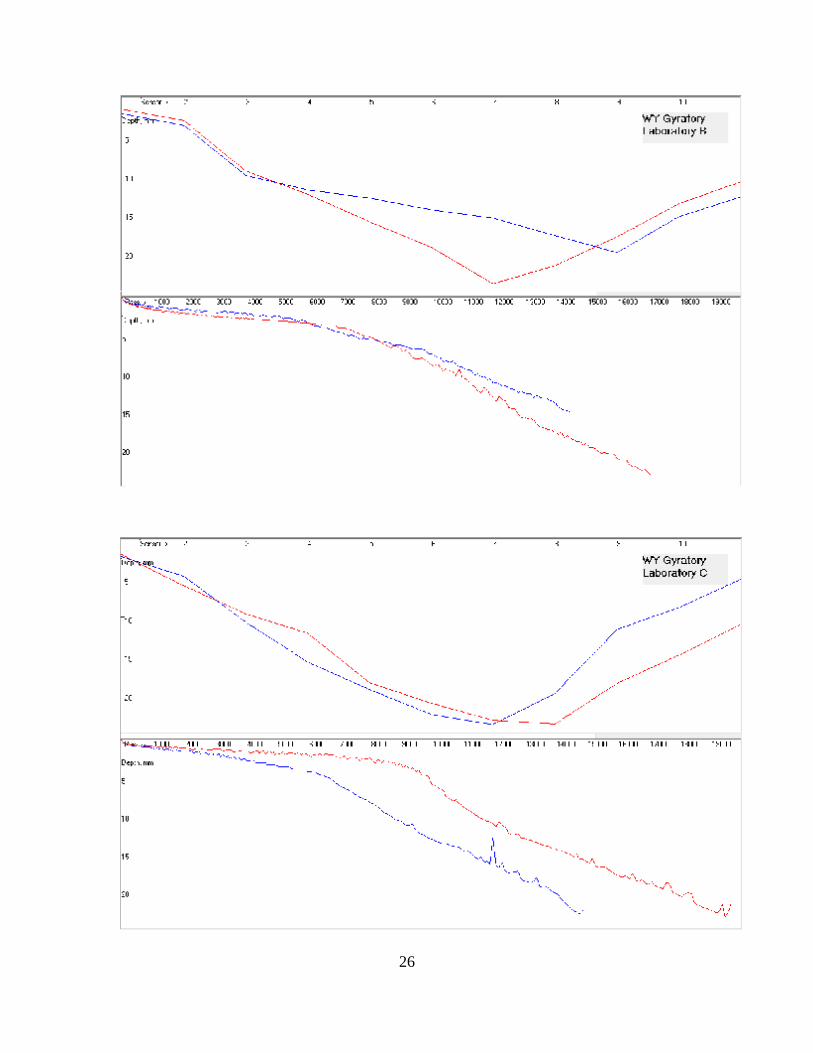
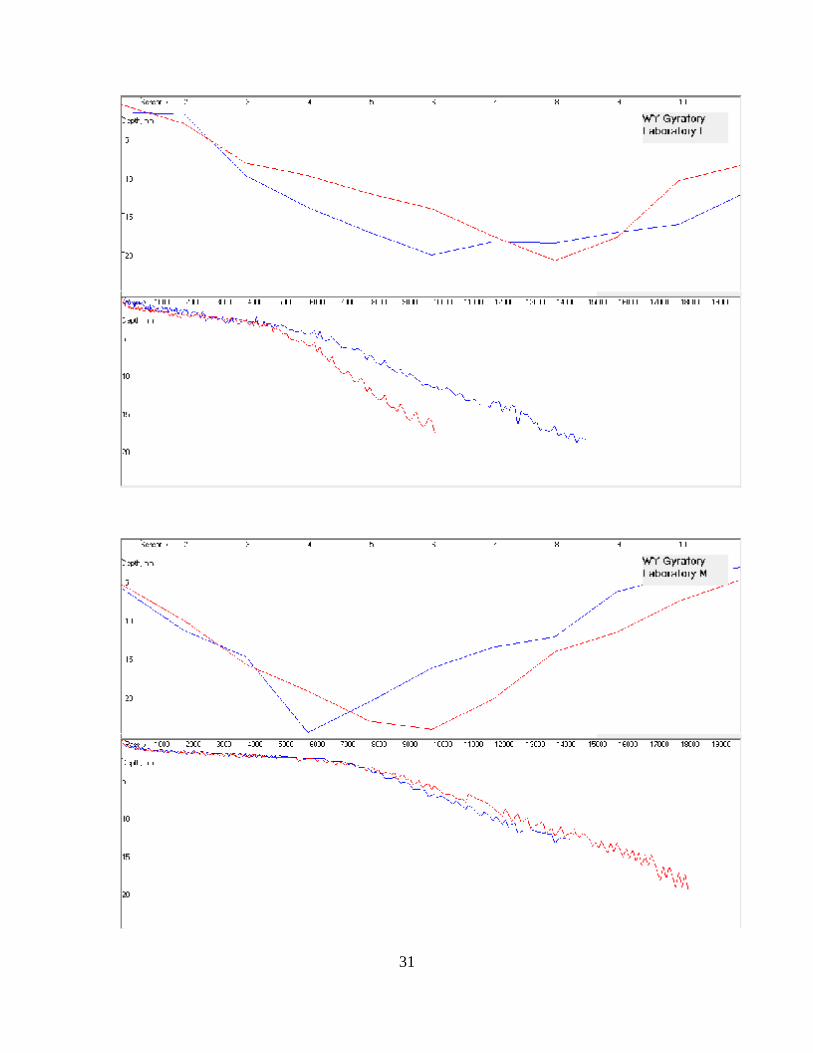
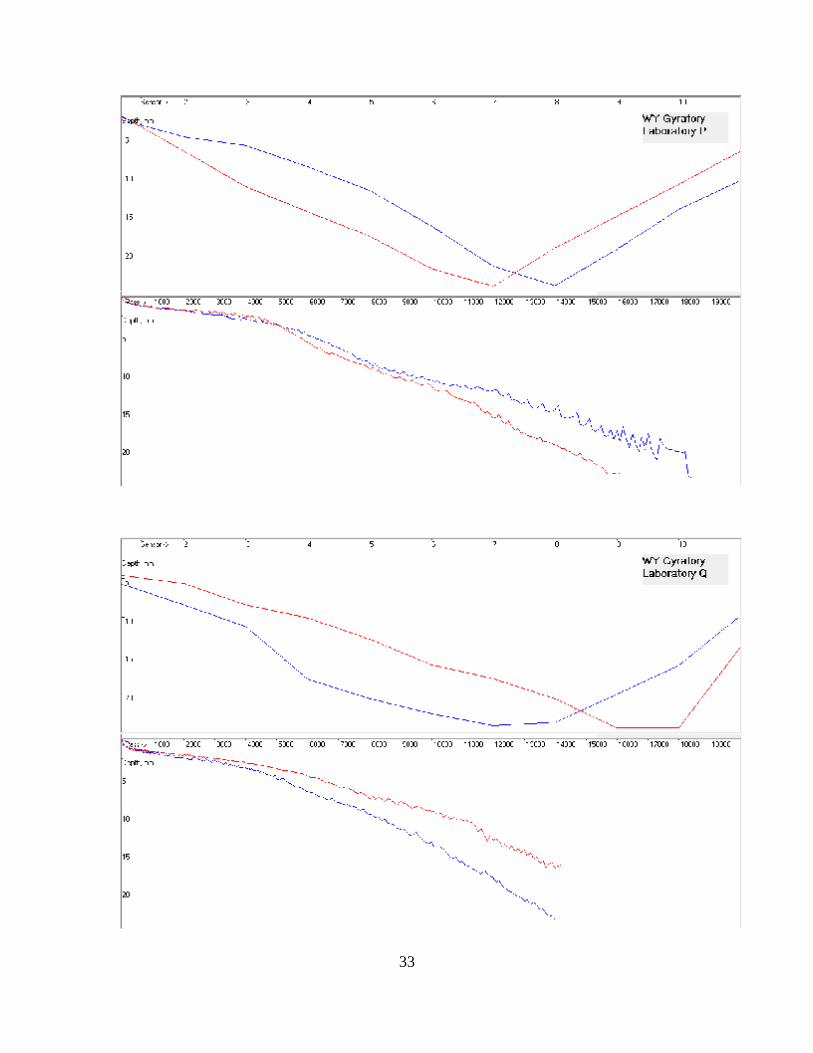
APPENDIX B- INDIVIDUAL GRAPHS OF DEFORMATION VERSUS NUMBER OF CYCLES FROM EACH LABORATORY IN THE ILS

12
13
14

15

16

17

18

19

20

21
22

23

24

25
26

27

28

29

30
31

32
33

34
35
36

37

38

39

40
41
APPENDIX C- CAUSES OF VARIABILITY OF THE WHEEL TRACK TESTER MEASUREMENTS
In Chapter 3, several factors were hypothesized as probable reasons for bias and variability in the measurements from the HWTT. The factors include possible offset in the measurement locations, dynamics of the mechanical system in two-wheel machines, and the effect of cut on the gyratory samples. Research was conducted in-house to more closely investigate several of the factors.
C-1- Effect of Cut on Gyratory Samples
The cut on the gyratory samples is speculated to be a cause of bias and variability from various stand points. The cut exposes the mixture to moisture at the cut surfaces. Such exposure could accelerate stripping or softening of the mastic, leading to more deformation at the mid-point.
The cut also contributes to the bias and variability of the measurements. Although the laboratories were instructed to make the cut to achieve a 7.5-mm gap between the two parts of the mold, some laboratories could not do so because of making too small or too large a cut across the samples’ height. This caused increased variability of the test measurements for two reasons.
First, the amount of cut determines the gap width between the molds. A smaller cut would result in a larger gap between the two molds holding the gyratory samples and therefore a decreased confinement around the midpoint of the test specimen. This would result in increased rutting and variability of the measurements.
Second, the amount of cut also determines the length of the specimen and, in turn, how close the wheel would get to the two ends of the test specimen. A larger cut would result in smaller gap and shorter specimen length, which causes the wheel to reach closer to the ends of the specimens or for the wheel to ride onto the mold. Since confinement is too high at the ends due to the proximity of the mixture to the mold on three sides, the deformation is very small. With time, the deformation differential between mid-point and ends would create a downward slope from the ends towards the middle of the specimen and since the deformation at midpoint is larger than that at the ends, a downward movement of the wheel significantly affects the wheel dynamics and thus the deformation pattern. It was observed that because of this differential deformation, the wheel plows toward the mid-point resulting in an even larger deformation at the midpoint. Therefore, there should be upper and lower limits for the amount of cut on the samples.
The above observations could be the reasons for the large deformation at or around the midpoint despite the maximum speed of the wheel at that location. The bias and variability can be improved by increasing the distance between the wheel and the ends of the specimen. This can be accomplished by reducing the amount of cut or not cutting the
42
gyratory samples. The increased gap between the molds due to reduced amount of cut can be filled with plaster of Paris to provide containment at the mid-point of the specimens.
C-2- Effect of Position of the Wheel with Respect to Specimen
Another factor affecting the variability of results is the location of the wheel with respect to the specimen. It was found that a change in starting position of the wheel with respect to specimen of a little as a few millimeters could result in a difference in the deformation pattern. Currently, there is no specific method for checking the starting position of the wheel with respect to the tray or the specimen, thus the starting point of the wheel may differ for each tray. While positioning the wheel with respect to the tray is a machine adjustment issue, the position of wheel with respect to the specimen within the tray is part of the specimen assembly. Spacers are used to adjust the specimen location and depending on the number and location of the spacers, the position of the wheel with respect to the specimen would change. As a result, the wheel could come closer to the edge of the specimen at one end than the other. This could change the deformation pattern and increase the variability of the test results.
C-3- Location of Deformation Measurements
Anomalies in the measurement locations and spacing were previously shown, with the maximum deformation from the laboratory results occurring at measurement locations 7 and 8 more frequently than at measurement location 6, which should be the midpoint of the specimen (Figure 3-6). This situation can be also seen from the asymmetric deformation profiles found in the test data of several laboratories (graphs in Appendix B). It appeared that actual location of the measurement locations does not agree with their design locations. The asymmetric wheel path found for several laboratories could indicate that the measurement locations are too close to each other at one end and too far apart at the other end as shown in Figure C-1.
The anomaly in measurement locations was investigated. A red plastic guide was prepared and moved from the initial to the final wheel imprint as shown in Figure C-2. The locations of the tab were determined from the deformation readings on the screen after the wheel crossed over the guide, allowing determination of the actual measurement locations. The design measurement locations and the actual locations determined in the experiment are listed in the left panel of Figure C-2 and are shown in Figure C-3. The results showed that measurement location 11 was located 30 mm after the wheel’s starting position instead of the design 13 mm. Also, the location of measurement 1 could not be found on the wheel-path (indicated by question mark in Figure C-2). It is possible that the measurement location 1 may be reporting deformation outside of the wheel-path, where the wheel never passes. This situation may also explain the non-symmetric rut profile in Figure C-1. This problem could affect the data analysis even if the deformations from all measurement locations are averaged.

43
Figure C-1- Rut Profile for Gyratory WY Specimen from one of the participating laboratories
Sensor Number
Observed Distance
from Wheel,
mm
Design Distance
from Wheel,
mm
Wheel End 229
1 237? 216
2 217 196
3 195 176
4 175 155
5 160 135
6 135 115
7 115 94
8 95 74
9 70 54
10 50 33
11 30 13
Wheel Start 0 0
Figure C-2- HWTT Measurement Locations

44
Figure C-3- Determination of HWTT measurement locations; design locations are shown in black and actual locations are shown in red
C-4- Effect of Bolt Tightness
Among results received from the laboratories, some were showing excessive deformation at the initial stages of the test. These results were considered as outliers and laboratories commented that the results were affected by loosening of the bolts on the tray holding the molds and specimens. Sections 8.2 and 8.3 of AASHTO T 324 specify securing the specimen and mold system in the tray by tightening the bolts ”hand-tight”. AMRL investigated this specified tightness by tightening the bolts at first and checking the tightness at several intervals prior to the actual start of the test. It was found that at the end of the 30-min temperature conditioning period, the bolts could lose their tightness although they were properly tightened before the conditioning period. The loosening of the bolts may be partially related to the expansion of the molds with the increase in water temperature due to the high coefficient of thermal expansion of the polyethylene mold material. The movement of the mold due to the gap between its two parts could be another reason for the loosening of the bolts. Use of different materials with lower coefficient of expansion than polyethylene and use of a new mold design with lower gap at the midpoint of specimen should be explored. Meanwhile, it is good practice to retighten the bolts at the end of the 30-min temperature conditioning right before start of the test.

45
APPENDIX D- STATISTICS OF DEFORMATION OF 19-MM FIELD SPECIMENS
46
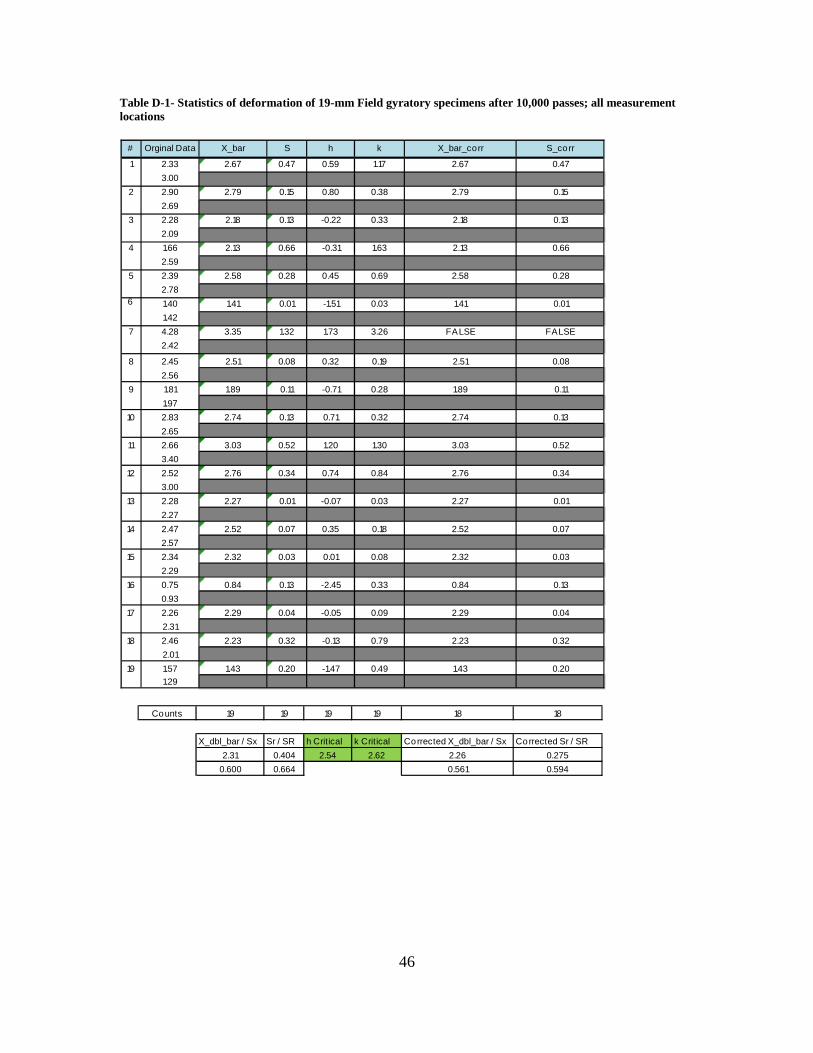
Table D-1- Statistics of deformation of 19-mm Field gyratory specimens after 10,000 passes; all measurement locations
# Orginal Data X_bar S h k X_bar_corr S_corr
1 2.33 2.67 0.47 0.59 1.17 2.67 0.473.00
2 2.90 2.79 0.15 0.80 0.38 2.79 0.152.69
3 2.28 2.18 0.13 -0.22 0.33 2.18 0.132.09
4 1.66 2.13 0.66 -0.31 1.63 2.13 0.662.59
5 2.39 2.58 0.28 0.45 0.69 2.58 0.282.78
6 1.40 1.41 0.01 -1.51 0.03 1.41 0.011.42
7 4.28 3.35 1.32 1.73 3.26 FALSE FALSE2.42
8 2.45 2.51 0.08 0.32 0.19 2.51 0.082.56
9 1.81 1.89 0.11 -0.71 0.28 1.89 0.111.97
10 2.83 2.74 0.13 0.71 0.32 2.74 0.132.65
11 2.66 3.03 0.52 1.20 1.30 3.03 0.523.40
12 2.52 2.76 0.34 0.74 0.84 2.76 0.343.00
13 2.28 2.27 0.01 -0.07 0.03 2.27 0.012.27
14 2.47 2.52 0.07 0.35 0.18 2.52 0.072.57
15 2.34 2.32 0.03 0.01 0.08 2.32 0.032.29
16 0.75 0.84 0.13 -2.45 0.33 0.84 0.130.93
17 2.26 2.29 0.04 -0.05 0.09 2.29 0.042.31
18 2.46 2.23 0.32 -0.13 0.79 2.23 0.322.01
19 1.57 1.43 0.20 -1.47 0.49 1.43 0.201.29
Counts 19 19 19 19 18 18
X_dbl_bar / Sx Sr / SR h Critical k Critical Corrected X_dbl_bar / Sx Corrected Sr / SR2.31 0.404 2.54 2.62 2.26 0.275
0.600 0.664 0.561 0.594
47
-3.00
-2.00
-1.00
0.00
1.00
2.00
3.00
1 3 5 7 9 11 13 15 17 19h
Lab Number
Deformation after 10,000 Cycles, 19-mm Field Gyratory, All Sensors
h critical
0.00
0.50
1.00
1.50
2.00
2.50
3.00
3.50
1 2 3 4 5 6 7 8 9 10
k
Lab Number
Deformation after 10,000 Cycles, 19-mm Field Gyratory, All Sensors
k critical
0
0.5
1
1.5
2
2.5
3
3.5
4
4.5
1 4 7 10 13 16 19
Def
orm
atio
n, m
m
Lab Number
Deformation after 10,000 Cycles, 19-mm Field Gyratory, All Sensors
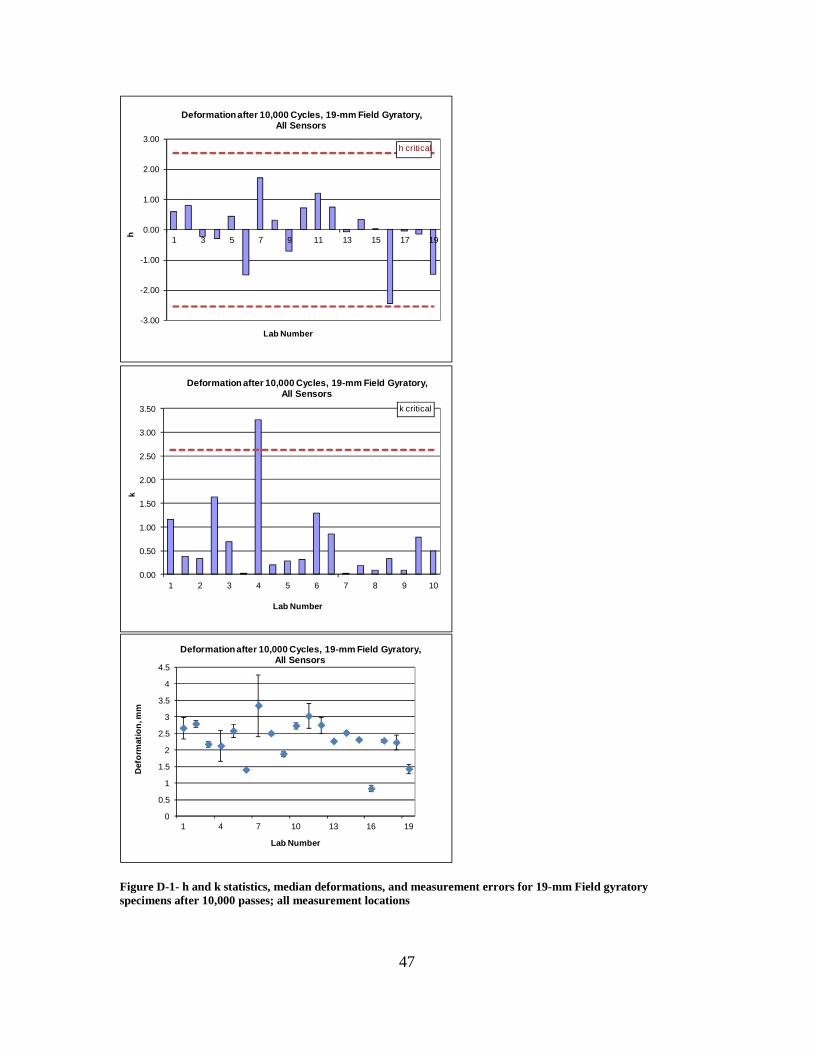
Figure D-1- h and k statistics, median deformations, and measurement errors for 19-mm Field gyratory specimens after 10,000 passes; all measurement locations
48
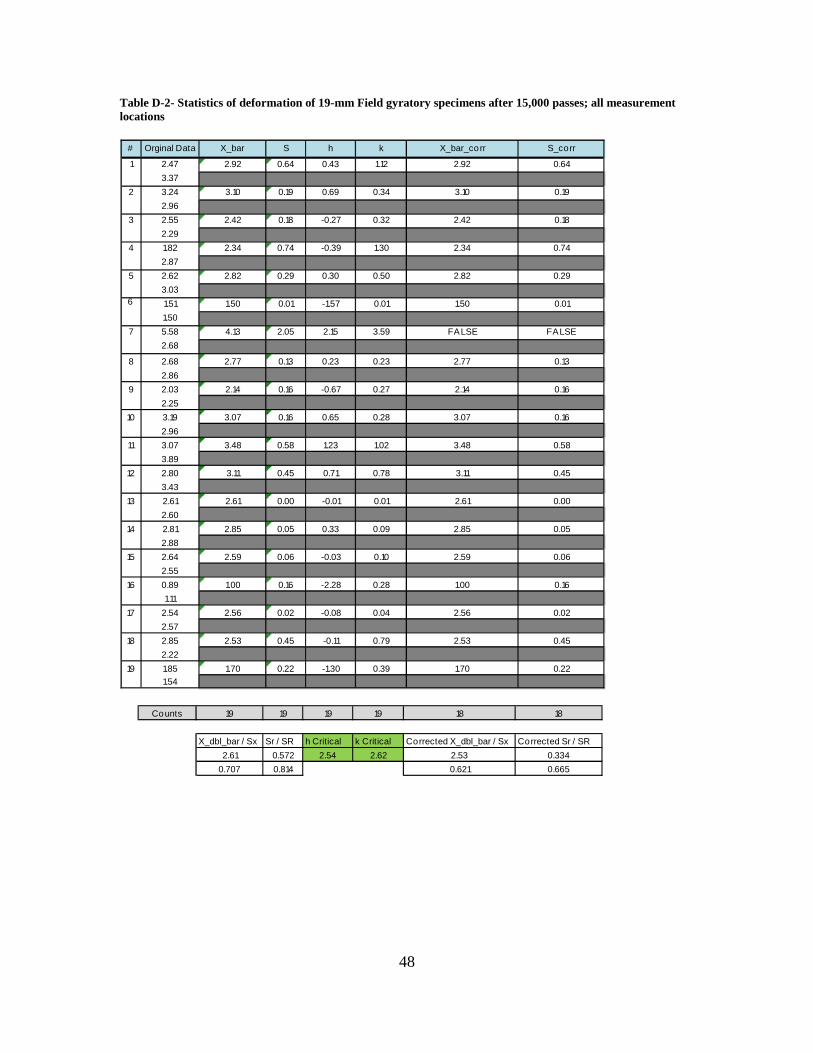
Table D-2- Statistics of deformation of 19-mm Field gyratory specimens after 15,000 passes; all measurement locations
# Orginal Data X_bar S h k X_bar_corr S_corr
1 2.47 2.92 0.64 0.43 1.12 2.92 0.643.37
2 3.24 3.10 0.19 0.69 0.34 3.10 0.192.96
3 2.55 2.42 0.18 -0.27 0.32 2.42 0.182.29
4 1.82 2.34 0.74 -0.39 1.30 2.34 0.742.87
5 2.62 2.82 0.29 0.30 0.50 2.82 0.293.03
6 1.51 1.50 0.01 -1.57 0.01 1.50 0.011.50
7 5.58 4.13 2.05 2.15 3.59 FALSE FALSE2.68
8 2.68 2.77 0.13 0.23 0.23 2.77 0.132.86
9 2.03 2.14 0.16 -0.67 0.27 2.14 0.162.25
10 3.19 3.07 0.16 0.65 0.28 3.07 0.162.96
11 3.07 3.48 0.58 1.23 1.02 3.48 0.583.89
12 2.80 3.11 0.45 0.71 0.78 3.11 0.453.43
13 2.61 2.61 0.00 -0.01 0.01 2.61 0.002.60
14 2.81 2.85 0.05 0.33 0.09 2.85 0.052.88
15 2.64 2.59 0.06 -0.03 0.10 2.59 0.062.55
16 0.89 1.00 0.16 -2.28 0.28 1.00 0.161.11
17 2.54 2.56 0.02 -0.08 0.04 2.56 0.022.57
18 2.85 2.53 0.45 -0.11 0.79 2.53 0.452.22
19 1.85 1.70 0.22 -1.30 0.39 1.70 0.221.54
Counts 19 19 19 19 18 18
X_dbl_bar / Sx Sr / SR h Critical k Critical Corrected X_dbl_bar / Sx Corrected Sr / SR2.61 0.572 2.54 2.62 2.53 0.334
0.707 0.814 0.621 0.665

49
Figure D-2- h and k statistics, median deformation, and the measurement errors for 19-mm Field gyratory specimens after 15,000 passes; all measurement locations

50
Table D-3- Statistics of deformation of 19-mm Field gyratory specimens after 20,000 passes; all measurement locations
# Orginal Data X_bar S h k X_bar_corr S_corr
1 2.60 3.11 0.73 0.34 0.95 3.11 0.733.63
2 3.50 3.23 0.38 0.48 0.50 3.23 0.382.96
3 2.77 2.61 0.23 -0.27 0.30 2.61 0.232.44
4 1.88 2.48 0.86 -0.41 1.12 2.48 0.863.09
5 2.79 3.01 0.31 0.22 0.40 3.01 0.313.23
6 1.59 1.59 0.01 -1.48 0.01 1.59 0.011.60
7 7.01 4.95 2.92 2.54 3.80 FALSE FALSE2.88
8 2.89 3.00 0.15 0.20 0.20 3.00 0.153.10
9 2.16 2.31 0.21 -0.62 0.28 2.31 0.212.47
10 3.51 3.37 0.20 0.65 0.26 3.37 0.203.23
11 3.37 3.79 0.61 1.16 0.79 3.79 0.614.22
12 2.99 3.37 0.54 0.65 0.71 3.37 0.543.76
13 2.76 2.82 0.08 -0.01 0.11 2.82 0.082.88
14 3.01 2.90 0.15 0.09 0.20 2.90 0.152.80
15 2.89 2.84 0.07 0.02 0.09 2.84 0.072.79
16 1.03 1.14 0.16 -2.03 0.21 1.14 0.161.25
17 2.75 2.76 0.01 -0.08 0.02 2.76 0.012.77
18 3.12 2.77 0.49 -0.07 0.63 2.77 0.492.43
19 1.82 1.66 0.22 -1.40 0.29 1.66 0.221.50
Counts 19.00 19.00 19.00 19.00 18 18
X_dbl_bar / Sx Sr / SR h Critical k Critical Corrected X_dbl_bar / Sx Corrected Sr / SR2.83 0.77 2.54 2.62 2.711 0.3860.833 0.99 0.676 0.729

51
-3.00
-2.00
-1.00
0.00
1.00
2.00
3.00
1 3 5 7 9 11 13 15 17 19h
Lab Number
Deformation after 20,000 Cycles,19-mm Field Gyratory
h critical
0.00
0.50
1.00
1.50
2.00
2.50
3.00
3.50
4.00
1 2 3 4 5 6 7 8 9 10
k
Lab Number
Deformation after 20,000 Cycles, 19-mm Field Gyratory
k critical
0
1
2
3
4
5
6
7
8
1 4 7 10 13 16 19
Def
orm
atio
n, m
m
Lab Number
Deformation after 20,000 Cycles, 19-mm Field Gyratory
Figure D-3- h and k statistics, median deformation, and the measurement errors for 19-mm Field gyratory specimens after 20,000 passes; all measurement locations
52
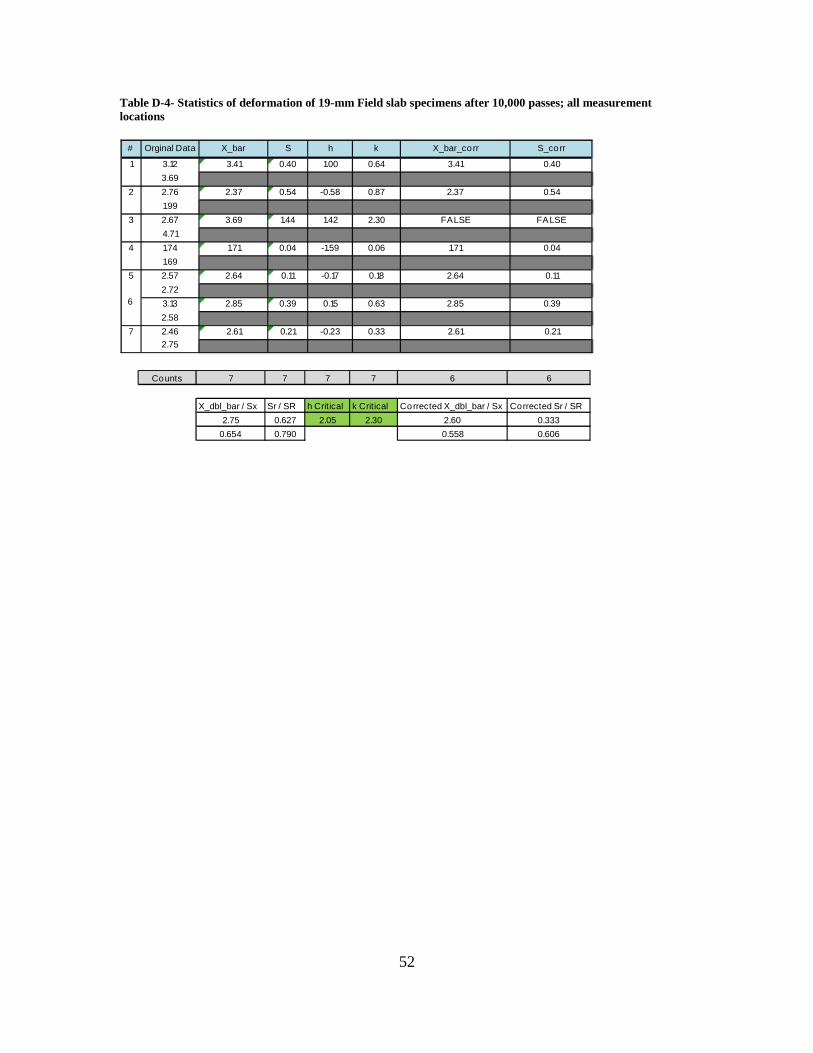
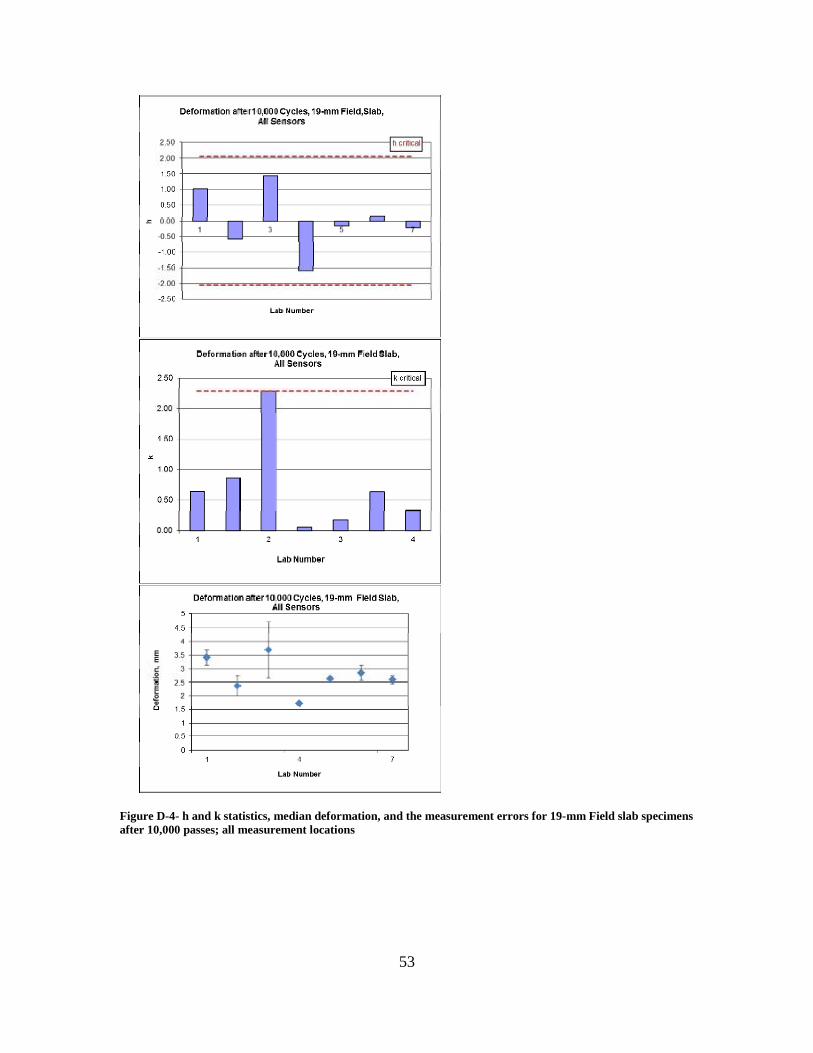
Table D-4- Statistics of deformation of 19-mm Field slab specimens after 10,000 passes; all measurement locations
# Orginal Data X_bar S h k X_bar_corr S_corr
1 3.12 3.41 0.40 1.00 0.64 3.41 0.403.69
2 2.76 2.37 0.54 -0.58 0.87 2.37 0.541.99
3 2.67 3.69 1.44 1.42 2.30 FALSE FALSE4.71
4 1.74 1.71 0.04 -1.59 0.06 1.71 0.041.69
5 2.57 2.64 0.11 -0.17 0.18 2.64 0.112.72
6 3.13 2.85 0.39 0.15 0.63 2.85 0.392.58
7 2.46 2.61 0.21 -0.23 0.33 2.61 0.212.75
Counts 7 7 7 7 6 6
X_dbl_bar / Sx Sr / SR h Critical k Critical Corrected X_dbl_bar / Sx Corrected Sr / SR2.75 0.627 2.05 2.30 2.60 0.333
0.654 0.790 0.558 0.606
53
Figure D-4- h and k statistics, median deformation, and the measurement errors for 19-mm Field slab specimens after 10,000 passes; all measurement locations

54
Table D-5- Statistics of deformation of 19-mm Field slab specimens after 15,000 passes; all measurement locations
# Orginal Data X_bar S h k X_bar_corr S_corr
1 3.68 4.02 0.49 0.99 0.54 4.02 0.494.37
2 2.99 2.62 0.52 -0.69 0.57 2.62 0.522.26
3 2.93 4.44 2.13 1.48 2.36 FALSE FALSE5.95
4 1.96 1.95 0.01 -1.49 0.02 1.95 0.011.94
5 2.92 3.07 0.22 -0.15 0.24 3.07 0.223.23
6 3.86 3.32 0.76 0.14 0.84 3.32 0.762.78
7 2.81 2.96 0.21 -0.28 0.24 2.96 0.213.11
Counts 7 7 7 7 6 6
X_dbl_bar / Sx Sr / SR h Critical k Critical Corrected X_dbl_bar / Sx Corrected Sr / SR3.20 0.905 2.05 2.30 2.99 0.443
0.838 1.054 0.694 0.762

55
Figure D-5- h and k statistics, median deformation, and the measurement errors for 19-mm Field slab specimens after 15,000 passes; all measurement locations

56
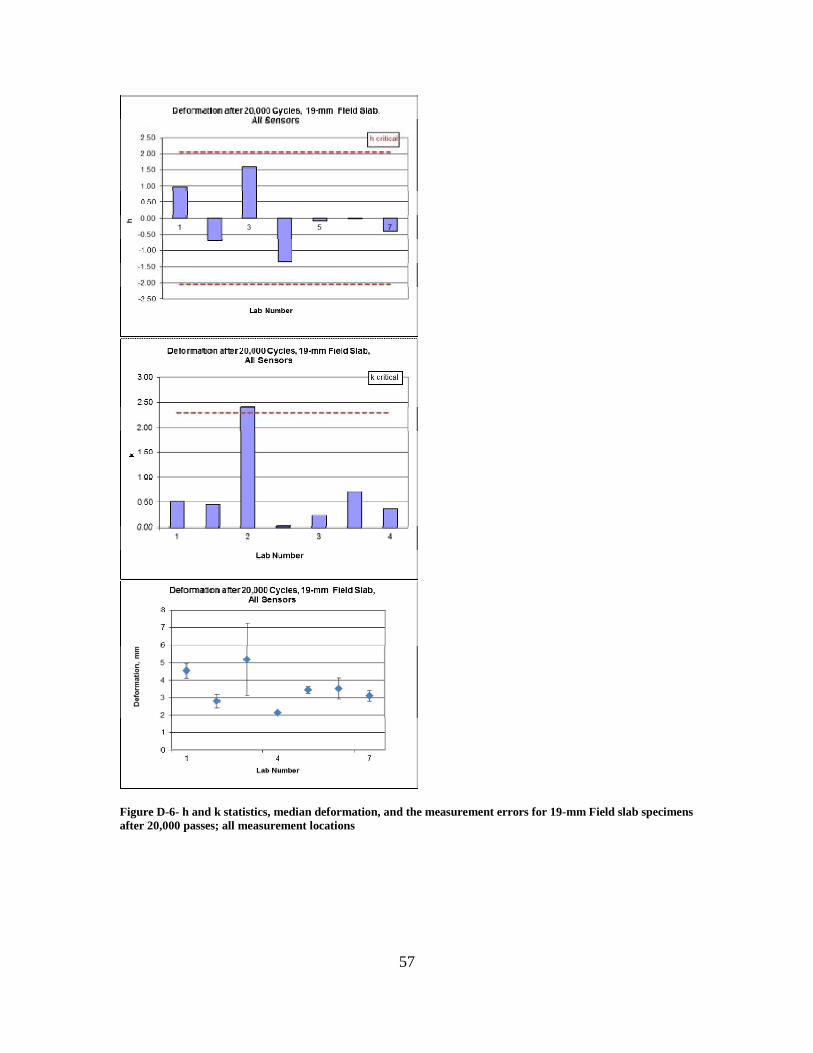
Table D-6- Statistics of deformation of 19-mm Field slab specimens after 20,000 passes; all measurement locations
# Orginal Data X_bar S h k X_bar_corr S_corr1 4.10 4.54 0.62 0.97 0.52 4.54 0.62
4.982 3.20 2.81 0.55 -0.71 0.46 2.81 0.55
2.423 3.14 5.19 2.90 1.59 2.41 FALSE FALSE
7.244 2.12 2.14 0.03 -1.36 0.02 2.14 0.03
2.165 3.25 3.46 0.29 -0.08 0.24 3.46 0.29
3.666 4.14 3.53 0.85 -0.01 0.71 3.53 0.85
2.937 2.81 3.12 0.44 -0.41 0.37 3.12 0.44
3.43
Counts 7 7 7 7 6 6
X_dbl_bar / Sx Sr / SR h Critical k Critical Corrected X_dbl_bar / Sx Corrected Sr / SR3.54 1.202 2.05 2.30 3.27 0.5321.03 1.339 0.805 0.889
57
Figure D-6- h and k statistics, median deformation, and the measurement errors for 19-mm Field slab specimens after 20,000 passes; all measurement locations

58
Table D-7- Statistics of deformation of 19-mm Field gyratory specimens after 10,000 passes; except middle three measurement locations
# Orginal Data X_bar S h k X_bar_corr S_corr
1 2.30 2.61 0.44 0.66 1.42 2.61 0.442.91
2 2.67 2.69 0.03 0.81 0.10 2.69 0.032.71
3 2.19 2.09 0.14 -0.23 0.44 2.09 0.142.00
4 1.60 2.06 0.66 -0.28 2.13 2.06 0.662.53
5 2.23 2.43 0.28 0.36 0.91 2.43 0.282.63
6 1.37 1.35 0.03 -1.51 0.09 1.35 0.031.33
7 3.30 2.77 0.74 0.96 2.38 2.77 0.742.25
8 2.47 2.47 0.00 0.43 0.00 2.47 0.002.47
9 1.79 1.80 0.01 -0.73 0.04 1.80 0.011.81
10 2.67 2.65 0.02 0.74 0.07 2.65 0.022.64
11 2.88 3.17 0.41 1.65 1.34 3.17 0.413.46
12 2.37 2.71 0.47 0.84 1.53 2.71 0.473.04
13 2.21 2.18 0.04 -0.08 0.14 2.18 0.042.15
14 2.28 2.38 0.14 0.27 0.44 2.38 0.142.48
15 2.34 2.32 0.03 0.17 0.09 2.32 0.032.30
16 0.73 0.78 0.07 -2.50 0.23 0.78 0.070.83
17 2.28 2.29 0.02 0.11 0.05 2.29 0.022.30
18 2.37 2.16 0.30 -0.11 0.96 2.16 0.301.95
19 1.47 1.34 0.19 -1.54 0.61 1.34 0.191.21
Counts 19 19 19 19 19 19
X_dbl_bar / Sx Sr / SR h Critical k Critical Corrected X_dbl_bar / Sx Corrected Sr / SR2.22 0.309 2.54 2.62 2.22 0.3090.58 0.616 0.575 0.616

59
-3.00
-2.00
-1.00
0.00
1.00
2.00
3.00
1 3 5 7 9 11 13 15 17 19
h
Lab Number
Deformation after 10,000 Cycles, 19-mm Field Gyratory-Except Middle 3 Sensors
h critical
0.00
0.50
1.00
1.50
2.00
2.50
3.00
1 2 3 4 5 6 7 8 9 10
k
Lab Number
Deformation after 10,000 Cycles, 19-mm Field Gyratory-Except Middle 3 Sensors
k critical
0
0.5
1
1.5
2
2.5
3
3.5
4
1 4 7 10 13 16 19
Def
orm
atio
n, m
m
Lab Number
Deformation after 10,000 Cycles, 19-mm Field Gyratory-Except Middle 3 Sensors
Figure D-7- h and k statistics, median deformation, and the measurement errors for 19-mm Field gyratory specimens after 10,000 passes; except middle three measurement locations
60
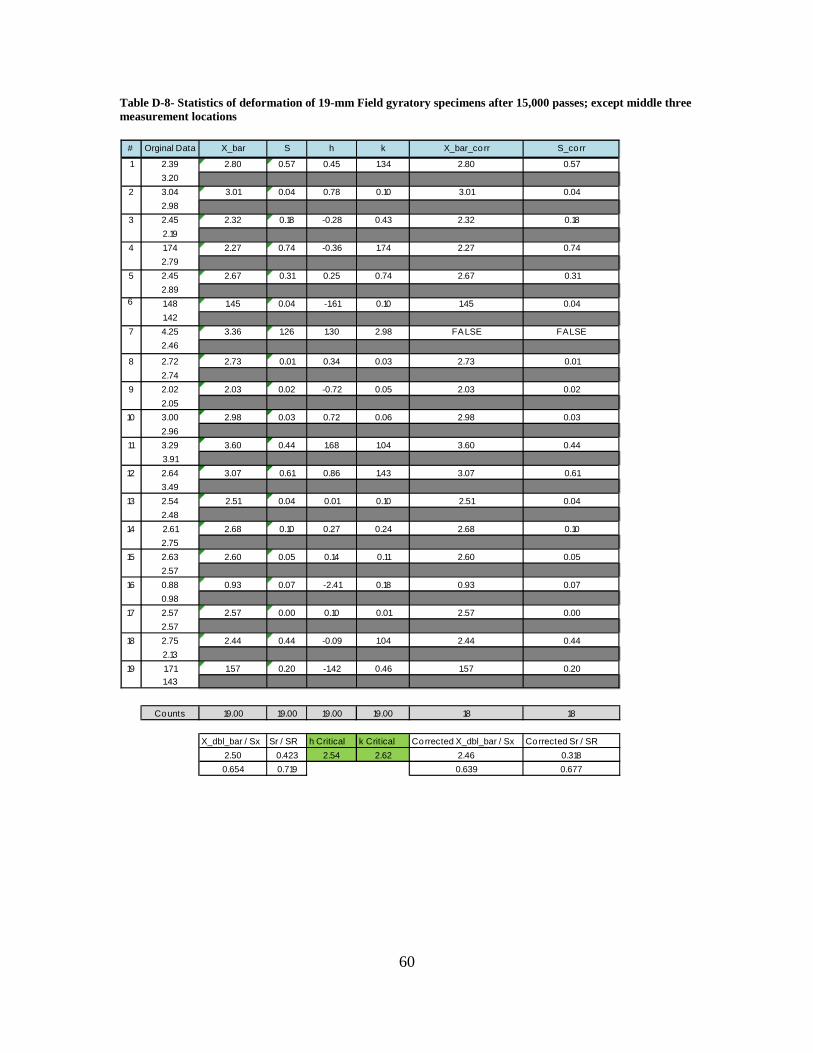
Table D-8- Statistics of deformation of 19-mm Field gyratory specimens after 15,000 passes; except middle three measurement locations
# Orginal Data X_bar S h k X_bar_corr S_corr
1 2.39 2.80 0.57 0.45 1.34 2.80 0.573.20
2 3.04 3.01 0.04 0.78 0.10 3.01 0.042.98
3 2.45 2.32 0.18 -0.28 0.43 2.32 0.182.19
4 1.74 2.27 0.74 -0.36 1.74 2.27 0.742.79
5 2.45 2.67 0.31 0.25 0.74 2.67 0.312.89
6 1.48 1.45 0.04 -1.61 0.10 1.45 0.041.42
7 4.25 3.36 1.26 1.30 2.98 FALSE FALSE2.46
8 2.72 2.73 0.01 0.34 0.03 2.73 0.012.74
9 2.02 2.03 0.02 -0.72 0.05 2.03 0.022.05
10 3.00 2.98 0.03 0.72 0.06 2.98 0.032.96
11 3.29 3.60 0.44 1.68 1.04 3.60 0.443.91
12 2.64 3.07 0.61 0.86 1.43 3.07 0.613.49
13 2.54 2.51 0.04 0.01 0.10 2.51 0.042.48
14 2.61 2.68 0.10 0.27 0.24 2.68 0.102.75
15 2.63 2.60 0.05 0.14 0.11 2.60 0.052.57
16 0.88 0.93 0.07 -2.41 0.18 0.93 0.070.98
17 2.57 2.57 0.00 0.10 0.01 2.57 0.002.57
18 2.75 2.44 0.44 -0.09 1.04 2.44 0.442.13
19 1.71 1.57 0.20 -1.42 0.46 1.57 0.201.43
Counts 19.00 19.00 19.00 19.00 18 18
X_dbl_bar / Sx Sr / SR h Critical k Critical Corrected X_dbl_bar / Sx Corrected Sr / SR2.50 0.423 2.54 2.62 2.46 0.3180.654 0.719 0.639 0.677

61
Figure D-8- h and k statistics, median deformation, and the measurement errors for 19-mm Field gyratory specimens after 15,000 passes; except middle three measurement locations

62
Table D-9- Statistics of deformation of 19-mm Field gyratory specimens after 20,000 passes; except middle three measurement locations
# Orginal Data X_bar S h k X_bar_corr S_corr
1 2.49 2.96 0.66 0.34 1.14 2.96 0.663.42
2 3.31 3.15 0.23 0.59 0.41 3.15 0.232.98
3 2.65 2.49 0.23 -0.28 0.40 2.49 0.232.33
4 1.80 2.40 0.86 -0.41 1.48 2.40 0.863.01
5 2.58 2.83 0.35 0.17 0.61 2.83 0.353.08
6 1.55 1.53 0.03 -1.57 0.06 1.53 0.031.50
7 5.44 4.03 1.99 1.78 3.46 FALSE FALSE2.62
8 2.94 2.94 0.00 0.32 0.01 2.94 0.002.94
9 2.16 2.19 0.04 -0.68 0.07 2.19 0.042.22
10 3.29 3.27 0.03 0.76 0.05 3.27 0.033.25
11 3.59 3.87 0.40 1.56 0.69 3.87 0.404.15
12 2.82 3.33 0.72 0.83 1.24 3.33 0.723.83
13 2.69 2.72 0.05 0.03 0.08 2.72 0.052.76
14 2.76 2.72 0.06 0.02 0.11 2.72 0.062.68
15 2.88 2.85 0.05 0.19 0.08 2.85 0.052.81
16 1.01 1.05 0.05 -2.21 0.09 1.05 0.051.08
17 2.80 2.78 0.02 0.10 0.04 2.78 0.022.77
18 3.05 2.71 0.47 0.01 0.81 2.71 0.472.38
19 1.68 1.55 0.20 -1.55 0.34 1.55 0.201.41
Counts 19 19 19 19 18 18
X_dbl_bar / Sx Sr / SR h Critical k Critical Corrected X_dbl_bar / Sx Corrected Sr / SR2.70 0.577 2.54 2.62 2.63 0.3600.747 0.851 0.694 0.739

63
Figure D-9- h and k statistics, median deformation, and the measurement errors for 19-mm Field gyratory specimens after 20,000 passes; except middle three measurement locations

64
Table D-10- Statistics of deformation of 19-mm Field slab specimens after 10,000 passes; except middle three measurement locations
# Orginal Data X_bar S h k X_bar_corr S_corr
1 3.12 3.39 0.38 0.93 0.58 3.39 0.383.66
2 2.74 2.36 0.54 -0.65 0.83 2.36 0.541.98
3 2.68 3.75 1.52 1.49 2.32 FALSE FALSE4.83
4 1.79 1.77 0.02 -1.56 0.03 1.77 0.021.76
5 2.62 2.71 0.12 -0.11 0.19 2.71 0.122.80
6 3.13 2.84 0.41 0.08 0.63 2.84 0.412.55
7 2.48 2.66 0.26 -0.19 0.40 2.66 0.262.84
Counts 7 7 7 7 6 6
X_dbl_bar / Sx Sr / SR h Critical k Critical Corrected X_dbl_bar / Sx Corrected Sr / SR2.78 0.654 2.05 2.30 2.62 0.3380.650 0.797 0.536 0.587

65
Figure D-10- h and k statistics, median deformation, and the measurement errors for 19-mm Field slab specimens after 10,000 passes; except middle three measurement locations
66
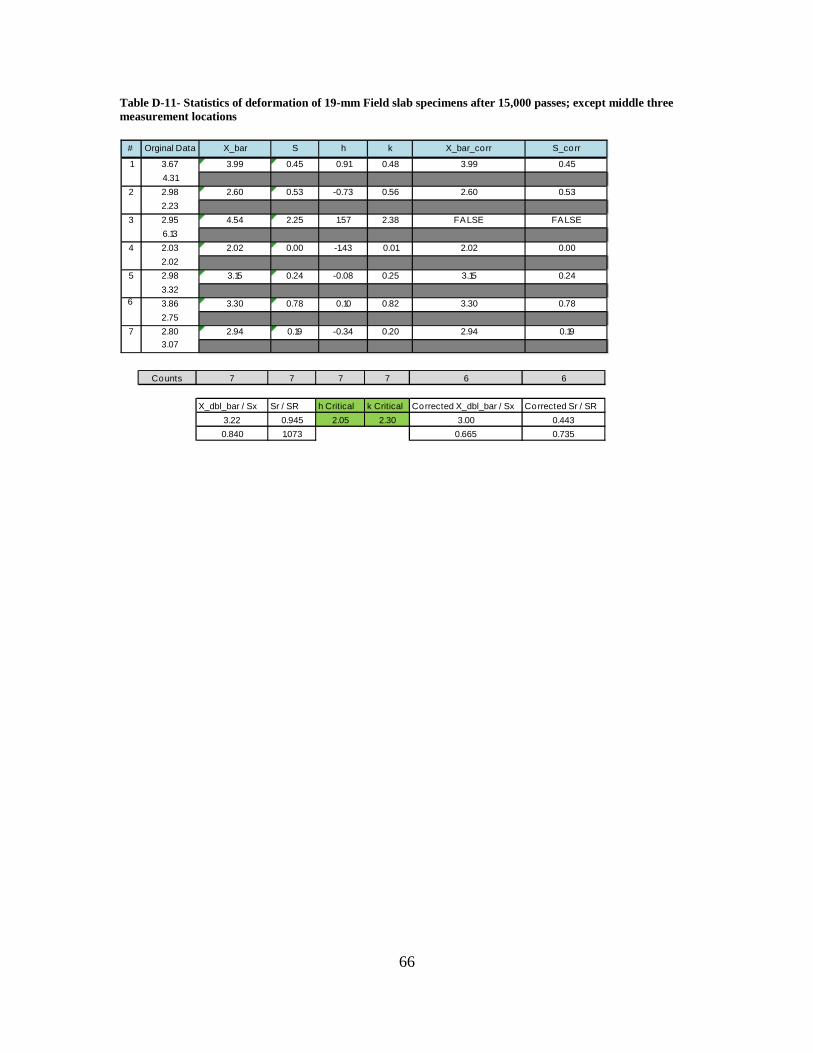
Table D-11- Statistics of deformation of 19-mm Field slab specimens after 15,000 passes; except middle three measurement locations
# Orginal Data X_bar S h k X_bar_corr S_corr
1 3.67 3.99 0.45 0.91 0.48 3.99 0.454.31
2 2.98 2.60 0.53 -0.73 0.56 2.60 0.532.23
3 2.95 4.54 2.25 1.57 2.38 FALSE FALSE6.13
4 2.03 2.02 0.00 -1.43 0.01 2.02 0.002.02
5 2.98 3.15 0.24 -0.08 0.25 3.15 0.243.32
6 3.86 3.30 0.78 0.10 0.82 3.30 0.782.75
7 2.80 2.94 0.19 -0.34 0.20 2.94 0.193.07
Counts 7 7 7 7 6 6
X_dbl_bar / Sx Sr / SR h Critical k Critical Corrected X_dbl_bar / Sx Corrected Sr / SR3.22 0.945 2.05 2.30 3.00 0.4430.840 1.073 0.665 0.735

67
Figure D-11- h and k statistics, median deformation, and the measurement errors for 19-mm Field slab specimens after 15,000 passes; except middle three measurement locations

68
Table D-12- Statistics of deformation of 19-mm Field slab specimens after 20,000 passes; except middle three measurement locations
# Orginal Data X_bar S h k X_bar_corr S_corr1 4.07 4.47 0.57 0.86 0.45 4.47 0.57
4.872 3.21 2.80 0.58 -0.75 0.46 2.80 0.58
2.393 3.16 5.32 3.07 1.68 2.44 FALSE FALSE
7.494 2.20 2.23 0.05 -1.29 0.04 2.23 0.05
2.265 3.34 3.55 0.31 -0.02 0.24 3.55 0.31
3.776 4.14 3.52 0.87 -0.05 0.69 3.52 0.87
2.917 2.85 3.13 0.39 -0.43 0.31 3.13 0.39
3.41
Counts 7 7 7 7 6 6
X_dbl_bar / Sx Sr / SR h Critical k Critical Corrected X_dbl_bar / Sx Corrected Sr / SR3.58 1.259 2.05 2.30 3.28 0.5281.039 1.368 0.762 0.849
69
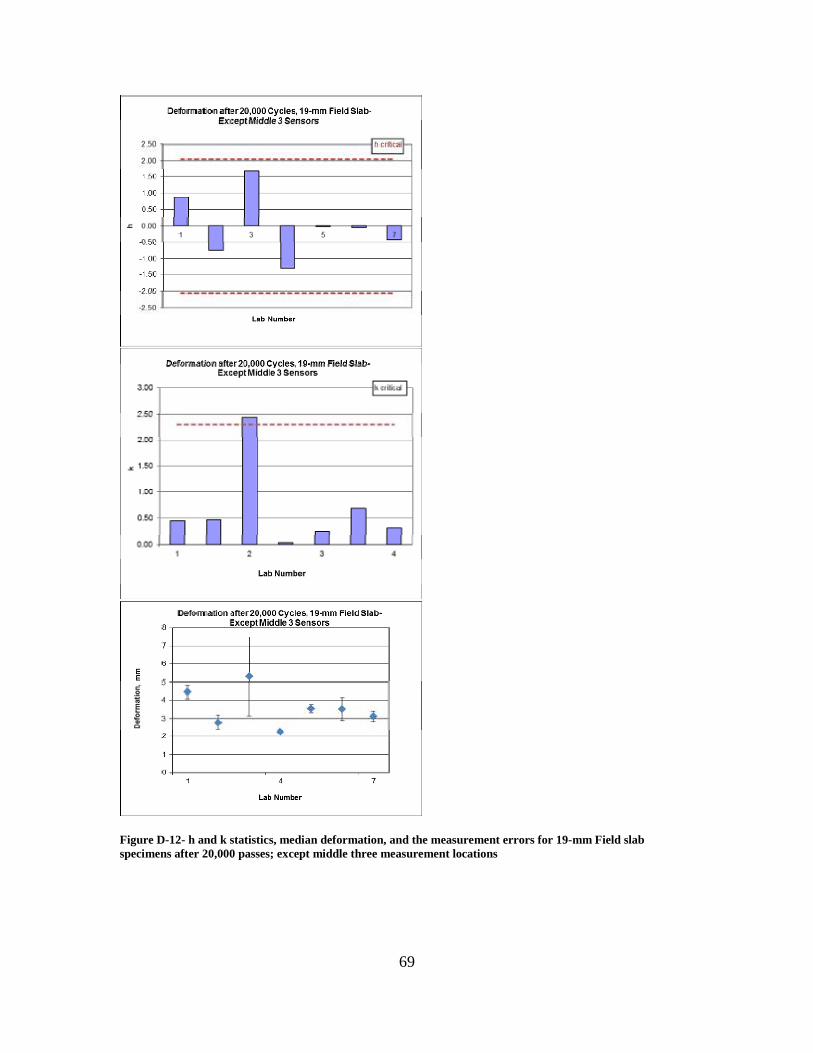
Figure D-12- h and k statistics, median deformation, and the measurement errors for 19-mm Field slab specimens after 20,000 passes; except middle three measurement locations
70
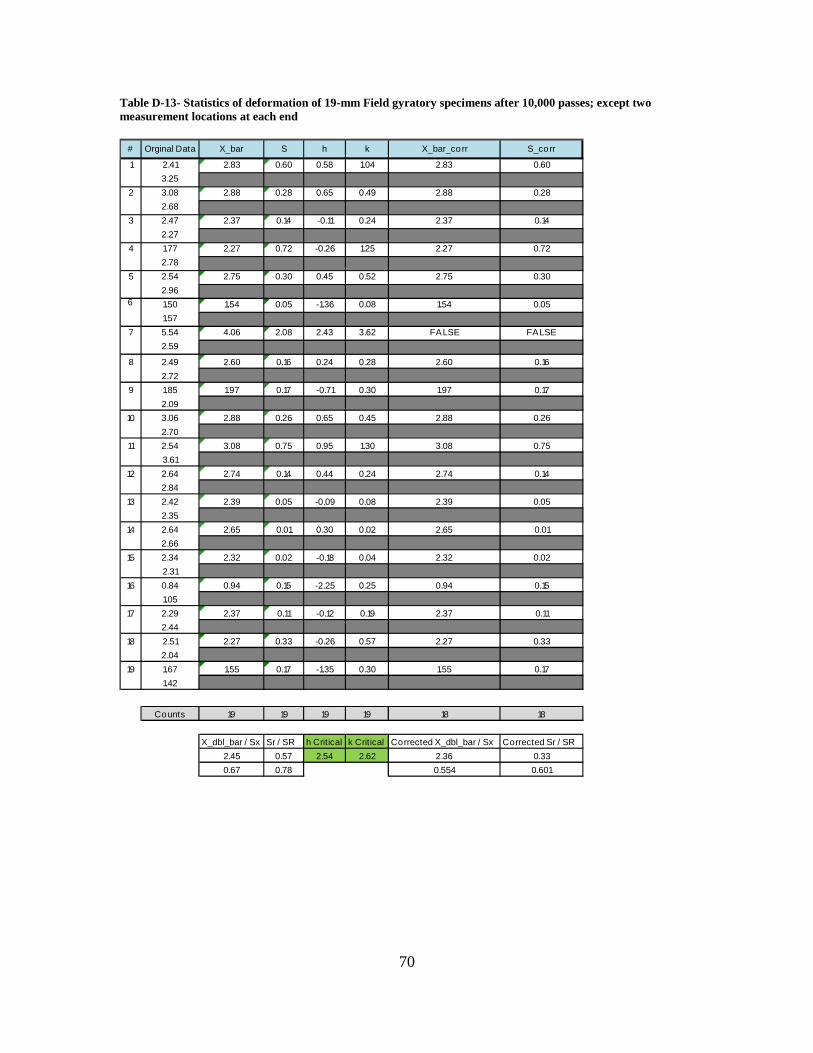
Table D-13- Statistics of deformation of 19-mm Field gyratory specimens after 10,000 passes; except two measurement locations at each end
# Orginal Data X_bar S h k X_bar_corr S_corr
1 2.41 2.83 0.60 0.58 1.04 2.83 0.603.25
2 3.08 2.88 0.28 0.65 0.49 2.88 0.282.68
3 2.47 2.37 0.14 -0.11 0.24 2.37 0.142.27
4 1.77 2.27 0.72 -0.26 1.25 2.27 0.722.78
5 2.54 2.75 0.30 0.45 0.52 2.75 0.302.96
6 1.50 1.54 0.05 -1.36 0.08 1.54 0.051.57
7 5.54 4.06 2.08 2.43 3.62 FALSE FALSE2.59
8 2.49 2.60 0.16 0.24 0.28 2.60 0.162.72
9 1.85 1.97 0.17 -0.71 0.30 1.97 0.172.09
10 3.06 2.88 0.26 0.65 0.45 2.88 0.262.70
11 2.54 3.08 0.75 0.95 1.30 3.08 0.753.61
12 2.64 2.74 0.14 0.44 0.24 2.74 0.142.84
13 2.42 2.39 0.05 -0.09 0.08 2.39 0.052.35
14 2.64 2.65 0.01 0.30 0.02 2.65 0.012.66
15 2.34 2.32 0.02 -0.18 0.04 2.32 0.022.31
16 0.84 0.94 0.15 -2.25 0.25 0.94 0.151.05
17 2.29 2.37 0.11 -0.12 0.19 2.37 0.112.44
18 2.51 2.27 0.33 -0.26 0.57 2.27 0.332.04
19 1.67 1.55 0.17 -1.35 0.30 1.55 0.171.42
Counts 19 19 19 19 18 18
X_dbl_bar / Sx Sr / SR h Critical k Critical Corrected X_dbl_bar / Sx Corrected Sr / SR2.45 0.57 2.54 2.62 2.36 0.330.67 0.78 0.554 0.601
71
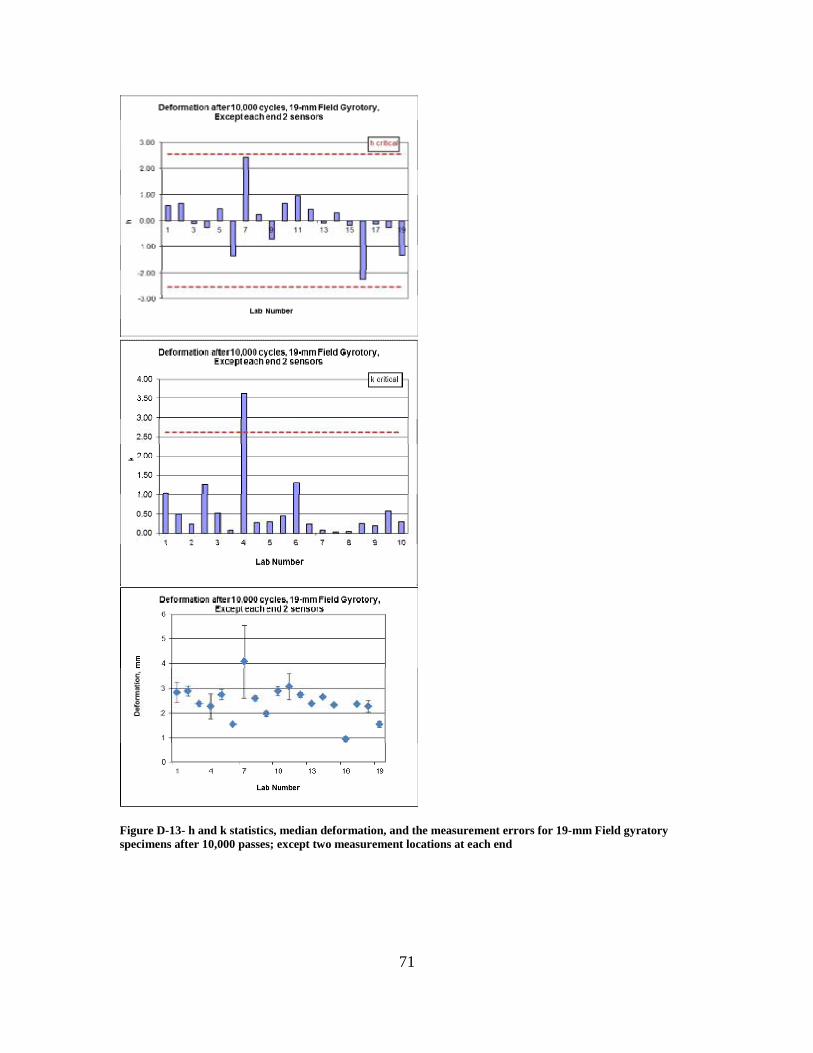
Figure D-13- h and k statistics, median deformation, and the measurement errors for 19-mm Field gyratory specimens after 10,000 passes; except two measurement locations at each end

72
Table D-14- Statistics of deformation of 19-mm Field gyratory specimens after 15,000 passes; except two measurement locations at each end
# Orginal Data X_bar S h k X_bar_corr S_corr
1 2.56 3.14 0.82 0.44 1.01 3.14 0.823.72
2 3.39 3.18 0.30 0.49 0.37 3.18 0.302.97
3 2.77 2.64 0.18 -0.16 0.22 2.64 0.182.51
4 1.94 2.51 0.82 -0.32 1.01 2.51 0.823.09
5 2.79 3.00 0.29 0.27 0.36 3.00 0.293.20
6 1.63 1.64 0.01 -1.39 0.02 1.64 0.011.65
7 7.29 5.10 3.11 2.84 3.84 FALSE FALSE2.90
8 2.71 2.89 0.25 0.13 0.31 2.89 0.253.06
9 2.09 2.28 0.26 -0.61 0.32 2.28 0.262.46
10 3.46 3.23 0.33 0.56 0.41 3.23 0.333.00
11 2.99 3.56 0.81 0.96 1.00 3.56 0.814.13
12 2.93 3.07 0.20 0.36 0.25 3.07 0.203.21
13 2.75 2.74 0.02 -0.04 0.02 2.74 0.022.73
14 3.00 2.99 0.02 0.26 0.02 2.99 0.022.98
15 2.64 2.60 0.05 -0.22 0.07 2.60 0.052.56
16 0.99 1.13 0.20 -2.02 0.24 1.13 0.201.27
17 2.56 2.63 0.11 -0.17 0.14 2.63 0.112.71
18 2.90 2.58 0.46 -0.24 0.57 2.58 0.462.25
19 1.97 1.84 0.18 -1.14 0.23 1.84 0.181.71
Counts 19 19 19 19 18 18
X_dbl_bar / Sx Sr / SR h Critical k Critical Corrected X_dbl_bar / Sx Corrected Sr / SR2.78 0.81 2.54 2.62 2.65 0.390.82 1.00 0.609 0.669

73
Figure D-14- h and k statistics, median deformation, and the measurement errors for 19-mm Field gyratory specimens after 15,000 passes; except two measurement locations at each end

74
Table D-15- Statistics of deformation of 19-mm Field gyratory specimens after 20,000 passes; except two measurement locations at each end
# Orginal Data X_bar S h k X_bar_corr S_corr
1 2.72 3.37 0.91 0.35 0.85 3.37 0.914.01
2 3.65 3.33 0.46 0.31 0.43 3.33 0.463.01
3 3.03 2.85 0.25 -0.17 0.23 2.85 0.252.68
4 2.02 2.68 0.94 -0.34 0.87 2.68 0.943.35
5 3.00 3.21 0.30 0.19 0.28 3.21 0.303.42
6 1.71 1.74 0.05 -1.28 0.05 1.74 0.051.78
7 9.15 6.14 4.25 3.13 3.96 FALSE FALSE3.14
8 2.90 3.12 0.32 0.10 0.30 3.12 0.323.35
9 2.24 2.48 0.34 -0.54 0.32 2.48 0.342.73
10 3.84 3.55 0.41 0.53 0.38 3.55 0.413.26
11 3.31 3.96 0.93 0.94 0.86 3.96 0.934.62
12 3.13 3.32 0.26 0.29 0.24 3.32 0.263.50
13 2.93 2.98 0.07 -0.04 0.06 2.98 0.073.03
14 3.28 3.09 0.27 0.07 0.25 3.09 0.272.90
15 2.89 2.85 0.05 -0.17 0.05 2.85 0.052.82
16 1.16 1.30 0.20 -1.73 0.19 1.30 0.201.44
17 2.73 2.82 0.13 -0.20 0.12 2.82 0.132.91
18 3.16 2.81 0.49 -0.21 0.46 2.81 0.492.46
19 1.94 1.80 0.19 -1.22 0.18 1.80 0.191.67
Counts 19 19 19 19 18 18
X_dbl_bar / Sx Sr / SR h Critical k Critical Corrected X_dbl_bar / Sx Corrected Sr / SR3.02 1.07 2.54 2.62 2.85 0.461.00 1.25 0.669 0.744

75
Figure D-15- h and k statistics, median deformation, and the measurement errors for 19-mm Field gyratory specimens after 20,000 passes; except two measurement locations at each end
76
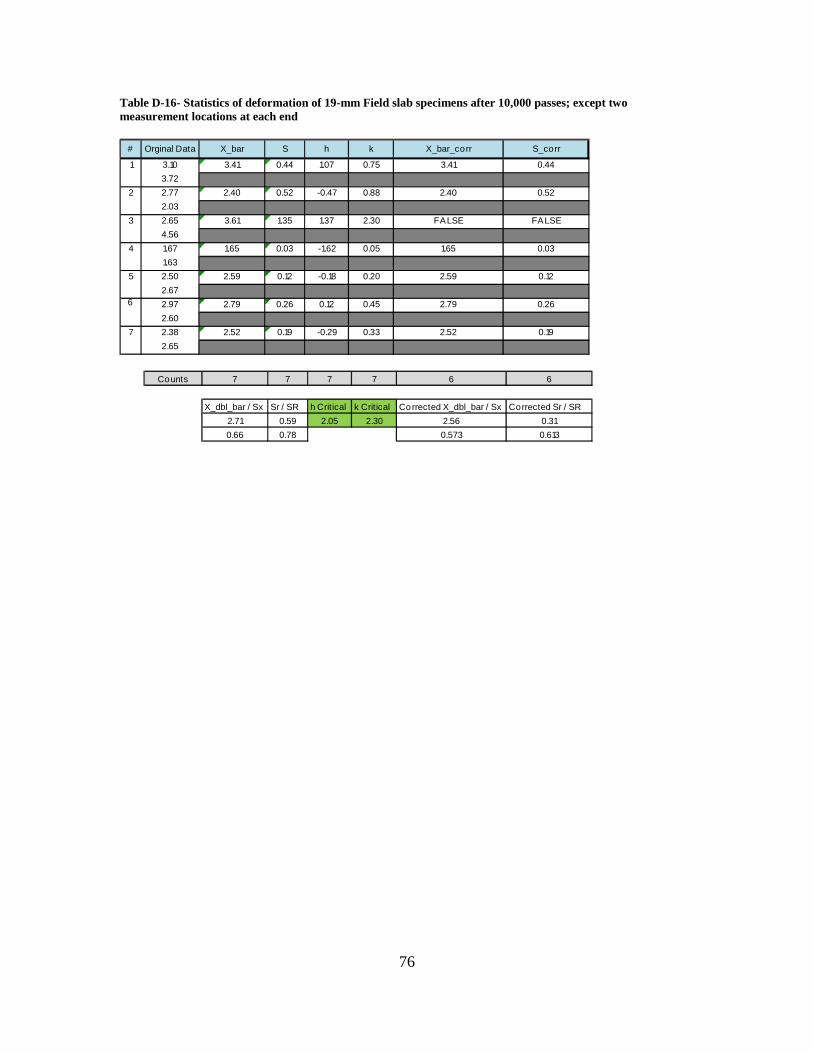
Table D-16- Statistics of deformation of 19-mm Field slab specimens after 10,000 passes; except two measurement locations at each end
# Orginal Data X_bar S h k X_bar_corr S_corr
1 3.10 3.41 0.44 1.07 0.75 3.41 0.443.72
2 2.77 2.40 0.52 -0.47 0.88 2.40 0.522.03
3 2.65 3.61 1.35 1.37 2.30 FALSE FALSE4.56
4 1.67 1.65 0.03 -1.62 0.05 1.65 0.031.63
5 2.50 2.59 0.12 -0.18 0.20 2.59 0.122.67
6 2.97 2.79 0.26 0.12 0.45 2.79 0.262.60
7 2.38 2.52 0.19 -0.29 0.33 2.52 0.192.65
Counts 7 7 7 7 6 6
X_dbl_bar / Sx Sr / SR h Critical k Critical Corrected X_dbl_bar / Sx Corrected Sr / SR2.71 0.59 2.05 2.30 2.56 0.310.66 0.78 0.573 0.613
77
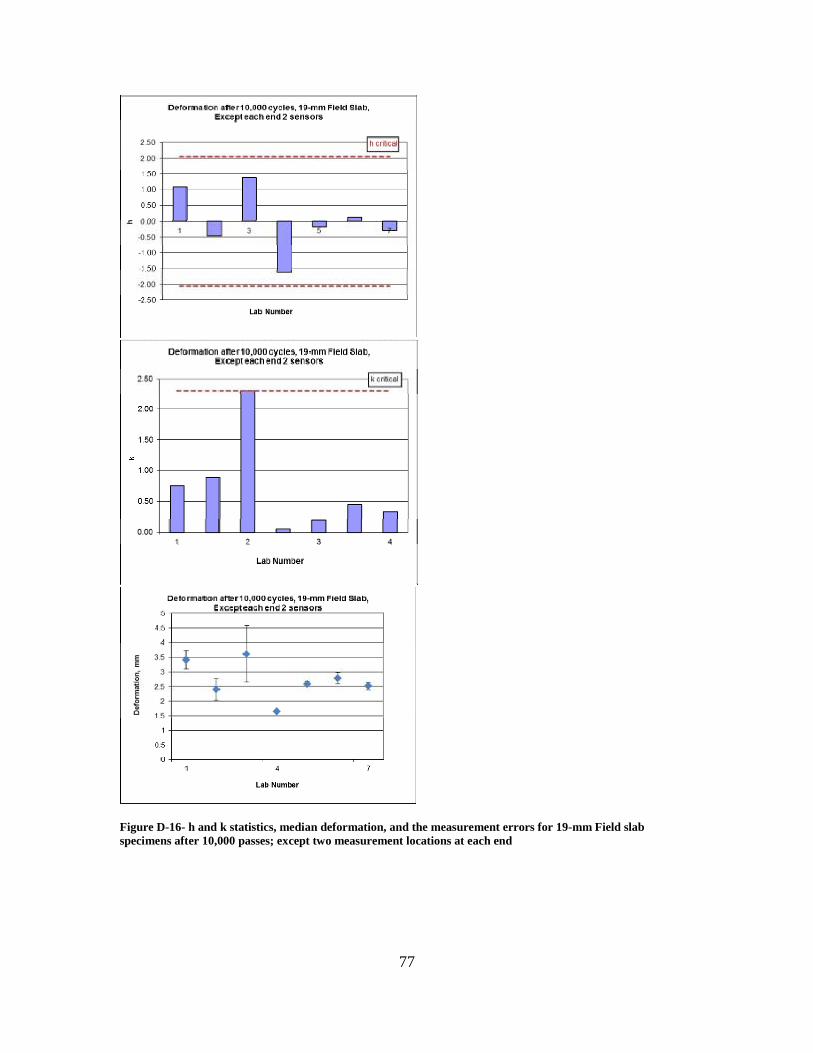
Figure D-16- h and k statistics, median deformation, and the measurement errors for 19-mm Field slab specimens after 10,000 passes; except two measurement locations at each end

78
Table D-17- Statistics of deformation of 19-mm Field slab specimens after 15,000 passes; except two measurement locations at each end
# Orginal Data X_bar S h k X_bar_corr S_corr
1 3.64 4.05 0.59 1.08 0.69 4.05 0.594.47
2 2.97 2.63 0.47 -0.60 0.55 2.63 0.472.30
3 2.91 4.33 2.00 1.41 2.36 FALSE FALSE5.75
4 1.86 1.86 0.00 -1.52 0.00 1.86 0.001.86
5 2.86 3.01 0.21 -0.15 0.24 3.01 0.213.16
6 3.70 3.25 0.63 0.13 0.74 3.25 0.632.80
7 2.73 2.83 0.14 -0.37 0.17 2.83 0.142.93
Counts 7 7 7 7 6 6
X_dbl_bar / Sx Sr / SR h Critical k Critical Corrected X_dbl_bar / Sx Corrected Sr / SR3.14 0.85 2.05 2.30 2.94 0.410.84 1.04 0.723 0.780

79
Figure D-17- h and k statistics, median deformation, and the measurement errors for 19-mm Field slab specimens after 15,000 passes; except two measurement locations at each end

80
Table D-18- Statistics of deformation of 19-mm Field slab specimens after 20,000 passes; except two measurement locations at each end
# Orginal Data X_bar S h k X_bar_corr S_corr1 4.08 4.62 0.77 1.10 0.68 4.62 0.77
5.162 3.15 2.82 0.48 -0.65 0.42 2.82 0.48
2.483 3.11 5.03 2.71 1.50 2.40 FALSE FALSE
6.954 2.00 2.05 0.07 -1.40 0.06 2.05 0.07
2.105 3.19 3.38 0.28 -0.10 0.25 3.38 0.28
3.586 3.95 3.45 0.71 -0.04 0.63 3.45 0.71
2.957 2.75 3.07 0.45 -0.40 0.40 3.07 0.45
3.39
Counts 7 7 7 7 6 6
X_dbl_bar / Sx Sr / SR h Critical k Critical Corrected X_dbl_bar / Sx Corrected Sr / SR3.49 1.13 2.05 2.30 3.23 0.521.03 1.30 0.848 0.924

81
Figure D-18- h and k statistics, median deformation, and the measurement errors for 19-mm Field slab specimens after 20,000 passes; except two measurement locations at each end

82
APPENDIX E- STATISTICS OF NUMBER OF PASSES TO THRESHOLD RUT DEPTH OF WYOMING SPECIMENS
83
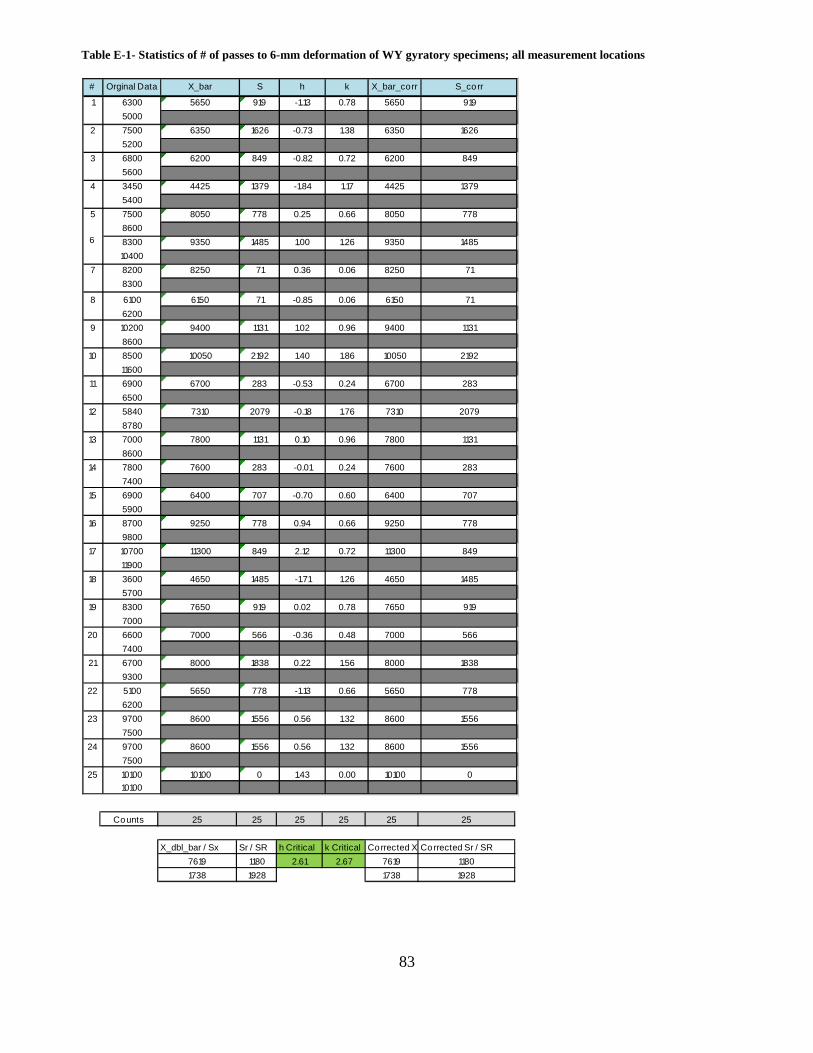
Table E-1- Statistics of # of passes to 6-mm deformation of WY gyratory specimens; all measurement locations
# Orginal Data X_bar S h k X_bar_corr S_corr
1 6300 5650 919 -1.13 0.78 5650 9195000
2 7500 6350 1626 -0.73 1.38 6350 16265200
3 6800 6200 849 -0.82 0.72 6200 8495600
4 3450 4425 1379 -1.84 1.17 4425 13795400
5 7500 8050 778 0.25 0.66 8050 7788600
6 8300 9350 1485 1.00 1.26 9350 148510400
7 8200 8250 71 0.36 0.06 8250 718300
8 6100 6150 71 -0.85 0.06 6150 716200
9 10200 9400 1131 1.02 0.96 9400 11318600
10 8500 10050 2192 1.40 1.86 10050 219211600
11 6900 6700 283 -0.53 0.24 6700 2836500
12 5840 7310 2079 -0.18 1.76 7310 20798780
13 7000 7800 1131 0.10 0.96 7800 11318600
14 7800 7600 283 -0.01 0.24 7600 2837400
15 6900 6400 707 -0.70 0.60 6400 7075900
16 8700 9250 778 0.94 0.66 9250 7789800
17 10700 11300 849 2.12 0.72 11300 84911900
18 3600 4650 1485 -1.71 1.26 4650 14855700
19 8300 7650 919 0.02 0.78 7650 9197000
20 6600 7000 566 -0.36 0.48 7000 5667400
21 6700 8000 1838 0.22 1.56 8000 18389300
22 5100 5650 778 -1.13 0.66 5650 7786200
23 9700 8600 1556 0.56 1.32 8600 15567500
24 9700 8600 1556 0.56 1.32 8600 15567500
25 10100 10100 0 1.43 0.00 10100 010100
Counts 25 25 25 25 25 25
X_dbl_bar / Sx Sr / SR h Critical k Critical Corrected X_dbl_bar / SxCorrected Sr / SR7619 1180 2.61 2.67 7619 11801738 1928 1738 1928
84
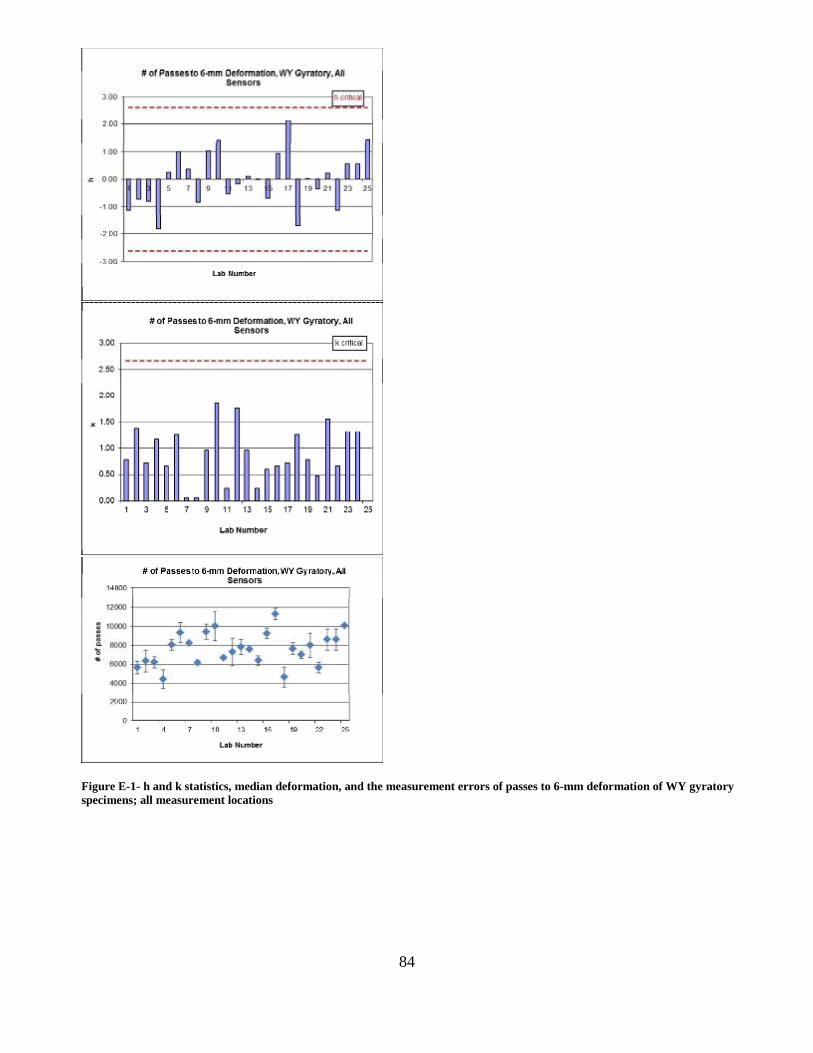
Figure E-1- h and k statistics, median deformation, and the measurement errors of passes to 6-mm deformation of WY gyratory specimens; all measurement locations
85
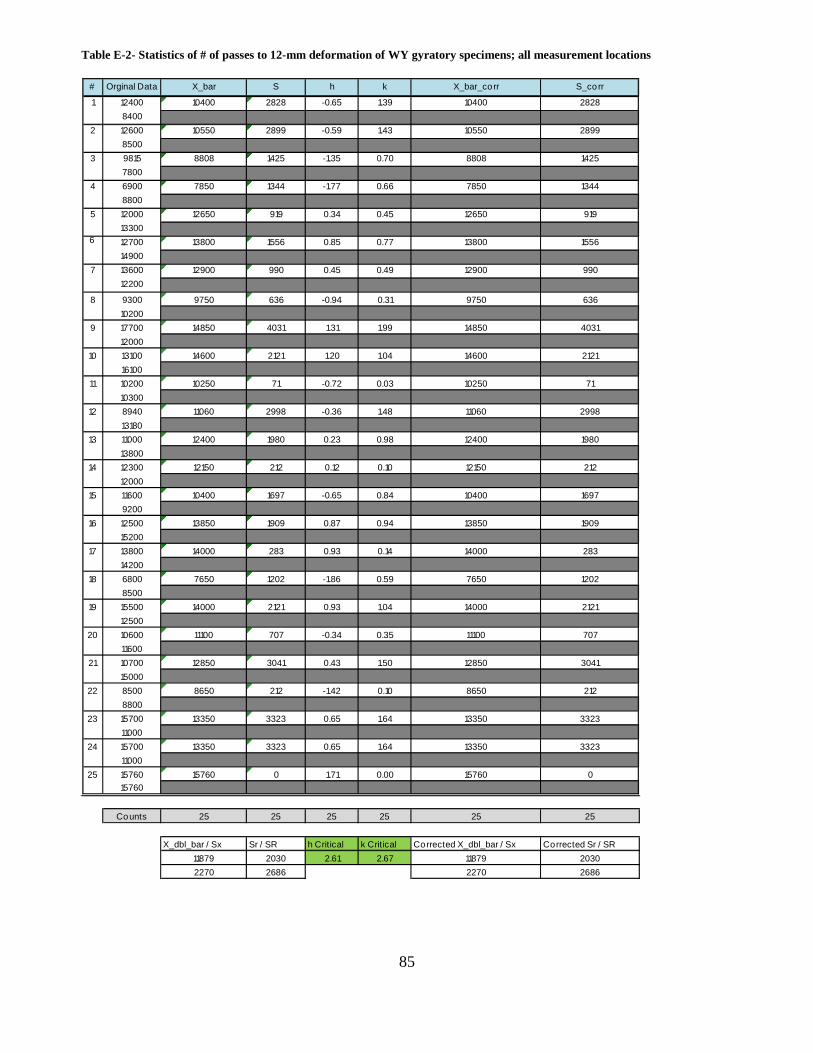
Table E-2- Statistics of # of passes to 12-mm deformation of WY gyratory specimens; all measurement locations
# Orginal Data X_bar S h k X_bar_corr S_corr
1 12400 10400 2828 -0.65 1.39 10400 28288400
2 12600 10550 2899 -0.59 1.43 10550 28998500
3 9815 8808 1425 -1.35 0.70 8808 14257800
4 6900 7850 1344 -1.77 0.66 7850 13448800
5 12000 12650 919 0.34 0.45 12650 91913300
6 12700 13800 1556 0.85 0.77 13800 155614900
7 13600 12900 990 0.45 0.49 12900 99012200
8 9300 9750 636 -0.94 0.31 9750 63610200
9 17700 14850 4031 1.31 1.99 14850 403112000
10 13100 14600 2121 1.20 1.04 14600 212116100
11 10200 10250 71 -0.72 0.03 10250 7110300
12 8940 11060 2998 -0.36 1.48 11060 299813180
13 11000 12400 1980 0.23 0.98 12400 198013800
14 12300 12150 212 0.12 0.10 12150 21212000
15 11600 10400 1697 -0.65 0.84 10400 16979200
16 12500 13850 1909 0.87 0.94 13850 190915200
17 13800 14000 283 0.93 0.14 14000 28314200
18 6800 7650 1202 -1.86 0.59 7650 12028500
19 15500 14000 2121 0.93 1.04 14000 212112500
20 10600 11100 707 -0.34 0.35 11100 70711600
21 10700 12850 3041 0.43 1.50 12850 304115000
22 8500 8650 212 -1.42 0.10 8650 2128800
23 15700 13350 3323 0.65 1.64 13350 332311000
24 15700 13350 3323 0.65 1.64 13350 332311000
25 15760 15760 0 1.71 0.00 15760 015760
Counts 25 25 25 25 25 25
X_dbl_bar / Sx Sr / SR h Critical k Critical Corrected X_dbl_bar / Sx Corrected Sr / SR11879 2030 2.61 2.67 11879 20302270 2686 2270 2686

86
Figure E-2- h and k statistics, median deformation, and the measurement errors for # of passes to 12-mm deformation of WY gyratory specimens; all measurement locations

87
Table E-3- Statistics of # of passes to 6-mm deformation of WY slab specimens; all measurement locations
# Orginal Data X_bar S h k X_bar_corr S_corr
1 12300 11700 849 -0.08 0.52 11700 84911100
2 14300 12600 2404 0.35 1.48 12600 240410900
3 10000 10650 919 -0.58 0.57 10650 91911300
4 15500 16550 1485 2.24 0.92 16550 148517600
5 12200 12500 424 0.30 0.26 12500 42412800
6 9300 8550 1061 -1.59 0.65 8550 10617800
7 9900 10450 778 -0.68 0.48 10450 77811000
8 13400 10800 3677 -0.51 2.27 10800 36778200
9 12400 12150 354 0.13 0.22 12150 35411900
10 13500 12750 1061 0.42 0.65 12750 106112000
Counts 10 10 10 10 10 10
X_dbl_bar / Sx Sr / SR h Critical k Critical Corrected X_dbl_bar / SxCorrected Sr / SR11870 1620 2.29 2.45 11870 16202092 2385 2092 2385
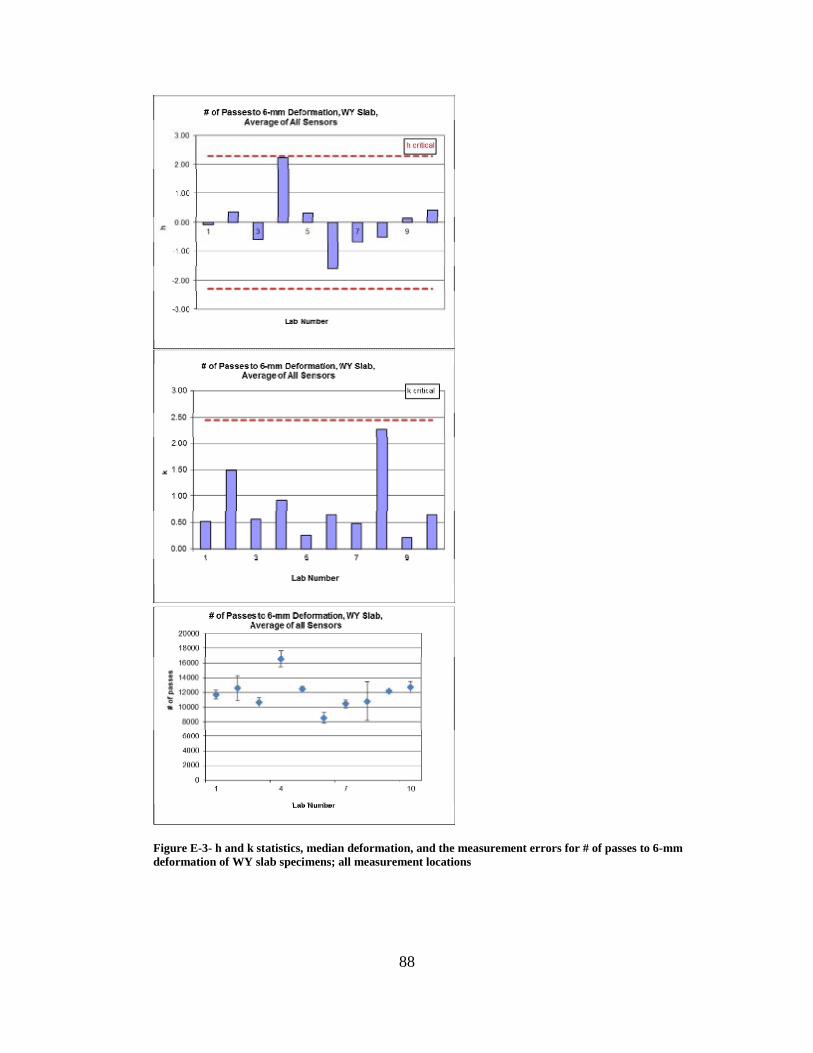
88
Figure E-3- h and k statistics, median deformation, and the measurement errors for # of passes to 6-mm deformation of WY slab specimens; all measurement locations

89
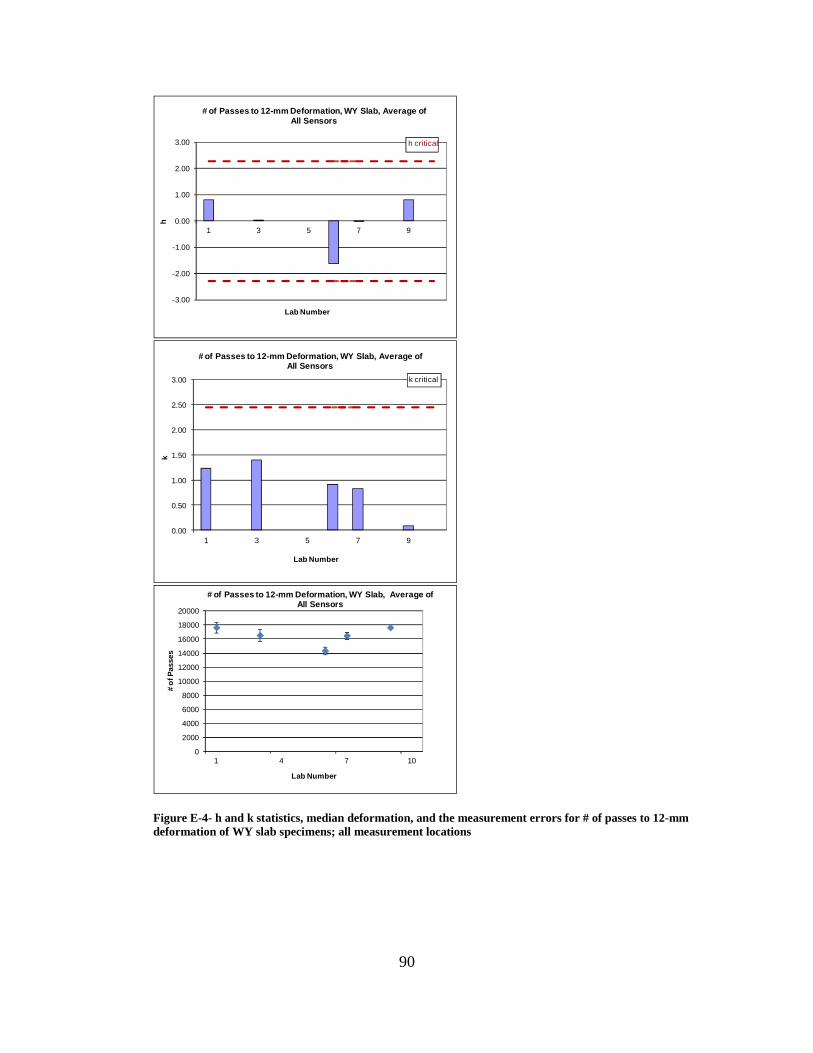
Table E-4- Statistics of # of passes to 12-mm deformation of WY slab specimens; all measurement locations
# Orginal Data X_bar S h k X_bar_corr S_corr
1 18400 17650 1061 0.82 1.24 17650 106116900
2
3 15700 16550 1202 0.01 1.40 16550 120217400
4
5
6 14900 14350 778 -1.63 0.91 14350 77813800
7 16000 16500 707 -0.03 0.82 16500 70717000
8
9 17600 17650 71 0.82 0.08 17650 7117700
Counts 5 5 5 5 5 5
X_dbl_bar / Sx Sr / SR h Critical k Critical Corrected X_dbl_bar / SxCorrected Sr / SR16540 858 1.74 2.11 16540 8581347 1478 1347 1478
90
-3.00
-2.00
-1.00
0.00
1.00
2.00
3.00
1 3 5 7 9
h
Lab Number
# of Passes to 12-mm Deformation, WY Slab, Average of All Sensors
h critical
0.00
0.50
1.00
1.50
2.00
2.50
3.00
1 3 5 7 9
k
Lab Number
# of Passes to 12-mm Deformation, WY Slab, Average of All Sensors
k critical
0
2000
4000
6000
8000
10000
12000
14000
16000
18000
20000
1 4 7 10
# of
Pas
ses
Lab Number
# of Passes to 12-mm Deformation, WY Slab, Average of All Sensors
Figure E-4- h and k statistics, median deformation, and the measurement errors for # of passes to 12-mm deformation of WY slab specimens; all measurement locations

91
Table E-5- Statistics of # of passes to 6-mm deformation of WY Gyratory specimens; except middle three measurement locations
# Orginal Data X_bar S h k X_bar_corr S_corr
1 7300 6350 1344 -1.02 1.06 6350 13445400
2 8400 6900 2121 -0.71 1.68 6900 21215400
3 7300 6500 1131 -0.93 0.90 6500 11315700
4 4400 5200 1131 -1.65 0.90 5200 11316000
5 7700 8450 1061 0.14 0.84 8450 10619200
6 9300 10100 1131 1.05 0.90 10100 113110900
7 9700 9150 778 0.53 0.62 9150 7788600
8 6900 6800 141 -0.77 0.11 6800 1416700
9 10800 9800 1414 0.89 1.12 9800 14148800
10 9300 10750 2051 1.41 1.63 10750 205112200
11 6900 6950 71 -0.68 0.06 6950 717000
12 5940 7450 2135 -0.41 1.69 7450 21358960
13 7500 8200 990 0.00 0.78 8200 9908900
14 8100 8000 141 -0.11 0.11 8000 1417900
15 7000 6500 707 -0.93 0.56 6500 7076000
16 9100 10200 1556 1.11 1.23 10200 155611300
17 11000 12000 1414 2.10 1.12 12000 141413000
18 4000 4900 1273 -1.81 1.01 4900 12735800
19 10000 8900 1556 0.39 1.23 8900 15567800
20 7500 7650 212 -0.30 0.17 7650 2127800
21 8100 8700 849 0.28 0.67 8700 8499300
22 5600 6350 1061 -1.02 0.84 6350 10617100
23 10400 9250 1626 0.58 1.29 9250 16268100
24 10400 9250 1626 0.58 1.29 9250 16268100
25 10520 10520 0 1.28 0.00 10520 010520
Counts 25 25 25 25 25 25
X_dbl_bar / Sx Sr / SR h Critical k Critical Corrected X_dbl_bar / Sx Corrected Sr / SR8193 1262 2.61 2.67 8193 12621815 2022 1815 2022

92
-3.00
-2.00
-1.00
0.00
1.00
2.00
3.00
1 3 5 7 9 11 13 15 17 19 21 23 25
h
Lab Number
# of Passes to 6-mm Deformation, WY Gyratory, Except Middle 3 Sensors
h critical
0.00
0.50
1.00
1.50
2.00
2.50
3.00
1 3 5 7 9 11 13 15 17 19 21 23 25
k
Lab Number
# of Passes to 6-mm Deformation, WY Gyratory, Except Middle 3 Sensors
k critical
0
2000
4000
6000
8000
10000
12000
14000
1 4 7 10 13 16 19 22 25
# of
Pas
ses
Lab Number
# of Passes to 6-mm Deformation, WY Gyratory, Except Middle 3 Sensors
Figure E-5- h and k statistics, median deformation, and the measurement errors of # of passes to 6-mm deformation of WY Gyratory specimens; except middle three measurement locations
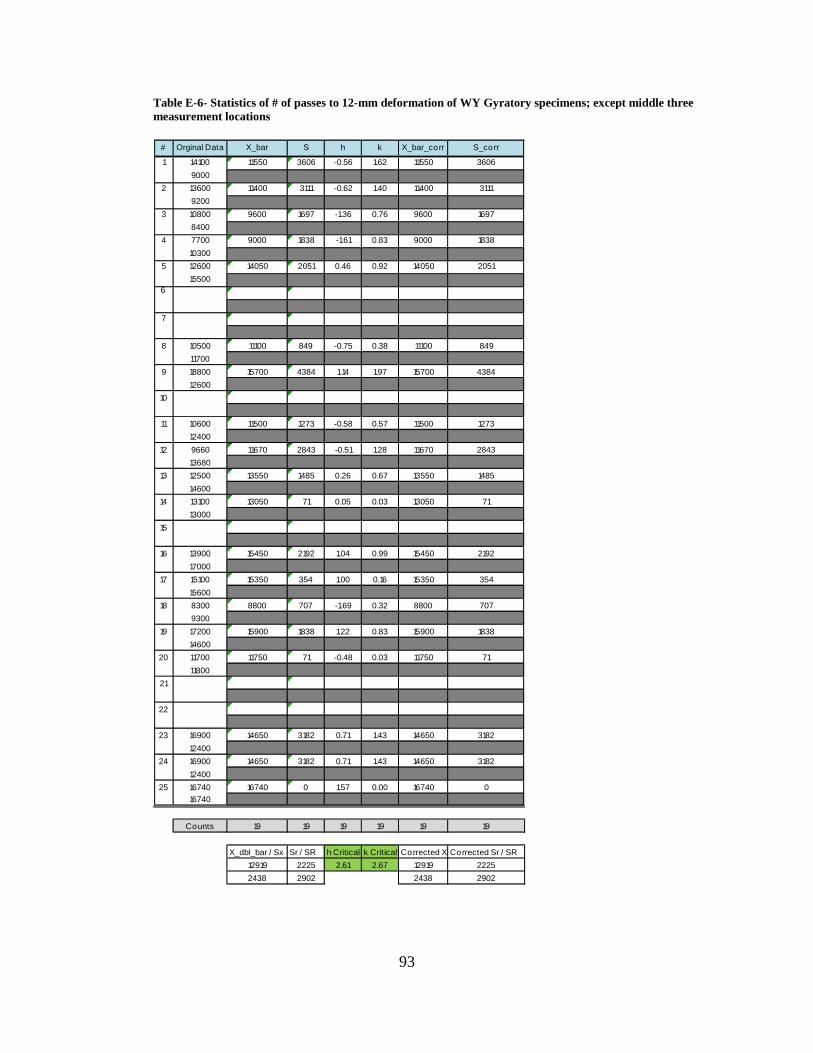
93
Table E-6- Statistics of # of passes to 12-mm deformation of WY Gyratory specimens; except middle three measurement locations
# Orginal Data X_bar S h k X_bar_corr S_corr
1 14100 11550 3606 -0.56 1.62 11550 36069000
2 13600 11400 3111 -0.62 1.40 11400 31119200
3 10800 9600 1697 -1.36 0.76 9600 16978400
4 7700 9000 1838 -1.61 0.83 9000 183810300
5 12600 14050 2051 0.46 0.92 14050 205115500
6
7
8 10500 11100 849 -0.75 0.38 11100 84911700
9 18800 15700 4384 1.14 1.97 15700 438412600
10
11 10600 11500 1273 -0.58 0.57 11500 127312400
12 9660 11670 2843 -0.51 1.28 11670 284313680
13 12500 13550 1485 0.26 0.67 13550 148514600
14 13100 13050 71 0.05 0.03 13050 7113000
15
16 13900 15450 2192 1.04 0.99 15450 219217000
17 15100 15350 354 1.00 0.16 15350 35415600
18 8300 8800 707 -1.69 0.32 8800 7079300
19 17200 15900 1838 1.22 0.83 15900 183814600
20 11700 11750 71 -0.48 0.03 11750 7111800
21
22
23 16900 14650 3182 0.71 1.43 14650 318212400
24 16900 14650 3182 0.71 1.43 14650 318212400
25 16740 16740 0 1.57 0.00 16740 016740
Counts 19 19 19 19 19 19
X_dbl_bar / Sx Sr / SR h Critical k Critical Corrected X_dbl_bar / SxCorrected Sr / SR12919 2225 2.61 2.67 12919 22252438 2902 2438 2902

94
Figure E-6- h and k statistics, median deformation, and the measurement errors for # of passes to 12-mm deformation of WY gyratory specimens; except middle three measurement locations

95
Table E-7- Statistics of # of passes to 6-mm deformation of WY slab specimens; except middle three measurement locations
# Orginal Data X_bar S h k X_bar_corr S_corr
1 11700 12050 495 -0.03 0.34 12050 49512400
2 14800 12950 2616 0.37 1.82 12950 261611100
3 10400 10850 636 -0.57 0.44 10850 63611300
4 16200 17350 1626 2.32 1.13 FALSE FALSE18500
5 12800 12550 354 0.19 0.25 12550 35412300
6 9100 8550 778 -1.58 0.54 8550 7788000
7 10200 10650 636 -0.65 0.44 10650 63611100
8 13400 11350 2899 -0.34 2.02 11350 28999300
9 12500 12150 495 0.01 0.34 12150 49511800
10 13400 12800 849 0.30 0.59 12800 84912200
Counts 10 10 10 10 9 9
X_dbl_bar / Sx Sr / SR h Critical k Critical Corrected X_dbl_bar / SxCorrected Sr / SR12125 1437 2.29 2.45 11544 14142256 2474 1391 1713

96
-3.00
-2.00
-1.00
0.00
1.00
2.00
3.00
1 3 5 7 9
h
Lab Number
# of Passes to 6-mm Deformation, WY Slab, Except Middle 3 Sensors
h critical
0.00
0.50
1.00
1.50
2.00
2.50
3.00
1 3 5 7 9
k
Lab Number
# of Passes to 6-mm Deformation, WY Slab, Except Middle 3 Sensors
k critical
0
2000
4000
6000
8000
10000
12000
14000
16000
18000
20000
1 4 7 10
# of
Pas
ses
Lab Number
# of Passes to 6-mm Deformation, WY Slab, Except Middle 3 Sensors
Figure D-7- h and k statistics, median deformation, and the measurement errors for # of passes to 6-mm deformation of WY slab specimens; except middle three measurement locations

97
Table E-8- Statistics of # of passes to 12-mm deformation of WY slab specimens; except middle three measurement locations
# Orginal Data X_bar S h k X_bar_corr S_corr
1 18400 18950 778 0.87 1.07 18950 77819500
2
3 17300 18100 1131 0.37 1.55 18100 113118900
4
5
6 14800 14500 424 -1.72 0.58 14500 42414200
7 17400 17700 424 0.14 0.58 17700 42418000
8
9 18500 18050 636 0.34 0.87 18050 63617600
Counts 5 5 5 5 5 5
X_dbl_bar / Sx Sr / SR h Critical k Critical Corrected X_dbl_bar / SxCorrected Sr / SR17460 728 1.74 2.11 17460 7281717 1793 1717 1793

98
-3.00
-2.00
-1.00
0.00
1.00
2.00
3.00
1 3 5 7 9
h
Lab Number
# of Passes to 12-mm Deformation, WY Slab, Except Middle 3 Sensors
h critical
0.00
0.50
1.00
1.50
2.00
2.50
3.00
1 3 5 7 9
k
Lab Number
# of Passes to 12-mm Deformation, WY Slab,Except Middle 3 Sensors
k critical
0
5000
10000
15000
20000
25000
1 4 7 10
# of
Pas
ses
Lab Number
# of Passes to 12-mm Deformation, WY Slab,Except Middle 3 Sensors
Figure E-8- h and k statistics, median deformation, and the measurement errors for # of passes to 12-mm deformation of WY slab specimens; except middle three measurement locations

99
Table E-9- Statistics of # of passes to 6-mm deformation of WY Gyratory specimens; except two measurement locations at each end
# Orginal Data X_bar S h k X_bar_corr S_corr
1 5600.00 5050.00 777.82 -1.20 0.68 5050.00 777.824500.00
2 6400.00 5500.00 1272.79 -0.93 1.12 5500.00 1272.794600.00
3 6200.00 5700.00 707.11 -0.81 0.62 5700.00 707.115200.00
4 2800.00 3800.00 1414.21 -1.95 1.24 3800.00 1414.214800.00
5 7200.00 7650.00 636.40 0.37 0.56 7650.00 636.408100.00
6 7400.00 8650.00 1767.77 0.97 1.55 8650.00 1767.779900.00
7 7600.00 7650.00 70.71 0.37 0.06 7650.00 70.717700.00
8 5600.00 5750.00 212.13 -0.78 0.19 5750.00 212.135900.00
9 9700.00 9000.00 989.95 1.18 0.87 9000.00 989.958300.00
10 7900.00 9500.00 2262.74 1.48 1.99 9500.00 2262.7411100.00
11 6800.00 6350.00 636.40 -0.42 0.56 6350.00 636.405900.00
12 5500.00 6950.00 2050.61 -0.06 1.80 6950.00 2050.618400.00
13 6500.00 7250.00 1060.66 0.13 0.93 7250.00 1060.668000.00
14 7300.00 7150.00 212.13 0.07 0.19 7150.00 212.137000.00
15 6500.00 5900.00 848.53 -0.69 0.75 5900.00 848.535300.00
16 8000.00 8450.00 636.40 0.85 0.56 8450.00 636.408900.00
17 9900.00 10500.00 848.53 2.09 0.75 10500.00 848.5311100.00
18 3200.00 4300.00 1555.63 -1.65 1.37 4300.00 1555.635400.00
19 7500.00 6850.00 919.24 -0.12 0.81 6850.00 919.246200.00
20 6000.00 6350.00 494.97 -0.42 0.44 6350.00 494.976700.00
21 6200.00 7500.00 1838.48 0.28 1.62 7500.00 1838.488800.00
22 4750.00 5275.00 742.46 -1.07 0.65 5275.00 742.465800.00
23 8900.00 8050.00 1202.08 0.61 1.06 8050.00 1202.087200.00
24 8900.00 8050.00 1202.08 0.61 1.06 8050.00 1202.087200.00
25 8860.00 8860.00 0.00 1.10 0.00 8860.00 0.008860.00
Counts 25 25 25 25 25 25
X_dbl_bar / Sx Sr / SR h Critical k Critical Corrected X_dbl_bar / Sx Corrected Sr / SR7041.40 1137.74 2.61 2.67 7041.40 1137.741658.53 1843.35 1658.531 1843.353

100
Figure E-9- h and k statistics, median deformation, and the measurement errors of # of passes to 6-mm deformation of WY Gyratory specimens; except two measurement locations at each end

101
Table E-10- Statistics of # of passes to 12-mm deformation of WY Gyratory specimens; except two measurement locations at each end
# Orginal Data X_bar S h k X_bar_corr S_corr
1 10500.00 9050.00 2050.61 -0.70 1.09 9050.00 2050.617600.00
2 10500.00 8850.00 2333.45 -0.79 1.24 8850.00 2333.457200.00
3 8400.00 7750.00 919.24 -1.31 0.49 7750.00 919.247100.00
4 5900.00 6750.00 1202.08 -1.79 0.64 6750.00 1202.087600.00
5 10800.00 11150.00 494.97 0.30 0.26 11150.00 494.9711500.00
6 10800.00 11900.00 1555.63 0.66 0.83 11900.00 1555.6313000.00
7 12100.00 11500.00 848.53 0.47 0.45 11500.00 848.5310900.00
8 8400.00 8800.00 565.69 -0.82 0.30 8800.00 565.699200.00
9 16300.00 13700.00 3676.96 1.51 1.95 13700.00 3676.9611100.00
10 11200.00 12800.00 2262.74 1.08 1.20 12800.00 2262.7414400.00
11 9700.00 9450.00 353.55 -0.51 0.19 9450.00 353.559200.00
12 8080.00 9790.00 2418.31 -0.35 1.28 9790.00 2418.3111500.00
13 9600.00 11100.00 2121.32 0.28 1.13 11100.00 2121.3212600.00
14 11000.00 10700.00 424.26 0.09 0.23 10700.00 424.2610400.00
15 9800.00 8850.00 1343.50 -0.79 0.71 8850.00 1343.507900.00
16 10700.00 11750.00 1484.92 0.59 0.79 11750.00 1484.9212800.00
17 12800.00 13050.00 353.55 1.20 0.19 13050.00 353.5513300.00
18 5400.00 6500.00 1555.63 -1.91 0.83 6500.00 1555.637600.00
19 13800.00 12300.00 2121.32 0.85 1.13 12300.00 2121.3210800.00
20 9500.00 10150.00 919.24 -0.17 0.49 10150.00 919.2410800.00
21 8900.00 11200.00 3252.69 0.32 1.73 11200.00 3252.6913500.00
22 7600.00 7700.00 141.42 -1.34 0.08 7700.00 141.427800.00
23 14300.00 12000.00 3252.69 0.70 1.73 12000.00 3252.699700.00
24 14300.00 12000.00 3252.69 0.70 1.73 12000.00 3252.699700.00
25 14140.00 14140.00 0.00 1.72 0.00 14140.00 0.0014140.00
Counts 25 25 25 25 25 25
X_dbl_bar / Sx Sr / SR h Critical k Critical Corrected X_dbl_bar / Sx Corrected Sr / SR10517.20 1882.53 2.61 2.67 10517.20 1882.532106.35 2491.72 2106.353 2491.723

102
Figure E-10- h and k statistics, median deformation, and the measurement errors for # of passes to 12-mm deformation of WY gyratory specimens; except two measurement locations at each end

103
Table E-11- Statistics of # of passes to 6-mm deformation of WY slab specimens; except two measurement locations at each end
# Orginal Data X_bar S h k X_bar_corr S_corr
1 11400.00 11050.00 494.97 -0.23 0.28 11050.00 494.9710700.00
2 13900.00 12150.00 2474.87 0.35 1.38 12150.00 2474.8710400.00
3 9800.00 10300.00 707.11 -0.62 0.39 10300.00 707.1110800.00
4 14800.00 15800.00 1414.21 2.26 0.79 15800.00 1414.2116800.00
5 11000.00 11900.00 1272.79 0.22 0.71 11900.00 1272.7912800.00
6 9600.00 8600.00 1414.21 -1.51 0.79 8600.00 1414.217600.00
7 9600.00 10200.00 848.53 -0.67 0.47 10200.00 848.5310800.00
8 13500.00 10500.00 4242.64 -0.51 2.36 10500.00 4242.647500.00
9 11800.00 11900.00 141.42 0.22 0.08 11900.00 141.4212000.00
10 13100.00 12400.00 989.95 0.48 0.55 12400.00 989.9511700.00
Counts 10 10 10 10 10 10
X_dbl_bar / Sx Sr / SR h Critical k Critical Corrected X_dbl_bar / Sx Corrected Sr / SR11480.00 1794.71 2.29 2.45 11480.00 1794.711908.49 2291.91 1908.490 2291.906

104
Figure E-11- h and k statistics, median deformation, and the measurement errors for # of passes to 6-mm deformation of WY slab specimens; except two measurement locations at each end
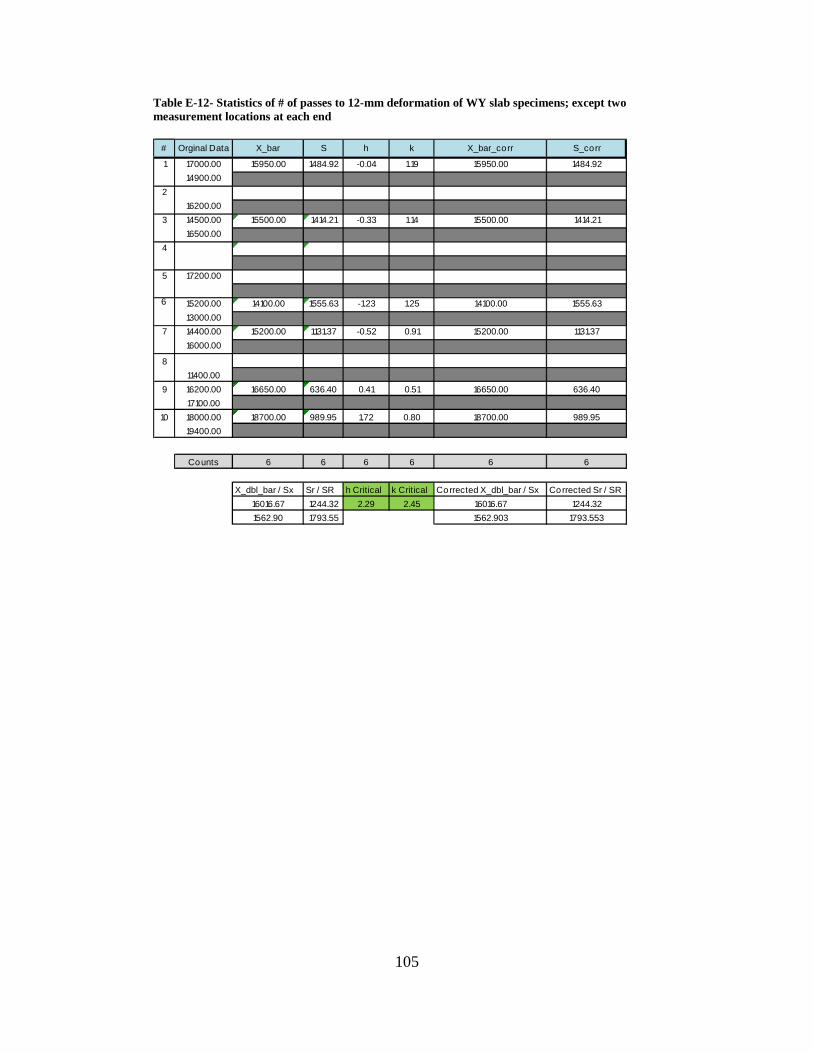
105
Table E-12- Statistics of # of passes to 12-mm deformation of WY slab specimens; except two measurement locations at each end
# Orginal Data X_bar S h k X_bar_corr S_corr
1 17000.00 15950.00 1484.92 -0.04 1.19 15950.00 1484.9214900.00
216200.00
3 14500.00 15500.00 1414.21 -0.33 1.14 15500.00 1414.2116500.00
4
5 17200.00
6 15200.00 14100.00 1555.63 -1.23 1.25 14100.00 1555.6313000.00
7 14400.00 15200.00 1131.37 -0.52 0.91 15200.00 1131.3716000.00
811400.00
9 16200.00 16650.00 636.40 0.41 0.51 16650.00 636.4017100.00
10 18000.00 18700.00 989.95 1.72 0.80 18700.00 989.9519400.00
Counts 6 6 6 6 6 6
X_dbl_bar / Sx Sr / SR h Critical k Critical Corrected X_dbl_bar / Sx Corrected Sr / SR16016.67 1244.32 2.29 2.45 16016.67 1244.321562.90 1793.55 1562.903 1793.553
106
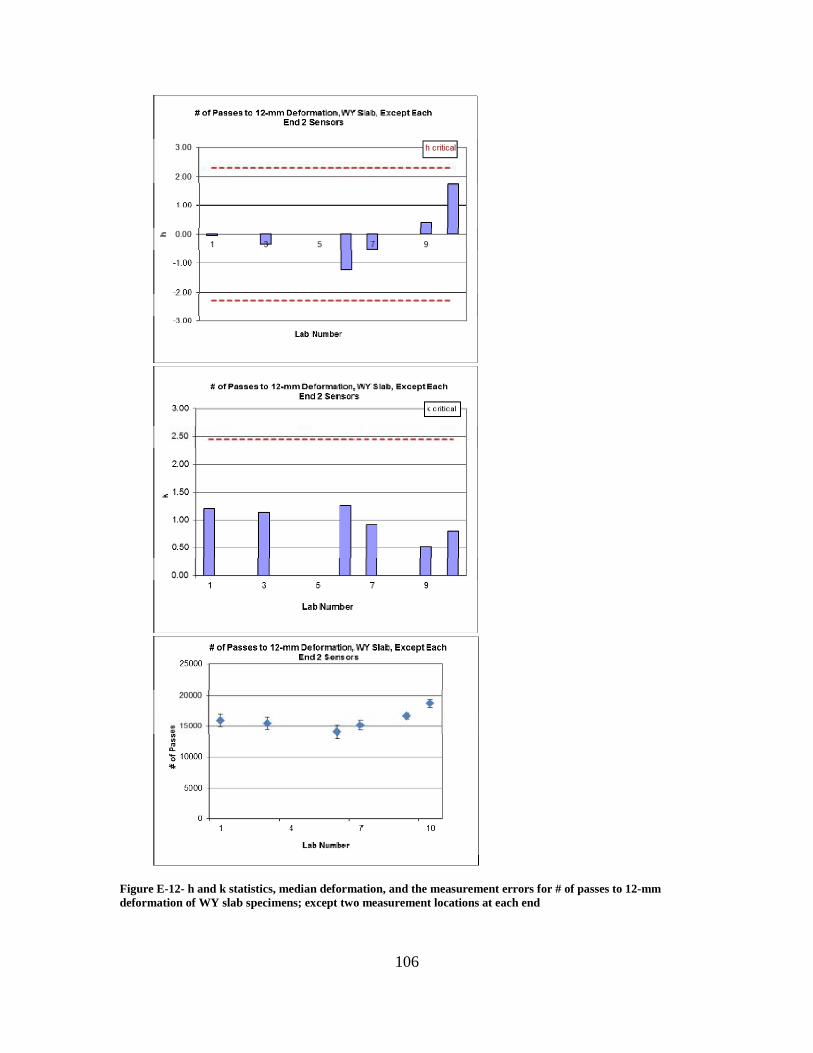
Figure E-12- h and k statistics, median deformation, and the measurement errors for # of passes to 12-mm deformation of WY slab specimens; except two measurement locations at each end

107
APPENDIX F- STATISTICS OF CREEP SLOPE

108
Table F-1- Statistics of creep slope of 19-mm Field gyratory specimens; all measurement locations
# Orginal Data X_bar S h k X_bar_corr S_corr
1 0.07 0.09 0.03 -0.08 0.88 0.09 0.030.11
2 0.10 0.09 0.01 -0.10 0.22 0.09 0.010.09
3 0.09 0.08 0.01 -0.45 0.31 0.08 0.010.07
4 0.05 0.07 0.03 -0.90 0.84 0.07 0.030.09
5 0.09 0.09 0.01 -0.01 0.28 0.09 0.010.10
6 0.06 0.06 0.00 -1.33 0.04 0.06 0.000.06
7 0.25 0.17 0.12 2.74 3.90 FALSE FALSE0.08
8 0.08 0.09 0.01 -0.16 0.42 0.09 0.010.10
9 0.11 0.11 0.01 0.67 0.17 0.11 0.010.11
10 0.10 0.10 0.01 0.19 0.30 0.10 0.010.09
11 0.12 0.14 0.02 1.74 0.72 0.14 0.020.16
12 0.09 0.11 0.03 0.65 0.85 0.11 0.030.13
13 0.08 0.09 0.00 -0.25 0.12 0.09 0.000.09
14 0.10 0.10 0.00 0.08 0.03 0.10 0.000.09
15 0.09 0.08 0.01 -0.30 0.26 0.08 0.010.08
16 0.04 0.04 0.01 -1.82 0.23 0.04 0.010.05
17 0.08 0.08 0.00 -0.39 0.02 0.08 0.000.08
18 0.10 0.08 0.02 -0.31 0.53 0.08 0.020.07
19 0.10 0.09 0.01 0.05 0.37 0.09 0.010.09
Counts 19 19 19 19 18 18
X_dbl_bar / Sx Sr / SR h Critical k Critical Corrected X_dbl_bar / Sx Corrected Sr / SR0.09 0.03 2.54 2.62 0.09 0.010.03 0.03 0.021 0.023
109
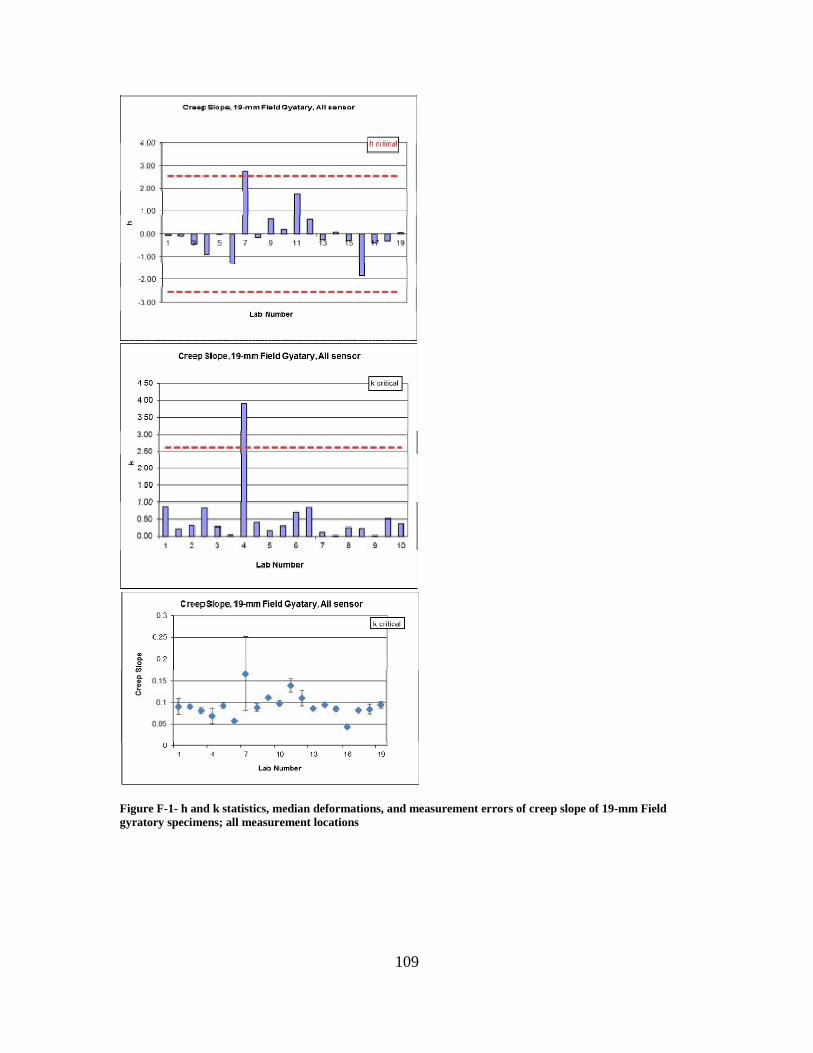
Figure F-1- h and k statistics, median deformations, and measurement errors of creep slope of 19-mm Field gyratory specimens; all measurement locations
110
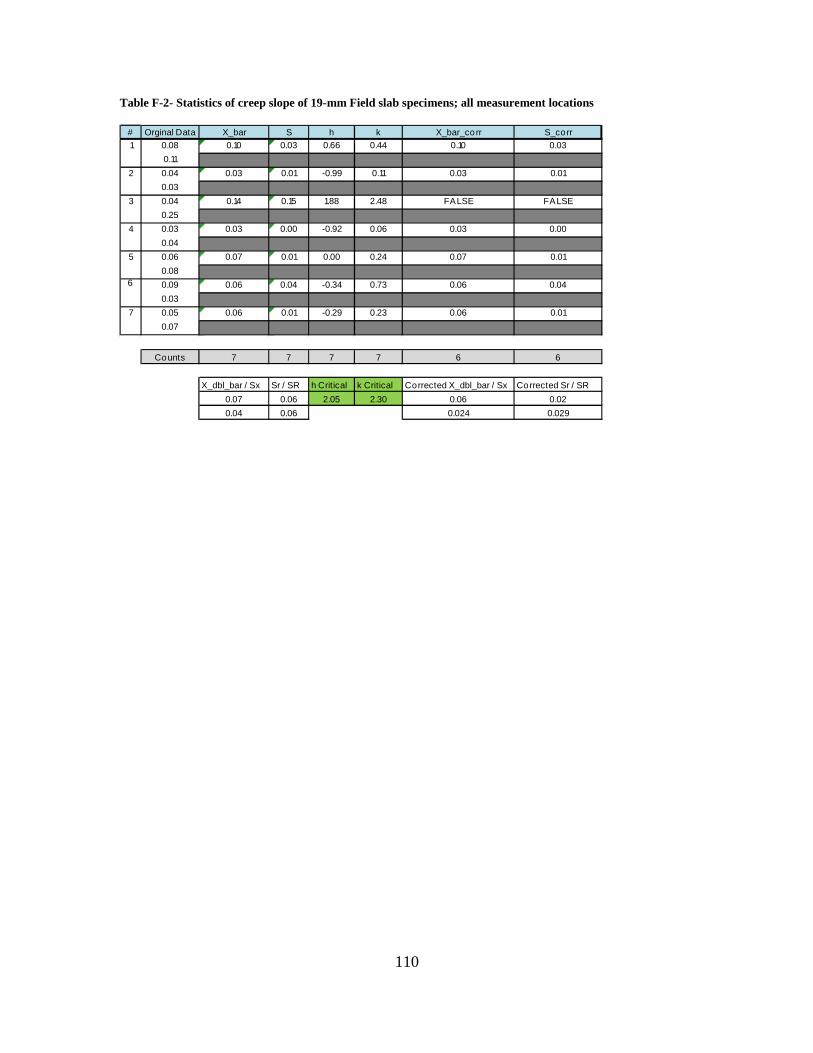
Table F-2- Statistics of creep slope of 19-mm Field slab specimens; all measurement locations
# Orginal Data X_bar S h k X_bar_corr S_corr1 0.08 0.10 0.03 0.66 0.44 0.10 0.03
0.112 0.04 0.03 0.01 -0.99 0.11 0.03 0.01
0.033 0.04 0.14 0.15 1.88 2.48 FALSE FALSE
0.254 0.03 0.03 0.00 -0.92 0.06 0.03 0.00
0.045 0.06 0.07 0.01 0.00 0.24 0.07 0.01
0.086 0.09 0.06 0.04 -0.34 0.73 0.06 0.04
0.037 0.05 0.06 0.01 -0.29 0.23 0.06 0.01
0.07
Counts 7 7 7 7 6 6
X_dbl_bar / Sx Sr / SR h Critical k Critical Corrected X_dbl_bar / Sx Corrected Sr / SR0.07 0.06 2.05 2.30 0.06 0.020.04 0.06 0.024 0.029

111
Figure F-2- h and k statistics, median deformations, and measurement errors of creep slope of 19-mm Field slab specimens; all measurement locations
112
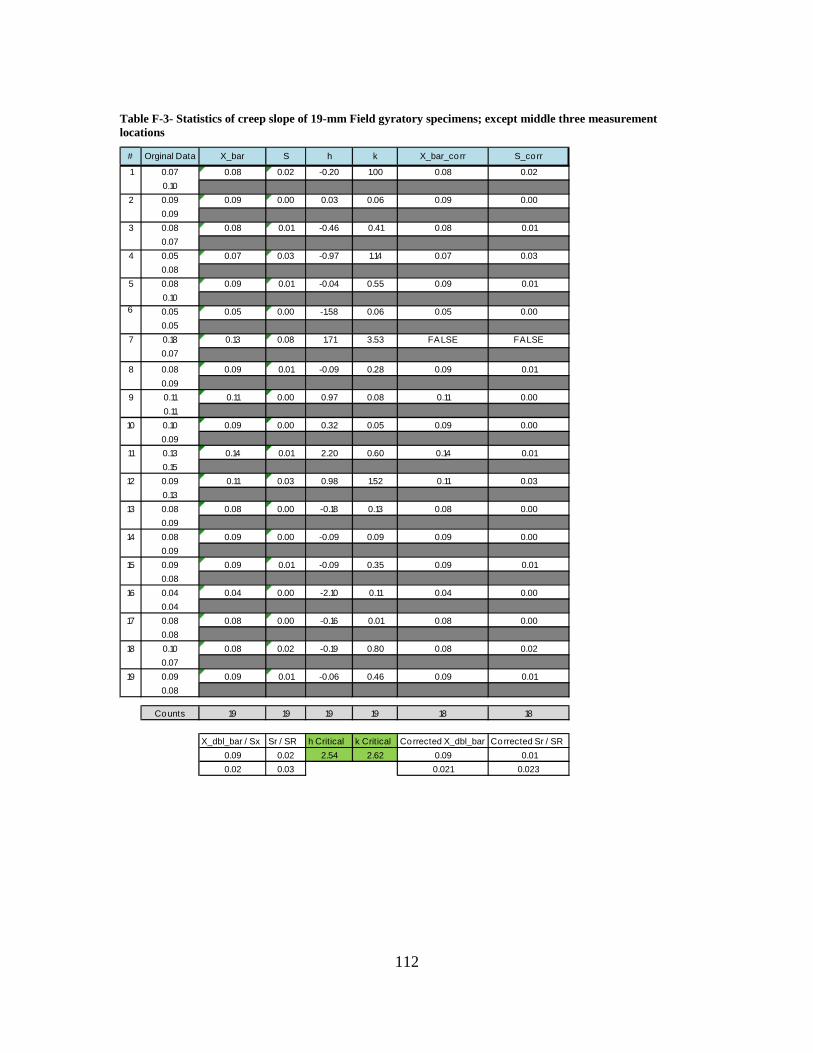
Table F-3- Statistics of creep slope of 19-mm Field gyratory specimens; except middle three measurement locations
# Orginal Data X_bar S h k X_bar_corr S_corr
1 0.07 0.08 0.02 -0.20 1.00 0.08 0.020.10
2 0.09 0.09 0.00 0.03 0.06 0.09 0.000.09
3 0.08 0.08 0.01 -0.46 0.41 0.08 0.010.07
4 0.05 0.07 0.03 -0.97 1.14 0.07 0.030.08
5 0.08 0.09 0.01 -0.04 0.55 0.09 0.010.10
6 0.05 0.05 0.00 -1.58 0.06 0.05 0.000.05
7 0.18 0.13 0.08 1.71 3.53 FALSE FALSE0.07
8 0.08 0.09 0.01 -0.09 0.28 0.09 0.010.09
9 0.11 0.11 0.00 0.97 0.08 0.11 0.000.11
10 0.10 0.09 0.00 0.32 0.05 0.09 0.000.09
11 0.13 0.14 0.01 2.20 0.60 0.14 0.010.15
12 0.09 0.11 0.03 0.98 1.52 0.11 0.030.13
13 0.08 0.08 0.00 -0.18 0.13 0.08 0.000.09
14 0.08 0.09 0.00 -0.09 0.09 0.09 0.000.09
15 0.09 0.09 0.01 -0.09 0.35 0.09 0.010.08
16 0.04 0.04 0.00 -2.10 0.11 0.04 0.000.04
17 0.08 0.08 0.00 -0.16 0.01 0.08 0.000.08
18 0.10 0.08 0.02 -0.19 0.80 0.08 0.020.07
19 0.09 0.09 0.01 -0.06 0.46 0.09 0.010.08
Counts 19 19 19 19 18 18
X_dbl_bar / Sx Sr / SR h Critical k Critical Corrected X_dbl_bar / SxCorrected Sr / SR0.09 0.02 2.54 2.62 0.09 0.010.02 0.03 0.021 0.023

113
Figure F-3- h and k statistics, median deformations, and measurement errors of creep slope of 19-mm Field gyratory specimens; except middle three measurement locations
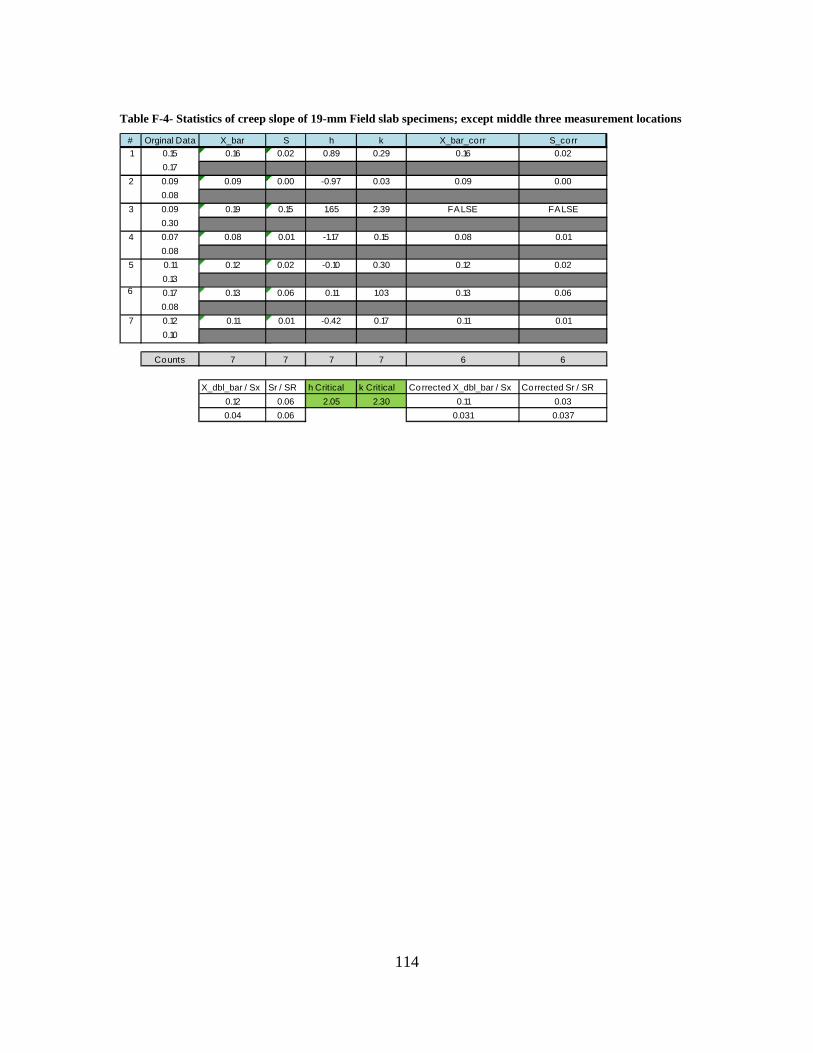
114
Table F-4- Statistics of creep slope of 19-mm Field slab specimens; except middle three measurement locations
# Orginal Data X_bar S h k X_bar_corr S_corr1 0.15 0.16 0.02 0.89 0.29 0.16 0.02
0.172 0.09 0.09 0.00 -0.97 0.03 0.09 0.00
0.083 0.09 0.19 0.15 1.65 2.39 FALSE FALSE
0.304 0.07 0.08 0.01 -1.17 0.15 0.08 0.01
0.085 0.11 0.12 0.02 -0.10 0.30 0.12 0.02
0.136 0.17 0.13 0.06 0.11 1.03 0.13 0.06
0.087 0.12 0.11 0.01 -0.42 0.17 0.11 0.01
0.10
Counts 7 7 7 7 6 6
X_dbl_bar / Sx Sr / SR h Critical k Critical Corrected X_dbl_bar / Sx Corrected Sr / SR0.12 0.06 2.05 2.30 0.11 0.030.04 0.06 0.031 0.037
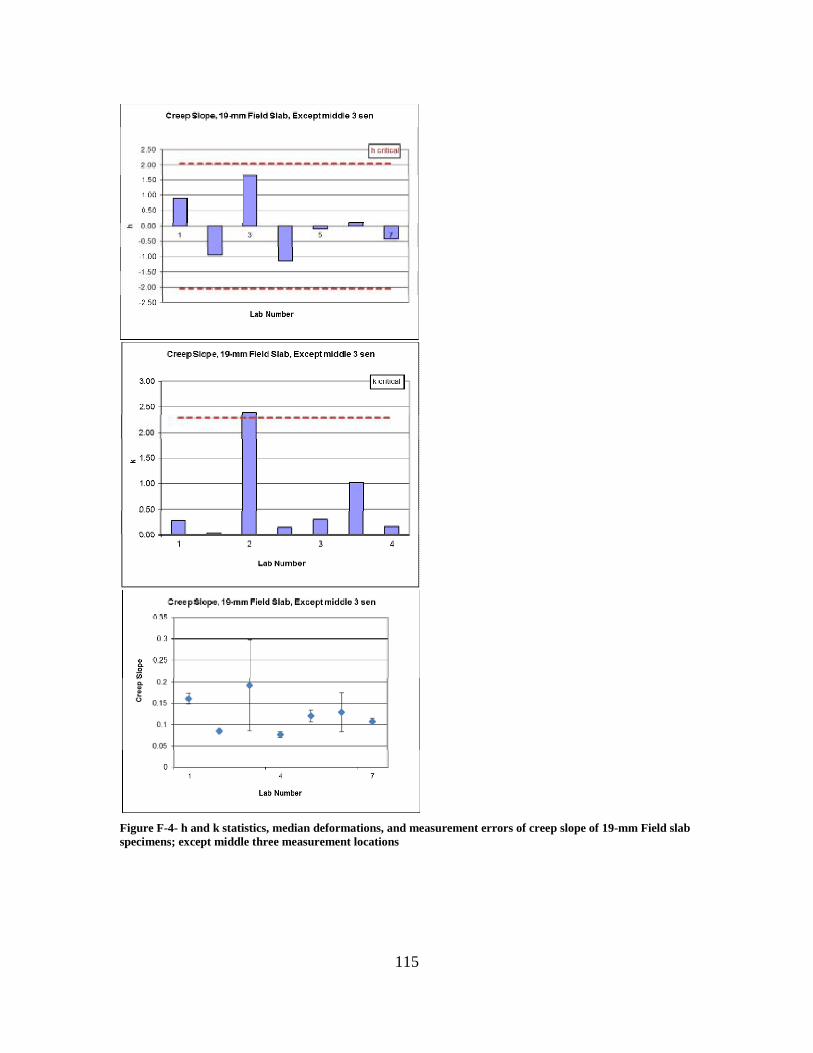
115
Figure F-4- h and k statistics, median deformations, and measurement errors of creep slope of 19-mm Field slab specimens; except middle three measurement locations
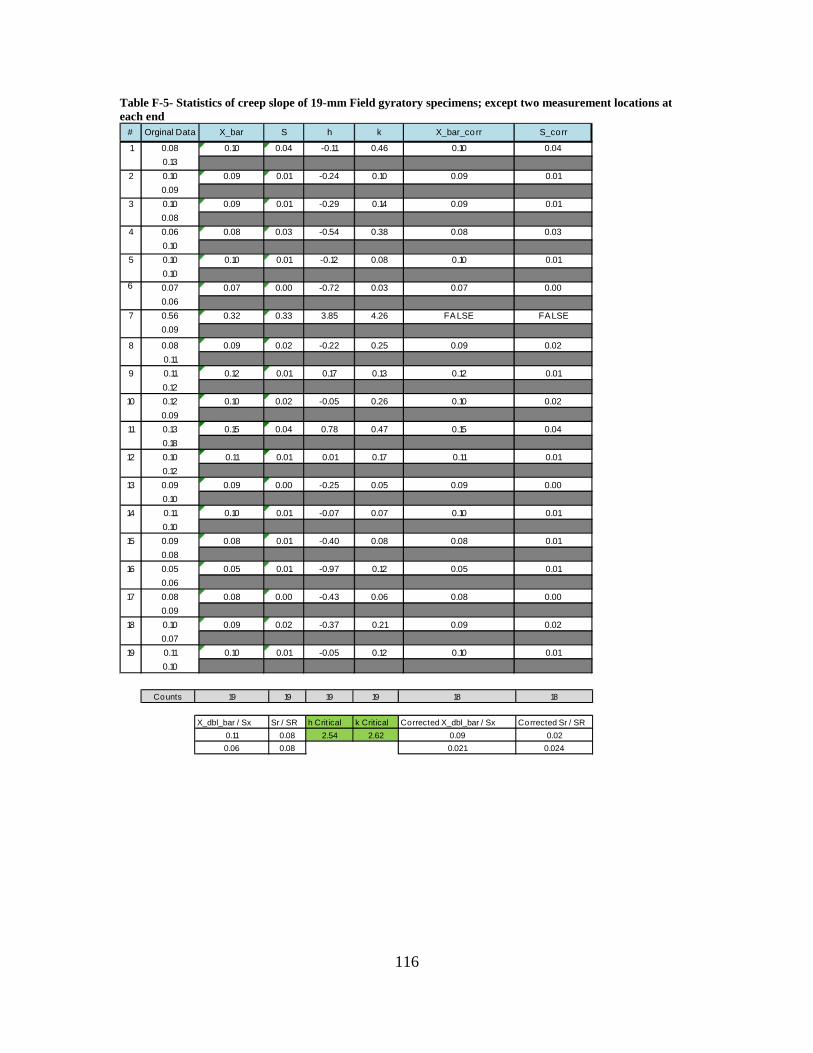
116
Table F-5- Statistics of creep slope of 19-mm Field gyratory specimens; except two measurement locations at each end
# Orginal Data X_bar S h k X_bar_corr S_corr
1 0.08 0.10 0.04 -0.11 0.46 0.10 0.040.13
2 0.10 0.09 0.01 -0.24 0.10 0.09 0.010.09
3 0.10 0.09 0.01 -0.29 0.14 0.09 0.010.08
4 0.06 0.08 0.03 -0.54 0.38 0.08 0.030.10
5 0.10 0.10 0.01 -0.12 0.08 0.10 0.010.10
6 0.07 0.07 0.00 -0.72 0.03 0.07 0.000.06
7 0.56 0.32 0.33 3.85 4.26 FALSE FALSE0.09
8 0.08 0.09 0.02 -0.22 0.25 0.09 0.020.11
9 0.11 0.12 0.01 0.17 0.13 0.12 0.010.12
10 0.12 0.10 0.02 -0.05 0.26 0.10 0.020.09
11 0.13 0.15 0.04 0.78 0.47 0.15 0.040.18
12 0.10 0.11 0.01 0.01 0.17 0.11 0.010.12
13 0.09 0.09 0.00 -0.25 0.05 0.09 0.000.10
14 0.11 0.10 0.01 -0.07 0.07 0.10 0.010.10
15 0.09 0.08 0.01 -0.40 0.08 0.08 0.010.08
16 0.05 0.05 0.01 -0.97 0.12 0.05 0.010.06
17 0.08 0.08 0.00 -0.43 0.06 0.08 0.000.09
18 0.10 0.09 0.02 -0.37 0.21 0.09 0.020.07
19 0.11 0.10 0.01 -0.05 0.12 0.10 0.010.10
Counts 19 19 19 19 18 18
X_dbl_bar / Sx Sr / SR h Critical k Critical Corrected X_dbl_bar / Sx Corrected Sr / SR0.11 0.08 2.54 2.62 0.09 0.020.06 0.08 0.021 0.024

117
Figure F-5- h and k statistics, median deformations, and measurement errors of creep slope of 19-mm Field gyratory specimens; except two measurement locations at each end
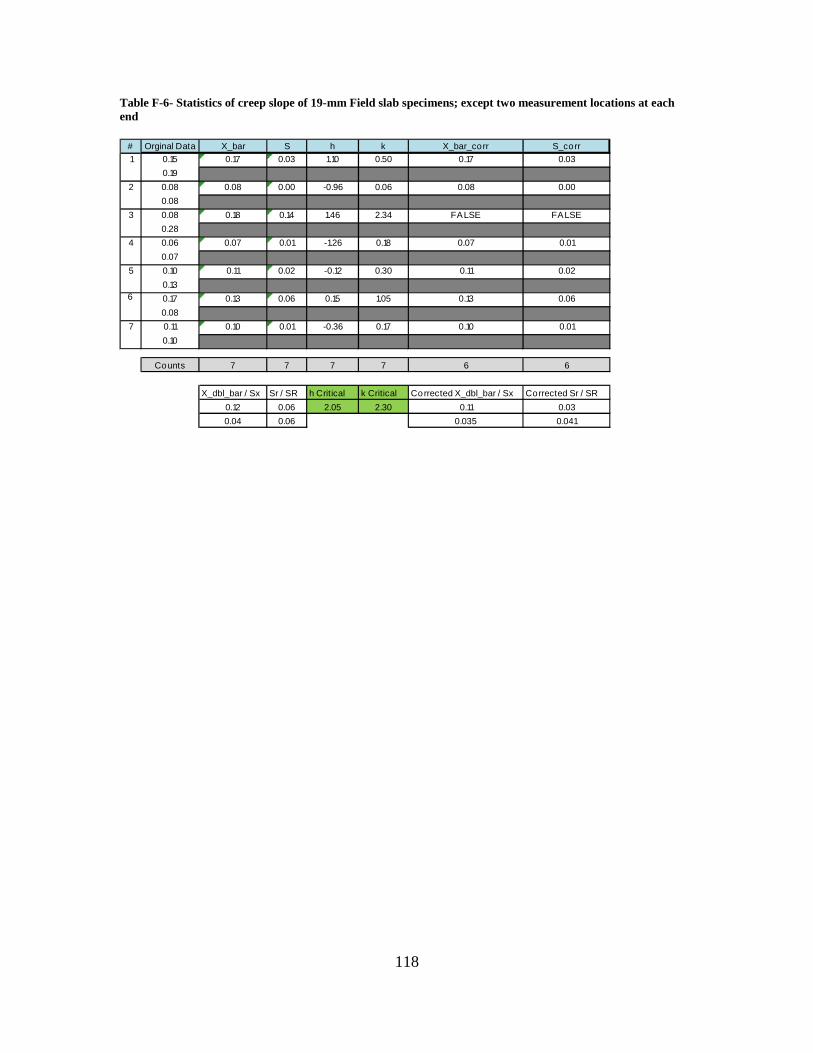
118
Table F-6- Statistics of creep slope of 19-mm Field slab specimens; except two measurement locations at each end
# Orginal Data X_bar S h k X_bar_corr S_corr1 0.15 0.17 0.03 1.10 0.50 0.17 0.03
0.192 0.08 0.08 0.00 -0.96 0.06 0.08 0.00
0.083 0.08 0.18 0.14 1.46 2.34 FALSE FALSE
0.284 0.06 0.07 0.01 -1.26 0.18 0.07 0.01
0.075 0.10 0.11 0.02 -0.12 0.30 0.11 0.02
0.136 0.17 0.13 0.06 0.15 1.05 0.13 0.06
0.087 0.11 0.10 0.01 -0.36 0.17 0.10 0.01
0.10
Counts 7 7 7 7 6 6
X_dbl_bar / Sx Sr / SR h Critical k Critical Corrected X_dbl_bar / Sx Corrected Sr / SR0.12 0.06 2.05 2.30 0.11 0.030.04 0.06 0.035 0.041

119
Figure F-6- h and k statistics, median deformations, and measurement errors of creep slope of 19-mm Field slab specimens; two measurement locations at each end

120
Table F-7- Statistics of creep slope of WY gyratory specimens; all measurement locations
# Orginal Data X_bar S h k X_bar_corr S_corr
1 0.47 0.51 0.06 1.25 0.89 0.51 0.060.55
2 0.36 0.44 0.11 0.65 1.57 0.44 0.110.52
3 0.29 0.32 0.05 -0.42 0.68 0.32 0.050.35
4 0.72 0.58 0.19 1.89 2.82 FALSE FALSE0.45
5 0.30 0.28 0.03 -0.77 0.42 0.28 0.030.26
6 0.30 0.24 0.08 -1.09 1.19 0.24 0.080.19
7 0.29 0.30 0.01 -0.58 0.16 0.30 0.010.31
8 0.38 0.43 0.07 0.52 1.01 0.43 0.070.47
9 0.28 0.28 0.00 -0.78 0.04 0.28 0.000.28
10 0.27 0.23 0.06 -1.20 0.82 0.23 0.060.19
11 0.40 0.40 0.01 0.32 0.10 0.40 0.010.41
12 0.54 0.46 0.11 0.82 1.57 0.46 0.110.38
13 0.42 0.37 0.07 0.07 1.04 0.37 0.070.33
14 0.31 0.34 0.05 -0.22 0.69 0.34 0.050.38
15 0.44 0.49 0.06 1.04 0.91 0.49 0.060.53
16 0.25 0.25 0.01 -1.06 0.11 0.25 0.010.24
17 0.21 0.20 0.02 -1.50 0.35 0.20 0.020.18
18 0.54 0.48 0.09 0.97 1.26 0.48 0.090.42
19 0.30 0.35 0.07 -0.11 1.05 0.35 0.070.40
20 0.43 0.40 0.03 0.32 0.51 0.40 0.030.38
21 0.29 0.27 0.03 -0.89 0.50 0.27 0.030.24
22 0.45 0.40 0.07 0.32 1.05 0.40 0.070.35
23 0.24 0.27 0.04 -0.89 0.62 0.27 0.040.30
24 0.24 0.27 0.04 -0.89 0.62 0.27 0.040.30
25 0.62 0.62 0.00 2.23 0.00 0.62 0.000.62
Counts 25 25 25 25 24 24
X_dbl_bar / Sx Sr / SR h Critical k Critical Corrected X_dbl_bar / Sx Corrected Sr / SR0.37 0.07 2.61 2.67 0.36 0.060.11 0.12 0.106 0.114
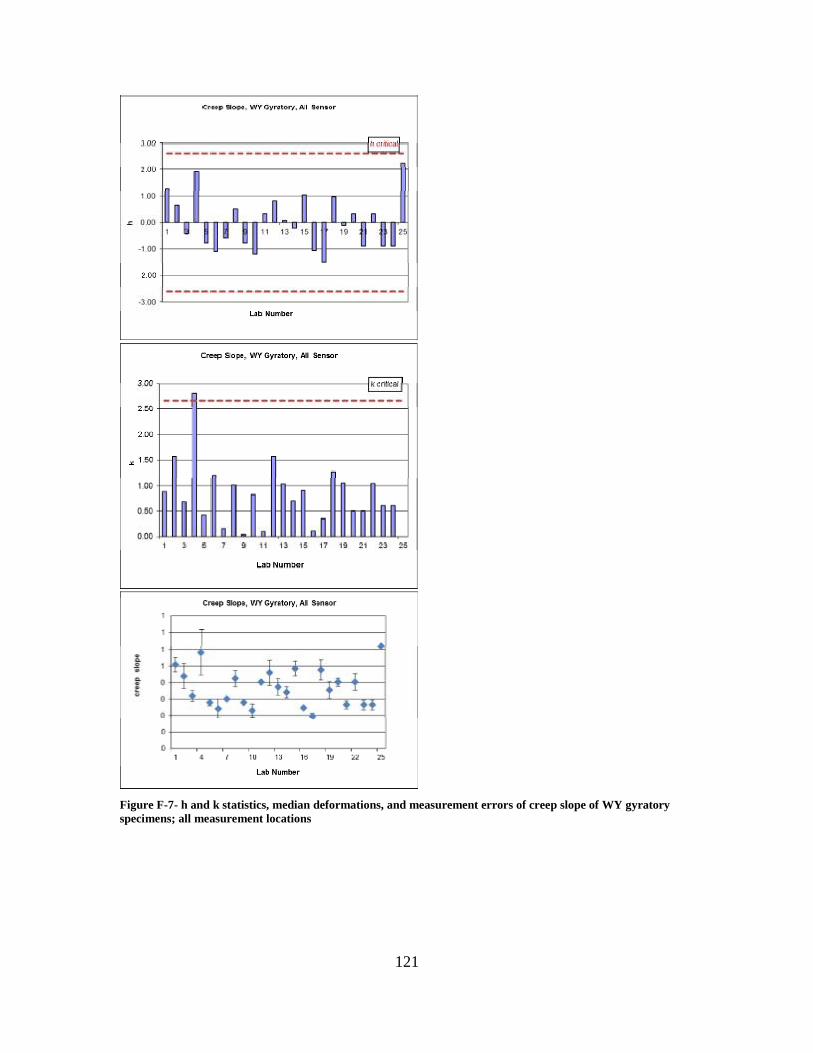
121
Figure F-7- h and k statistics, median deformations, and measurement errors of creep slope of WY gyratory specimens; all measurement locations

122
Table F-8- Statistics of creep slope of WY slab specimens; all measurement locations
# Orginal Data X_bar S h k X_bar_corr S_corr
1 0.19 0.23 0.05 0.34 1.48 0.23 0.050.26
2 0.17 0.20 0.03 -0.41 1.11 0.20 0.030.22
3 0.26 0.23 0.04 0.45 1.27 0.23 0.040.20
4 0.14 0.14 0.01 -1.72 0.18 0.14 0.010.15
5 0.21 0.20 0.02 -0.37 0.55 0.20 0.020.19
6 0.24 0.26 0.04 1.27 1.22 0.26 0.040.29
7 0.28 0.28 0.01 1.79 0.21 0.28 0.010.29
8 0.17 0.20 0.04 -0.35 1.30 0.20 0.040.23
9 0.17 0.19 0.03 -0.50 0.90 0.19 0.030.21
10 0.21 0.19 0.02 -0.50 0.77 0.19 0.020.18
Counts 10 10 10 10 10 10
X_dbl_bar / Sx Sr / SR h Critical k Critical Corrected X_dbl_bar / Sx Corrected Sr / SR0.21 0.03 2.29 2.45 0.21 0.030.04 0.05 0.040 0.046
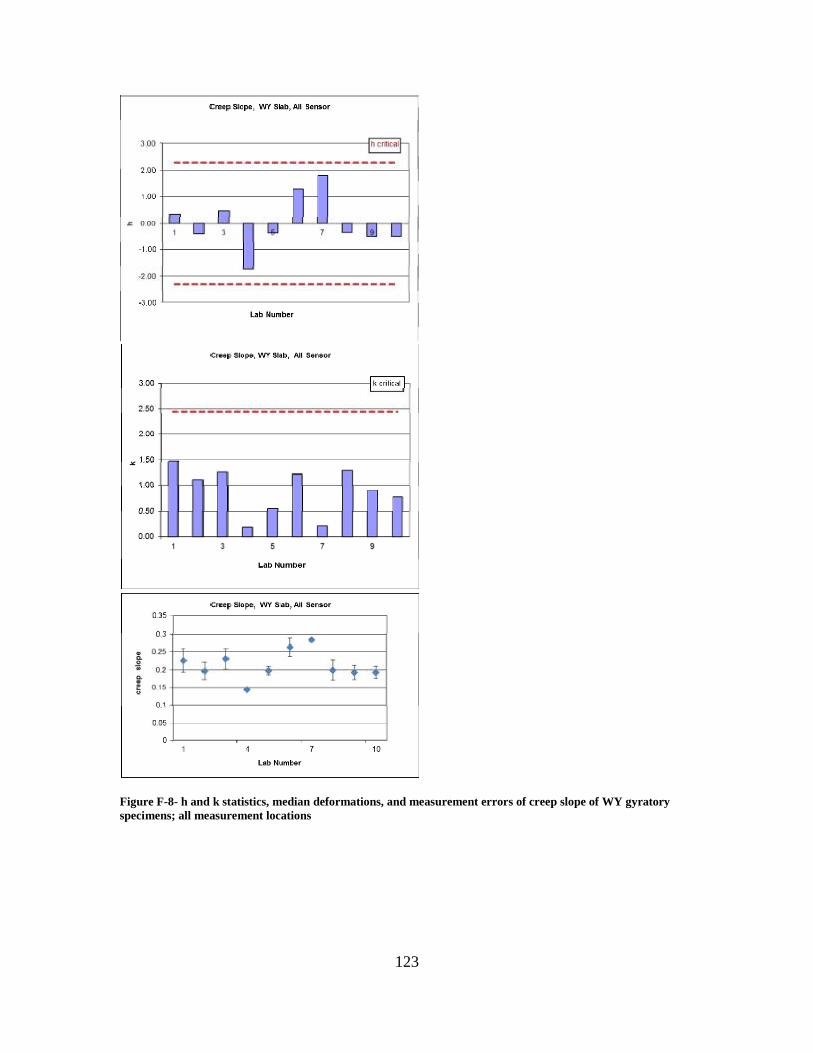
123
Figure F-8- h and k statistics, median deformations, and measurement errors of creep slope of WY gyratory specimens; all measurement locations
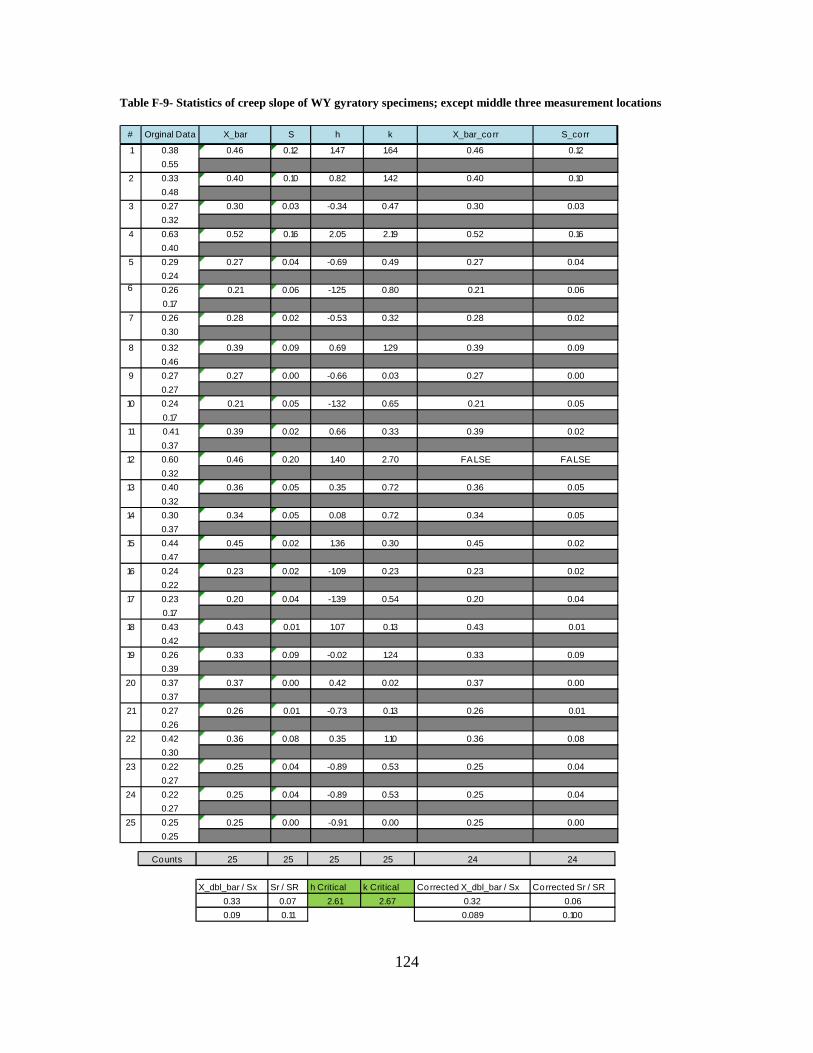
124
Table F-9- Statistics of creep slope of WY gyratory specimens; except middle three measurement locations
# Orginal Data X_bar S h k X_bar_corr S_corr
1 0.38 0.46 0.12 1.47 1.64 0.46 0.120.55
2 0.33 0.40 0.10 0.82 1.42 0.40 0.100.48
3 0.27 0.30 0.03 -0.34 0.47 0.30 0.030.32
4 0.63 0.52 0.16 2.05 2.19 0.52 0.160.40
5 0.29 0.27 0.04 -0.69 0.49 0.27 0.040.24
6 0.26 0.21 0.06 -1.25 0.80 0.21 0.060.17
7 0.26 0.28 0.02 -0.53 0.32 0.28 0.020.30
8 0.32 0.39 0.09 0.69 1.29 0.39 0.090.46
9 0.27 0.27 0.00 -0.66 0.03 0.27 0.000.27
10 0.24 0.21 0.05 -1.32 0.65 0.21 0.050.17
11 0.41 0.39 0.02 0.66 0.33 0.39 0.020.37
12 0.60 0.46 0.20 1.40 2.70 FALSE FALSE0.32
13 0.40 0.36 0.05 0.35 0.72 0.36 0.050.32
14 0.30 0.34 0.05 0.08 0.72 0.34 0.050.37
15 0.44 0.45 0.02 1.36 0.30 0.45 0.020.47
16 0.24 0.23 0.02 -1.09 0.23 0.23 0.020.22
17 0.23 0.20 0.04 -1.39 0.54 0.20 0.040.17
18 0.43 0.43 0.01 1.07 0.13 0.43 0.010.42
19 0.26 0.33 0.09 -0.02 1.24 0.33 0.090.39
20 0.37 0.37 0.00 0.42 0.02 0.37 0.000.37
21 0.27 0.26 0.01 -0.73 0.13 0.26 0.010.26
22 0.42 0.36 0.08 0.35 1.10 0.36 0.080.30
23 0.22 0.25 0.04 -0.89 0.53 0.25 0.040.27
24 0.22 0.25 0.04 -0.89 0.53 0.25 0.040.27
25 0.25 0.25 0.00 -0.91 0.00 0.25 0.000.25
Counts 25 25 25 25 24 24
X_dbl_bar / Sx Sr / SR h Critical k Critical Corrected X_dbl_bar / Sx Corrected Sr / SR0.33 0.07 2.61 2.67 0.32 0.060.09 0.11 0.089 0.100

125
Figure F-9- h and k statistics, median deformations, and measurement errors of creep slope of WY gyratory specimens; except middle three measurement locations
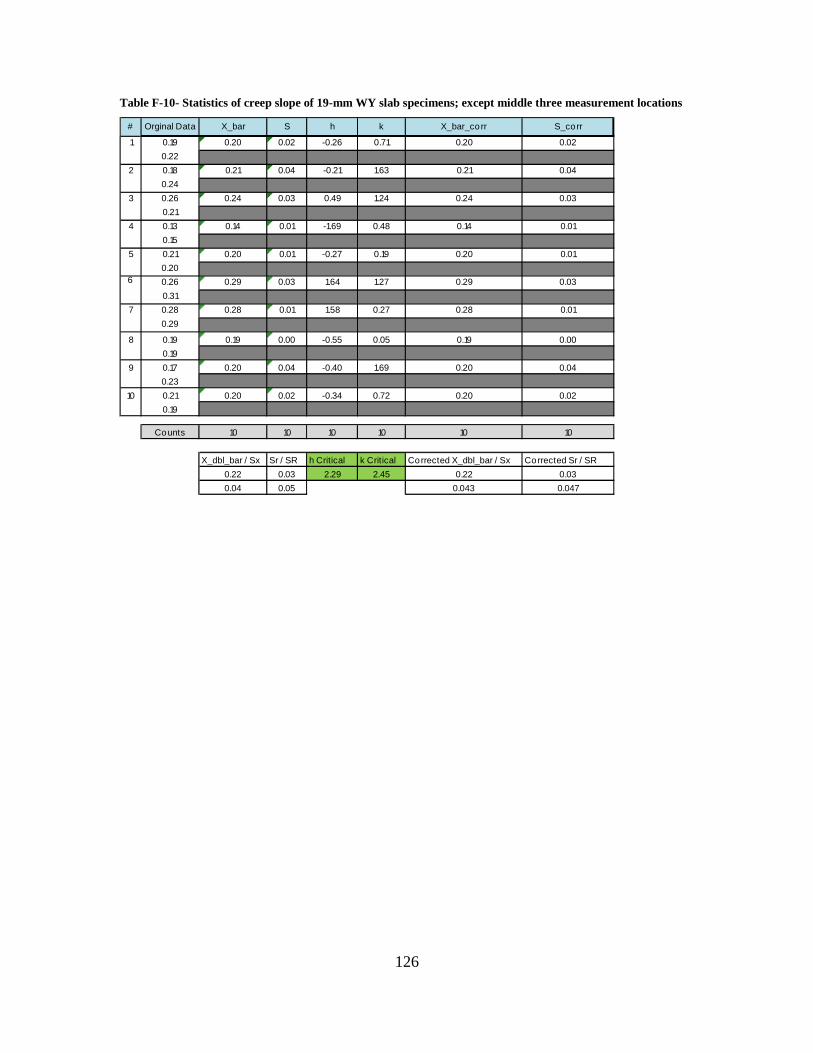
126
Table F-10- Statistics of creep slope of 19-mm WY slab specimens; except middle three measurement locations
# Orginal Data X_bar S h k X_bar_corr S_corr
1 0.19 0.20 0.02 -0.26 0.71 0.20 0.020.22
2 0.18 0.21 0.04 -0.21 1.63 0.21 0.040.24
3 0.26 0.24 0.03 0.49 1.24 0.24 0.030.21
4 0.13 0.14 0.01 -1.69 0.48 0.14 0.010.15
5 0.21 0.20 0.01 -0.27 0.19 0.20 0.010.20
6 0.26 0.29 0.03 1.64 1.27 0.29 0.030.31
7 0.28 0.28 0.01 1.58 0.27 0.28 0.010.29
8 0.19 0.19 0.00 -0.55 0.05 0.19 0.000.19
9 0.17 0.20 0.04 -0.40 1.69 0.20 0.040.23
10 0.21 0.20 0.02 -0.34 0.72 0.20 0.020.19
Counts 10 10 10 10 10 10
X_dbl_bar / Sx Sr / SR h Critical k Critical Corrected X_dbl_bar / Sx Corrected Sr / SR0.22 0.03 2.29 2.45 0.22 0.030.04 0.05 0.043 0.047
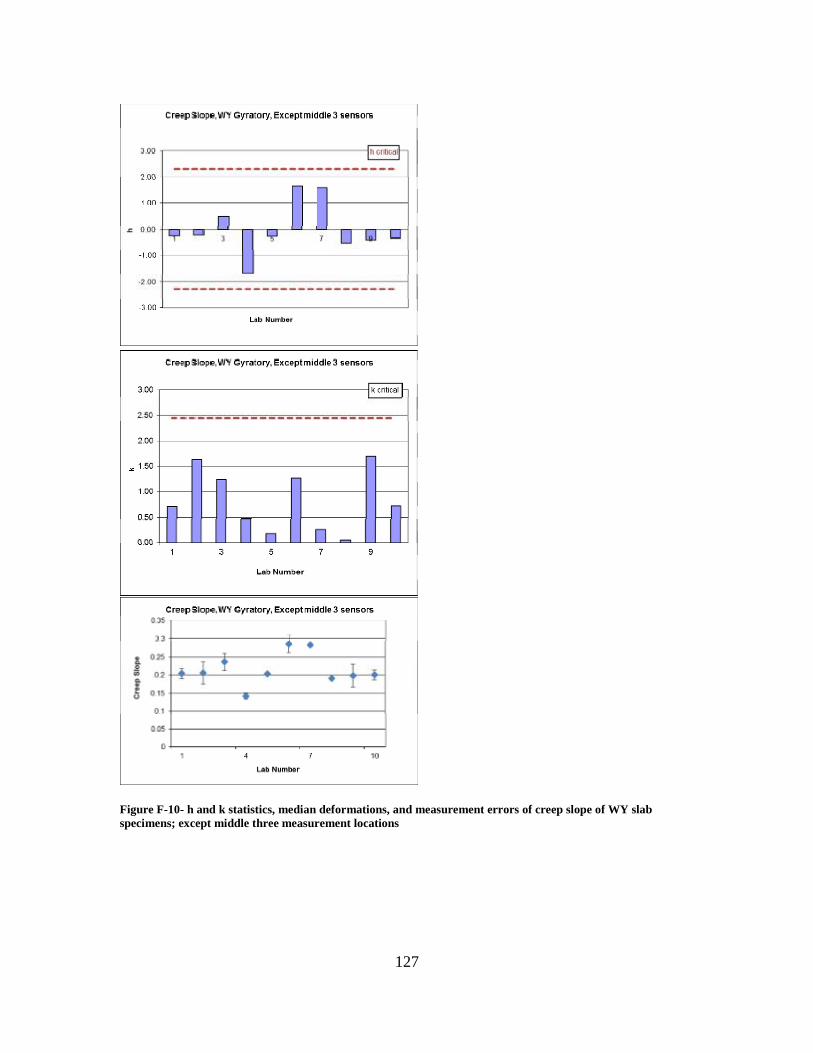
127
Figure F-10- h and k statistics, median deformations, and measurement errors of creep slope of WY slab specimens; except middle three measurement locations

128
Table F-11- Statistics of creep slope of WY gyratory specimens; except two measurement locations at each end
# Orginal Data X_bar S h k X_bar_corr S_corr
1 0.49 0.53 0.06 1.24 0.71 0.53 0.060.57
2 0.43 0.49 0.09 0.89 1.12 0.49 0.090.56
3 0.33 0.36 0.05 -0.26 0.66 0.36 0.050.40
4 0.90 0.69 0.30 2.62 3.74 FALSE FALSE0.49
5 0.31 0.30 0.02 -0.82 0.25 0.30 0.020.28
6 0.37 0.29 0.11 -0.91 1.44 0.29 0.110.21
7 0.33 0.34 0.01 -0.49 0.12 0.34 0.010.34
8 0.42 0.46 0.05 0.59 0.68 0.46 0.050.50
9 0.30 0.30 0.00 -0.77 0.00 0.30 0.000.30
10 0.30 0.26 0.06 -1.15 0.79 0.26 0.060.22
11 0.37 0.42 0.06 0.21 0.81 0.42 0.060.46
12 0.49 0.43 0.09 0.30 1.18 0.43 0.090.36
13 0.44 0.40 0.05 0.06 0.66 0.40 0.050.36
14 0.33 0.35 0.02 -0.39 0.29 0.35 0.020.36
15 0.46 0.50 0.05 0.91 0.66 0.50 0.050.53
16 0.31 0.29 0.02 -0.89 0.27 0.29 0.020.28
17 0.22 0.21 0.02 -1.62 0.29 0.21 0.020.19
18 0.53 0.48 0.07 0.78 0.93 0.48 0.070.43
19 0.35 0.39 0.07 0.00 0.83 0.39 0.070.44
20 0.42 0.42 0.00 0.24 0.02 0.42 0.000.42
21 0.31 0.29 0.03 -0.92 0.33 0.29 0.030.27
22 0.47 0.43 0.06 0.32 0.70 0.43 0.060.39
23 0.27 0.29 0.03 -0.86 0.38 0.29 0.030.31
24 0.27 0.29 0.03 -0.86 0.38 0.29 0.030.31
25 0.60 0.60 0.00 1.77 0.00 0.60 0.000.60
Counts 25 25 25 25 24 24
X_dbl_bar / Sx Sr / SR h Critical k Critical Corrected X_dbl_bar / Sx Corrected Sr / SR0.39 0.08 2.61 2.67 0.38 0.050.12 0.13 0.099 0.106

129
Figure F-11- h and k statistics, median deformations, and measurement errors of creep slope of WY gyratory specimens; except two measurement locations at each end

130
Table F-12- Statistics of creep slope of WY slab specimens; except two measurement locations at each end
# Orginal Data X_bar S h k X_bar_corr S_corr
1 0.18 0.22 0.06 0.00 0.72 0.22 0.060.26
2 0.16 0.19 0.04 -0.40 0.52 0.19 0.040.22
3 0.25 0.22 0.04 0.06 0.45 0.22 0.040.20
4 0.15 0.15 0.00 -0.99 0.05 0.15 0.000.14
5 0.22 0.19 0.03 -0.33 0.38 0.19 0.030.17
6 0.20 0.24 0.06 0.27 0.70 0.24 0.060.28
7 0.27 0.41 0.21 2.66 2.63 FALSE FALSE0.56
8 0.14 0.20 0.09 -0.24 1.13 0.20 0.090.26
9 0.17 0.18 0.00 -0.56 0.05 0.18 0.000.18
10 0.21 0.18 0.03 -0.47 0.40 0.18 0.030.16
Counts 10 10 10 10 9 9
X_dbl_bar / Sx Sr / SR h Critical k Critical Corrected X_dbl_bar / Sx Corrected Sr / SR0.22 0.08 2.29 2.45 0.20 0.050.07 0.09 0.027 0.043
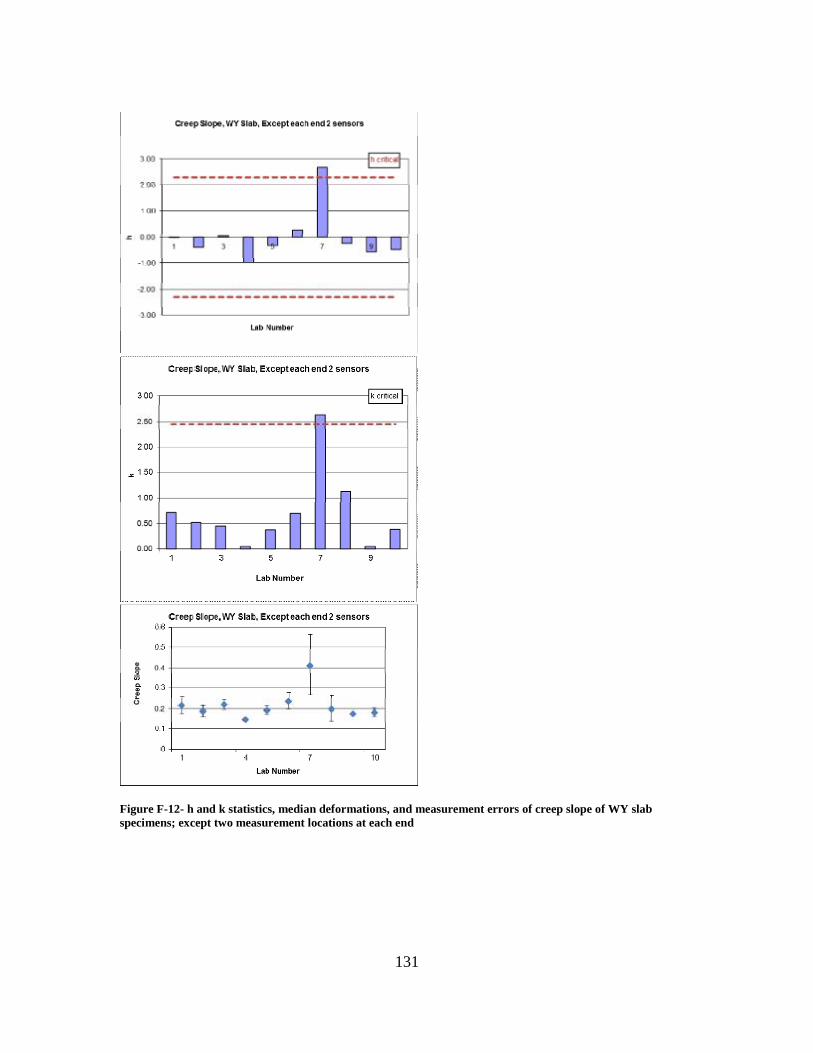
131
Figure F-12- h and k statistics, median deformations, and measurement errors of creep slope of WY slab specimens; except two measurement locations at each end
132
APPENDIX G- STATISTICS OF STRIP SLOPE

133
Table G-1- Statistics of strip slope of WY gyratory specimens; all measurement locations
# Orginal Data X_bar S h k X_bar_corr S_corr
1 0.91 1.06 0.21 -0.27 1.12 1.06 0.211.21
2 1.01 1.10 0.12 -0.06 0.66 1.10 0.121.19
3 1.46 1.64 0.24 2.62 1.29 FALSE FALSE1.81
4 1.46 1.40 0.09 1.42 0.48 1.40 0.091.33
5 0.99 0.97 0.03 -0.72 0.19 0.97 0.030.94
6 1.03 0.97 0.08 -0.69 0.41 0.97 0.080.92
7 0.85 0.96 0.17 -0.73 0.89 0.96 0.171.08
8 1.37 1.27 0.14 0.79 0.74 1.27 0.141.17
9 0.65 0.90 0.35 -1.06 1.84 0.90 0.351.14
10 1.04 1.01 0.05 -0.53 0.27 1.01 0.050.97
11 1.23 1.12 0.16 0.04 0.86 1.12 0.161.00
12 1.57 1.45 0.17 1.69 0.89 1.45 0.171.33
13 1.30 1.07 0.33 -0.20 1.75 1.07 0.330.84
14 1.03 1.03 0.00 -0.40 0.01 1.03 0.001.03
15 0.94 0.96 0.03 -0.73 0.16 0.96 0.030.99
16 1.04 0.97 0.10 -0.72 0.56 0.97 0.100.89
17 1.15 1.21 0.09 0.51 0.50 1.21 0.091.28
18 1.40 1.34 0.08 1.14 0.43 1.34 0.081.28
19 0.72 0.83 0.15 -1.43 0.80 0.83 0.150.93
20 1.26 1.21 0.07 0.48 0.38 1.21 0.071.16
21 1.32 1.08 0.34 -0.16 1.78 1.08 0.340.84
22 1.21 1.34 0.18 1.13 0.98 1.34 0.181.47
23 0.81 1.04 0.33 -0.36 1.75 1.04 0.331.27
24 0.81 1.04 0.33 -0.36 1.75 1.04 0.331.27
25 0.83 0.83 0.00 -1.41 0.00 0.83 0.000.83
Counts 25 25 25 25 24 24
X_dbl_bar / Sx Sr / SR h Critical k Critical Corrected X_dbl_bar / Sx Corrected Sr / SR1.11 0.19 2.61 2.67 1.09 0.19
0.20 0.24 0.172 0.216

134
Figure G-1- h and k statistics, median deformations, and measurement errors of strip slope of WY gyratory specimens; all measurement locations

135
Table G-2- Statistics of strip slope of WY slab specimens; all measurement locations
# Orginal Data X_bar S h k X_bar_corr S_corr
1 0.65 0.69 0.06 0.04 0.49 0.69 0.060.74
2 0.55 0.65 0.14 -0.32 1.18 0.65 0.140.75
3 0.85 0.79 0.08 0.80 0.66 0.79 0.080.74
4 0.62 0.52 0.15 -1.32 1.23 0.52 0.150.41
5 0.58 0.52 0.10 -1.33 0.80 0.52 0.100.45
6 0.96 0.96 0.00 2.06 0.02 0.96 0.000.96
7 0.67 0.67 0.00 -0.14 0.01 0.67 0.000.67
8 0.55 0.75 0.28 0.44 2.32 0.75 0.280.94
9 0.74 0.72 0.03 0.25 0.25 0.72 0.030.70
10 0.68 0.63 0.07 -0.48 0.60 0.63 0.070.58
Counts 10 10 10 10 10 10
X_dbl_bar / Sx Sr / SR h Critical k Critical Corrected X_dbl_bar / Sx Corrected Sr / SR0.69 0.12 2.29 2.45 0.69 0.120.13 0.16 0.131 0.156
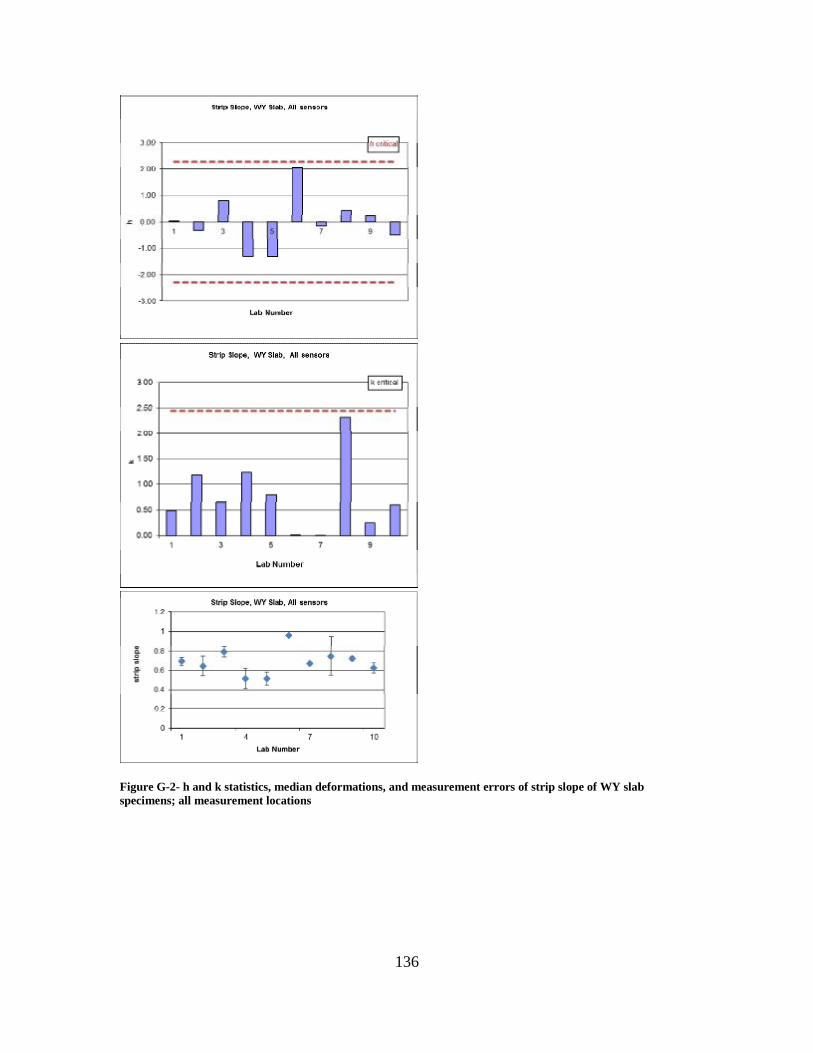
136
Figure G-2- h and k statistics, median deformations, and measurement errors of strip slope of WY slab specimens; all measurement locations

137
Table G-3- Statistics of strip slope of WY gyratory specimens; except middle 3 measurement locations
# Orginal Data X_bar S h k X_bar_corr S_corr
1 0.81 0.96 0.22 0.18 1.41 0.96 0.221.12
2 0.87 0.98 0.16 0.27 1.02 0.98 0.161.09
3 1.24 1.38 0.21 2.70 1.37 FALSE FALSE1.53
4 1.17 1.10 0.11 0.99 0.70 1.10 0.111.02
5 0.92 0.83 0.12 -0.60 0.81 0.83 0.120.74
6 0.72 0.75 0.05 -1.09 0.32 0.75 0.050.79
7 0.71 0.84 0.19 -0.54 1.24 0.84 0.190.98
8 1.13 1.04 0.13 0.63 0.86 1.04 0.130.94
9 0.60 0.83 0.32 -0.61 2.09 0.83 0.321.06
10 0.83 0.85 0.04 -0.48 0.25 0.85 0.040.88
11 1.11 0.97 0.20 0.23 1.27 0.97 0.200.83
12 1.36 1.24 0.17 1.84 1.08 1.24 0.171.12
13 1.03 0.90 0.19 -0.22 1.26 0.90 0.190.76
14 0.88 0.87 0.02 -0.38 0.11 0.87 0.020.86
15 0.77 0.81 0.06 -0.72 0.39 0.81 0.060.86
16 0.87 0.79 0.12 -0.88 0.78 0.79 0.120.70
17 0.93 1.03 0.14 0.58 0.91 1.03 0.141.13
18 1.17 1.10 0.09 1.01 0.62 1.10 0.091.04
19 0.65 0.69 0.05 -1.47 0.35 0.69 0.050.73
20 1.09 1.11 0.04 1.06 0.23 1.11 0.041.14
21 1.01 0.88 0.19 -0.30 1.22 0.88 0.190.75
22 0.91 1.01 0.14 0.46 0.93 1.01 0.141.11
23 0.69 0.83 0.20 -0.60 1.28 0.83 0.200.97
24 0.69 0.83 0.20 -0.60 1.28 0.83 0.200.97
25 0.69 0.69 0.00 -1.48 0.00 0.69 0.000.69
Counts 25 25 25 25 24 24
X_dbl_bar / Sx Sr / SR h Critical k Critical Corrected X_dbl_bar / Sx Corrected Sr / SR0.93 0.15 2.61 2.67 0.91 0.150.17 0.20 0.141 0.177

138
Figure G-3- h and k statistics, median deformations, and measurement errors of strip slope of WY gyratory specimens; except middle 3 measurement locations
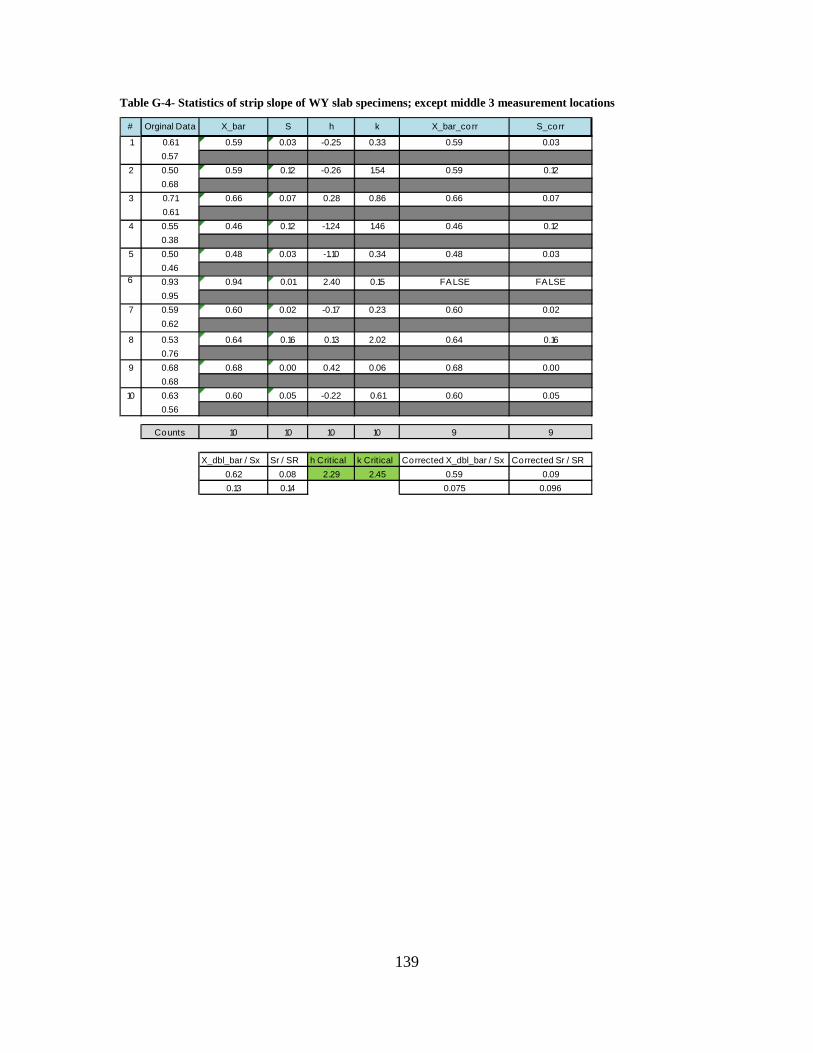
139
Table G-4- Statistics of strip slope of WY slab specimens; except middle 3 measurement locations
# Orginal Data X_bar S h k X_bar_corr S_corr
1 0.61 0.59 0.03 -0.25 0.33 0.59 0.030.57
2 0.50 0.59 0.12 -0.26 1.54 0.59 0.120.68
3 0.71 0.66 0.07 0.28 0.86 0.66 0.070.61
4 0.55 0.46 0.12 -1.24 1.46 0.46 0.120.38
5 0.50 0.48 0.03 -1.10 0.34 0.48 0.030.46
6 0.93 0.94 0.01 2.40 0.15 FALSE FALSE0.95
7 0.59 0.60 0.02 -0.17 0.23 0.60 0.020.62
8 0.53 0.64 0.16 0.13 2.02 0.64 0.160.76
9 0.68 0.68 0.00 0.42 0.06 0.68 0.000.68
10 0.63 0.60 0.05 -0.22 0.61 0.60 0.050.56
Counts 10 10 10 10 9 9
X_dbl_bar / Sx Sr / SR h Critical k Critical Corrected X_dbl_bar / Sx Corrected Sr / SR0.62 0.08 2.29 2.45 0.59 0.090.13 0.14 0.075 0.096

140
Figure G-4- h and k statistics, median deformations, and measurement errors of strip slope of WY slab specimens; except middle three measurement locations

141
Table G-5- Statistics of strip slope of WY gyratory specimens; except two measurement locations at each end # Orginal Data X_bar S h k X_bar_corr S_corr
1 1.07 1.24 0.23 -0.59 0.94 1.24 0.231.40
2 1.25 1.29 0.06 -0.40 0.22 1.29 0.061.32
3 1.88 2.06 0.25 2.72 1.00 FALSE FALSE2.24
4 1.85 1.75 0.14 1.47 0.56 1.75 0.141.65
5 1.20 1.21 0.02 -0.69 0.07 1.21 0.021.23
6 1.37 1.26 0.15 -0.50 0.62 1.26 0.151.15
7 1.06 1.18 0.16 -0.84 0.65 1.18 0.161.29
8 1.73 1.59 0.19 0.84 0.77 1.59 0.191.46
9 0.79 1.07 0.40 -1.25 1.59 1.07 0.401.36
10 1.33 1.24 0.13 -0.60 0.52 1.24 0.131.14
11 1.48 1.34 0.19 -0.18 0.77 1.34 0.191.20
12 1.86 1.80 0.08 1.66 0.32 1.80 0.081.74
13 1.72 1.37 0.49 -0.05 1.96 1.37 0.491.02
14 1.33 1.32 0.02 -0.26 0.06 1.32 0.021.31
15 1.18 1.22 0.06 -0.66 0.26 1.22 0.061.27
16 1.38 1.27 0.16 -0.48 0.63 1.27 0.161.15
17 1.46 1.53 0.09 0.57 0.37 1.53 0.091.59
18 1.72 1.68 0.05 1.19 0.20 1.68 0.051.65
19 0.87 1.03 0.22 -1.43 0.89 1.03 0.221.19
20 1.48 1.36 0.16 -0.08 0.65 1.36 0.161.25
21 1.73 1.38 0.49 0.00 1.97 1.38 0.491.04
22 1.46 1.68 0.32 1.19 1.27 1.68 0.321.91
23 0.98 1.31 0.46 -0.32 1.83 1.31 0.461.63
24 0.98 1.31 0.46 -0.32 1.83 1.31 0.461.63
25 1.14 1.14 0.00 -0.98 0.00 1.14 0.001.14
Counts 25 25 25 25 24 24
X_dbl_bar / Sx Sr / SR h Critical k Critical Corrected X_dbl_bar / Sx Corrected Sr / SR1.39 0.25 2.61 2.67 1.36 0.250.25 0.31 0.210 0.274

142
Figure G-5- h and k statistics, median deformations, and measurement errors of strip slope of WY gyratory specimens; except two measurement locations at each end

143
Table G-6- Statistics of strip slope of WY slab specimens; except two measurement locations at each end
# Orginal Data X_bar S h k X_bar_corr S_corr
1 0.75 0.86 0.16 0.44 0.90 0.86 0.160.97
2 0.62 0.76 0.19 -0.24 1.10 0.76 0.190.90
3 1.04 0.97 0.11 1.20 0.62 0.97 0.110.89
4 0.72 0.59 0.19 -1.43 1.07 0.59 0.190.46
5 0.71 0.60 0.15 -1.34 0.88 0.60 0.150.49
6 1.00 1.00 0.00 1.43 0.03 1.00 0.001.00
7 0.82 0.70 0.16 -0.64 0.94 0.70 0.160.59
8 0.62 0.89 0.38 0.65 2.15 0.89 0.381.15
9 0.87 0.87 0.01 0.51 0.06 0.87 0.010.86
10 0.76 0.71 0.07 -0.59 0.40 0.71 0.070.66
Counts 10 10 10 10 10 10
X_dbl_bar / Sx Sr / SR h Critical k Critical Corrected X_dbl_bar / Sx Corrected Sr / SR0.79 0.18 2.29 2.45 0.79 0.180.14 0.19 0.144 0.190
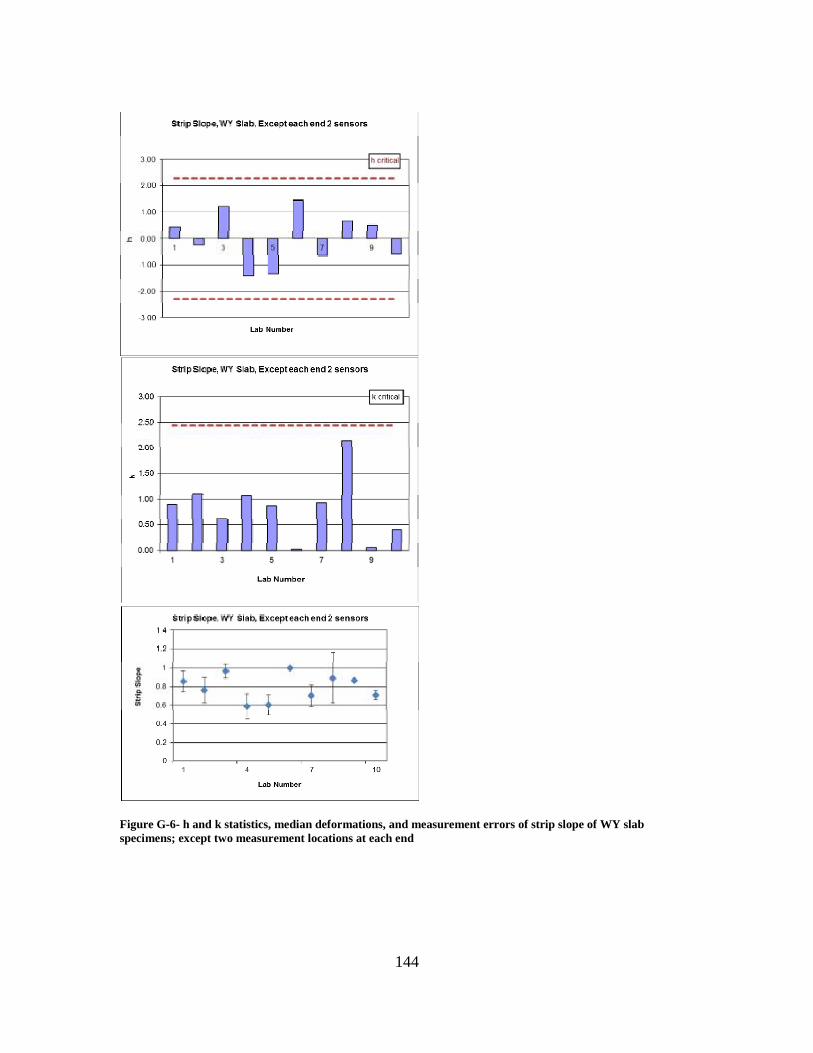
144
Figure G-6- h and k statistics, median deformations, and measurement errors of strip slope of WY slab specimens; except two measurement locations at each end

145
APPENDIX H- STATISTICS OF NUMBER OF PASSES TO INFLECTION POINT
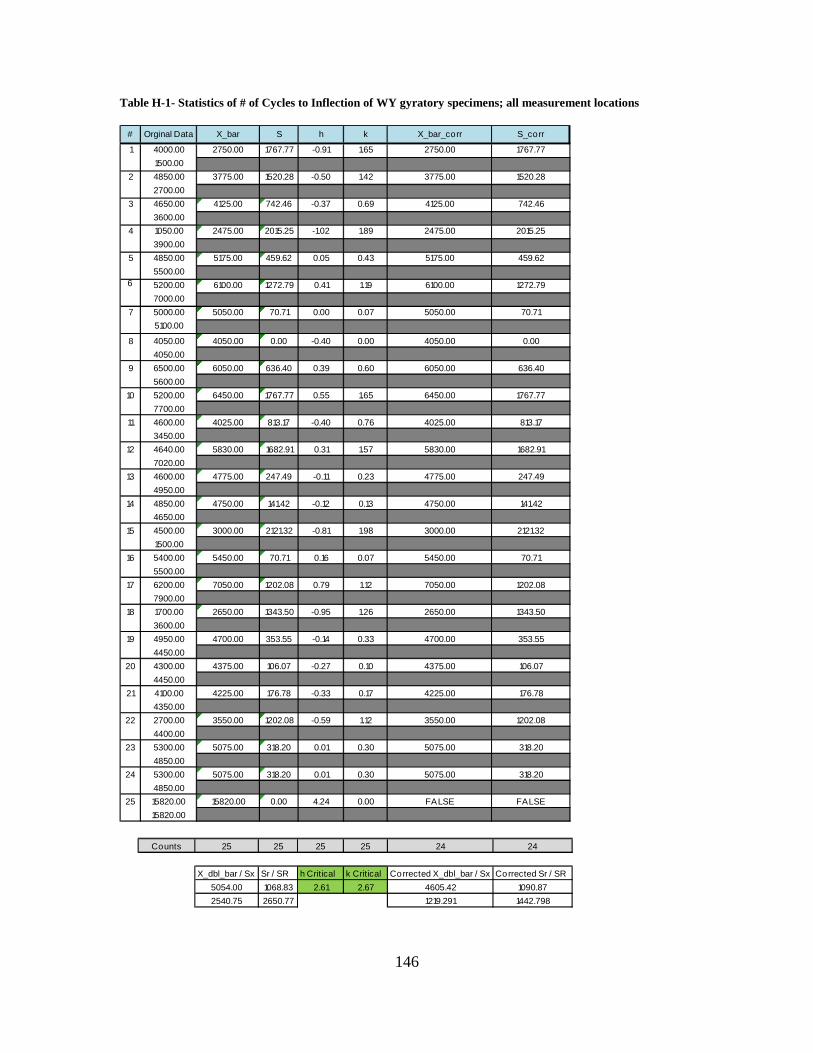
146
Table H-1- Statistics of # of Cycles to Inflection of WY gyratory specimens; all measurement locations
# Orginal Data X_bar S h k X_bar_corr S_corr
1 4000.00 2750.00 1767.77 -0.91 1.65 2750.00 1767.771500.00
2 4850.00 3775.00 1520.28 -0.50 1.42 3775.00 1520.282700.00
3 4650.00 4125.00 742.46 -0.37 0.69 4125.00 742.463600.00
4 1050.00 2475.00 2015.25 -1.02 1.89 2475.00 2015.253900.00
5 4850.00 5175.00 459.62 0.05 0.43 5175.00 459.625500.00
6 5200.00 6100.00 1272.79 0.41 1.19 6100.00 1272.797000.00
7 5000.00 5050.00 70.71 0.00 0.07 5050.00 70.715100.00
8 4050.00 4050.00 0.00 -0.40 0.00 4050.00 0.004050.00
9 6500.00 6050.00 636.40 0.39 0.60 6050.00 636.405600.00
10 5200.00 6450.00 1767.77 0.55 1.65 6450.00 1767.777700.00
11 4600.00 4025.00 813.17 -0.40 0.76 4025.00 813.173450.00
12 4640.00 5830.00 1682.91 0.31 1.57 5830.00 1682.917020.00
13 4600.00 4775.00 247.49 -0.11 0.23 4775.00 247.494950.00
14 4850.00 4750.00 141.42 -0.12 0.13 4750.00 141.424650.00
15 4500.00 3000.00 2121.32 -0.81 1.98 3000.00 2121.321500.00
16 5400.00 5450.00 70.71 0.16 0.07 5450.00 70.715500.00
17 6200.00 7050.00 1202.08 0.79 1.12 7050.00 1202.087900.00
18 1700.00 2650.00 1343.50 -0.95 1.26 2650.00 1343.503600.00
19 4950.00 4700.00 353.55 -0.14 0.33 4700.00 353.554450.00
20 4300.00 4375.00 106.07 -0.27 0.10 4375.00 106.074450.00
21 4100.00 4225.00 176.78 -0.33 0.17 4225.00 176.784350.00
22 2700.00 3550.00 1202.08 -0.59 1.12 3550.00 1202.084400.00
23 5300.00 5075.00 318.20 0.01 0.30 5075.00 318.204850.00
24 5300.00 5075.00 318.20 0.01 0.30 5075.00 318.204850.00
25 15820.00 15820.00 0.00 4.24 0.00 FALSE FALSE15820.00
Counts 25 25 25 25 24 24
X_dbl_bar / Sx Sr / SR h Critical k Critical Corrected X_dbl_bar / Sx Corrected Sr / SR5054.00 1068.83 2.61 2.67 4605.42 1090.872540.75 2650.77 1219.291 1442.798
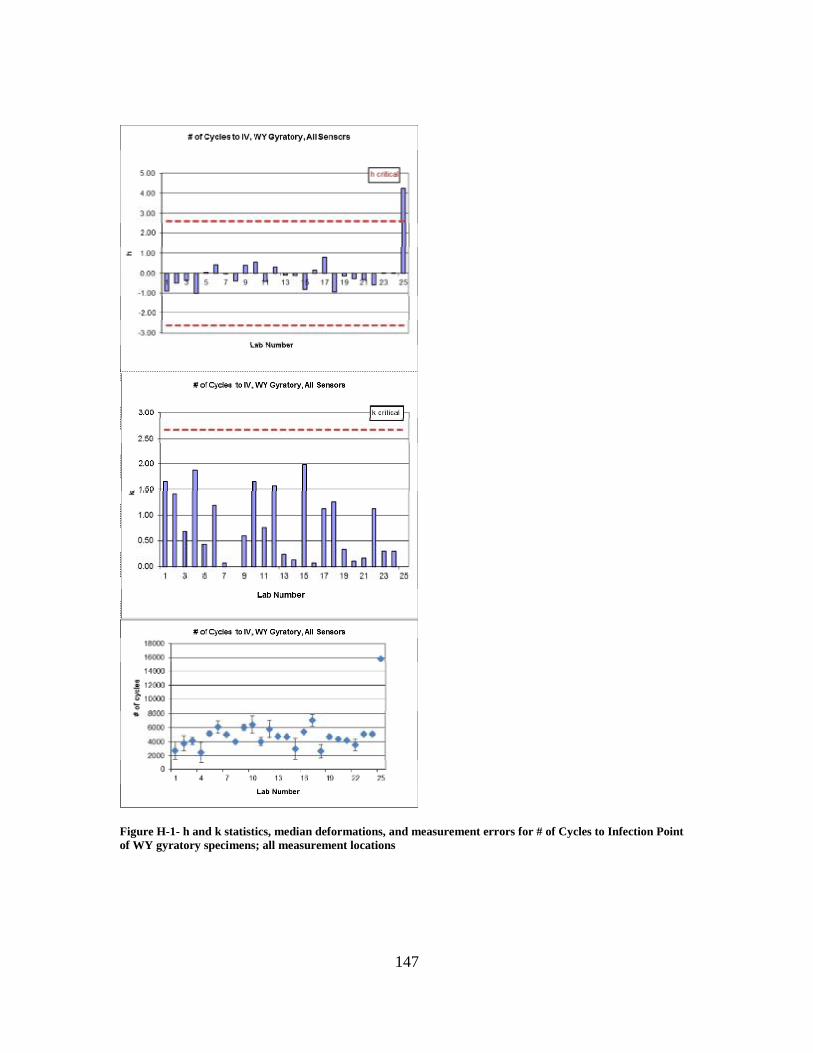
147
Figure H-1- h and k statistics, median deformations, and measurement errors for # of Cycles to Infection Point of WY gyratory specimens; all measurement locations

148
Table H-2- Statistics of # of Cycles to Inflection Point of WY slab specimens; all measurement locations
# Orginal Data X_bar S h k X_bar_corr S_corr
1 6700.00 5950.00 1060.66 -0.88 0.68 5950.00 1060.665200.00
2 10500.00 8300.00 3111.27 0.42 2.00 8300.00 3111.276100.00
3 6300.00 6750.00 636.40 -0.44 0.41 6750.00 636.407200.00
4 11100.00 11550.00 636.40 2.21 0.41 11550.00 636.4012000.00
5 6900.00 8400.00 2121.32 0.47 1.36 8400.00 2121.329900.00
6 5200.00 5050.00 212.13 -1.37 0.14 5050.00 212.134900.00
7 5500.00 6650.00 1626.35 -0.49 1.05 6650.00 1626.357800.00
8 8400.00 6900.00 2121.32 -0.35 1.36 6900.00 2121.325400.00
9 7200.00 7100.00 141.42 -0.24 0.09 7100.00 141.427000.00
10 9400.00 8750.00 919.24 0.67 0.59 8750.00 919.248100.00
Counts 10 10 10 10 10 10
X_dbl_bar / Sx Sr / SR h Critical k Critical Corrected X_dbl_bar / Sx Corrected Sr / SR7540.00 1554.67 2.29 2.45 7540.00 1554.671813.81 2120.94 1813.805 2120.941

149
Figure H-2- h and k statistics, median deformations, and measurement errors for # of Cycles to Infection Point of WY slab specimens; all measurement locations
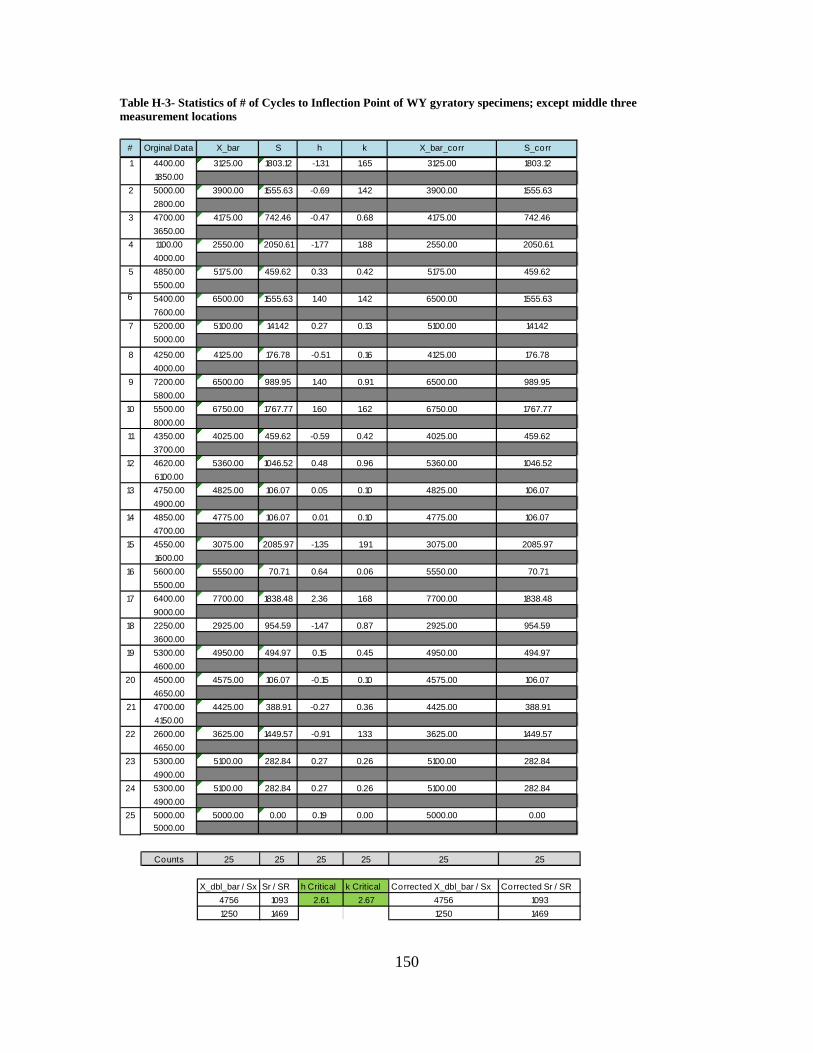
150
Table H-3- Statistics of # of Cycles to Inflection Point of WY gyratory specimens; except middle three measurement locations
# Orginal Data X_bar S h k X_bar_corr S_corr
1 4400.00 3125.00 1803.12 -1.31 1.65 3125.00 1803.121850.00
2 5000.00 3900.00 1555.63 -0.69 1.42 3900.00 1555.632800.00
3 4700.00 4175.00 742.46 -0.47 0.68 4175.00 742.463650.00
4 1100.00 2550.00 2050.61 -1.77 1.88 2550.00 2050.614000.00
5 4850.00 5175.00 459.62 0.33 0.42 5175.00 459.625500.00
6 5400.00 6500.00 1555.63 1.40 1.42 6500.00 1555.637600.00
7 5200.00 5100.00 141.42 0.27 0.13 5100.00 141.425000.00
8 4250.00 4125.00 176.78 -0.51 0.16 4125.00 176.784000.00
9 7200.00 6500.00 989.95 1.40 0.91 6500.00 989.955800.00
10 5500.00 6750.00 1767.77 1.60 1.62 6750.00 1767.778000.00
11 4350.00 4025.00 459.62 -0.59 0.42 4025.00 459.623700.00
12 4620.00 5360.00 1046.52 0.48 0.96 5360.00 1046.526100.00
13 4750.00 4825.00 106.07 0.05 0.10 4825.00 106.074900.00
14 4850.00 4775.00 106.07 0.01 0.10 4775.00 106.074700.00
15 4550.00 3075.00 2085.97 -1.35 1.91 3075.00 2085.971600.00
16 5600.00 5550.00 70.71 0.64 0.06 5550.00 70.715500.00
17 6400.00 7700.00 1838.48 2.36 1.68 7700.00 1838.489000.00
18 2250.00 2925.00 954.59 -1.47 0.87 2925.00 954.593600.00
19 5300.00 4950.00 494.97 0.15 0.45 4950.00 494.974600.00
20 4500.00 4575.00 106.07 -0.15 0.10 4575.00 106.074650.00
21 4700.00 4425.00 388.91 -0.27 0.36 4425.00 388.914150.00
22 2600.00 3625.00 1449.57 -0.91 1.33 3625.00 1449.574650.00
23 5300.00 5100.00 282.84 0.27 0.26 5100.00 282.844900.00
24 5300.00 5100.00 282.84 0.27 0.26 5100.00 282.844900.00
25 5000.00 5000.00 0.00 0.19 0.00 5000.00 0.005000.00
Counts 25 25 25 25 25 25
X_dbl_bar / Sx Sr / SR h Critical k Critical Corrected X_dbl_bar / Sx Corrected Sr / SR4756 1093 2.61 2.67 4756 10931250 1469 1250 1469

151
Figure H-3- h and k statistics, median deformations, and measurement errors for # of Cycles to Infection Point of WY gyratory specimens; except middle three measurement locations

152
Table H-4- Statistics of # of Cycles to Inflection Point of WY slab specimens; except middle three measurement locations
# Orginal Data X_bar S h k X_bar_corr S_corr
1 5500.00 5550.00 70.71 -1.02 0.05 5550.00 70.715600.00
2 10500.00 8250.00 3181.98 0.39 2.15 8250.00 3181.986000.00
3 6500.00 6750.00 353.55 -0.39 0.24 6750.00 353.557000.00
4 11100.00 11800.00 989.95 2.25 0.67 11800.00 989.9512500.00
5 7000.00 8350.00 1909.19 0.45 1.29 8350.00 1909.199700.00
6 5100.00 5000.00 141.42 -1.30 0.10 5000.00 141.424900.00
7 5700.00 6650.00 1343.50 -0.44 0.91 6650.00 1343.507600.00
8 8500.00 7000.00 2121.32 -0.26 1.43 7000.00 2121.325500.00
9 7100.00 6950.00 212.13 -0.28 0.14 6950.00 212.136800.00
10 9200.00 8650.00 777.82 0.60 0.53 8650.00 777.828100.00
Counts 10 10 10 10 10 10
X_dbl_bar / Sx Sr / SR h Critical k Critical Corrected X_dbl_bar / Sx Corrected Sr / SR7495.00 1478.34 2.29 2.45 7495.00 1478.341914.48 2181.28 1914.484 2181.284

153
Figure H-4- h and k statistics, median deformations, and measurement errors for # of Cycles to Infection Point of WY slab specimens; except middle three measurement locations
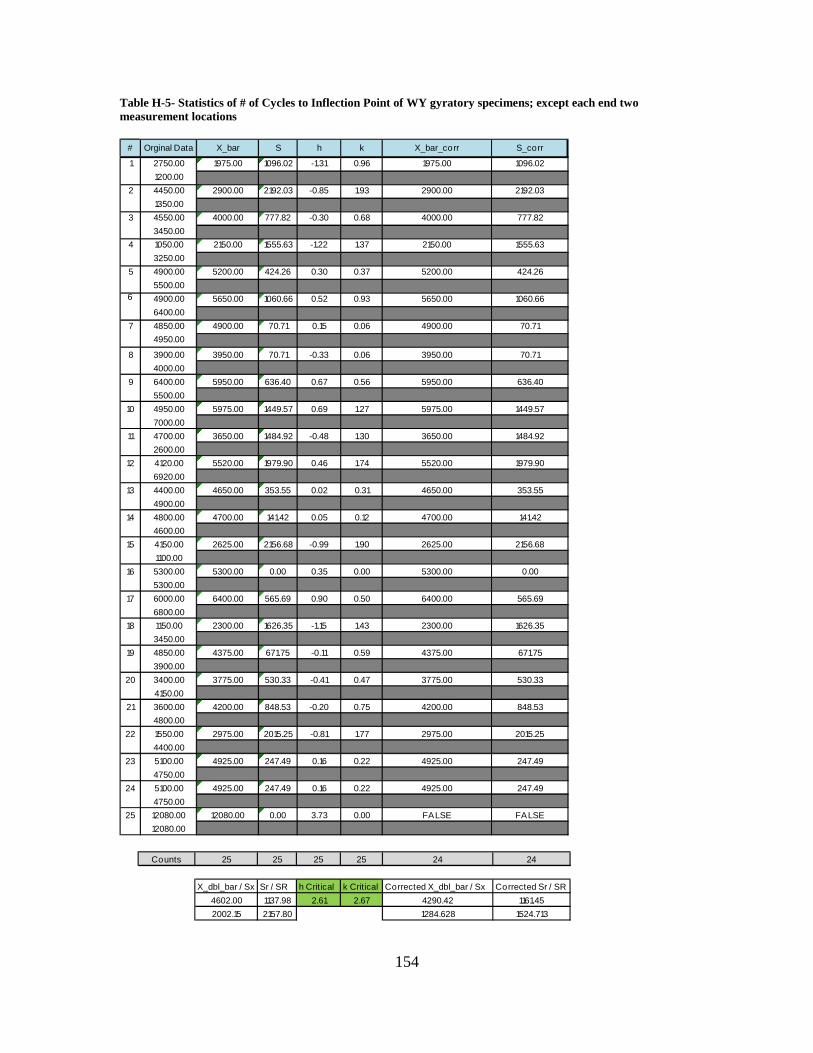
154
Table H-5- Statistics of # of Cycles to Inflection Point of WY gyratory specimens; except each end two measurement locations
# Orginal Data X_bar S h k X_bar_corr S_corr
1 2750.00 1975.00 1096.02 -1.31 0.96 1975.00 1096.021200.00
2 4450.00 2900.00 2192.03 -0.85 1.93 2900.00 2192.031350.00
3 4550.00 4000.00 777.82 -0.30 0.68 4000.00 777.823450.00
4 1050.00 2150.00 1555.63 -1.22 1.37 2150.00 1555.633250.00
5 4900.00 5200.00 424.26 0.30 0.37 5200.00 424.265500.00
6 4900.00 5650.00 1060.66 0.52 0.93 5650.00 1060.666400.00
7 4850.00 4900.00 70.71 0.15 0.06 4900.00 70.714950.00
8 3900.00 3950.00 70.71 -0.33 0.06 3950.00 70.714000.00
9 6400.00 5950.00 636.40 0.67 0.56 5950.00 636.405500.00
10 4950.00 5975.00 1449.57 0.69 1.27 5975.00 1449.577000.00
11 4700.00 3650.00 1484.92 -0.48 1.30 3650.00 1484.922600.00
12 4120.00 5520.00 1979.90 0.46 1.74 5520.00 1979.906920.00
13 4400.00 4650.00 353.55 0.02 0.31 4650.00 353.554900.00
14 4800.00 4700.00 141.42 0.05 0.12 4700.00 141.424600.00
15 4150.00 2625.00 2156.68 -0.99 1.90 2625.00 2156.681100.00
16 5300.00 5300.00 0.00 0.35 0.00 5300.00 0.005300.00
17 6000.00 6400.00 565.69 0.90 0.50 6400.00 565.696800.00
18 1150.00 2300.00 1626.35 -1.15 1.43 2300.00 1626.353450.00
19 4850.00 4375.00 671.75 -0.11 0.59 4375.00 671.753900.00
20 3400.00 3775.00 530.33 -0.41 0.47 3775.00 530.334150.00
21 3600.00 4200.00 848.53 -0.20 0.75 4200.00 848.534800.00
22 1550.00 2975.00 2015.25 -0.81 1.77 2975.00 2015.254400.00
23 5100.00 4925.00 247.49 0.16 0.22 4925.00 247.494750.00
24 5100.00 4925.00 247.49 0.16 0.22 4925.00 247.494750.00
25 12080.00 12080.00 0.00 3.73 0.00 FALSE FALSE12080.00
Counts 25 25 25 25 24 24
X_dbl_bar / Sx Sr / SR h Critical k Critical Corrected X_dbl_bar / Sx Corrected Sr / SR4602.00 1137.98 2.61 2.67 4290.42 1161.452002.15 2157.80 1284.628 1524.713
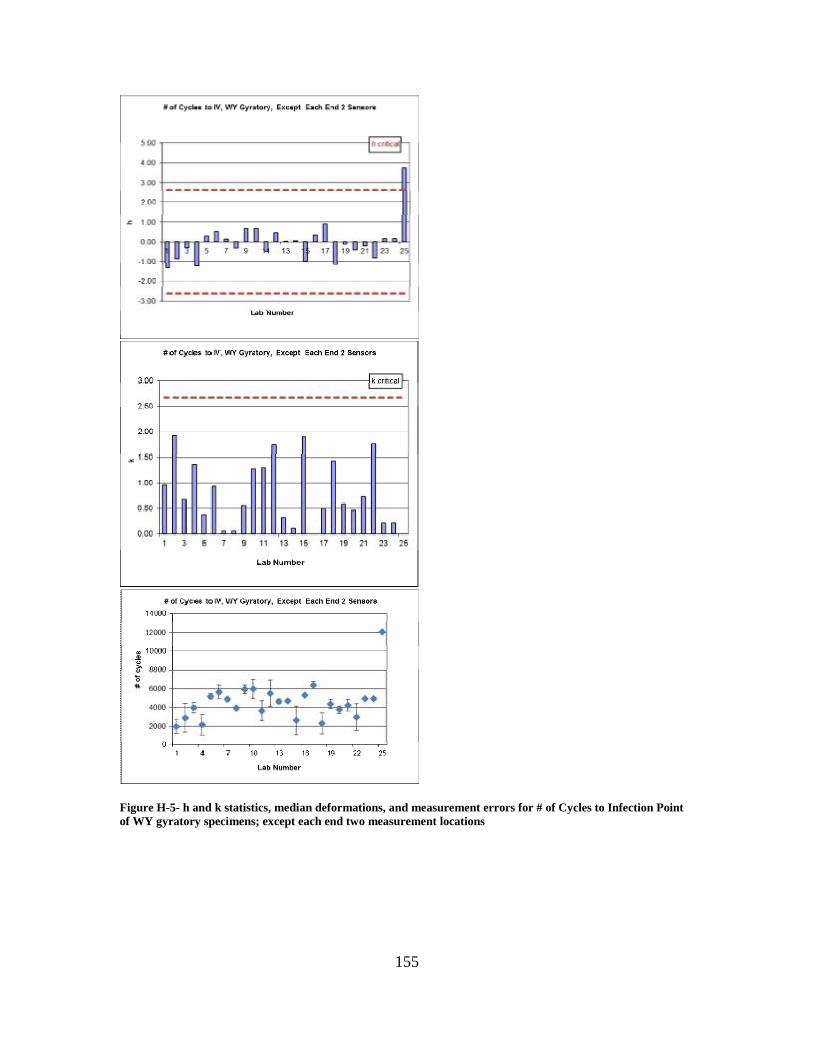
155
Figure H-5- h and k statistics, median deformations, and measurement errors for # of Cycles to Infection Point of WY gyratory specimens; except each end two measurement locations

156
Table H-6- Statistics of # of Cycles to Inflection Point of WY slab specimens; except each end two measurement locations
# Orginal Data X_bar S h k X_bar_corr S_corr
1 6500.00 5850.00 919.24 -0.61 0.51 5850.00 919.245200.00
2 10300.00 8150.00 3040.56 0.46 1.68 8150.00 3040.566000.00
3 6100.00 6550.00 636.40 -0.28 0.35 6550.00 636.407000.00
4 10900.00 11300.00 565.69 1.92 0.31 11300.00 565.6911700.00
5 6400.00 8100.00 2404.16 0.44 1.33 8100.00 2404.169800.00
6 5200.00 5075.00 176.78 -0.97 0.10 5075.00 176.784950.00
7 5500.00 3375.00 3005.20 -1.76 1.66 3375.00 3005.201250.00
8 8700.00 6950.00 2474.87 -0.10 1.37 6950.00 2474.875200.00
9 7200.00 7850.00 919.24 0.32 0.51 7850.00 919.248500.00
10 8600.00 8400.00 282.84 0.58 0.16 8400.00 282.848200.00
Counts 10 10 10 10 10 10
X_dbl_bar / Sx Sr / SR h Critical k Critical Corrected X_dbl_bar / Sx Corrected Sr / SR7160.00 1808.52 2.29 2.45 7160.00 1808.522155.68 2506.46 2155.684 2506.461

157
Figure H-6- h and k statistics, median deformations, and measurement errors for # of Cycles to Infection Point of WY slab specimens; except each end two measurement locations

158
APPENDIX I- RECOMMENDED PRECISION ESTIMATES FOR AASHTO T324
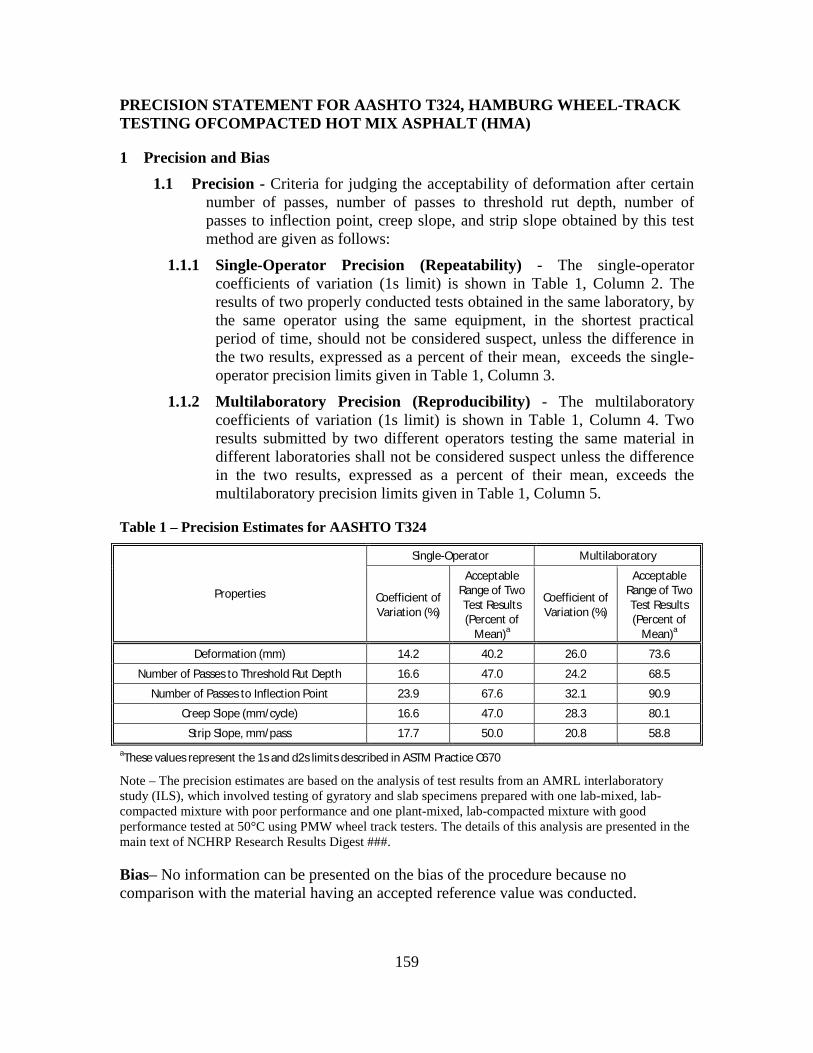
159
PRECISION STATEMENT FOR AASHTO T324, HAMBURG WHEEL-TRACK TESTING OFCOMPACTED HOT MIX ASPHALT (HMA)
1 Precision and Bias 1.1 Precision - Criteria for judging the acceptability of deformation after certain
number of passes, number of passes to threshold rut depth, number of passes to inflection point, creep slope, and strip slope obtained by this test method are given as follows:
1.1.1 Single-Operator Precision (Repeatability) - The single-operator coefficients of variation (1s limit) is shown in Table 1, Column 2. The results of two properly conducted tests obtained in the same laboratory, by the same operator using the same equipment, in the shortest practical period of time, should not be considered suspect, unless the difference in the two results, expressed as a percent of their mean, exceeds the single-operator precision limits given in Table 1, Column 3.
1.1.2 Multilaboratory Precision (Reproducibility) - The multilaboratory coefficients of variation (1s limit) is shown in Table 1, Column 4. Two results submitted by two different operators testing the same material in different laboratories shall not be considered suspect unless the difference in the two results, expressed as a percent of their mean, exceeds the multilaboratory precision limits given in Table 1, Column 5.
Table 1 – Precision Estimates for AASHTO T324
Properties
Single-Operator Multilaboratory
Coefficient of Variation (%)
Acceptable Range of Two Test Results (Percent of
Mean)a
Coefficient of Variation (%)
Acceptable Range of Two Test Results (Percent of
Mean)a
Deformation (mm) 14.2 40.2 26.0 73.6
Number of Passes to Threshold Rut Depth 16.6 47.0 24.2 68.5
Number of Passes to Inflection Point 23.9 67.6 32.1 90.9
Creep Slope (mm/cycle) 16.6 47.0 28.3 80.1
Strip Slope, mm/pass 17.7 50.0 20.8 58.8 aThese values represent the 1s and d2s limits described in ASTM Practice C670
Note – The precision estimates are based on the analysis of test results from an AMRL interlaboratory study (ILS), which involved testing of gyratory and slab specimens prepared with one lab-mixed, lab-compacted mixture with poor performance and one plant-mixed, lab-compacted mixture with good performance tested at 50°C using PMW wheel track testers. The details of this analysis are presented in the main text of NCHRP Research Results Digest ###.
Bias– No information can be presented on the bias of the procedure because no comparison with the material having an accepted reference value was conducted.