precision engineering - economic development board · pdf filedeveloped the asia competition...
TRANSCRIPT
Asia Competition BarometerPrecision engineeringAn Economist Intelligence Unit report
Supported by
© The Economist Intelligence Unit Limited 2012 1
Asia Competition Barometer:Precision engineering
Contents
Preface 2
Executive summary 3
Asia’s growing importance for corporate performance and global competitiveness 5
Competition and profitability at Asian firms 7 Competition: Marginal increase 7
Profitability:Areturntothepeak 9
Case study: World Precision Machinery 11
Positioning for success in Asia 12 SustainedgrowthinAsia 12
Semiconductorsandsolar:Asiangrowthstories 13
Case study: Applied Materials 15
Outlook 16
Barometer methodology 18
© The Economist Intelligence Unit Limited 20122
Asia Competition Barometer:Precision engineering
SupportedbySingapore’sEconomicDevelopmentBoard(EDB),theEconomistIntelligenceUnithasdevelopedtheAsiaCompetitionBarometerwiththeaimofunderstandingthechangingmarketdynamicsinkeysectorsandassessingtheintensityofcompetitioninthem.Drawinguponcompany-leveldataonprofitabilityandotherindicators,theBarometerquantifiesthechangingdynamicsofcompetitivenessinAsiaforselectindustriesbetween2004and2009.
ThisreportfocusesontheBarometerfindingsfortheprecisionengineering(PE)sector.Assessingauniverseofover200PEcompaniesthatarepubliclylistedineightcountries—China,India,Indonesia,Malaysia,thePhilippines,Singapore,ThailandandVietnam—theBarometerexamineschangingprofitabilityandthecompetitionlandscapeforthesector.
Otherreportsinthisserieslookattheinformationtechnologyservices,petrochemicalsandchemicals,pharmaceuticals,andtransportandlogisticssectorsinAsia.
January2012
Preface

© The Economist Intelligence Unit Limited 2012 3
Asia Competition Barometer:Precision engineering
Executive summary
WhatdoestheemergenceofAsiaasamajorengineofglobaleconomicgrowthmeanforcompaniesoperatingintheregion?Asia’srobusteconomicoutlook—coupledwithdiminishedgrowth
prospectsinmanyotherpartsoftheworld—hasattractednewinvestmentintothemarketbothfromregionalplayersandWesternmultinationals.Asaresult,competitionintheregionisexpectedtointensify.Giventhedarkeningglobaleconomicoutlook,andtheexpectedimpactonsomeeconomiesandsectorsintheregion,growthandprofitabilitylookuncertaininthenearterm.Butoverthemediumtolongerterm,Asia’sstrongeconomicfundamentalswillensureconsistentgrowthacrossarangeofindustries.HowarecompaniespositioningthemselvestocapitaliseonAsia’sgrowthoverthenextfewyears?
TheAsiaCompetitionBarometerassessestheintensityofcompetitionandchangingmarketdynamicsinseveralkeysectors.Thisreportexaminestheprecisionengineering(PE)sector,whichincludesthefollowingsub-segments:instrumentsandappliancesformeasuring,testingandnavigation,irradiation,electromedicalandelectrotherapeuticequipment,opticalinstrumentsandphotographicequipment,power-drivenhandtools,metal-formingmachinery,othermachinetools,otherspecial-purposemachinery,airandspacecraftandrelatedmachineryandmedicalanddentalequipmentandsupplies.
Amongthekeyfindingsofthisreportarethefollowing:
• Over the past decade, Asia’s emergence as a manufacturing powerhouse has led to a boom in demand for PE products.PEcomponentsandmachineryformthebackboneofmanyindustrialprocesses,includingintheautomotive,aerospaceanddefence,consumerelectronics,solarenergyandmedicaldevicesectors.AsmanufacturingfirmsinAsiamoveupthevaluechaintoproduceevermoresophisticatedproducts,theywillfurtherboostdemandforPEproducts.
• Profitability in Asia’s PE sector has continued to grow, despite the global financial crisis.Profitabilityplummetedin2005,butsincethenhassteadilyincreased.Theaveragegrossmarginofpublicly-
© The Economist Intelligence Unit Limited 20124
Asia Competition Barometer:Precision engineering
listedAsianfirmsdeclinedfrom43.1%in2004to27.6%in2005.Thiswasduelargelytoanincreaseincompetitionandaspikeinmaterialcoststhatyear.Theaveragegrossmarginthenrosesteadilytoreach37.4%by2009.OfthefivesectorsthattheEconomistIntelligenceUnitanalysedforthisBarometer,PEistheonlyonewhereprofitabilitycontinuedtogrowuninterruptedthroughthelastglobaleconomicslowdown,partlyduetostrongregionaldemand.CombinedoperatingrevenuesincreasedfromUS$26.6bnin2007toUS$35.1bnin2009.
• Rising private consumption in Asia has boosted demand for PE products and services, but whether it can replace demand in the West remains to be seen.TheriseofAsia’smiddleclasshasbeenaccompaniedbyanincreaseindiscretionaryspending,particularlyongoodssuchascars,mobilephonesandcomputers.Thishas,inturn,drivengrowthintheregion’sPEsector.Still,itremainstobeseenifthisindigenousregionalgrowthwillbeabletooffsetthelikelyslowdownindemandintheWestoverthenextfewyears.PEfirms’successoverthenextfewyearswilldependonhowaccuratelytheyhaveplannedforandmanagedthisshift,particularlygiventhebroaderglobalmacroeconomicuncertainty.
• The PE industry is evolving rapidly, as low-cost Asian producers and high-technology Western firms seek to acquire each other’s competitive advantages.GlobalPEfirmshavebeenmovingintoAsiatotapitsburgeoningmarket,andtolowertheirproductioncostsbyshiftingcapacityfromhigher-costcountriestoAsia.Meanwhile,Asiancompanieshavebeenadaptingtothiscompetitivethreatbyplacingagreateremphasisontechnologicaladvancementinordertomoveupthevaluechainandproducemoresophisticatedmachinery.AsianPEfirmsareeagertotransformfrombeingsimplecontractmanufacturerstoprovidingproductionandsupplychainmanagementcapabilities.Thisemphasisisreflectedinafive-foldincreaseinAsianfirms’totalR&Dexpenditurebetween2004and2009.Asaresult,Asia’sPEindustryhasbeenwitnessingtheconfluenceoftwohithertodistinctbusinessmodels.
• The number and size of players in Asia’s PE sector is growing.Thenumberandsizeofpublicly-listedfirmsinthePEsectorinAsiahasincreaseddramatically.Thetotalnumberoflistedcompaniesintheindustryincreased57%between2004and2009,from131firmsto206.Overthesameperiod,thetotalcombinedrevenueofpublicly-listedPEcompaniesmorethantripledfromUS$9.8bntoUS$35.1bn;thesefirms’combinedtotalassetsrosefromUS$13bntoUS$63.3bn.
• Competition has increased only marginally, with the industry’s biggest players continuing to expand their positions.CompetitioninthePEindustrygrewsignificantlybetweentheyears2004and2006,largelyduetoaninfluxofnewplayersintothesector.However,between2006and2009,thelargestfirmsintheindustrybegantosteadilyincreasetheirconcentration,partlybyexploitingeconomiesofscale.Arelatedtrendthathasbenefittedlargefirmsisgreaterverticalintegration,asPEcompaniesseektodiversifytheirproductofferingsandprovidemorecomprehensiveend-to-endservicestotheircustomers.InthefuturethesectorislikelytobecharacterisedbyfiercecompetitionbetweenbigAsianandnon-Asianplayers,whomayincreasinglyresembleoneanother.

© The Economist Intelligence Unit Limited 2012 5
Asia Competition Barometer:Precision engineering
Asia’s growing importance for corporate performance and global competitiveness
Overthepastdecade,Asiahasrapidlygrowninimportancetotheglobaleconomy.ItsshareofglobalGDP,measuredinpurchasing-powerparityterms,increasedfrom26.8%in2001to33.8%in2010.1
By2016,theEconomistIntelligenceUnit(EIU)expectsthisproportiontoriseto38.9%.ThereareseveralbroadtrendsthathavebeendrivingAsia’sPEsector.ThefirstisAsia’semergenceasa
globalmanufacturingpowerhouse.Overthepastdecade,Asia’sshareofglobalmanufacturingoutputhasincreaseddramatically,ledbyChina(seeFigure1).Thishasboosteddemandforprecisionengineering(PE)productsthatareusedtomanufactureavarietyofgoods.
Thesecondtrend,whichishelpingtounderpinthefirst,relatestorisingprivateconsumptioninAsia,whichisboostingregionaldemandformanufacturedgoods.DuetoAsia’srapideconomicgrowthoverthelastfewyears,theregionisnowhometoahugeandgrowingmiddleclass.TheAsianDevelopmentBank(ADB)estimatesthatbetween1990and2008developingAsia’smiddleclasspopulationmorethantripledfrom565mto1.9bn.Asashareofthetotalpopulation,themiddleclassgrewfrom21%to56%overthatperiod.2
1AsiahereincludesBangladesh,China,HongKong,Indonesia,India,Japan,SouthKorea,Malaysia,Myanmar,Philippines,Pakistan,Singapore,SriLanka,Thailand,Taiwan,andVietnam
2“TheriseofAsia’smiddleclass”.AsianDevelopmentBank.2010Figure 1: Share of world manufacturing output
(%, constant 2000 US$)
0
3
6
9
12
15
IndiaTaiwanSouth KoreaASEANChina
2000 2009
Source: UNIDO

© The Economist Intelligence Unit Limited 20126
Asia Competition Barometer:Precision engineering
Thesenewconsumershavebeenspendingonproductssuchascars,mobilephonesandcomputers.Between2001and2010,mobilephonepenetrationinAsiaandAustralasiarosefrom10.9%to70.6%whilepersonalcomputerpenetrationincreasedfrom4.4%to18.7%(seeFigure2).Overthatsameperiod,thestockofpassengercarsper1000peopleintheregiongrewfrom34.2unitsto54.1.Asiahassomeofthefastestgrowingautomobilemarketsaswellassomeofthelargestautomobilemanufacturersintheworld.In2009,ChinaovertooktheUnitedStatesastheworld’sbiggestcarmarket.Between2011and2015,theEIUexpectsAsiatosee157.5mmorepassengervehiclesand54.7mmorecommercialvehiclesonitsroads.
Importantly,allthreemarketscontinuedtoexpandrightthroughtheglobaleconomicdownturnin2008-09,reflectingtheresilienceofAsianprivateconsumption.TheEconomistIntelligenceUnit(EIU)forecaststhatby2016,therewillbe84.8carsper1000people,whilemobileandcomputerpenetrationwillhavereached112%and32.5%respectively.
ThethirdtrenddrivingAsia’sPEindustryisthegrowingglobalinterestinrenewableenergy,duetoconcernsovertheenvironmentanddeclininghydrocarbonstocks.Thisisboostingdemandfor,amongotherthings,solarphotovoltaic(PV)cells,whichusesemiconductorsmadewithPEproducts.AsianmanufacturersdominatetheglobalindustryintheproductionofsolarPVcells.CombinedPVproductioninChina,TaiwanandJapanincreasedfromlessthan700MWin2004to16,800MWin2010,accountingforsome70%ofthe24,000MWglobalproductionthatyear.3RussellTham,regionalpresidentofAppliedMaterialsSouthEastAsia,saysthatalthoughAppliedMaterialsenteredthesolarbusinessonlyin2006,ithasbeenthefirm’sfastestgrowingsegment,andnowcontributesabout20%ofitsrevenues.AppliedMaterialsalsonowrunsasolarR&DcentreinXi’an,China.
3EarthPolicyInstitute,2001.
Figure 2: Asia and Australasia consumption
0
20
40
60
80
100
120PCs (per 100)Mobiles subs (per 100)Cars (per 1,000)
2016201520142013201220112010200920082007200620052004200320022001
Source: Economist Intelligence Unit
© The Economist Intelligence Unit Limited 2012 7
Asia Competition Barometer:Precision engineering
Competition and profitability at Asian firms
Thenumberandsizeofpublicly-listedfirmsinthePEsectorinAsiahasincreaseddramatically.Thenumberoflistedcompaniesincreased57%between2004and2009,from131firmsto206.Over
thesameperiod,thetotalcombinedrevenueofpublicly-listedPEcompaniesmorethantripledfromUS$9.8bntoUS$35.1bn,whiletheircombinedtotalassetsrosefromUS$13bntoUS$63.3bn.Meanwhile,whilethereisnoauthoritativedataonforeigndirectinvestmentinthePEsector,mediareportsandindustryinterviewsindicatearapidincreaseininvestment.Theinfluxofnewplayers,bothAsianandnon-Asian,intotheregion’sPEsectorhasledtoamarginallymorecompetitiveoperatingenvironment.
Competition: Marginal increaseWithmanycompaniesraisingtheirexpectationsofAsiatodelivergrowthandprofits,itisreasonabletoexpectcompetitionintensityintheregiontoincrease.TocapturethisintensitywehaveusedtheHerfindahl–HirschmanIndex(HHI),whichmeasuresthemarketconcentrationofanindustry’slargestfirms.HHIvaluescanrangefrom0(extremelyfragmentedmarket)to1.0(monopoly).Herewehavemultipliedthevaluesby100toachieveascaleconsistentwithprofitabilityindicators(seebelow).TheHHIforAsia’sPEindustrydecreasedfrom10.39in2004to9.30in2009,afterhavinghitalowof5.87in2006(seeFigure3),signifyingthatthe50biggestfirmsintheBarometersawamarginaldecreaseinconcentrationbetween2004and2009.4
CompetitioninthePEindustrygrewsignificantlybetweentheyears2004and2006.TheHHIdroppedfrom10.39to5.87overthatperiod,signifyingthatthemarketshareofthe50biggestfirmsdeclinedsubstantially.Thisislargelybecauseofaninfluxofnewplayers—inthosetwoyears,40newAsiancompaniesenteredtheindustry,capturingmuchoftherapidlygrowingmarket.
However,between2006and2009,thelargestfirmsintheindustrybegantosteadilyincreasetheirconcentrationonceagain.TheHHIrosefrom5.87to9.30overthatperiod.Therearetworeasonsforthis.
4Ameasureofthesizeofcompanies in relation to the industry,andanindicatoroftheamountofcompetitionamongthem,theHHIisdefinedasthesumofthesquaresofthemarketsharesofthe50largestfirmsfromtheuniverseofover200listedcompaniesassessed.FormoreinformationontheBarometermethodology,pleaserefertothelastsectioninthisreport.

© The Economist Intelligence Unit Limited 20128
Asia Competition Barometer:Precision engineering
Figure 3: Herfindahl–Hirschman Index
4
6
8
10
12
200920082007200620052004
Source: Economist Intelligence Unit
2004 2005 2006 2007 2008 2009
Herfindahl—Hirschman Index (HHI) 10.39 8.63 5.87 7.73 8.44 9.30
First,from2007to2009,onlyahandfulofnewcompaniesenteredthesector,hencetheincumbentswereabletogrowtheirmarketshare.
Second,overthepastfewyears,PEfirmshaveengagedinfiercepricecompetition,drivingdowncostsbyimprovingtheefficiencyoftheirproductionprocesses.Inthisenvironment,thelargercompanieshavebeenbetterabletoexploiteconomiesofscale,improvingtheircompetitivepositionandwinningmarketshare.Arelatedtrendthathasbenefittedlargefirmsisgreaterverticalintegration,asPEcompaniesseektodiversifytheirproductofferingsandprovidemorecomprehensiveend-to-endservicestotheircustomers.
Thefivelargestcompaniesby2009turnover—Larsen&Toubro,ChinaCSSCHoldings,Xi’anAircraftInternational,TaiyuanHeavyIndustryandChinaErzhongGroup(Deyang)HeavyIndustries—aresignificantlybiggerthantheirpeers(seeFigure4).
IndustrytrendssuggestthattherewillbeincreasedpriceandtechnologycompetitioninAsia.Non-Asianfirmshaveenteredtheregionoverthelastfewyearstolowertheirproductioncostsandbecloserto
Figure 4: Top ten companies by turnover
Company Country of origin 2004 turnover (US$bn) 2009 turnover (US$bn)
Larsen&Toubro India 3.39 9.89
ChinaCSSCHoldings China N.A. 3.80
Xi'anAircraftInternational China 0.15 1.24
TaiyuanHeavyIndustry China 0.28 1.21
ChinaErzhongGroup(Deyang)HeavyIndustries China N.A. 1.13
ShenyangMachineTool China 0.47 0.90
KNMGroup Malaysia 0.56 0.61
Hi-PInternational Singapore 0.44 0.59
DahengNewEpochTechnology China 0.43 0.49
AlstomProjectIndia India 0.19 0.46
Note:ThesearethetenbiggestcompaniesbyturnoverthatwereanalysedintheBarometer,whichconsideredonlypubliclylistedfirmsineightcountries:China,India,Indonesia,Malaysia,thePhilippines,Singapore,ThailandandVietnam

© The Economist Intelligence Unit Limited 2012 9
Asia Competition Barometer:Precision engineering
keyclients.Meanwhile,Asiancompaniesthathavehithertocompetedmainlyonpricearenowfocussedonlearningnewtechnologiestomoveupthevaluechain,saysShaoJianJun,executivedirectorandCEOofWorldPrecisionMachinery,anintegratedmanufacturerofprecisionmetalstampingmachines.Asaresult,thesetwopreviouslydistinctPEbusinessmodels—broadly,thehigh-technologyWesternmodelandthelow-costAsianone—arebeginningtomeld.
Profitability: A return to the peakTomeasuretheprofitabilityofthePEsector,wedevelopedacompositeindexoffiveratiosthatmeasuredifferentaspectsofacompany’smargins(formoredetails,seethenoteonmethodologyattheendofthisreport).AccordingtoourBarometer,withtheexceptionofgrossmargin,allotherprofitmarginshaverisenrelativeto2004(seeFigure5).
TherewasasharpfallintheProfitabilityIndexin2005,whichcanbelargelyattributedtoasharpfallingrossmarginfrom43.1%to27.6%.5Grossmarginalsodeclinedmarginallyin2006to27.2%.Thefallingrossmarginintheyears2005and2006canbeattributedtoanincreaseincompetitionandhighermaterialcosts.First,theincreaseincompetitionin2005and2006(seeFigure3)couldhavehadanegativeimpactongrossmargins.Second,in2005materialcostsmorethandoubledtoUS$3.5bnfromUS$1.6bnin2004.Overthatsameyear,combinedoperatingrevenuesincreasedonly25%toUS$12.3bn.Thishurtgrossmarginsin2005.
Sincethatyear,however,AsianPEcompanieshaveseenasteady,albeitgradual,increaseinoverallprofitabilityresultinginthesamelevelsofprofitabilityin2009asin2004.Thiscanlargelybeattributed
Figure 5: Profitability Index
90
105
120
135
150
200920082007200620052004
Source: Economist Intelligence Unit
2004 2005 2006 2007 2008 2009
Profitability index 126.1 100.0 102.2 111.8 117.5 126.1
EBITDAmargin(%) 11.7 12.0 12.1 14.0 13.0 14.4
Grossmargin(%) 43.1 27.6 27.2 30.5 34.2 37.4
Returnoncapitalemployed(%) 10.2 13.3 14.8 13.5 13.4 12.6
Returnonequity(%) 7.5 11.9 14.3 13.6 13.8 13.2
Returnonassets(%) 2.7 4.4 5.1 5.5 5.3 5.3
Herfindahl—Hirschman Index (HHI) 10.39 8.63 5.87 7.73 8.44 9.30
5ThecompositeProfitabilityIndexismadeupoffiveratios that each represents adifferentaspectofacompany’sprofitability.FormoreinformationontheBarometermethodology,pleaserefertothelastsectioninthisreport.

© The Economist Intelligence Unit Limited 201210
Asia Competition Barometer:Precision engineering
tooperatingrevenuesincreasingfasterthanmaterialcostsfrom2006to2009,contributingtohighergrossmargins.
Indeed,ofthefivesectorsthattheEIUstudiedforthisBarometer,thePEindustryistheonlyonewhereprofitabilitycontinuedtogrowuninterruptedthroughthelastglobaleconomicslowdown.CombinedoperatingrevenuesincreasedfromUS$26.6bnin2007toUS$33.5bnin2008andUS$35.1bnin2009.ThissuggeststhateventhoughmanufacturingexportstodevelopedWesterncountriesdeclinedduringthisperiod,thiswassomewhatoffsetbyindigenousAsiandemandaswellasgrowthinnewmanufacturingsegments.Forinstance,Asia’sproductionofsolarPVcellsincreasedsignificantlyinboth2008and2009.Additionally,AsianmanufacturersmayhavecontinuedtoinvestinPEmachineryinanticipationoffuturedemand.
Inthecomingyears,MrThamatAppliedMaterialsexpectstosee“growthopportunitiesinthesemiconductorindustrypropelledbythewirelessandmobilemarkets,asconsumersdemandanincreasinglynetworkedsocietywithvisuallyrichandinteractivedevicesanytime,anyplace”.Heexpectsasurgeinconsumptionfromtheemergingworld’smiddleclassasproductsbecomemoreaffordable.However,profitabilitywilldependnotonlyonglobaleconomicgrowth,butalsooncostsandtechnology.MrThambelievesthatcompanieswillneedtocontinueinvestinginR&Dtoproducenewertechnologiesatcheapercosts.
© The Economist Intelligence Unit Limited 2012 11
Asia Competition Barometer:Precision engineering
Case study: World Precision Machinery
World Precision Machinery: Moving up the technology ladderWorldPrecisionMachinery(WPM),anintegratedmanufacturerof
precisionmetalstampingmachinesbasedinJiangsu,China,hasseenitsrevenuesmultiplyfive-foldbetween2005and2010.Inthefirstninemonthsof2011,thefirmhadrevenuesofRMB947.9m(US$150.1m),amountingtoyear-on-yeargrowthof30%.
ShaoJianJun,thecompany’sexecutivedirectorandCEO,saysWPMderivesmorethan95%ofitssalesfromChinacurrentlyandthatAsia’sstandingastheworld’smanufacturinghubwillcontinuetopresentbusinessopportunitiesforthecompanyas“thestampingindustryformsthebackboneofmanymanufacturingindustries”.WPMiscurrentlyoneofthethreelargestmanufacturersofmetalstampingmachinesinChina.Itmostlysuppliesmanufacturersinhomeappliances(34%ofrevenues),automobiles(32%)andelectronics(15%),whileitearnstherestofitsrevenuefromseveralothersectors.
MrShaoattributestheprofitabilityintheindustryto“aboominmarketdemand,[therisingvalueof]brandnames,pricecompetitivenessandtechnologyinnovation”.However,headds
thattheintensityofcompetitioninthesectorinAsiahasincreasedconsiderably.“MoreandmoremanufacturingplantshavemovedintoAsia,”hesays.Manynon-Asianfirmshavesetupplantsintheregioneitherindependentlyorthroughjointventures.Forinstance,globalplayerssuchasKLA-TencorandAppliedMaterialshaveinvestedinmanufacturingplantsandresearchandsupportcentresindestinationssuchasChina,India,Malaysia,SingaporeandTaiwan.
MrShaoexpectsstiffcompetitioninthePEsectoroverthenextfewyears.HesaysthatAsianfirmshavestartedtomoveupthetechnologyladder,whilenon-AsianfirmsthathaveanAsianpresencehavestartedloweringproductioncosts.
Inthefaceofthisrisingcompetition,akeypartofWPM’sstrategyisverticalintegration:thecompanyhasthecapabilitytodesign90%oftheequipmentitproduces.AccordingtoMrShao,overthenextfiveyears,profitabilityinthePEindustrywillbedrivenbymarketdemandontheonehand,andcostcontrol,productionefficiencyandpricecompetitivenessontheother.Technologyinnovationwillalsobeimportant,hesays.ThisisreflectedinWPM’sdecisiontoemploymorethan200R&DandtechnicalstaffintwoChinesecities,DanyangandShanghai.
1Companypresentation.WorldPrecisionMachinery.5-6January2012.

© The Economist Intelligence Unit Limited 201212
Asia Competition Barometer:Precision engineering
Figure 6: Private consumption(% real growth p.a.)
-2
0
2
4
6
8
10USSingaporeIndonesiaIndiaEuro Area (AGG)China
2016201520142013201220112010
Source: Economist Intelligence Unit
Positioning for success in Asia
Sustained growth in Asia
Giventhelong-termstructuralproblemsinmanyWesternmarketsandemergingAsia’slargelybullisheconomicfundamentals,theshiftintradeandinvestmentfromtheWesttoAsiawillcontinue.Asia’s
economicgrowthisexpectedtocontinueoutpacingthegrowthofOECDcountries.TheEIUestimatesthatby2016theeightAsiancountriesinthisstudyalonewillaccountfor28.9%ofglobalGDP(measuredinpurchasing-powerparityterms),upfrom23.2%in2010.
AcriticalquestionforAsia’smanufacturingandPEindustriesiswhethertheriseinAsiandemandcanoffsetthesluggishgrowthindevelopedWesternmarkets.China’smerchandiseexportstoEuropefell7.5%month-on-monthinSeptember2011and9%inOctober2011whileitstotalexportsdeclinedby7.2%inthatmonth.China’spurchasingmanager’sindex,aproxyformanufacturingsectorperformance,declinedforthefirsttimeinthreeyearsinNovember2011,registeringasub-50reading,denotingacontractioninfactoryactivity.Itstayedbelow50inDecember2011andJanuary2012.Meanwhile,thecrisisintheeurozonecountriesandtheslowrecoveryintheUSsignificantlyraisetheriskofaglobal
© The Economist Intelligence Unit Limited 2012 13
Asia Competition Barometer:Precision engineering
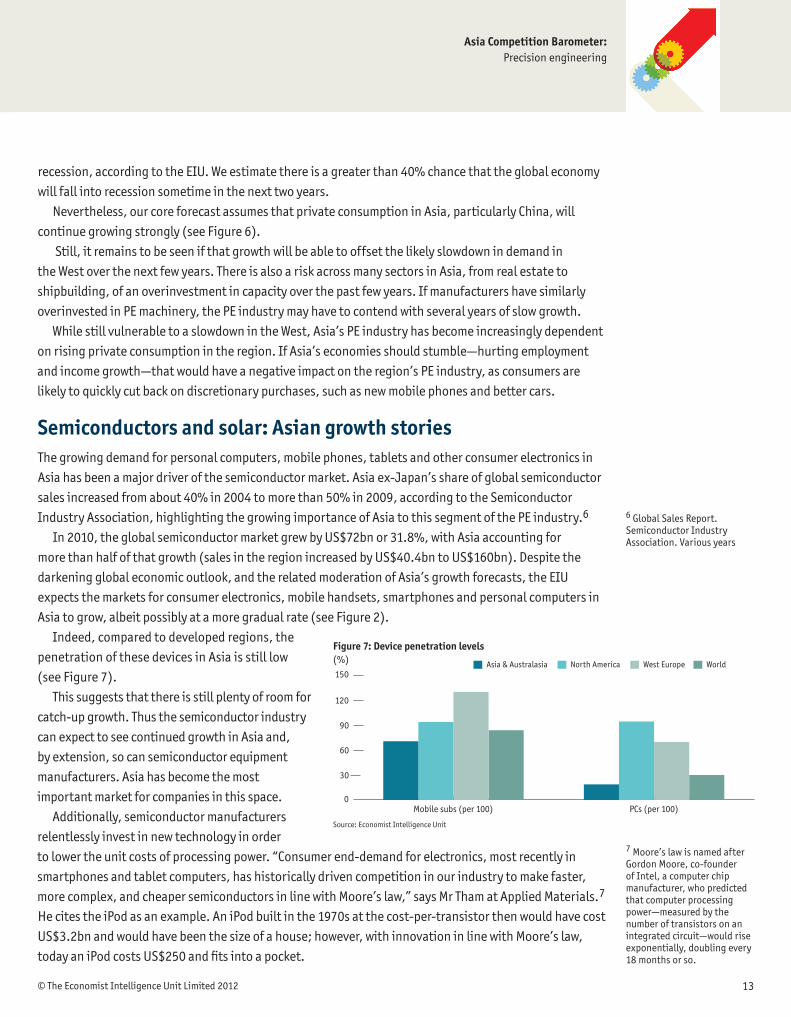
Figure 7: Device penetration levels(%)
0
30
60
90
120
150WorldWest EuropeNorth AmericaAsia & Australasia
PCs (per 100)Mobile subs (per 100)
Source: Economist Intelligence Unit
recession,accordingtotheEIU.Weestimatethereisagreaterthan40%chancethattheglobaleconomywillfallintorecessionsometimeinthenexttwoyears.
Nevertheless,ourcoreforecastassumesthatprivateconsumptioninAsia,particularlyChina,willcontinuegrowingstrongly(seeFigure6).
Still,itremainstobeseenifthatgrowthwillbeabletooffsetthelikelyslowdownindemandintheWestoverthenextfewyears.ThereisalsoariskacrossmanysectorsinAsia,fromrealestatetoshipbuilding,ofanoverinvestmentincapacityoverthepastfewyears.IfmanufacturershavesimilarlyoverinvestedinPEmachinery,thePEindustrymayhavetocontendwithseveralyearsofslowgrowth.
WhilestillvulnerabletoaslowdownintheWest,Asia’sPEindustryhasbecomeincreasinglydependentonrisingprivateconsumptionintheregion.IfAsia’seconomiesshouldstumble—hurtingemploymentandincomegrowth—thatwouldhaveanegativeimpactontheregion’sPEindustry,asconsumersarelikelytoquicklycutbackondiscretionarypurchases,suchasnewmobilephonesandbettercars.
Semiconductors and solar: Asian growth storiesThegrowingdemandforpersonalcomputers,mobilephones,tabletsandotherconsumerelectronicsinAsiahasbeenamajordriverofthesemiconductormarket.Asiaex-Japan’sshareofglobalsemiconductorsalesincreasedfromabout40%in2004tomorethan50%in2009,accordingtotheSemiconductorIndustryAssociation,highlightingthegrowingimportanceofAsiatothissegmentofthePEindustry.6
In2010,theglobalsemiconductormarketgrewbyUS$72bnor31.8%,withAsiaaccountingformorethanhalfofthatgrowth(salesintheregionincreasedbyUS$40.4bntoUS$160bn).Despitethedarkeningglobaleconomicoutlook,andtherelatedmoderationofAsia’sgrowthforecasts,theEIUexpectsthemarketsforconsumerelectronics,mobilehandsets,smartphonesandpersonalcomputersinAsiatogrow,albeitpossiblyatamoregradualrate(seeFigure2).
Indeed,comparedtodevelopedregions,thepenetrationofthesedevicesinAsiaisstilllow(seeFigure7).
Thissuggeststhatthereisstillplentyofroomforcatch-upgrowth.ThusthesemiconductorindustrycanexpecttoseecontinuedgrowthinAsiaand,byextension,socansemiconductorequipmentmanufacturers.Asiahasbecomethemostimportantmarketforcompaniesinthisspace.
Additionally,semiconductormanufacturersrelentlesslyinvestinnewtechnologyinordertolowertheunitcostsofprocessingpower.“Consumerend-demandforelectronics,mostrecentlyinsmartphonesandtabletcomputers,hashistoricallydrivencompetitioninourindustrytomakefaster,morecomplex,andcheapersemiconductorsinlinewithMoore’slaw,”saysMrThamatAppliedMaterials.7 HecitestheiPodasanexample.AniPodbuiltinthe1970satthecost-per-transistorthenwouldhavecostUS$3.2bnandwouldhavebeenthesizeofahouse;however,withinnovationinlinewithMoore’slaw,todayaniPodcostsUS$250andfitsintoapocket.
6GlobalSalesReport.SemiconductorIndustryAssociation.Variousyears
7Moore’slawisnamedafterGordonMoore,co-founderofIntel,acomputerchipmanufacturer,whopredictedthatcomputerprocessingpower—measuredbythenumberoftransistorsonanintegratedcircuit—wouldriseexponentially,doublingevery18monthsorso.
© The Economist Intelligence Unit Limited 201214
Asia Competition Barometer:Precision engineering
Whatistruehereofsemiconductorsisalsotrueofsolarpanels,saysMrTham.“Astheindustryreducesthecost-per-wattresultingincheapersolarpanels,competitionwilldrivepricepressuresandpotentiallyresultinconsolidation,”hesays.Despitetherecenthiccupsintheindustry,MrThamexpectssolarenergytobecomeaviablealternateenergysource.“InnovationsbyPEcompaniescreatemanufacturingsolutionsthathelpPVproducerspushdownthecost-per-watt,andwilleventuallymakesolarenergycostcompetitivewithtraditionalenergysources.”
InMrTham’sview,mostglobalplayershaveacknowledgedtheimportanceofAsiaasanimportantsemiconductorandsolarmanufacturingbaseandthereis“anemergingpreferenceoftheindustrytohavealargerandmoresignificantpresenceinAsia”.

© The Economist Intelligence Unit Limited 2012 15
Asia Competition Barometer:Precision engineering
Case study: Applied Materials
Applied Materials: Continued growth in AsiaAppliedMaterials,withrevenuesofmorethanUS$10bnin2011,is
theworld’slargestsupplierofmanufacturingequipmentandservicesforthesemiconductor,flat-paneldisplayandsolarindustries.“About75%ofourrevenuecomesfromAsia,upfromabout50%adecadeago.WehaveasignificantpresencethroughoutAsiainChina,Taiwan,Singapore,India,JapanandSouthKorea,andarecontinuingtogrowourfootprintintheregion,”saysRussellTham,regionalpresidentofAppliedMaterialsSouthEastAsia.
SinceestablishingitselfinAsiamorethan20yearsagowithsalesandtechnicalsupportfunctions,MrThamsaysthatthecompanyhasadded“strategicandoperationalrolestocatertoamarketbasethatisshiftingtoAsia,andtoimprovecostcompetitiveness.”
“CompetitiontokeepupwithMoore’sLaw,whichdrivesincreasinglyadvancedsemiconductors,hasresultedinatrendofconsolidationforoursemiconductormanufacturingcustomers,aswellaseverincreasingcapitalinvestmentrequiredtoachievetheprofitableeconomiesofscale,”MrThamsays,inexplainingthehighinvestmentbarriersinvolvedinthesemiconductorindustry.
HebelievesthePEsectoritselfisincreasinglycapitalintensive,particularlywiththedevelopmentoftechnologiessuchasthree-dimensionalintegratedcircuits,whichrequire“significantRD&E[research,developmentandengineering]resourcesandinvestmentthatareonlyavailabletoglobalplayers.”MrThamsuggeststhatcompetition-drivenconsolidationamongthePEindustry’scustomerscouldleadtoasimilarconsolidationinthePEindustryitself.InMay2011,AppliedMaterialsacquiredVarianSemiconductorforUS$4.9bnandinNovember2009,itpaidapproximatelyUS$364mtobuySemitool,anothersemiconductorcompany.Similarly,waferfabricationequipmentsupplierLamResearchagreedtobuyrivalNovellusSystemsforUS$3.3bninDecember2011.
Togainacompetitiveadvantage,saysMrTham,PEcompanieswillhavetoinvestinR&D“toaddressanincreasingnumberoftechnologyinflectionpointsinordertoenableMoore’slawandproducenewertechnologiesatevercheapercosts.”Headdsthattheseinnovationswillinvolvenewmaterials,uniqueintegratedcircuitdesignarchitectures,novelpatterningstructuresandlargersubstrates.“Thetrendofglobalisationhasalsoseencompaniesoptimisetheirglobalfootprintthroughthedevelopmentoflowercostoperationsandsupplychains,especiallyinAsia,”headds.

© The Economist Intelligence Unit Limited 201216
Asia Competition Barometer:Precision engineering
Outlook
Overthepastdecade,Asia’sPEindustryhasexpandedintandemwiththeregion’smanufacturingsector.ThenumberandsizeofAsianPEcompanieshasincreased,whilemanyhavebroadenedthe
scopeoftheiroperationsbyenteringnewsegmentsaswellasbyintegratingvertically.SeveralAsiancompaniesrecordedlargeincreasesintheiroperatingrevenuesbetween2004and2009.Forinstance,theannualturnoverofLarsen&Toubro,anIndiantechnology,engineering,manufacturingandconstructionfirm,increasedfromUS$3.4bnin2004toUS$9.5bnin2009.
Fortheindustryasawhole,afteraslightdipinprofitabilityin2005-06,marginshaverisensteadily.Inparticular,bigcompanieshavebeenabletoexploiteconomiesofscaleandgrowrapidly,bothorganicallyandthroughmergersandacquisitions.Withongoingconsolidationintheindustry,itseemslikelythatthebiggerfirmswillcontinuetogrowtheirmarketshare.
Theindustry’soutlookoverthenextfewyearshingeslargelyontwotrends—themergingofAsianandnon-AsianPEbusinessmodels;andtheshiftindemandfromtheWesttotheEast.First,asAsia’smarkethasgrown,morenon-Asianglobalplayershaveenteredtheregion.“Overthenextfewyears,theAsianfirmsandnon-Asianfirmswillcompetewitheachotherintermsofpriceandtechnologycompetitiveness,costcontrolandproductionefficiency,”MrShaoatWorldPrecisionMachinerysays.Therefore,evenasAsia’slargestPEfirmsarewinningmarketsharefromsmallerAsianplayers,theyincreasinglyhavetocontendwithnon-Asiangiantswhoareloweringtheircostsofproductionandbroadeningtheirfootprintsacrosstheregion.TheindustryisthuslikelytobecharacterisedbyfiercecompetitionbetweenbigAsianandnon-Asianplayers,whomayincreasinglyresembleoneanother.
Second,Asianmanufacturers—and,byextension,thePEfirmstheydependon—areseeingademandshiftfromdevelopedWesternmarketstotheemergingworld,particularlyAsia.Risingdisposableincomesintheregionhavedrivenexponentialgrowthinthemarketsforarangeofconsumerproducts,fromautomobilestotabletcomputers.AsianPEfirmsarebecomingincreasinglydependentontheseboomingAsianmarketsfortheirgrowth.Theirsuccessoverthenextfewyearswilldependonhowaccurately

© The Economist Intelligence Unit Limited 2012 17
Asia Competition Barometer:Precision engineering
theyhaveplannedforandmanagedthisshift,particularlygiventhebroaderglobalmacroeconomicuncertainty.Overthelongerterm,Asia’sseculargrowthstorywillensurethatitsPEindustrycontinuestogrowrapidly.

© The Economist Intelligence Unit Limited 201218
Asia Competition Barometer:Precision engineering
Barometer methodology
Toassesstheintensityofcompetitionandunderstandthechangingmarketdynamicsinkeysectors,theEconomistIntelligenceUnithasdevelopedtheAsiaCompetitionBarometer.Drawinguponcompany-
leveldataonprofitabilityandotherindicators,theBarometerquantifiesthechangingdynamicsofcompetitivenessinAsiaforselectindustriesbetween2004and2009.
Assessingauniverseofover200publicly-listedprecisionengineering(PE)companiesacrosseightcountries—China,India,Indonesia,Malaysia,thePhilippines,Singapore,ThailandandVietnam—theBarometerexamineschangingprofitabilityandthecompetitionlandscapeforthePEsector.
How do we define the precision engineering sector? ThePEsectorincludesthemanufactureof:
Instrumentsandappliancesformeasuring,testingandnavigation,irradiation,electromedicalandelectrotherapeuticequipment,opticalinstrumentsandphotographicequipment,power-drivenhandtools,metal-formingmachinery,othermachinetools,otherspecial-purposemachinery,airandspacecraftandrelatedmachineryandmedicalanddentalequipmentandsupplies.
Methodology TheBarometerhastwodimensions:profitabilityandmarketconcentration.
Profitability IndexToassesstheaggregateprofitabilityofthePEinAsia,theEconomistIntelligenceUnitdevelopedacompositeindexoffiveratiosthateachrepresentadifferentaspectofacompany’sprofitability:
• EBITDA margin (%):Ameasureofacompany’soperatingprofitability.Itisequaltoearningsbeforeinterest,tax,depreciationandamortisation(EBITDA)dividedbytotalrevenue.BecauseEBITDA
© The Economist Intelligence Unit Limited 2012 19
Asia Competition Barometer:Precision engineering
excludesdepreciationandamortisation,EBITDAmarginprovidesaclearerviewofacompany’scoreprofitability.Anincreaseincompetitionmayputpressureonanindustry’sprofitmargins.
• Gross margin (%):Whenusedasamarketmeasureofcompetition,grossmarginmeasurestheprofitabilityconsideringonlythecostsofgoodssold.Thehigherthepercentage,themorethecompanyretainsoneachdollarofsalestoserviceitsothercostsandobligations.Anincreaseincompetitiontendstoreducefirms’abilitytoincreasepricesandtherebyincreaseitsgrossmargin.
• Return on capital employed (%):Ameasureoftheefficiencyandprofitabilityofacompany’scapitalinvestments.Returnoncapitalemployedalsoindicateswhetherthecompanyisearningsufficientrevenuesandprofitsinordertomakethebestuseofitscapitalassets.Anincreaseincompetitionmayrequirefirmstoemployadditionalcapitaltomaintainprofitability.
• Return on equity (%):Ameasureoftherateofreturnontheshareholders’equity.Itmeasuresafirm’sefficiencyatgeneratingprofitsfromeveryunitofshareholders’equity.Returnonequityshowshowwellacompanyusesshareholderfundstogenerateearningsgrowth.Ariseincompetitiontendstoputpressureonreturnsonshareholderfunds.
• Return on assets (%):Ameasureofhowprofitableacompany’sassetsareingeneratingrevenue,orhowprofitableacompanyisrelativetoitsassets.Returnonassetsdeterminesacompany’sabilitytoutiliseitsassetsefficientlyandeffectively.Highercompetitiontendstoputpressureonfirms’abilitytomaintainreturnonassets.
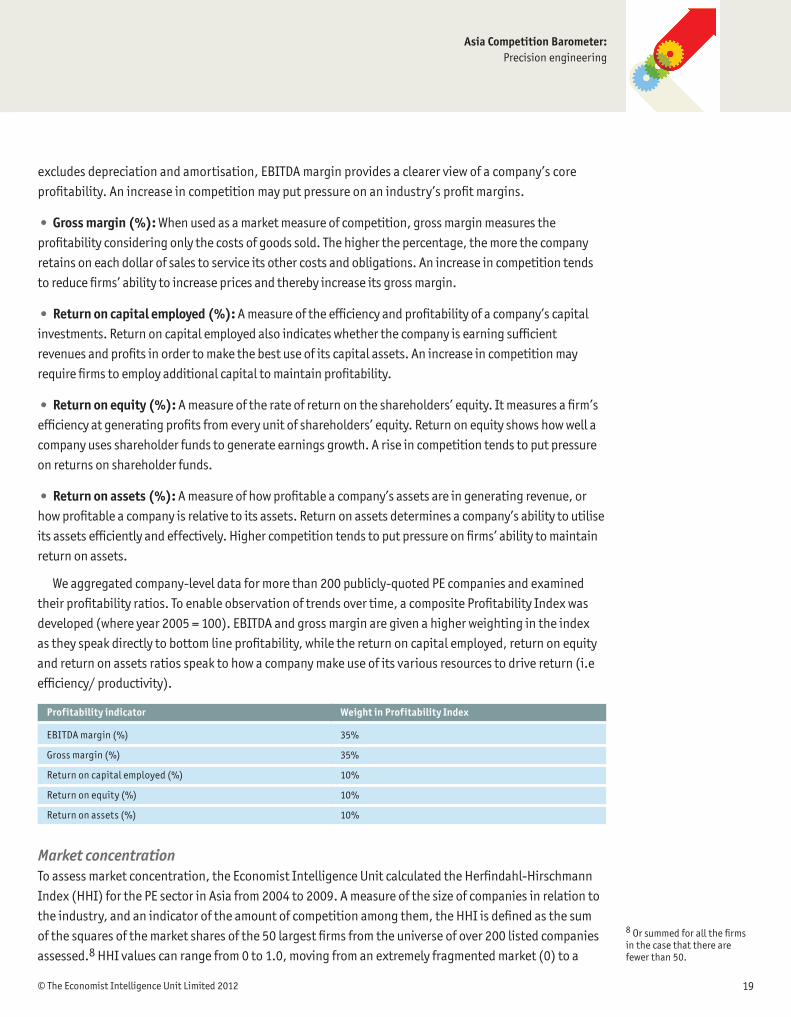
Weaggregatedcompany-leveldataformorethan200publicly-quotedPEcompaniesandexaminedtheirprofitabilityratios.Toenableobservationoftrendsovertime,acompositeProfitabilityIndexwasdeveloped(whereyear2005=100).EBITDAandgrossmarginaregivenahigherweightingintheindexastheyspeakdirectlytobottomlineprofitability,whilethereturnoncapitalemployed,returnonequityandreturnonassetsratiosspeaktohowacompanymakeuseofitsvariousresourcestodrivereturn(i.eefficiency/productivity).
Profitability indicator Weight in Profitability Index
EBITDAmargin(%) 35%
Grossmargin(%) 35%
Returnoncapitalemployed(%) 10%
Returnonequity(%) 10%
Returnonassets(%) 10%
Market concentration Toassessmarketconcentration,theEconomistIntelligenceUnitcalculatedtheHerfindahl-HirschmannIndex(HHI)forthePEsectorinAsiafrom2004to2009.Ameasureofthesizeofcompaniesinrelationtotheindustry,andanindicatoroftheamountofcompetitionamongthem,theHHIisdefinedasthesumofthesquaresofthemarketsharesofthe50largestfirmsfromtheuniverseofover200listedcompaniesassessed.8HHIvaluescanrangefrom0to1.0,movingfromanextremelyfragmentedmarket(0)toa
8Orsummedforallthefirmsin the case that there are fewerthan50.

© The Economist Intelligence Unit Limited 201220
Asia Competition Barometer:Precision engineering
monopoly(1).HHIvalueshavebeenmultipliedby100toachieveascaleconsistentwithprofitabilityindicators.ArisingHHIindexgenerallyindicatesfallingmarketcompetition,whileafallintheHHIsuggeststhatcompetitionisincreasing.

Whilsteveryefforthasbeentakentoverifytheaccuracyofthisinformation,neitherTheEconomistIntelligenceUnitLtd.northesponsorofthisreportcanacceptanyresponsibilityorliabilityforreliancebyanypersononthisreportoranyoftheinformation,opinionsorconclusionssetoutherein.
