precipitation, soil moisture, snow, and flash flood ... · a total of nearly 11,000 basins in...
TRANSCRIPT

Precipitation, Soil Moisture, Snow, and Flash Flood Guidance Components
HYDROLOGIC RESEARCH CENTER
6 May 2015
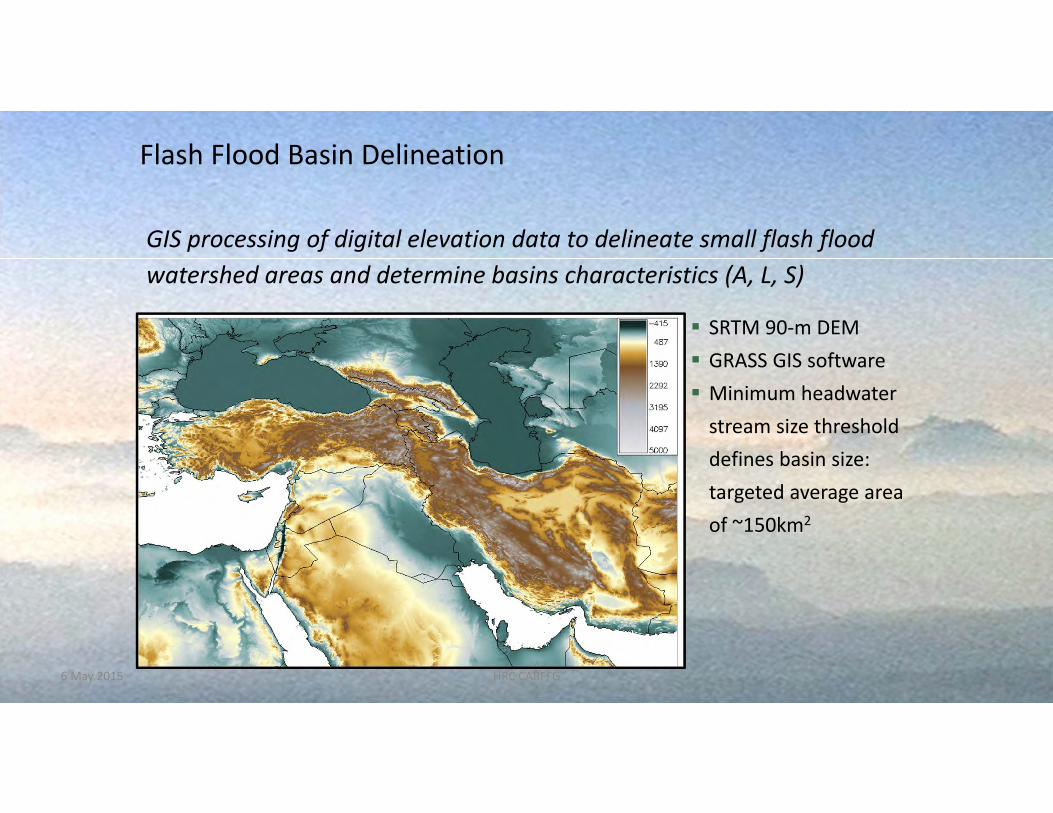
SRTM 90‐m DEM GRASS GIS software Minimum headwater stream size threshold defines basin size:targeted average area of ~150km2
GIS processing of digital elevation data to delineate small flash flood watershed areas and determine basins characteristics (A, L, S)
Flash Flood Basin Delineation
6 May 2015 HRC CARFFG 2
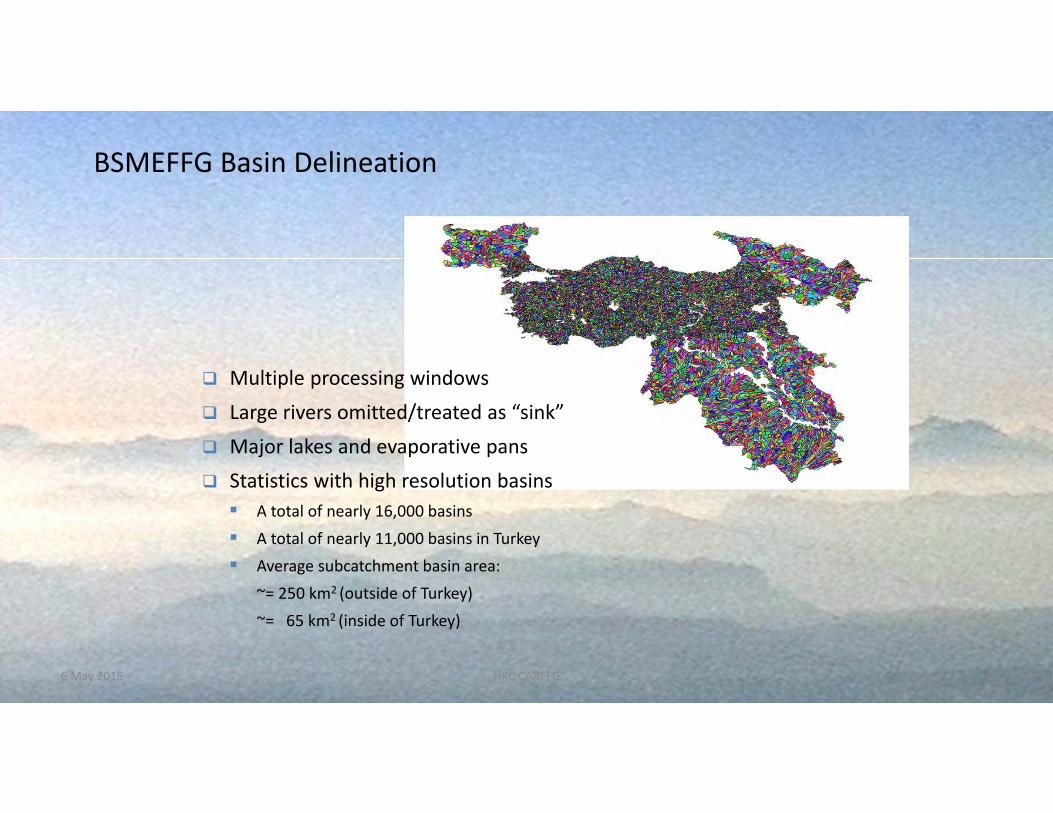
BSMEFFG Basin Delineation
Multiple processing windows Large rivers omitted/treated as “sink” Major lakes and evaporative pans Statistics with high resolution basins A total of nearly 16,000 basins
A total of nearly 11,000 basins in Turkey Average subcatchment basin area:
~= 250 km2 (outside of Turkey)~= 65 km2 (inside of Turkey)
6 May 2015 HRC CARFFG 3

Rainfall Data Processing
Quality ControlMerging
Bias Adjustment
Real-time Precipitation Inputs
Satellite RainfallRadar (as available)Gauge (as available)
Temperature
Evapotranspiration(Climatological)
Spatial GIS Data Analyses
Basin DelineationParameter Estimation(Terrain, LULC, soils,
streams)
Snow Model
Soil Moisture
Model
Threshold Runoff Model
Flash Flood Guidance Model
Flash Flood
Guidance
Flash Flood Threat
Rainfall Forecasts
(Mesoscale Model)Forecaster Input
4
Key Technical Components for the FFG System
Snow Cover
6 May 2015 HRC CARFFG

6 May 2015 HRC CARFFG 5

6 May 2015 HRC CARFFG 6
Satellite Rainfall ‐ Hydroestimator
• IR based (10.7 m)• Short latency
Rain Rate = Function of brightness temperature
Enhanced for:1. Atmospheric moisture effects2. Orography (upslope/downslope)3. Convective Eqlb. Level (warm‐top convection)4. Local pixel T difference with surroundings5. Convective core/no‐core region

REGION
6 May 2015 HRC CARFFG 7
Bias and Log‐Bias Factors
1
1
( , )
( , )
g
g
N
gj
t N
sj
R t jn
R t j
Bias (B)
Raingauge 1
Sat Pixel 1
Raingauge 2
Sat Pixel 2 Raingauge J
Sat Pixel J
Log‐Bias

6 May 2015 HRC CARFFG 8
Climatological Adjustment Using Gauges and Corresponding Satellite Pixel Data
• Historical Data for regions of uniform hydroclimatology, terrain and gauge density• Usually done for an given month or season• Result is bias factor for each region and month/seasonBias Factor computed from:
(1) Mean values(2) Probability matching considerations

HRC CARFFG 9
Dynamic Bias Adjustment Basics
1 1t t tw
1 1 1t t tz v
1
1
( , )
( , )
g
g
N
gj
t N
sj
R t jn
R t j
Kalman Filter Stochastic Approximations
• N pairs of consecutive values• At least 20% raingauges with rain• Conditional Mean > Threshold (mm/h) (satellite/radar and gauge)
Bias (B)
6 May 2015
Important issue:Gauge data quality control

Multi‐Spectral Satellite Rainfall
6 May 2015 HRC CARFFG 10
New global FFGS product combines IR‐based HE rainfall with MW‐based CMORPH rainfall
HE CMORPH
IR – Based30‐min latency in operationsBased on measurements of topcloud brightness temperature
MW – Based18‐26 hour latency in operationsBased on measurements of microwave scattering from raindrops

Multi‐Spectral Satellite Rainfall for FFG Systems
6 May 2015 HRC CARFFG 11
IR Rain
CMORPH Rain
IR Rain IR Rain
Raingauge Rain
Raingauge Rain
IRA(t‐n) B(t‐2) B(t‐1)
IR Rain
Raingauge Rain
B(t)IR Rain
CMORPHRain
IRA(t‐n‐1) …..
Raingauge Rain
Raingauge Rain
…..
Window of 3 days
CMORPH Latency
f f fIRA IRA IRA

Examples from BSMEFFG
6 May 2015 HRC CARFFG 12
Original GHE Adjusted GHE

Rainfall Data Processing
Quality ControlMerging
Bias Adjustment
Real-time Precipitation Inputs
Satellite RainfallRadar (as available)Gauge (as available)
Temperature
Evapotranspiration(Climatological)
Spatial GIS Data Analyses
Basin DelineationParameter Estimation(Terrain, LULC, soils,
streams)
Snow Model
Soil Moisture
Model
Threshold Runoff Model
Flash Flood Guidance Model
Flash Flood
Guidance
Flash Flood Threat
Rainfall Forecasts
(Mesoscale Model)Forecaster Input
13
Key Technical Components for the FFG System
Snow Cover
6 May 2015 HRC CARFFG
6 May 2015 HRC CARFFG 14

Soil Water Index Model: Combined Runoff ‐Sacramento Model Adaptation
6 May 2015 15HRC CARFFG
Soil water index model: ‐ Saturation excess runoff‐ Infiltration excess runoff‐ Combined runoff
Soil Water: Depth Integrated Soil Moisture

On Site Soil Water Deficit Validation
6 May 2015 HRC CARFFG 16
Westville, OK Site
HRC-DHM Closest Sub-Basin Average
Illinois River (Semi-Arid US)
Reasonably good reproduction of depth-integrated soil water deficit

17
Average Soil Moisture (Water)
6 May 2015 17
ASM = (XT + XF) / (XTo + XFo)HRC CARFFG

Soil Texture (FAO)
Soil Depth(FAO)
6 May 2015 HRC CARFFG 18

A priori parameter estimation
INTERFLOWSURFACERUNOFF
INFILTRATIONTENSION
TENSION TENSION
PERCOLATION
LOWERZONE
UPPERZONE
PRIMARYFREE
SUPPLE-MENTAL
FREE
RESERVED RESERVED
FREE
EVAPOTRANSPIRATION
BASEFLOW
SUBSURFACEOUTFLOW
DIRECTRUNOFF
Precipitation
6 May 2015 HRC CARFFG 19

6 May 2015 HRC CARFFG 20

GTOPO ‐ Topography
6 May 2015 HRC CARFFG 21

22
Jensen‐Haise: PET ‐ Radiation based method with 2 parameters
Pertinent Refernces:Jensen & Haise 1963McGuinness & Bordne 1973 Oudin et al 2005 j. Hydrology:
For basin scale hydrologic models, PET procedures that are based on extraterrestrial radiation and climatic surface temperature outperform complex models (e.g., Penman).
Potential Evaporation in a given location (mm/day):PE = [Re Ta +K2 ]/ K1(λ p) for Ta > K2
• Re ‐ Daily potential Incoming extraterrestrial radiation (Mj m‐2 d‐1); • f{latitude, Julian date)
• Ta‐ Long term daily averages of surface temperature (minT+maxT)/2• f{Julian date, elevation)
• K1 (°C) – minimum temperature in which below PE=0 (~5)• K2 (°C) – scale parameter (75‐130) • λ – Latent heat flux (Mj kg‐1)• p ‐ density of water (kg m‐1)
6 May 2015 HRC CARFFG

Kazakhstan Land Cover Map
6 May 2015 HRC CARFFG 23

PET Climatological Estimate
6 May 2015 HRC CARFFG 24

6 May 2015 HRC CARFFG 25

Snow Modeling
Energy Balance for Snow Cover
Qn + Qe + Qh +Qg + Qm = Q
where Qn = net radiation (solar – longwave) Qe = latent heat transferQh = sensible heat transferQg = heat transfer at snow‐soil interfaceQm = heat transfer by mass changes
(e.g. advected by rain)Q = change in heat storage of snow cover
Ground
Snow Cover
QmQn Qh Qe
Qg
=f (Qsw, Qlw, A,To)=f (eo, ua)=f (To, Ta,ua)=f (Tg,Ts)=f (p)
Energy Balance solution is data intensive!6 May 2015 HRC CARFFG 26

Snow Model ‐ Snow 17
Snow Accumulation and Ablation Model (SNOW‐17) of the U.S. NWS (Anderson, 1973)
Designed to use readily available operational data
A conceptual areal lumped energy and mass balance model
Air Temperature used as an index for pack energy and division of precipitation as rain or snow
Considers: melt during no rain; melt during rain; no melt
Model states track: snow water equivalent (SWE), heat deficit, pack temperature, liquid content.
• Single vertical layer • Three modules:• Melt during rain• Melt during no rain• Heat accounting during no melt
Describe the snow cover extent using the Snow Depletion Curve6 May 2015 HRC CARFFG 27
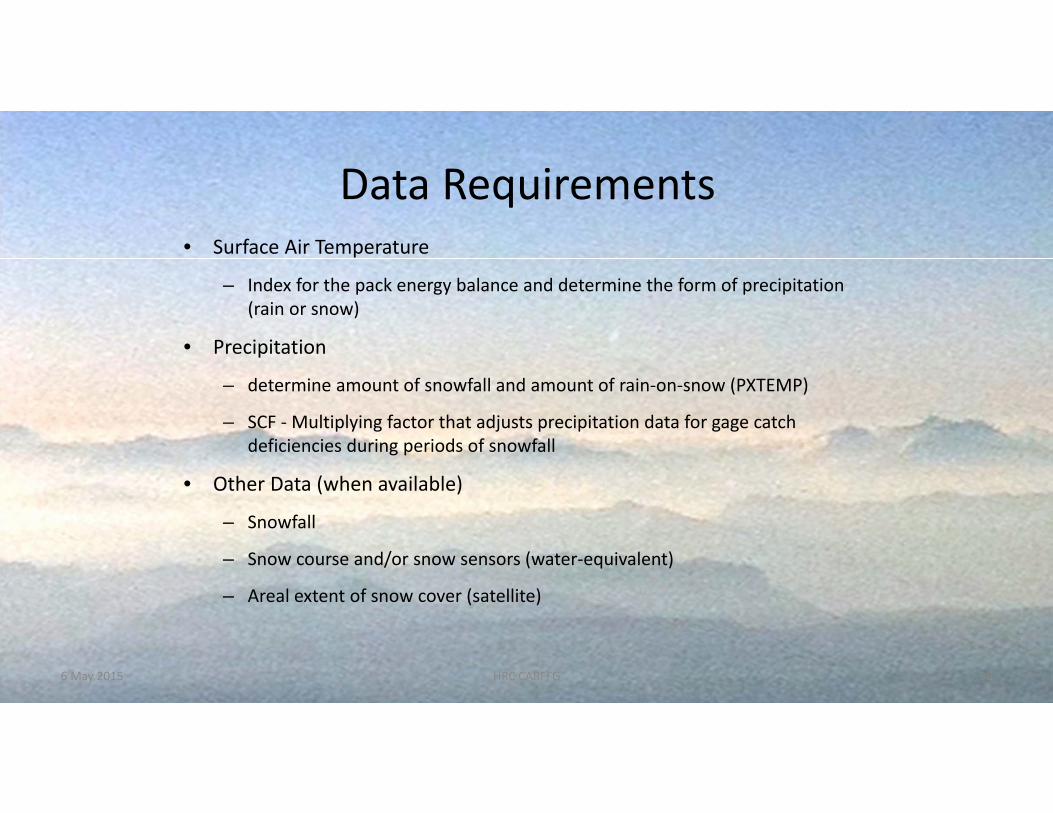
Data Requirements• Surface Air Temperature
– Index for the pack energy balance and determine the form of precipitation (rain or snow)
• Precipitation
– determine amount of snowfall and amount of rain‐on‐snow (PXTEMP)
– SCF ‐Multiplying factor that adjusts precipitation data for gage catch deficiencies during periods of snowfall
• Other Data (when available)
– Snowfall
– Snow course and/or snow sensors (water‐equivalent)
– Areal extent of snow cover (satellite)
6 May 2015 HRC CARFFG 28

Satellite Snow Covered Area
Interactive Multisensor Snow and Ice Mapping System (IMS), made available through National Snow and Ice Data Center, NOAA.http://nsidc.org/data/docs/noaa/g02156_ims_snow_ice_analysis/index.html
Daily (23:00 GMT) snow cover based on summary of multiple satellites at 4km x 4km resolution. Geostationary satellites Polar orbiter: MODIS, AVHRR & Microwave Assisted by modeling , climatological maps, and personnel expertise
Generally available within 1 day (often within several hours) following date of observation
4km product is Operational since 2006
Helfrich et al., 2007 Hydrological Processes
6 May 2015 HRC CARFFG 29

Based on fraction of snow covered area in each subbasin
Aportion the rain for the uncovered areas
Soil‐snow interface leakage at the snow cover areas
Rain for the FFT calculations is portioned to the uncovered areas
Use of Snow Cover in BSME
Sub‐Basin Snow Cover Area Fraction
6 May 2015 HRC CARFFG 30

Outlook 2012 Outlook 2013
Comparison between April outlook for 2012 and 2013
6 May 2015 HRC CARFFG 31

Time Series from Specific Basins
6 May 2015 HRC CARFFG 32

MODIS/LST for Surface Temperature[NASA funded Research]
6 May 2015 HRC CARFFG 33

6 May 2015 HRC CARFFG 34
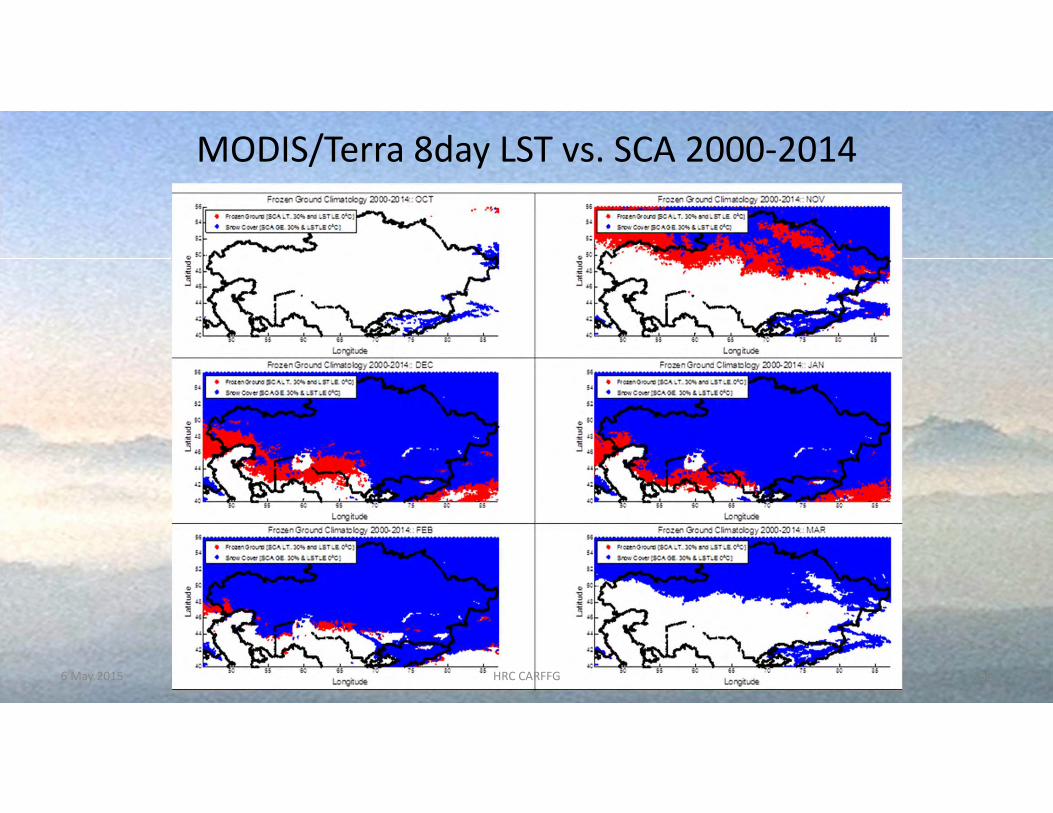
MODIS/Terra 8day LST vs. SCA 2000‐2014
6 May 2015 HRC CARFFG 35

Following Carpenter et al (1999), under a linear response of basins to rainfall excess, threshold runoff may be calculated under the following equality:
Qp = qpR R A (1)
Qp is the flow associated with flooding flow (cms)
qpR is the peak of the unit hydrograph of duration tR, normalized by catchment area (cms/km2/mm)
A is the catchment area (km2)
R is tR‐hr threshold runoff (mm)
Theory of Threshold Runoff Estimation
36Ankara, Turkey30 April 20156 May 2015 HRC CARFFG 36

Options to estimate parameters of threshold runoff (R):
(a) Flooding Flow, Qp
• Bankfull Flow (Manning’s uniform flow; uses channel cross‐section)
• Flow with given return period (statistical)
(b) Unit hydrograph response, qpR• Synthetic Unit Hydrograph (empirical)
• Geomorphologic Instantaneous Unit Hydrograph (physical properties)
Theory of Threshold Runoff Estimation
R = f(A,L, Bb, Db, Sc)
37Ankara, Turkey30 April 20156 May 2015 HRC CARFFG 37

From Threshold Runoff and Soil Moisture to Flash Flood Guidance
6 May 2015 HRC CARFFG 38
Soil Water Model Runs

FFG Uncertainty for Soil Wetness Conditions
6 May 2015 HRC CARFFG 39
Dry Conditions Wet Conditions
0 50 100 150 200 250 3000
0.002
0.004
0.006
0.008
0.01
0.012
0.014
0.016
0.018
0.02
3-hrs Actual Rainfall Volume (mm)
Lognormal
0 50 100 150 200 250 3000
0.002
0.004
0.006
0.008
0.01
0.012
0.014
0.016
0.018
0.02
3-hrs Actual Rainfall Volume (mm)
Lognormal