precipitation patterns, supply planning and demand curves: assessing water supply risks in a...
TRANSCRIPT
Precipitation Patterns, Supply Planning and Demand Curves:
Assessing Water Supply Risks in a Changing Climate
Erica BrownAssociation of Metropolitan Water Agencies
(AMWA)May 21, 2015
NOAA CPO Third Thursday Webinar SeriesClimate Information for Managing Risks in Water Resources
Overview
Water supply planning: what the demand curves show buys utilities time, re: for supply development
Two illustrative examples from: Seattle/Cascade Water Alliance and extreme events Tarrant Regional Water District and prolonged
drought
Near-term (and long term) informational and forecast needs and improvements
Regional-long term resilience planning
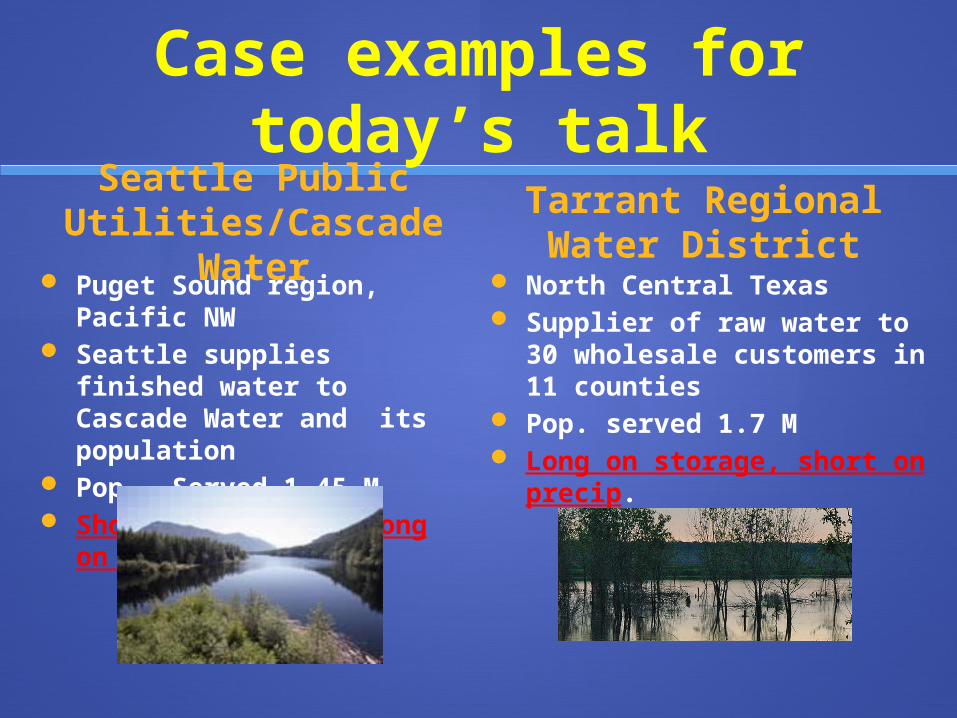
Case examples for today’s talk
Seattle Public Utilities/Cascade
Water Puget Sound region, Pacific NW
Seattle supplies finished water to Cascade Water and its population
Pop. Served 1.45 M Short on storage, long on
precip.
Tarrant Regional Water District
North Central Texas Supplier of raw water to
30 wholesale customers in 11 counties
Pop. served 1.7 M Long on storage, short on
precip.

These two agencies, like most around the U.S., have declining demand despite population growth.
Nationally, water use in the U.S. for public supply declined by 5% between 2005 and 2010 (USGS, 2014)
Water Consumption Is Declining

Shifting Water Demand Forecasts(Seattle Public Utilities, Including
Cascade)
5

0
50
100
150
200
0
100,000
200,000
300,000
400,000
500,000
600,000
700,000
800,000
900,000
1,000,000
1,100,000
1,200,000
1,300,000
1935
1940
1945
1950
1955
1960
1965
1970
1975
1980
1985
1990
1995
2000
2005
2010
To
tal C
on
sum
pti
on
in M
GD
Po
pu
lati
on
Growth in Population and Water ConsumptionSeattle Regional Water System: 1935- 2013
Population
Consumption in MGD
P

Factors causing changes in demand trends
Plumbing efficiency and regulation
Housing stock and density
Conservation behavior and technology
Water system efficiency
Kind of water use Irrigation Residential Business
Population demographics
Water use policy and pricing

Lower demand buys time for supply development
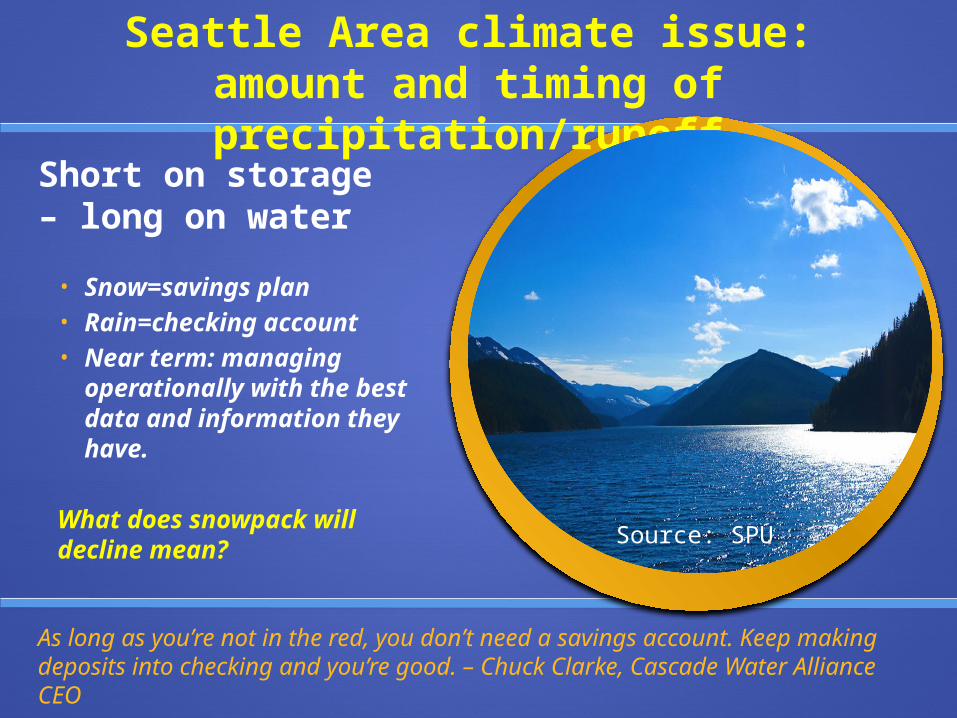
Short on storage – long on water
• Snow=savings plan• Rain=checking account• Near term: managing
operationally with the best data and information they have.
What does snowpack will decline mean?
Seattle Area climate issue: amount and timing of precipitation/runoff
As long as you’re not in the red, you don’t need a savings account. Keep making deposits into checking and you’re good. – Chuck Clarke, Cascade Water Alliance CEO
Source: SPU
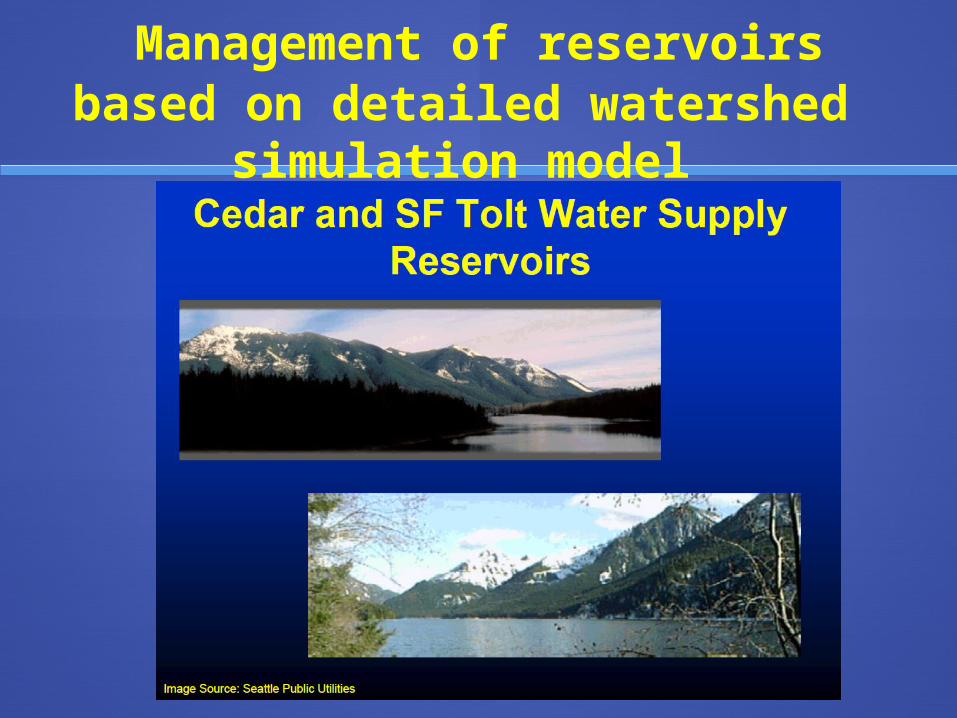
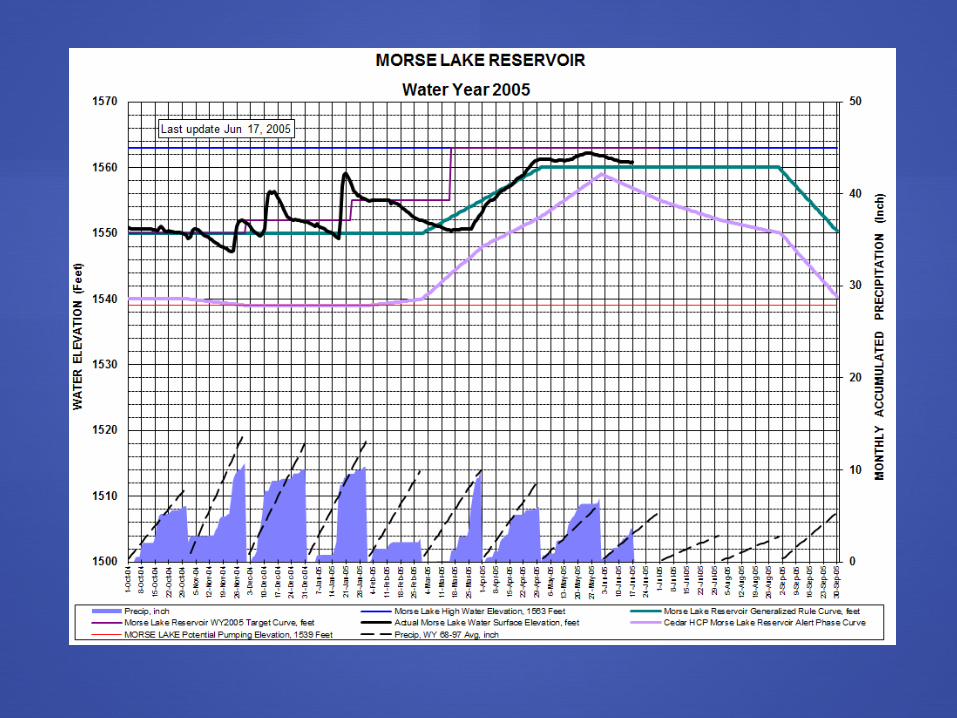
Management of reservoirs based on detailed watershed
simulation model


Source: SPU

TRWD climate issue: drought
Long on storage, short on water.Drought Risks: • Transmission
capacity• Reliability• Source supply
availability
The 20-mile Eagle Mountain Connection allows TRWD to extend the reach of water from its E. TX reservoirs to Eagle Mountain Lake via storage and transmission facilities.
Source: Freese.com

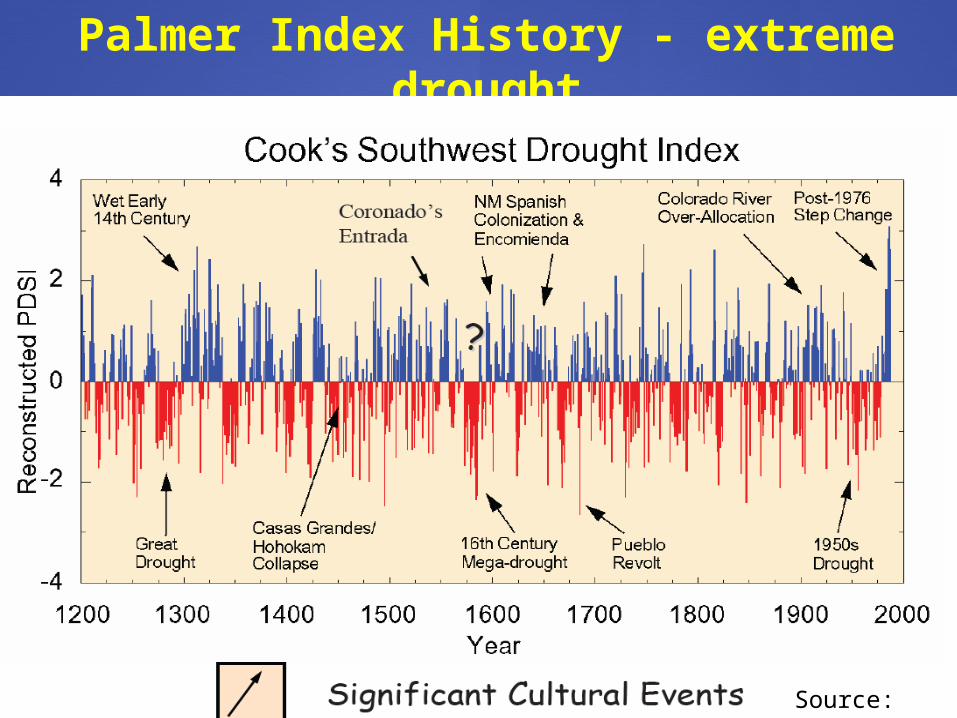
Palmer Index History - extreme drought
FSource: TRWD

TRWD Demands Over Time
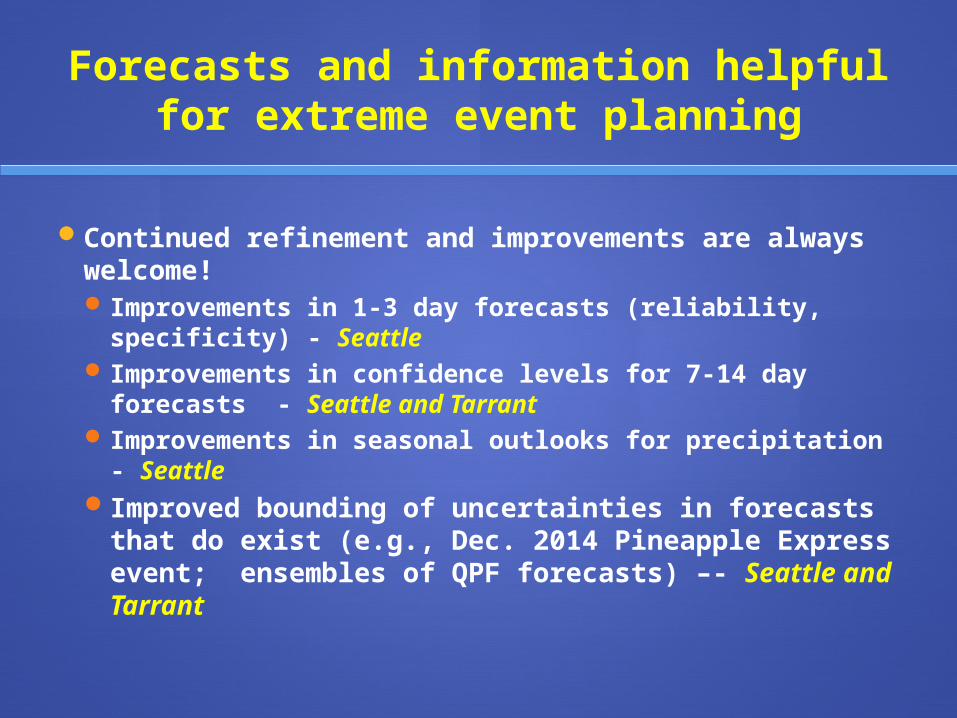
Forecasts and information helpful for extreme event planning
Continued refinement and improvements are always welcome! Improvements in 1-3 day forecasts (reliability,
specificity) - Seattle Improvements in confidence levels for 7-14 day
forecasts - Seattle and Tarrant Improvements in seasonal outlooks for
precipitation - Seattle Improved bounding of uncertainties in
forecasts that do exist (e.g., Dec. 2014 Pineapple Express event; ensembles of QPF forecasts) –- Seattle and Tarrant

Water Resilience in the Future
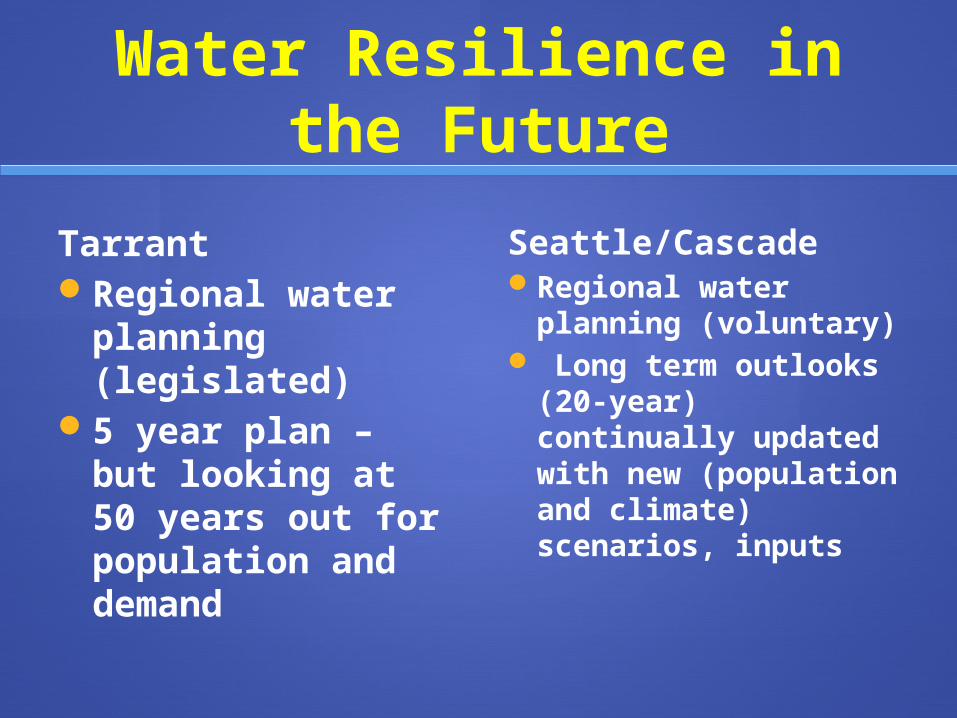
Water Resilience in the Future
TarrantRegional water
planning (legislated)5 year plan – but
looking at 50 years out for population and demand
Seattle/CascadeRegional water
planning (voluntary) Long term outlooks
(20-year) continually updated with new (population and climate) scenarios, inputs

Thank you
Erica Brown
Thanks to: Laura Blaylock, Tarrant
Regional Water District Julie Hunt, Trinity River
Authority of Texas Chuck Clarke, Cascade
Water Alliance Alan Chinn, Paul
Fleming, Seattle Public Utilities

Extra slides


Cascade Water Alliance Service Area

0
20
40
60
80
100
120
140
160
180
An
nu
al M
GD
Total Seattle Regional Water System Annual Demandin Millions of Gallons per Day: 1930-2013
121 mgd
171 mgd
Seattle Public Utilities

Cascade Average Daily Demand(million gallons per day)
30
35
40
45
50
55
2003 2004 2005 2006 2007 2008 2009 2010 2011 2012 2013
2004 TSP Composite Projection
2004 Financial Forecast
Actual Total Demand
27
1990
1992
1994
1996
1998
2000
2002
2004
2006
2008
2010
2012
0
50
100
150
200
250
300
350
400
0
200000
400000
600000
800000
1000000
1200000
1400000
1600000
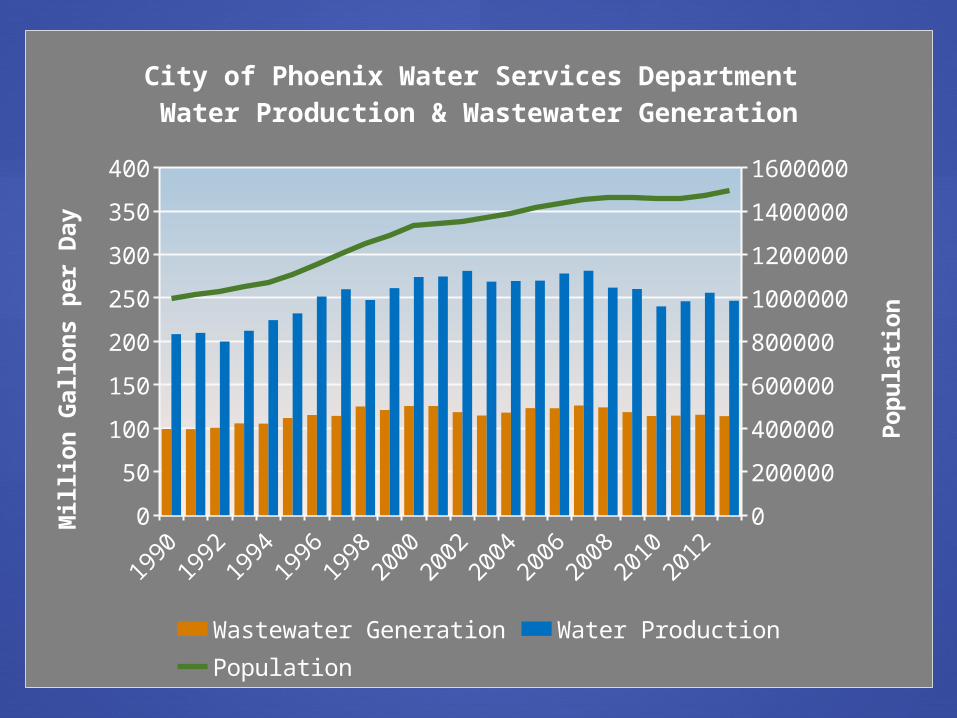
City of Phoenix Water Services Department Water Production & Wastewater Generation
Wastewater Generation Water ProductionPopulation
Million
Gallon
s p
er
Day
Pop
ula
tion

19861987
19881989
19901991
19921993
19941995
19961997
19981999
20002001
20022003
20042005
20062007
20082009
20102011
20122013
0
50
100
150
200
250
300
350
400
450
500
Estimated Average Outdoor July Water Use (GPD: July Use Less February Use)
for All Phoenix Single Family Residences 1986-2013
Gallo
ns P
er D
ay

1990
1991
1992
1993
1994
1995
1996
1997
1998
1999
2000
2001
2002
2003
2004
2005
2006
2007
2008
2009
0
50
100
150
200
250
300
350
400
450
Average Daily Water Use (2010-2013, Gallons Per Day) for Phoenix Single Family Residences by Year of Home Construction
4-Yr Avg Daily Water Use (Gallons)
Year of Construction
Gal
lons
Per
Day
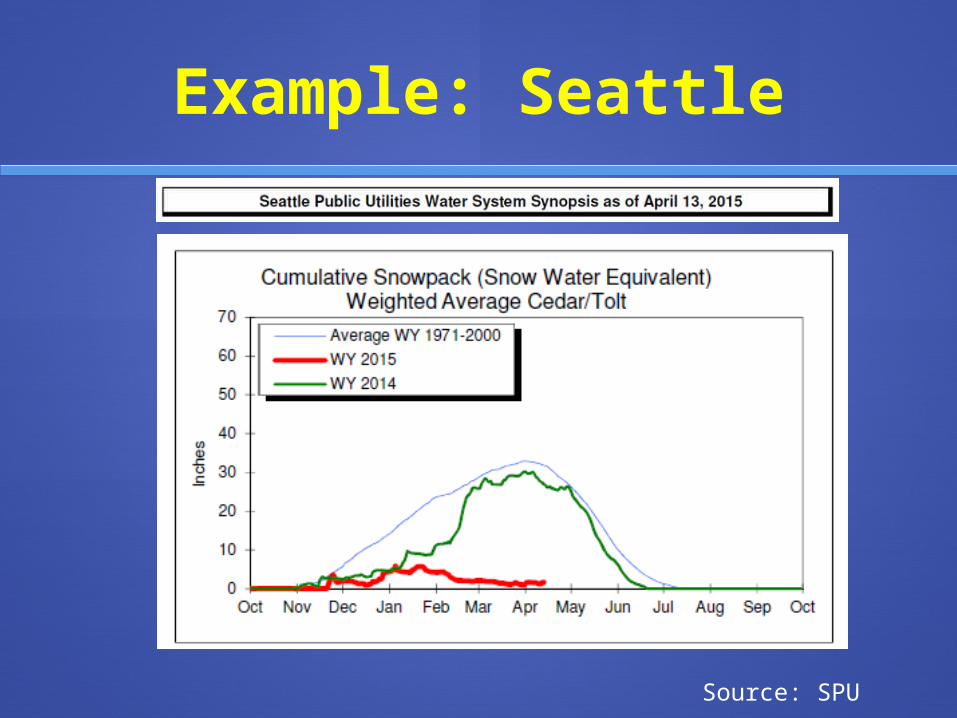
Example: Seattle
Source: SPU
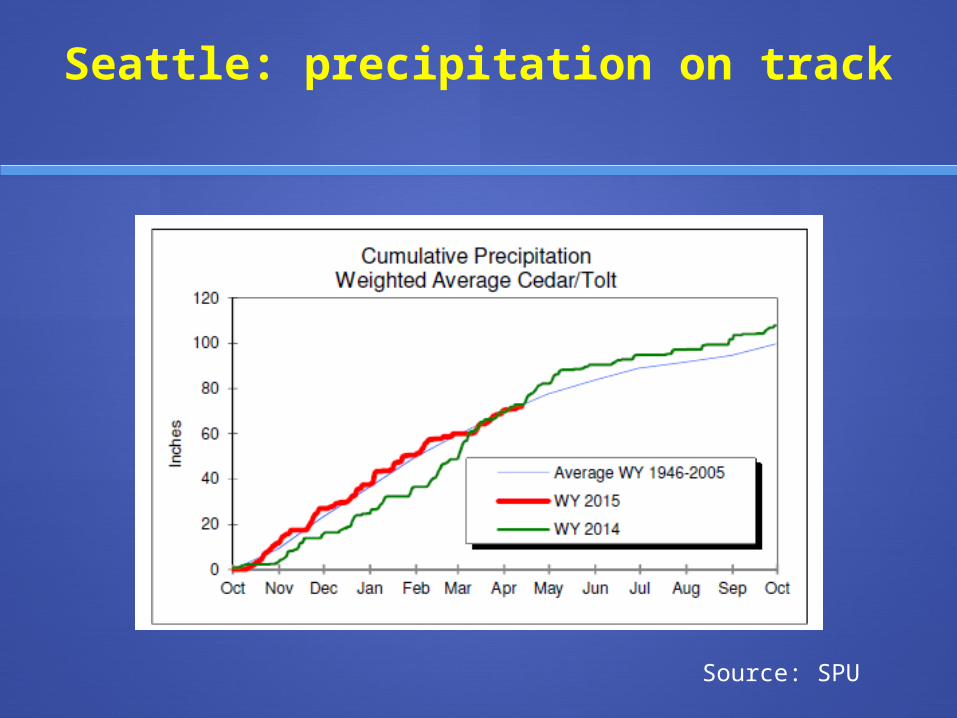
Seattle: precipitation on track
Source: SPU
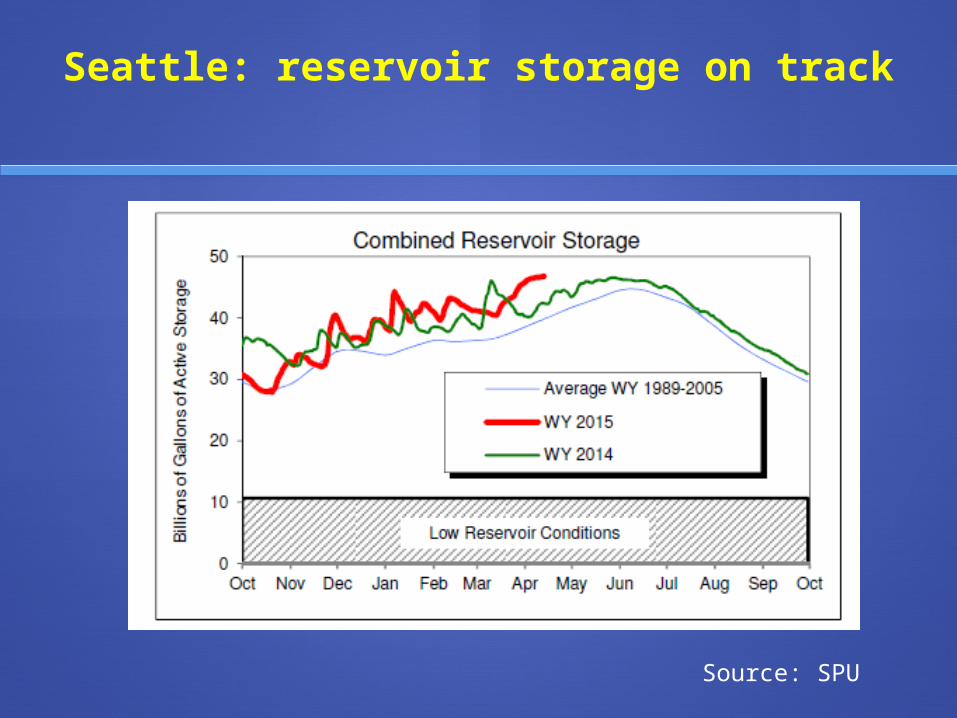
Seattle: reservoir storage on track
Source: SPU