pre-market trading and ipo pricing - warrington sites trading and ipo pricing abstract by studying...
TRANSCRIPT
Pre-Market Trading and IPO Pricing
Chun Chang Shanghai Advanced Institute of Finance
Shanghai Jiao Tong University [email protected]
Yao-Min Chiang
Department of Finance National Taiwan University [email protected]
Yiming Qian
Department of Finance University of Iowa
Jay R. Ritter Department of Finance, Insurance, and Real Estate
University of Florida [email protected]
May 2016
forthcoming, Review of Financial Studies
Acknowledgements: We would like to thank two anonymous referees, Wolfgang Bessler, Thomas Boulton, Po-Hsuan Hsu, Andrew Karolyi, Wei Li, Laura Liu, Ann Sherman, Ashish Tiwari, Shu-Feng Wang, Tong Yao, Donghang Zhang, and seminar participants at Aalto University, Cheung Kong Graduate School of Business (CKGSB), Cornell University, DePaul University, the Hanken School of Economics, National Taiwan University, Peking University, Tsinghua SEM, the University of Illinois at Chicago, the 2014 China International Conference in Finance, the 2014 Financial Management Association meetings, the 2015 Midwest Finance Association meetings, and the 2015 Asian FMA meetings for useful suggestions. Supplemental material can be found on the Review of Financial Studies web site.

Pre-Market Trading and IPO Pricing
Abstract
By studying the only mandatory pre-IPO market in the world – Taiwan’s Emerging Stock Market (ESM), we document that pre-market prices are very informative about post-market prices and that the informativeness increases with a stock’s liquidity. The ESM price-earnings ratio shortly before the initial public offering explains about 90% of the variation in the offer price-earnings ratio. However, the average IPO underpricing level remains high, at 55%, suggesting that agency problems between underwriters and issuers can lead to excessive underpricing even when there is little valuation uncertainty. Also, regulations impact the relative bargaining power of players and therefore IPO pricing.
JEL codes: G14, G15, G18, G24, G32
Keywords: initial public offering, pre-IPO market, IPO underpricing, agency problem, rent-seeking underwriter, bookbuilding, information asymmetry, Taiwan Stock Exchange

1
The most important issue as well as the biggest challenge in an initial public offering
(IPO) is the pricing of the stock. It has been well documented that IPOs tend to be underpriced
(relative to aftermarket prices), and that the underpricing phenomenon is persistent over time and
across countries.1 The associated money left on the table, defined as the first-day price increase
multiplied by the number of shares issued, is a measure of foregone proceeds and constitutes a
substantial opportunity cost of going public for issuing firms. Whether such underpricing is fair
compensation for investors to compensate them for risk-bearing or providing information, or is
excessive and is driven by agency problems between issuers and underwriters, is the most
important debate in the IPO literature (see Ljungqvist, 2007 and Ritter, 2011 for surveys on the
topic). Using data from a quasi-natural experiment in Taiwan, we are able to provide evidence
that agency problems can result in extreme underpricing.
Underwriters are paid large amounts for pricing and allocating the IPO shares in most
countries. How do they arrive at the offer price for an IPO? Under the bookbuilding method used
in the U.S. and many other countries, underwriters, with the acquiescence of the issuer, first
come up with a suggested price range partly using benchmark pricing, which is based on the
firm’s accounting numbers and comparable firms’ price multiples. The method often leads to
wide possible price ranges depending on which firms are picked as the comparables, and may not
adequately account for the uniqueness of the issuing firm. Kim and Ritter (1999) and
Purnanandam and Swaminathan (2004) show that implied offer prices based on this method are
far from being accurate, in terms of predicting the offer price or the after-market price. After
setting the file price range, underwriters then collect investors’ indications of interest during the
bookbuilding process and determine a final offer price.
1 Jay Ritter’s website provides a table with the average level of underpricing in each of 52 countries.

2
Bookbuilding mechanism design theory argues that value-relevant information is
collected during the process and underwriters allocate underpriced shares to induce investors to
truthfully reveal information (Benveniste and Spindt, 1989). If information from public sources
is available to accurately predict the market price, the amount of underpricing needed to induce
investors to reveal their willingness to pay should be minimal. Agency theory argues that self-
interested underwriters have strong incentives to bias the offer price down so that they can
allocate underpriced shares to their favored clients in exchange for side payments (Loughran and
Ritter, 2002; Reuter, 2006; Nimalendran, Ritter and Zhang, 2007; Liu and Ritter, 2010 and 2011;
Goldstein, Irvine and Puckett, 2011). This incentive is present irrespective of how difficult it is to
predict the market price once an IPO starts trading.
In recent years, a new phenomenon – trading platforms or markets for pre-IPO firms
(hereafter pre-IPO markets or simply pre-markets) – has emerged that may potentially provide a
solution to the IPO pricing problem, and allows us to test the predictions of the mechanism
design and agency frameworks. These pre-markets are in various forms. For example, in the
U.S., online sites such as SecondMarket and SharesPost started around 2009, partly due to strong
demand for private company stocks such as Facebook. These sites hold auctions for private
company stocks from time to time. In the UK, firms can choose to get listed and trade on the
Alternative Investment Market (AIM) before an IPO (Derrien and Kecskés, 2007).2 In Europe,
"grey market" trading exists for many IPOs (Aussenegg, Pichler and Stomper, 2006; Cornelli,
Goldreich and Ljungqvist, 2006). In Taiwan, since 2005 firms are actually required to be listed
on a so-called “emerging stock market” and trade there for at least six months before applying
for an IPO.
2 Although firms can be listed and traded on AIM without an IPO and hence establish a pre-IPO price, AIM is not a pre-IPO market per se as most firms (89% in Derrien and Kecskés’ sample) choose instead to have a conventional IPO.

3
It is reasonable to think that a pre-market would reduce the uncertainty about a firm’s
valuation, thus achieving the goal of price discovery and leading to high pricing efficiency
during an IPO. Existing studies of European grey markets, the AIM in London, and Indian when-
issued trading indicate that pre-market prices are informative about post-market prices (Löffler,
Panther and Theissen, 2005; Aussenegg, et al., 2006; Derrien and Kecskés, 2007; Brooks,
Mathew, and Yang, 2014). However, given the small amount of evidence, it is not clear whether
this conclusion is limited to these specific markets. More importantly, whether these pre-market
prices enhance IPO price efficiency is an open question. For example, Aussenegg et al. (2006, p.
860) conclude that “we cannot determine from our data whether when-issued trading enhances
the efficiency of IPO pricing” due to the possible interference between the trading and the IPO
process (a grey market starts after an IPO price range is determined and coincides with the
bookbuilding period). Therefore the benefits of pre-market trading are still unclear.
Meanwhile, there are concerns about such markets, including low liquidity of the market
and potential fraud. Questions therefore arise in the U.S. regarding whether pre-markets should
be allowed or encouraged, and how they should be regulated. The U.S. Securities and Exchange
Commission (SEC) has shown concerns about related issues (see Stone, 2011 and Smith and
Eaglesham, 2012), although the Jumpstart Our Business Startups (JOBS) Act of 2012 relaxed a
number of regulatory constraints on pre-markets.
We provide evidence on the benefits of pre-market trading from the only mandatory pre-
IPO market in the world – Taiwan’s Emerging Stock Market (ESM). Since 2005, firms have been
required to trade on the ESM for at least six months before they can apply for an IPO. The
mandatory feature of the market frees our study from self-selection issues, and the relatively long
trading period prior to an IPO enables us to observe how trading evolves as the IPO approaches.

4
In the first portion of the paper, we examine how useful the pre-market is in terms of
price discovery and what factors determine the accuracy of the pre-market price. Consistent with
previous studies, we find that as the time gets closer to the IPO, the pre-market price becomes
very informative, measured against the after-IPO market price. The ratio of the pre-market price
to the offer price explains 77% of the variation in the initial return, i.e., the aftermarket price to
the offer price. Controlling for other variables, including the price revision following the
bookbuilding period and the lagged market return, does not improve the regression R-squared
much, raising it to just 79%.
We hypothesize that the pre-market price should be more informative if the trading is
more liquid. We find supporting evidence using three measures of (il)liquidity. A one standard
deviation increase in each of the illiquidity measures increases price inaccuracy, defined as the
absolute value of the percentage difference between the pre-market and first-day market prices,
by 2-3 percentage points, which is 15-20% of the mean of the price inaccuracy.
In the second portion of the analysis, we examine how much the pre-market price is
utilized in setting the IPO offer price. Given the informativeness of the pre-market price,
asymmetric information-based theories predict that (a) the offer price should largely depend on
the pre-market price; and (b) the more accurate the pre-market price is in predicting the
aftermarket price, the closer the offer price should be to the pre-market price, i.e., the lower the
price discount, defined as one minus the offer price relative to the pre-market price. We find
evidence consistent with both predictions. The pre-market price-earnings ratio alone explains
more than 90% of the variation in the price-earnings ratio calculated using the offer price. After
taking into account the issuer’s pre-market price, peer firms’ pricing ratios have little explanatory
power for the offer price. Moreover, the price discount increases with price inaccuracy and

5
volatility, and decreases with firm size. The results suggest that underwriters understand both that
the pre-market price is useful on average, and that it is even more informative for some IPOs
than others.
In the third and final portion of the paper, we investigate the fascinating question of why
underpricing remains high despite the pre-market. In our sample, the average offer price is set at
67% of the pre-market price and the average initial return is 55%. Such a high level of
underpricing is hard to explain with asymmetric information theories of IPO underpricing. Our
evidence suggests that underwriters deliberately underprice shares for their own benefit. We
show that the revenue of investment banks from underwriting IPOs increases as underpricing
increases. Underwriter brokerage revenues also increase with the money left on the table,
consistent with the hypothesis that they allocate underpriced shares to their favored clients in
exchange for brokerage business. In addition, the underpricing level increases with the lead
underwriter’s incentive and bargaining power to underprice.
Our paper contributes to the IPO literature in several ways. Although the paper is not the
first to document that pre-market prices are informative, we add to the limited evidence on this
topic. Cornelli, Goldreich, and Ljungqvist (2006) and Dorn (2009) also study grey-markets but
focus on different research questions. Both use pre-market prices as a proxy for investor
sentiment, and find that high pre-market prices are associated with high first-day returns but poor
long-run returns. Second, we extend the analysis of pre-market trading by shedding light on what
factors make pre-market prices more informative and more useful in IPO pricing. Third, we
demonstrate two aspects of how the pre-market price is used in IPO pricing. On the one hand, it
largely determines the offer prices, as it should. On the other hand, we document that
underpricing levels remain high even when there is little asymmetric information or valuation
6
uncertainty about the IPO stock. Underwriters have strong monetary incentives to underprice the
stock, and the bookbuilding IPO method gives them a lot of power to do so. We provide clean
evidence that agency problems can cause high levels of underpricing. We thus offer new insights
for the important debate on the causes for underpricing and the choice of the IPO method.
We also document that government policy can affect the level of underpricing. In March
2011, the Taiwanese government instituted a requirement that the offer price cannot be less than
70% of the pre-market price. This requirement has limited the ability of underwriters to
underprice IPOs. We document that the average first-day return has dropped from 55% before
March 2011 to 27% since then. We conclude that this government policy has reduced IPO
underpricing, to the benefit of issuing firms.
1. Institutional Features
1.1 Taiwan’s Emerging Stock Market
Taiwan has one of the most active stock markets in the world, with two major stock
exchanges: the Taiwan Stock Exchange (TWSE) and the Gre Tai Securities Market (GTSM).3
The Emerging Stock Market (ESM) was established in January 2002 and is operated by the
GTSM, although this market is separate from the GTSM. By providing a trading platform for
unlisted stocks, the ESM prepares firms for getting listed by improving information transparency
and increasing firm visibility. The pre-IPO trading also results in market prices for the security
(price discovery) that can provide information for setting the IPO offer price. Since 2005, it has
been mandatory for unlisted firms to trade on the ESM for at least 6 months before they can
3At the end of 2010, there were 758 companies listed on the TWSE with a total market capitalization of US$784
billion, ranked number 21 in the world according to the World Federation of Exchanges web site, in spite of a population of only 23 million. The total trading volume of the TWSE in 2010 was US$895 billion, ranked number 14 in the world. In addition, the GTSM listed 564 companies with a total market capitalization of US$66.15 billion and had a total trading volume of US$187.78 billion in 2010.

7
apply for an IPO and get listed on either the TWSE or GTSM.
To qualify for ESM trading, a firm is required to publicly disclose its financials and
important corporate events. In particular, it has to disclose audited annual and semi-annual
financial statements. In contrast, a public firm traded on the TWSE or GTSM is required to
publish quarterly financial statements. Furthermore, written recommendations are required from
two or more securities firms, one of which is designated as the lead advisory/recommending
securities firm, which typically will also act as the lead underwriter in its later IPO.4 In contrast,
both the TWSE and GTSM markets have listing requirements on firm age, size, profitability, and
the number of shareholders, with the TWSE generally having more rigorous listing requirements
than the GTSM.
When registering on the ESM, a firm needs to prepare a prospectus that makes
disclosures about the firm’s background and history, top management and board of directors,
stock ownership, and firm financials. When applying for an IPO later, the firm has to file a new
prospectus that makes similar disclosures, and in addition includes underwriters’ opinions of the
firm and the IPO including the valuation of the stock.
The ESM is a dealers’ market. The recommending securities firms act as dealers or
market-makers for the recommended stock, and are each required to start with an inventory of at
least 100,000 shares, acquired from the firm. Furthermore, dealers as a group are required to start
with an initial inventory equal to the maximum of either 1.5 million shares or 3% of shares
outstanding.5 Thus, the public float for ESM trading is at least 3% of shares outstanding. The
4 A private firm in Taiwan needs to register with the Ministry of Economic Affairs, Department of Commerce and must comply with the Company Act. Firms traded on the ESM are also subject to additional regulations: (1) they have an additional regulator – the Financial Supervisory Commission (FSC), and (2) they are subject to additional laws such as the Securities and Exchange Act. 5 Most of the stocks have a market price of NT$10-50 (less than US$2), so even a small firm frequently has more than 50 million shares outstanding. Other securities firms can become a dealer for the stock later, with a required initial inventory of at least 30,000 shares. While trading on the ESM, firms can do private placements.

8
dealers assume the responsibility to continuously offer bid and ask quotes during normal trading
hours through the Emerging Stock Computerized Price Negotiation and Click System (the Click
System). The quoted spread cannot exceed five percent of the ask price. The recommending
securities firms are obligated to trade at the quoted prices for orders of 2,000 shares or less.
Investors can submit orders to the Click System through their brokers. For orders of 10,000
shares and more, the investor can directly negotiate with a dealer via other methods, such as by
telephone. All trades are recorded in the Click System. In contrast, both TWSE and GTSM
operate through fully automated electronic trading systems where only limit orders are accepted
and orders are executed in strict price and time priorities. Shorting is prohibited on the ESM.
Both individual and institutional investors can trade on the ESM, although mutual funds
were prohibited from participating during our sample period. However, based on interviews with
staff members of the ESM and practitioners in various institutions, we learned that insurance
companies, pension funds, and foreign institutional investors tend to refrain from investing in
ESM stocks since they are viewed as highly risky securities. Thus, ESM trading is typically
dominated by retail investors. Once the company applies for an IPO, the following group of
insiders is restricted from selling: directors, supervisors, and shareholders who hold at least 10%
of the firm.6
Compared to the other pre-markets in the world, Taiwan’s ESM has two distinctive
features: (1) it is mandatory for pre-IPO firms, and hence there is no concern about selection bias;
and (2) the pre-IPO market for each stock lasts for a relatively long period (by regulation, at least
6According to Article 216 of the Company Act of Taiwan, a firm subject to public disclosure requirements should have at least two supervisors, who are elected at shareholder meetings. A supervisor shall not concurrently be a director, manager, or employee of the company. Supervisors in Taiwan are responsible for monitoring directors and management. Supervisors function similarly to the audit committee of firms in the United States, fulfilling their duties by providing an independent and objective review of the financial reporting process, internal controls, and the audit function.

9
6 months). These features enable us analyze the dynamic development of pre-IPO trading and
identify the factors that affect the usefulness of such trading and the related pre-IPO prices.
1.2 The IPO process in Taiwan
Taiwan had experimented with various IPO methods in the past including fixed-price
offering (FPO hereafter), auction, bookbuilding, hybrid auction (auction plus FPO), and hybrid
bookbuilding (bookbuilding plus FPO). Since 2005, the hybrid bookbuilding method has become
the dominant method. In our sample of 218 IPOs, most IPOs use hybrid bookbuilding, with 14
firms using pure bookbuilding. During our sample period of October 25, 2005 through March 1,
2011, only two IPOs use non-bookbuilding methods (one uses a hybrid auction and the other
uses a fixed-price offering). Both are excluded from the sample.
As a normal practice worldwide, the bookbuilding tranche is open to institutional and
large individual investors. The FPO tranche, on the other hand, is open to the general public.
Bookbuilding investors give indications of interest (nonbinding bids with price-quantity
combinations). Allocation to bookbuilding investors is at the discretion of underwriters. In the
FPO, each investor can only submit an order of one lot composed of one thousand shares, and
allocation is determined by a lottery if there is oversubscription. FPO investors do not submit
price suggestions, with the understanding that they will receive the same offer price as
bookbuilding investors. Institutional investors are prohibited from participating in the FPO.7
Except for the overallotment, only primary shares are sold in the IPOs during our sample period.
That is, all of the shares offered are from the issuing firm rather than selling shareholders.
7As argued in Chiang, Qian and Sherman (2010), although a hybrid IPO consists of two stages, they are essentially
independent sales from the investors’ point of view. They state, “Due to the one-lot size constraint and frequent oversubscription in the fixed-price tranche, any investor who wishes to make a large investment will not rely on the second-stage sale. More important, there is little room for strategic interaction between the two stages.” (p1210). Their comments are for hybrid auctions during 1995-2000, during which the fixed-price offer is run after the auction tranche, hence referred as “second-stage sale”. The same argument, however, applies to the hybrid bookbuilding method in our sample.

10
Typically 70-90% of total shares offered in the IPO are sold through the bookbuilding tranche.
For 84% of the hybrid bookbuilding IPOs in our sample, the bookbuilding and FPO
tranches run simultaneously, with the rest having the bookbuilding tranche followed by the FPO
tranche. The bookbuilding period typically lasts for four business days during which investors
submit nonbinding orders. The FPO process often starts one day later than the start of
bookbuilding, but ends at the same time. An announcement is made on the first day of
bookbuilding that, among other things, gives a suggested price range. On the business day after
bookbuilding ends, the offer price is determined before noon (we call this day the pricing day
and the last bookbuilding day the pre-pricing day). As is normal with the bookbuilding method,
the final offer price is a result of negotiation between the underwriter and the issuer, and
typically the underwriter has a lot of power in determining the price. In the next few days, shares
are allocated and proceeds are collected. In most cases, the stock starts trading on the TWSE or
GTSM on the fifth business day after the pricing day. ESM trading continues after the pricing,
ending the day before TWSE or GTSM trading commences. A figure in Internet Appendix A
shows the time line of the IPO process (http://site.warrington.ufl.edu/ritter/ritterwp.htm).
2. The Sample and Data
Our sample includes 218 firms that went public between October 25, 2005 and March 1,
2011.8 All sample firms are subject to a regulation effective in January 2005 that firms must be
traded on the Emerging Stock Market for at least 6 months before they apply for an IPO. Three
types of firms are exempt from this requirement: firms spun off from listed parents, privatization
8 Our sample starts with the first IPO that is subject to the mandatory ESM trading. The IPOs after our sample period are subject to a new regulation that the offer price may not be less than 70 percent of the average ESM trading price during the 10 business days before the bookbuilding agreement has been registered with the Taiwan Securities Association (TSA). The new rule also says that if there is a difference of 50 percent between the offer price and the closing price on the pre-price day, a concrete explanation needs to be provided.

11
of public enterprises, and foreign companies. Although some of these exempted firms chose to
trade on the ESM before an IPO, we exclude all of them from our sample.9
We obtain daily trading data for ESM stocks including price, return, trading volume, and
shares outstanding from Taiwan Economic Journal (TEJ). TEJ also provides daily trading data
for listed firms after the IPO. Firm information such as firm age, assets, whether it is backed by
venture capital, and accounting information is collected from the ESM or IPO prospectus. IPO
characteristics such as fees, offer price, and the number of shares issued in each tranche are
collected from three sources: the IPO prospectus, the bookbuilding and FPO announcement, and
the underwriting announcement that is made after the bookbuilding and FPO processes are
completed.
Table 1 presents the summary statistics of firm characteristics at two points of time: when
firms start to trade on the ESM (Panel A) and when they apply for an IPO (Panel B). When
trading starts, the median firm is 9 years old, with an average asset value of NT$2.1 billion
(about US$70 million), and an average annual revenue of NT$1.6 billion (about US$53
million).10 The average debt ratio (total liabilities relative to assets) is 41.3%. The average return
on assets (ROA) is 9.2%. Forty-five percent of firms are backed by venture capital.
At the time of the IPO application, Panel B reports that on average firms are 1.7 years
older, with increased assets, revenues, and ROA, and a decreased debt ratio relative to when
ESM trading started. Panel C compares the differences in means and medians of these variables
9During our sample period, there are 8 IPOs that are spin-off firms and 32 that are foreign companies (including
those that issue Taiwan Depository Receipts). Two IPOs are privatizations of public enterprises. One of them uses the hybrid auction IPO method and the other uses pure fixed-price offering. There is also one firm that went IPO during our sample period (in November 2005) but its IPO application was before 2005 and hence was not subject to the new regulation. These firms are excluded from our sample. 10
All NT$ values in the paper are deflated to constant year 2011 NT$ based on Taiwan’s CPI index. At the end of 2011, the exchange rate was US$1 =NT$30.29.
12
between the two time points, with all differences being significant at the 1% level.11 In addition,
the fraction of firms that are backed by venture capital has increased from 45% at the time of
ESM listing to 56% at the time of the IPO application.
Table 2 shows the IPO characteristics. In the average IPO, the number of shares issued is
10.4% of the shares outstanding before the IPO. The average proceeds raised is NT$495.3
million (US$16 million). Both of these numbers are considerably lower than the corresponding
numbers for U.S. IPOs, where the average IPO during 2005-2011 issued close to 50% of the pre-
IPO shares outstanding and raised more than 15 times as much money, according to numbers
listed on Jay Ritter’s website. Thirty percent of the firms are listed on the TWSE, and 70% are
listed on the GTSM. The median P/E ratio (i.e., offer price relative to the annual earnings per
share before the IPO) is 11.7. After excluding three outliers, the average P/E ratio is 18.4.12 Price
revision, computed as the offer price relative to the midpoint of the price range announced
shortly before the bookbuilding process, minus 1, has a mean of 0.13%, a median of 0, and a
standard deviation of 4.6%. None of the issues in our sample is priced outside of its price range.
We calculate the price discount as one minus the ratio of the offer price over the ESM
closing price on the day before IPO pricing, multiplied by 100%. The average price discount is
33.0%. Alternatively, the ratio of the ESM closing price on the day before IPO pricing over the
offer price minus one, multiplied by 100% (which we call expected initial return), has an average
of 58.4%. In comparison, the initial return of IPO investors (i.e., the closing price on the first-
trading day on TWSE/GTSM relative to the offer price minus one) has an average of 55.3%. All
11
We use paired t-tests for differences in means and Wilcoxon signed rank tests for differences in medians, assuming independence across IPOs. We do not test the significance of the change in firm age since the value of this variable increases by construction. 12 When applying for an IPO, firms in general are required to have positive earnings. However, a firm can be exempted from the requirement if it is deemed as advancing important innovations or participates in major national public construction projects. In our sample, two firms have negative earnings when applying for an IPO. Another firm has a tiny EPS and hence a P/E ratio larger than 1000. We exclude these three firms when the P/E ratio is used in our analysis.

13
218 IPOs have an offer price less than the ESM closing price. Only 6.4% of IPOs drop in price
on the first day of trading, and even then by no more than 10%.
With an average discount of 33% and an issue size of 10% of the pre-IPO shares
outstanding, the money left on the table is approximately 3% of firm value, which is smaller than
that in the United States, where the comparable numbers for 2005-11 are 10% (for the discount)
and 50% (for the issue size), resulting in foregone proceeds of 5% of pre-IPO firm value.
Furthermore, the investment banking fees in the U.S. are larger than in Taiwan (which will be
discussed later), accentuating the difference in foregone proceeds.
We note that not all ESM firms have IPOs. There are 299 firms that have traded on the
ESM during our sample period but haven’t had an IPO by January 2014. Among them, 166 firms
stopped trading on the ESM, mostly due to poor performance but sometimes because of mergers
and acquisitions. We compare the 299 no-IPO firms with our sample firms in Table IA-1 of
Internet Appendix A. These no-IPO firms tend to be less profitable than our sample firms, and
they suffer lower liquidity and lower returns during the first 6 months of ESM trading. It appears
that more successful firms tend to have IPOs. Our study focuses on the informativeness of ESM
prices for those that do go public. Our conclusion that their pre-market prices right before an IPO
are informative cannot be extended to all ESM prices. It is possible that some firms cannot
establish a liquid market and informative prices on the ESM, which in turn prevents them from
having IPOs.
3. The Informativeness of ESM Prices
We focus on the ESM price shortly before the IPO. In Internet Appendix A, however, we
report how trading and prices evolve for ESM stocks. Specifically, we examine liquidity, returns,
14
and volatility for three event periods: the six months after ESM trading starts, the six months
prior to IPO application, and the three months prior to IPO pricing. For comparison, we also
investigate the six-month period of trading on the TWSE or GTSM after the IPO. The general
trend is that when a firm moves towards its IPO, its stock trading on the ESM becomes more
liquid and less volatile; and it tends to have a large price run-up prior to the IPO. It is likely that
these patterns are due to both the sample selection bias associated with successful IPOs, and
greater liquidity in anticipation of the greater post-IPO liquidity to come.
3.1 Price accuracy on ESM
We examine the informativeness of the pre-market price in reflecting the fundamental
value of a stock. To do that, we assume the after-IPO market price is efficient and use it as the
benchmark. Specifically, we define the price error for stock i on day t as:
,
where Pi,t is the closing price on day t (t belongs to the pre-IPO period), and Pi,FTD is the closing
price on the first trading day on the TWSE or GTSM. We define the absolute value of the price
error as price inaccuracy, i.e.,
.
We observe a clear decreasing trend for price inaccuracy as time approaches the IPO.
Table 3 reports the summary statistics of these variables 6, 3, 2, and 1 month(s) before, 1 day
before, and the 4th day after IPO pricing.13 At six months before the pricing (and after IPO
application), the mean (median) price inaccuracy is 50.8% (35.1%). On the day before the
13 In Internet Appendix A, we also display a figure for the daily mean and median price inaccuracy for the period around IPO pricing, i.e., from six months before pricing or the IPO application date, whichever is later, to four business days after IPO pricing.
FTDi
FTDiti
tiP
PP
,
,,
, ErrorPrice−
=
FTDi
FTDiti
tiP
PP
,
,,
,Inaccuracy Price−
=
15
pricing date, the mean (median) price inaccuracy is 14.8% (13.0%). This decrease is not
surprising—the price of a random stock today will be a less accurate predictor of the price six
months from now than will be the price the day before the six-month anniversary. The standard
deviation also steadily decreases from 50.4% to 11.4%. It is clear that the pre-market price
shortly before the IPO is close to and hence very informative about the aftermarket price.
Several reasons may contribute to the disparity between the ESM price on the pre-pricing
day and the after-market price. First, there might be information resolution over the 5-day period.
This applies to listed firms on the TWSE and GTSM as well, except that our sample firms have
an important type of information resolution in common--the culmination of the IPO. Second, the
trading environment changes. Now officially listed on the TWSE or GTSM, these stocks may
gain more attention and attract more investors; their trading becomes more liquid, and hence
prices more efficient. Third, there might be investor clientele changes. As discussed before,
institutional investors are either restricted or self-restricted from participating in the ESM
market. Hence it is likely that more institutional investors invest in or trade the stock once it is
listed on the TWSE or GTSM.
Table 3 also reports summary statistics for the price error. It shows that mean and median
price errors are mostly not significantly different from zero 6, 3, 2 and 1 month(s) before IPO
pricing. However, on the day before pricing, the average pricing error is 6.0% and the median is
6.5%; both are statistically significant. This positive pricing error is consistent with the finding of
Cornelli, Goldreich and Ljungqvist (2006) for European grey markets.
To further test the informativeness of the pre-market price, we explore the predictability
of the initial return based on the pre-market price. Specifically, we use the expected initial return
based on the pre-market price (i.e., pre-market price over the offer price, minus one) to predict

16
the post-market first-day return. (The regression results are available in Internet Appendix A.)
When estimating a univariate regression of the actual return on the expected initial return, we
find a regression coefficient of 1.23, which is significantly different from 0, but not significantly
different from 1.00. The expected initial return alone explains 77% of the variation of the actual
initial returns. In contrast, multivariate regressions predicting initial returns using U.S. data
(without the pre-market) typically have R-squared’s around 20% (e.g., see Hanley, 1993; Lowry
and Schwert, 2004; Liu and Ritter, 2011).
We then include a set of control variables that might affect actual initial returns: the
lagged 3-week market return, (asymmetric) price revision, log(assets), return on assets, a VC
dummy that equals one if the firm is backed by venture capital, and firm stock return volatility
during the 3 months prior to the pricing, as well as year and industry dummies. The coefficient
on the expected initial return is similar to that in the univariate regression. The R-squared is 79%
for the multivariate regression, which is not much of an improvement from the univariate
regression value of 77% that uses expected initial return as the only explanatory variable.
3.2 Price accuracy and stock liquidity on ESM
We hypothesize that the informativeness of pre-market prices should be positively related
to the liquidity of the stock. We use three measures of illiquidity: the percentage of zero trading
days (Rabinovitch, Silva and Susmel, 2003), the percentage of zero return days (Bekaert, Harvey
and Lundblad, 2007; Chen, Lesmond and Wei, 2007), and the Amihud ratio (Amihud, 2002).14
The larger each of these measures, the less liquid the stock is. We measure the illiquidity
variables during the three months prior to the pricing day.
14 The Amihud ratio for firm i is defined as , where ri,t is the daily stock return (in percentage
points) and dvoli,t is daily dollar volume (in millions of NT$). It measures the price impact (i.e., the absolute value of the return) per unit of dollar volume. If the dollar trading volume was calculated using U.S. dollars, the Amihud ratio would be approximately 30 times larger.
∑=
=
T
t ti
ti
idvol
r
TA
1 ,
, ||1

17
Table 4 reports the results of both univariate and multiple regressions of pre-pricing day
price inaccuracy on illiquidity, with and without control variables. Consistent with our
hypothesis, price inaccuracy increases with all measures of illiquidity (i.e., price accuracy
increases with liquidity). In terms of economic significance, a one-standard-deviation increase in
% of zero-trading days (16.76%) increases price inaccuracy by 2.48 percentage points (using the
multiple-regression regression result); a one-standard-deviation increase in % of zero-return days
(21.10%) increases price inaccuracy by 2.58 percentage points; and a one-standard-deviation
increase in the Amihud ratio (10.66%) increases price inaccuracy by 2.46 percentage points. In
comparison, the mean price inaccuracy is 14.78%. The coefficients on the control variables are
not significant, although their signs are consistent with the notion that larger firms, less profitable
firms, and less volatile firms tend to have higher price accuracy (i.e., lower price inaccuracy).
4. IPO Offer Price and Pre-Market Price
Table 3 showed that as the IPO nears, the pre-market price gets very informative about
the fundamental value of the stock, measured by the after-market price. The pre-market price
therefore should be useful in setting the IPO offer price. More specifically, the bookbuilding
theories based on asymmetric information posit that underpricing is used to compensate regular
investors for providing information that is not readily available from public sources (e.g.,
Benveniste and Spindt (1989) (with endowed information), and Sherman (2000) and Sherman
and Titman (2002) (with costly information)). This framework generates predictions that the IPO
offer price should exhibit the following features: (1) the offer price should largely depend on the
pre-market price but not peers’ pricing; (2) the more informative the pre-market price is, the
closer and higher the offer price will be relative to the pre-market price; and (3) there should be

18
little underpricing. We test the first two predictions in this section and explore the third in the
next section.
To test the first prediction, we run a horse-race between the stock’s own pre-market price
and its peer companies’ prices in determining the IPO offer price. Specifically, we regress the
(standardized) offer price on the stock’s own pre-market price and its peer firms’ market price.
We are interested to see which variable explains more of the variation in the offer price. We
standardize prices using two variables – earnings per share (EPS) and book value of equity per
share, i.e., we use two price ratios: the P/E ratio and the M/B (market-to-book) ratio. For brevity,
we present results using the P/E ratio and note that results are similar when the M/B ratio is used.
For each sample firm, peer companies are identified in two alternative ways: (1) we include all
firms in the same industry that are listed on either the TWSE or GTSM, and use the median price
ratio; (2) we identify a matching firm in the same industry that is traded on the TWSE or GTSM
and has the closest asset value as the IPO firm. Industries are defined using the TWSE 2-digit
industry classification; our sample includes 12 of the 31 possible industries.
Panel A of Table 5 reports the summary statistics of P/E ratios. The regression results in
Column 1 of Panel B show that the ESM P/E ratio explains 91.4% of the variation in offer price
P/E ratios. In Column 2, the only explanatory variable is the industry median P/E. The regression
coefficient is also positive and significant, but the R-squared is only 1.9%. When we include
both variables in the regression in Column 3, both the value and the t-statistic of the coefficient
on the pre-market P/E remain similar to those in Column 1, but the coefficient on the industry
median P/E becomes significantly negative. In addition, the R-squared is close to that in Column
1 (91.7% vs. 91.4%), suggesting that adding the industry median P/E in the regression does little
to improve the fit of the model. Interestingly, given the high R2, the slope coefficient for the pre-

19
market P/E is approximately 0.6, rather than the 1.0 that might be expected. This, together with
the small intercept (1.2), suggests that although the offer price largely depends on the pre-market
price, it is a sizable discount off the pre-market price. In other words, the offer price is on
average set at approximately 60% of the pre-market price, consistent with the average price
discount of 33.0% that we reported in Table 2.
Column 4 uses the matching firm’s P/E ratio as the only explanatory variable and Column
5 includes both the matching firm’s and the issuing firm’s pre-market P/E ratios. In both
regressions, the coefficient on the matching firm’s P/E is indistinguishable from zero.
The results in Table 5 support the notion that the pre-market price is highly relevant in
setting the IPO price. The information contained in the pre-market price is not captured by peer
firms’ price information, reflecting the effects of noise and outliers.
We now examine what determines the cross-sectional difference in the offer price relative
to the pre-market price, i.e., the price discount. Asymmetric information-based theories of IPO
underpricing hypothesize that the less risky the stock is and the more informative the pre-market
price is, the less is the discount that is needed when setting the IPO offer price
Table 6 reports the results of a regression of the price discount on stock and firm
characteristics. Columns 1-5 present univariate regressions of the price discount on, respectively,
pre-market price inaccuracy, pre-market stock volatility, a VC dummy, ROA, and log(assets), and
Column 6 presents a multiple regression including all of the variables as well as year and
industry dummies. Consistent with the asymmetric information hypothesis, the coefficients on
price inaccuracy and volatility are both significantly positive, and the coefficient on log(assets)
is significantly negative. The coefficients on VC dummy and ROA are negative, as predicted by
the hypothesis as well, although neither is statistically significant. In terms of economic

20
significance, a one-standard-deviation increase in price inaccuracy (11.4%) increases the price
discount by 2.0 percentage points; a one-standard-deviation increase in volatility (1.5%)
increases the price discount by 3.6 percentage points; and a one-standard-deviation increase in
ln(assets) (0.9) decreases the price discount by 3.4 percentage points.
One concern associated with using price inaccuracy in the previous regression is that it is
not known at the time of IPO pricing. Alternatively, we use the predicted value of price
inaccuracy from Table 4 after excluding liquidity variables from the logit regression. We call it
expected price inaccuracy. The regression of price discount on expected price inaccuracy is
reported in Column 7 of Table 6. We find that the price discount increases with expected price
inaccuracy, which supports the notion that the price discount decreases with the informativeness
of the pre-market price.
5. IPO Underpricing and Underwriter Incentives
The evidence in the previous section suggests that underwriters do recognize the
usefulness of the scaled pre-market price and largely rely on the information in setting the IPO
offer price, in that it explains over 90% of the variation of the offer price, whereas the scaled
multiple of peer firms explains little of the variation. Given that the existence of the pre-market
price reduces valuation uncertainty of the stock and also the information asymmetry between
different clienteles of investors, the information-based theory predicts that little underpricing is
needed to compensate investors for providing private information.
In contrast to this prediction, we observe a substantial amount of underpricing in our
sample: the average price discount is 33.0% and the average expected initial return is 58.4%.
Similarly, the actual initial return of IPO investors averages 55.3%. Such a high level of

21
underpricing is difficult to justify by information/risk reasons given the informativeness of the
pre-market prices. Neither can it be explained by the lack of understanding of the information
because the offer price does depend on the pre-market price to a large degree.
The evidence therefore points to the possibility that agency problems play an important
role in setting the IPO price. Loughran and Ritter (2002) and Liu and Ritter (2011), among
others, argue that underwriters have incentives to underprice IPO shares more than necessary and
allocate these underpriced securities to their favored clients in exchange for side payments. In the
U.S., such side payments include future investment banking business when shares are allocated
to corporate executives (Liu and Ritter, 2010) and brokerage trading commissions (soft dollars)
when shares are allocated to individuals or institutions (Reuter, 2006; Nimalendran, Ritter and
Zhang, 2007; Goldstein, Irvine and Puckett, 2011). Similar to the U.S., a small group of
investment banks dominate the underwriting market in Taiwan, which gives underwriters the
bargaining power to underprice for their own benefit.15
In our setting, we explore the agency hypothesis with three tests: first, we examine
whether underwriting-related income increases with underpricing. If yes, the underwriters will
have direct monetary incentives to underprice IPO shares. Second, if these Taiwanese
underwriters also trade underpriced shares for brokerage business, we expect that their brokerage
revenues will increase with the money left on the table of the IPOs they underwrite. Third, we
explore the cross-sectional differences in underwriters’ incentives and power to underprice. The
agency hypothesis predicts more underpricing, the higher are the incentives or bargaining power.
5.1 Underwriting income and IPO underpricing
In Taiwan, underwriters earn a sizable fraction of their fees from IPO investors in
15 Nineteen unique banks acted as lead underwriters during our sample period. Among them, six banks command 60% of the market share in terms of the number of IPOs and 78% of the market in terms of proceeds raised.

22
addition to a fixed fee (typically NT$5 million) they charge to the issuer (see Chen, Fok, and
Wang, 2006). The fee structure is such that underwriters can earn more when investors are more
enthusiastic about the security. 16 This feature provides a unique opportunity to directly test
whether underwriter fee income increases with the underpricing level.
Underwriters receive variable investor fees across IPO issues. Fees are from both
bookbuilding and FPO investors. Each FPO subscriber pays a fixed fee of NT$20, of which
NT$8.5 goes to underwriters (the rest is paid to brokers and the TWSE for handling the orders).
FPO fees are paid regardless of the allocation. Hence the higher the subscription ratio, the more
fees the underwriters earn. We calculate the percentage FPO fee as 8.5 times the FPO
subscription ratio, divided by the offer price, multiplied by 100%/1,000, since each investor
requests one lot of 1,000 shares. Since the subscription ratio has a large variation (a mean of 90
times and a standard deviation of 169), the FPO fee also varies considerably (with a mean of
2.0% and a standard deviation of 1.9% of the proceeds).
For the bookbuilding tranche, underwriters have discretion on how much fee to charge on
a per share basis.17 The bookbuilding fee paid by investors as a percentage of the proceeds varies
from 0 to 8.7%, with a mean of 1.7%. We calculate the total investor fee as the weighted average
of the FPO fees and the bookbuilding fee, where the weighting variable is the proceeds raised in
the two tranches.18 Table 7 Panel A reports the summary statistics of these fees.
For the underpricing level, we use an ex ante price discount measure based on the price
16 Chowdhry and Sherman (1996) argue that if the issuer (or the underwriter) collects interest float on investors’ advance payment, then there is an additional incentive to underprice the offering. This source of revenue does not apply to our sample since investors only pay at the end of the bookbuilding or FPO submission period. 17 Since bookbuilding fees are discretionary, underwriters have two choice variables, fees and the price discount, in maximizing their revenues. But since investors’ incentives are such that they are willing to pay higher fees in return for a higher price discount, the two choice variables can be collapsed to one, i.e., the price discount. 18 For the 14 pure bookbuilding IPOs in our sample, the total investor fee equals the bookbuilding fee. Because of these 14 IPOs, the average total investor fee is not a number between the average FPO fee and the average bookbuilding fee (see Table 7 Panel A).

23
range specified in the bookbuilding announcement, instead of an ex post measure based on the
offer price. This is because investor demand and fees are fixed before the offer price is finally
set, so they must depend on the expected price discount level. Specifically, we define intended
price discount as the midpoint of the price range relative to the closing pre-market price on the
day before the bookbuilding starts. The intended price discount turns out to be close to the actual
price discount (the mean is 32.0% vs. 33.0%, the median is 30.5% vs. 31.4%, and the correlation
is 0.89). Recall that the variable price revision has a standard deviation of only 4.6%.
Table 7 Panel B reports the results of regressions of underwriter fee income, as a
percentage of the proceeds, on the percentage intended price discount, with and without
controlling for other firm and stock characteristics. For both the univariate and multivariate
regressions, the coefficient on the intended price discount is positive and significant at the 1%
level. Based on the multivariate regression, a one-standard-deviation increase in the intended
price discount increases the total investor fee by 0.38% (=0.026×14.8), which is economically
significant given an average total investor fee of 1.67%. Given the average proceeds of
NT$495.3 million, a total investor fee of 0.38% translates into NT$1.9 million. In comparison,
the fixed fee the issuer pays to the underwriter is typically NT$5 million.
The results in Table 7 show that fee revenue increases with the intended price discount
(i.e., the expected underpricing level). Hence underwriters have direct monetary incentives to
underprice IPO shares to increase their own income from fees.
5.2 Underwriters’ brokerage revenues and money left on the table from IPOs
Existing studies report that U.S. underwriters have significant incentives to allocate
underpriced shares to institutional investors who give them brokerage business. We explore this
possibility in our sample by examining the relationship between an underwriter’s brokerage
revenues and the money left on the table from IPOs that they underwrite. A positive relationship

24
is consistent with the notion that underwriters trade underpriced shares for brokerage business.
We hand-collect lead underwriters’ brokerage revenues from their annual reports. There
are 19 unique lead underwriters in our sample. For each IPO, we compute the expected money
left on the table as the shares issued times the difference between the pre-market price on the day
before IPO pricing and the offer price. For each underwriter-year, we sum up the total money left
on the table from the IPOs that the firm lead underwrites.
We regress the underwriters’ brokerage revenues (in the current and next year) on the
total money left on the table. The agency hypothesis predicts that the more money that is left on
the table, the more investors will overpay on commissions on other trades, as a quid pro quo in
order to receive preferential allocations of shares, increasing the underwriter’s overall brokerage
revenues. Because each underwriter has a different normal level of revenues (some are bigger
than others), in our empirical work we control for underwriter fixed effects. By doing so, we
capture the within-firm changes in brokerage revenues due to changes in money left on the table.
We also control for the market return during the year, as market returns may affect both money
left on the table in IPOs and banks’ brokerage revenues.19
Table 8 reports the regression results. The dependent variable is the log of the current
year’s brokerage revenues (in millions) in Column 1 and next year’s brokerage revenues in
Column 2. The main variable of interest is the log of the total money left on the table during the
year (in millions). Both Columns 1 and 2 show a significantly positive coefficient on the
variable, suggesting that more money left on the table from IPOs is associated with an increase
in an underwriter’s brokerage revenues. Specifically, the Column 1 coefficient of 0.054 suggests
that for each 10% increase in the money left on the table from the IPOs it underwrites, the
19 Controlling for other market condition measures such as aggregate trading volume or the turnover ratio of the stock market, and GDP growth yield similar results.
25
underwriter’s brokerage revenues increase by 0.54%.
In unreported results, we find that after controlling for underwriter fixed effects, money
left on the table has an insignificantly negative relation with an underwriter’s brokerage revenues
in the previous year. This pattern indicates that the positive relations between IPO underpricing
and the current and next year’s brokerage revenues are unlikely due to spurious correlations.
In summary, the results in Table 8 show that underwriters’ brokerage revenues increase if
they leave more money on the table for IPO investors. This is consistent with the hypothesis that
they allocate underpriced shares in return for brokerage business.
The above two subsections show that underwriters income increases with IPO
underpricing, both directly through fees from IPO investors, and indirectly through increased
brokerage business. Our analysis may still underestimate the compensation underwriters receive
from allocating IPO shares. For example, we suspect they will have similar incentives as their
U.S. counterparties to trade IPO shares for future investment-banking businesses, although we do
not have data and evidence on this. This direct and indirect compensation for allocating
underpriced shares is consistent with our agency explanation for why the underpricing level
remains high even though underwriters recognize that the pre-market price is informative and
they set the offer price largely according to it. Although Taiwan has a different fee structure than
the U.S. market, underwriters in both markets have strong monetary incentives to underprice IPO
shares. Our setting allows us to show clean evidence of agency problems when there are few
asymmetric information problems.
The sensitivity of underwriter revenue to underpricing does not, however, explain why
issuers do not agree to pay higher fees in return for less underpricing, with a net effect of higher
net proceeds. For the U.S., Liu and Ritter (2011) posit that underwriters with influential analysts
26
have bargaining power, and are able to maintain excessive underpricing in equilibrium. Neither
they nor we explain why underwriters with bargaining power extract rents via excessive
underpricing, rather than through charging higher gross spreads.
5.3 Underwriters’ impact on underpricing
Cross-sectionally, the agency hypothesis predicts higher underpricing when the
underwriter has higher incentives or higher bargaining power to do so. We design three tests to
explore the cross-sectional differences in underwriters’ incentives or bargaining power. First, we
measure a lead underwriter’s monetary incentive to underprice based on the percentage of shares
sold/allocated by the lead. The lead underwriter has all the pricing power whereas the other
syndicate members help sell the shares. Whereas the lead receives most of the fixed fees from
the issuer, the investor fees an underwriter receives depend on the number of shares it sells, for
both the bookbuilding and FPO tranches. As discussed in Section 5.1, the investor fees increase
with the underpricing level. Therefore the higher the percentage of shares sold by the lead, the
higher are the incentives for it to underprice the stock.
Second, more generally, if underwriters’ intrinsic incentives and bargaining power do
influence the underpricing level, we expect to see a persistent underwriter effect on underpricing
(Hoberg, 2007). In other words, we expect an IPO’s price discount to be positively related to the
price discounts on previous IPOs lead underwritten by the same bank. Specifically, we regress an
IPO’s price discount on the average price discount of the lead’s IPOs in the previous three years.
Third, we conjecture that if an issuer has more cash needs and is more likely to come
back to the financial market in the near future, then the underwriter may have more bargaining
power to induce the issuer to leave more money on the table, due to the importance of analyst
coverage that is bundled with underwriting. We use the ex post occurrence of a firm’s security
issuance after the IPO as a proxy for its ex ante likelihood.

27
Table 9 reports the results of the three tests. Panel A presents the univariate subsample t-
tests, and Panel B presents the regression results. In Panel A, we divide the sample into
subsamples based on three variables respectively, to capture the three ideas described above.
The variables are: lead percentage—the percentage of shares sold by the lead, previous price
discount—the average price discount in the previous three years, and issue again—a dummy
variable equal to one if the firm issues any public securities (seasoned equity offerings or
corporate bonds) again in the next two years. Alternatively, we define issue again equal to one if
the firm issues seasoned equity offerings in the next two years, with similar results. We
categorize an IPO observation as having high underwriter incentive/power to underprice if it has
(Column 1) above-median lead percentage, or (Column 2) above-median previous price
discount, or (Column 3) its value of issue again is equal to one. The other IPOs are categorized
into low incentive/power subsamples. The agency hypothesis predicts that IPOs with high
underwriter incentive/power should exhibit higher underpricing.
Panel A reports the mean price discount for each subsample. Consistent with the agency
hypothesis, each high incentive/power subsample exhibits a higher average price discount than
its low incentive/power counterparty. The average price discount is 35.1% vs. 30.9% when IPOs
are categorized by above- vs. below-median lead percentage, 35.4% vs. 31.3% when IPOs are
categorized by above- vs. below-median previous price discount, and 36.4% vs. 30.9% when
IPOs are categorized by further security issuance. All differences are significant at the 5% level.
We then estimate multivariate regressions. The dependent variable is the percentage price
discount. The variables of interest are the three variables that measure the lead underwriter’s
incentive to underprice. We control for firm characteristics and industry and year fixed effects.
Panel B reports the regression results. Consistent with the results in Panel A, each of the three

28
main variables—lead percentage, previous price discount, and issuer again has a significant and
positive coefficient. That is, the higher the lead underwriter’s incentive and power to underprice,
the higher the underpricing level.
Another measure that has been used in the literature for underwriter power is a bank’s
market share in the IPO market. Because market share is also a measure for underwriter
reputation, its impact on underpricing is conceptually unclear. On the one hand, rent-seeking
underwriters with higher bargaining power will want to increase underpricing; on the other hand,
underwriters who care about their reputation capital will want to lower underpricing (e.g., Beatty
and Ritter, 1986). In addition, prestigious underwriters provide higher certification value and
hence investors may demand lower underpricing (e.g., Carter and Manaster, 1990). The
empirical evidence for the relationship between underwriter market share and underpricing in the
U.S. varies with the sample period (e.g., Beatty and Welch, 1996).
In our sample, we find an underwriter’s market share has no significant impact on the
price discount (not tabulated). This lack of a pattern is consistent with the opposing effects of
underwriter reputation and power as described above. Another possible reason for the lack of a
pattern is the endogenous matching between the underwriter and the issuer (Fernando, Gatchev
and Spindt, 2005). Although underwriters with a higher market share tend to have greater
bargaining power, all else equal, the issuers they serve may also be of higher quality and thus
also have more bargaining power. Consistent with this conjecture, we find a positive correlation
between issuer size and underwriter market share. The net bargaining outcome between the
issuer and the underwriter therefore cannot be directionally predicted.
5.4 Impact of a regulatory constraint
Acting upon complaints of excessive underpricing, the Taiwan Securities Association
(TSA), under the guidance of the Financial Supervisory Commission (FSC), imposed a new rule

29
in 2011 mandating that the IPO offer price must not be lower than 70% of the average ESM
trading price during the 10 days before the bookbuilding announcement is submitted to the TSA
(which typically is two business days before the bookbuilding starts). The rule applies to IPOs
after our sample period.
We examine how this rule affects ESM trading and the IPO offer price. For this purpose,
we impose the same sample criteria as before and collect data for 172 bookbuilt IPOs during
March 2011 – December 2014. Panel A of Table 10 compares the firm characteristics of IPO
firms during the two sample periods. Overall similar firms issue IPOs under the two regimes.20
We repeat all the analysis for the post-sample period and in most cases find qualitatively
similar results (available in Internet Appendix B): (a) pre-market prices are informative with a
mean price inaccuracy of 12.7% on the day before IPO pricing; (b) the higher is the liquidity of
the ESM stock trading, the more informative is the pre-market price; (c) the scaled pre-market
price alone explains more than 90% of the variation in offer price.
The striking difference for the new period, however, is that the average underpricing level
is roughly halved! The average initial return decreases to 27% (vs. 55% in our sample period).
Using the same definition of price discount as before (i.e., benchmarked against the ESM closing
price before IPO pricing), the average price discount is 23% (vs. 33% in our sample period).
Panel B of Table 10 compares the initial return and price discount in the two regimes. The
difference in both means and median of these two variables are statistically significant.
If we calculate the price discount against the regulatory benchmark, i.e., the average ESM
trading price during the 10 days before the bookbuilding announcement is submitted to the TSA,
the average price discount is also 23%, with the 25th, 50th, and 75th percentiles equal to 19%,
20 The average ROA decreases in the later period. Part of the reason is that in 2010, regulators issued new rules to encourage more “high-tech and innovative” companies to have IPOs and these companies are exempted from the positive earnings requirement.

30
23%, and 27% respectively. Therefore a substantial portion of IPOs have their offer prices set
close to the minimum values allowed by the regulation. The practice of using round numbers for
the offer price explains why there is not a large fraction of IPOs at a discount of exactly 30%.
For example, if the pre-market price is 95, the minimum permitted offer price would be 0.7×95 =
66.5, but the offer price is likely to be 70, resulting in a price discount of 26.3%.
Despite the similar pre-market and similar IPO institutions, the average underpricing
level changes drastically due to the regulatory constraint. This pattern is consistent with the
notion that agency problems are a main cause of underpricing, and the underpricing level
decreases when the regulation constrains the underwriters’ bargaining power, to the benefit of
issuers. The results are consistent with the findings of Ince (2014), who also finds little support
for the Benveniste and Spindt (1989) mechanism design theory’s predictions. Overall, the results
we present in this section are consistent with the agency hypothesis, and explain why
underpricing can remain high in a setting with little valuation uncertainty and information
asymmetry.
6. Conclusions
We study a unique pre-IPO market that has an organized trading platform and is
mandatory for firms aiming for an IPO – the Emerging Stock Market in Taiwan. We find that the
pre-market trading achieves price discovery to a large degree—as the date of an IPO is
approached, the price becomes very informative about the stock’s after-IPO value. The pre-
market price therefore should be very useful in setting the IPO offer price, thus making the
biggest challenge in the IPO process less of a challenge.
We indeed find that the IPO offer price largely depends on the pre-market price. The pre-

31
market price-multiple alone explains about 90% of the variation in the offer price-multiple. After
taking into account the issuer’s own pre-market price, peers’ prices are no longer important in
determining the offer price. Moreover, the more volatile or riskier the stock is, and the less
informative the pre-market price is, the greater is the discount taken in setting the offer price
relative to the pre-market price (and similarly, the higher the first day return). These results are
consistent with the prediction of asymmetric information bookbuilding theories.
Despite the informative pre-market price, however, IPO underpricing remains at a high
average level, 55.3%, in contrast to the prediction of asymmetric information-based
bookbuilding theories. We provide evidence that underwriters have monetary incentives to
underprice shares—both their fees collected from investors and their brokerage revenues
increase when underpricing increases. We also find that the stronger are the underwriter’s
incentives to underprice and the stronger are their bargaining powers, the higher is the
underpricing. Our results therefore suggest that agency problems can lead to high levels of IPO
underpricing even when there is little information asymmetry or valuation uncertainty about the
stock.
Our study has several policy implications. We demonstrate the usefulness of a pre-IPO
market in terms of price discovery. We show that liquidity is a key factor in determining the price
efficiency on such a market. Consequently, restrictions on institutional participation in ESM
trading may have the effect of making the ESM less liquid and informative than it could be. We
also observe that the liquidity of the ESM trading remains low before the firm applies for an IPO,
and that liquidity does not necessarily increase with the number of days the stock is traded. These
facts therefore raise a question regarding the usefulness of prolonged trading before IPO
application when there is little attention to, and a lot of uncertainty about, the firm. ESM trading

32
does, however, allow for greater risk-sharing for pre-IPO shareholders than if it did not occur.
In spite of the information acquired about market demand through ESM trading, the
average first-day return of 55.3% with bookbuilt IPOs is far higher than the 7.7% average
underpricing reported for 84 IPO auctions in Taiwan during 1995-2000 by Chiang, Qian, and
Sherman (2010). Since underwriters enjoy the most flexibility and discretion over the pricing and
allocation of shares under the bookbuilding method (as opposed to the auction or fixed-price
offering method), it is the method that is most vulnerable to agency problems. Our findings
therefore cast doubt on the benefit of the bookbuilding method, especially in the presence of a
pre-IPO market from which price discovery is largely achieved.
Our study also raises questions about the effectiveness of private contracting in
addressing agency problems in the security issuance market when the underwriters have market
power. It is not clear why the market (in Taiwan as well as worldwide) does not use a fee
structure contingent on the level of underpricing to discourage deliberate underpricing. Our
results show that regulations and market infrastructures set up by the regulations are important in
determining the relative bargaining powers of different players and therefore matter to the
equilibrium. There is, however, always a risk in over-regulating. Further research on the effects
of regulation on the IPO market, and more broadly, the design of primary market
microstructures, will be useful.

33
References
Amihud, Y. 2002. Illiquidity and stock returns: cross-section and time-series effects. Journal of
Financial Markets 5:31–56. Aussenegg W., P. Pichler, and A. Stomper. 2006. IPO pricing with bookbuilding and a when-
issued market. Journal Financial Quantitative and Analysis 41:829–62. Beatty, R. P., and J. R. Ritter. 1986. Investment banking, reputation, and the underpricing of
initial public offerings. Journal of Financial Economics 15:213–232. Beatty, R. P., and I. Welch. 1996. Issuer expenses and legal liability in initial public
offerings. Journal of Law and Economics 39:545–602. Bekaert, G., C. Harvey, and C. Lundblad. 2007. Liquidity and expected returns: lessons from
emerging markets. Review of Financial Studies 20:1783–1831. Benveniste, L., and P. Spindt. 1989. How investment banks determine the offer price and
allocation of new issues. Journal of Financial Economics 24:343–362. Brooks, R. M., P. G. Mathew, and J. J. Yang. 2014. When-issued trading in the Indian IPO
market. Journal of Financial Markets 19:170–196. Carter, R., and S. Manaster. 1990. Initial public offerings and underwriter reputation. The
Journal of Finance 45:1045–1067. Chen, H-C., R. C. W. Fok, and Y-J. Wang. 2006. Why do underwriters charge low underwriting
fees for initial public offerings in Taiwan? Journal of Business Finance & Accounting 33:979–1005.
Chen, L., D. A. Lesmond, and J. Wei. 2007. Corporate yield spreads and bond liquidity, Journal
of Finance 62:119–149. Chiang, Y. M., Y. Qian, and A. Sherman. 2010. Endogenous entry and partial adjustment in IPO
auctions: are institutional investors better informed? Review of Financial Studies 3:1200– 1230.
Chowdhry, B., and A. Sherman. 1996. International differences in oversubscription and
underpricing of initial public offerings. Journal of Corporate Finance 2:359–381. Cornelli, F., D. Goldreich, and A. Ljungqvist. 2006. Investor sentiment and pre-IPO markets.
Journal of Finance 61:1187–1216. Derrien F., and A. Kecskés. 2007. The initial public offerings of listed firms. Journal of Finance
62:447–479.

34
Dorn, D. 2009. Does sentiment drive the retail demand for IPOs? Journal of Financial and
Quantitative Analysis 44:85–108. Fernando, C. S., V. A. Gatchev, and P. A. Spindt. 2005. Wanna dance? How firms and
underwriters choose each other. Journal of Finance 60:2437–2469. Goldstein, M. A., P. Irvine, and A. Puckett. 2011. Purchasing IPOs with commissions. Journal
Financial Quantitative and Analysis 46:1193–1225. Hanley, K.W. 1993. The underpricing of initial public offerings and the partial adjustment
phenomenon. Journal of Financial Economics 34:231–250. Hoberg, G. 2007. The underwriter persistence phenomenon. Journal of Finance 62:1169–1206. Ince, O. 2014. Why do IPO offer prices only partially adjust? Quarterly Journal of Finance 4:1–
32. Kim, M., and J. R. Ritter. 1999. Valuing IPOs. Journal of Financial Economics 53:409–437. Liu, X., and J. R. Ritter. 2010. The economic consequences of IPO spinning. Review of Financial
Studies 23:2024–2059. Liu, X., J. R. Ritter. 2011. Local underwriter oligopolies and IPO underpricing. Journal of
Financial Economics 102:579–601. Ljungqvist, A. 2007. IPO underpricing. B.E. Eckbo (ed.), Handbook of Corporate Finance.
North-Holland. Löffler, G., P. F. Panther, and E. Theissen. 2005. Who knows what when? The information
content of pre-IPO market prices. Journal of Financial Intermediation 14:466–484. Loughran, T., and Ritter, J. R. 2002. Why don’t issuers get upset about leaving money on the
table in IPOs? Review of Financial Studies 15:413–443. Lowry, M., and G. W. Schwert. 2004. Is the IPO pricing process efficient? Journal of Financial
Economics 71:3–26. Nimalendran, M., J. R. Ritter, and D. Zhang. 2007. Do today’s trades affect tomorrow’s IPO
allocation? Journal of Financial Economics 84:87–109. Purnanandam, A., and B. Swaminathan. 2004. Are IPOs really underpriced? Review of Financial
Studies 17:811–848. Rabinovitch, R., C. A. Silva, and R. Susmel. 2003. Returns on ADRs and arbitrage in emerging
markets. Emerging Markets Review 4:225–247.

35
Reuter, J. 2006. Are IPO allocations for sale? Evidence from mutual funds. Journal of Finance 61:2289–2324.
Ritter, J. R. 2011. Equilibrium in the initial public offerings market. Annual Review of
Financial Economics 3:347–374. Sherman, A. 2000. IPOs and long term relationships: An advantage of book building. Review of
Financial Studies 13:697–714. Sherman, A., and S. Titman. 2002. Building the IPO order book: Underpricing and participation
limits with costly information. Journal of Financial Economics 65:32–9. Smith, R., and J. Eaglesham. 2012. SEC cracks down on pre-IPO trading. Wall Street Journal
March 14, 2012. Stone, B. 2011, Silicon valley cashes out selling private shares. Businessweek April 21, 2011.

36
Table 1
Firm characteristics
The sample includes 218 Taiwanese firms that conducted IPOs during 10/2005-02/2011. NT$ refers to New Taiwan Dollars. All NT$ values are deflated to constant year 2011 NT$ based on Taiwan’s CPI index. The exchange rate at the end of year 2011 is US$1 = NT$30.29. Debt ratio is total liabilities over assets. Return on assets is annual net earnings relative to assets. We use paired t-test for differences in means, and Wilcoxon signed rank test for differences in medians. We do not test the significance of the change in firm age since the value of this variable increases by construction. ***, **, and * denote the difference is significant at the 1%, 5%, and 10% levels, respectively. Panel A: When starting trading on the Emerging Stock Market. Variables N Mean Median Std. Dev Min. Max.
Firm Age (years) 218 12.14 9.06 8.71 1.37 45.59
Assets (millions of NT$) 218 2,101.32 882.57 5,810.45 135.58 73,343.20
Annual revenues (millions of NT$) 218 1,640.62 652.83 3,115.62 4.45 33,696.54
Debt ratio (%) 218 41.33 41.86 17.36 0.00 87.62
Return on Assets (%) 218 9.22 8.93 10.76 -22.48 63.14
% of firms with VC backing 218 44.95
Panel B: At the time of IPO application Variables N Mean Median Std. Dev Min. Max.
Firm Age (years) 218 13.87 11.26 8.81 1.93 46.20
Assets (millions of NT$) 218 2,932.63 1,261.53 7,591.07 252.28 76,963.73
Revenues (millions of NT$) 218 2,845.89 1,126.74 7,111.01 59.60 81,786.18
Debt ratio (%) 218 36.19 35.03 15.62 4.00 85.89
Return on Assets (%) 218 14.31 11.96 11.06 -7.10 75.17
% of firms with VC backing 218 56.42
Panel C: Difference (Panel B – Panel A) N Mean Median
Firm Age (years) 218 1.74 2.20 Assets (millions of NT$) 218 831.31 *** 378.96 ***
Revenues (millions of NT$) 218 1,205.27 *** 473.91 ***
Debt ratio (%) 218 -5.14 *** -6.83 ***
Return on assets (%) 218 5.09 *** 3.03 ***
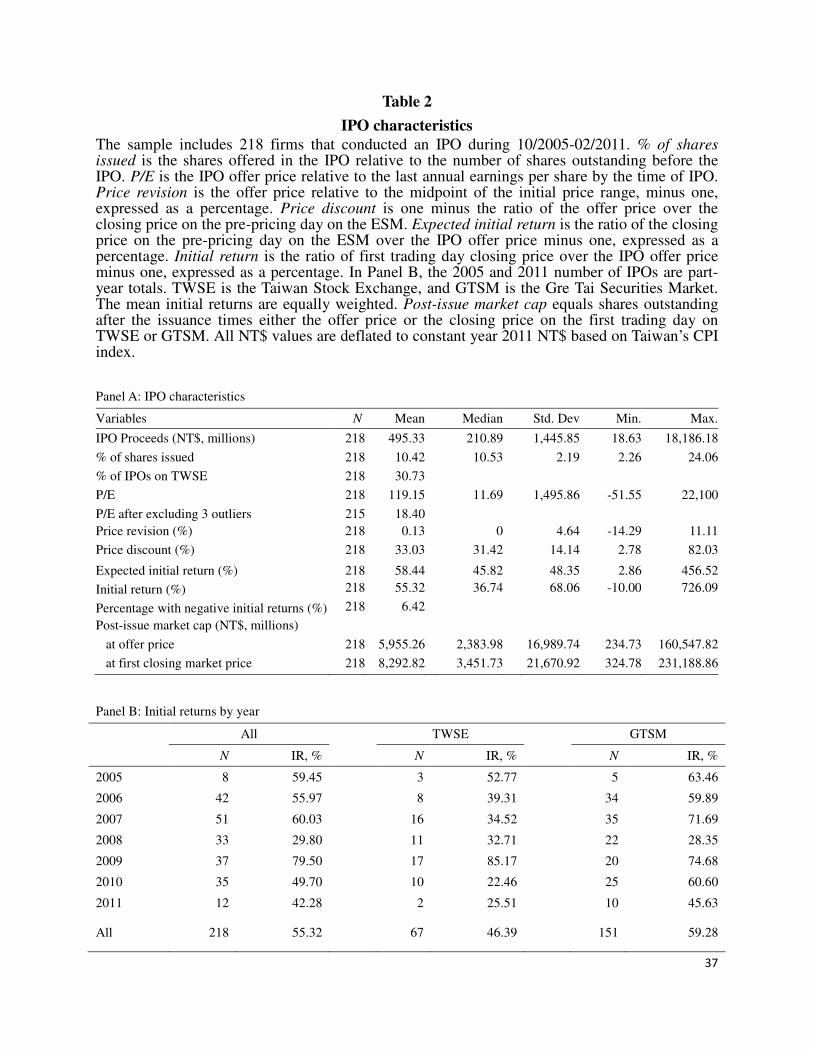
37
Table 2
IPO characteristics
The sample includes 218 firms that conducted an IPO during 10/2005-02/2011. % of shares issued is the shares offered in the IPO relative to the number of shares outstanding before the IPO. P/E is the IPO offer price relative to the last annual earnings per share by the time of IPO. Price revision is the offer price relative to the midpoint of the initial price range, minus one, expressed as a percentage. Price discount is one minus the ratio of the offer price over the closing price on the pre-pricing day on the ESM. Expected initial return is the ratio of the closing price on the pre-pricing day on the ESM over the IPO offer price minus one, expressed as a percentage. Initial return is the ratio of first trading day closing price over the IPO offer price minus one, expressed as a percentage. In Panel B, the 2005 and 2011 number of IPOs are part-year totals. TWSE is the Taiwan Stock Exchange, and GTSM is the Gre Tai Securities Market. The mean initial returns are equally weighted. Post-issue market cap equals shares outstanding after the issuance times either the offer price or the closing price on the first trading day on TWSE or GTSM. All NT$ values are deflated to constant year 2011 NT$ based on Taiwan’s CPI index.
Panel A: IPO characteristics
Variables N Mean Median Std. Dev Min. Max.
IPO Proceeds (NT$, millions) 218 495.33 210.89 1,445.85 18.63 18,186.18
% of shares issued 218 10.42
10.53
2.19 2.26 24.06
% of IPOs on TWSE 218 30.73
P/E 218 119.15 11.69 1,495.86 -51.55 22,100
P/E after excluding 3 outliers 215 18.40
Price revision (%) 218 0.13 0 4.64 -14.29 11.11
Price discount (%) 218 33.03 31.42 14.14 2.78 82.03
Expected initial return (%) 218 58.44 45.82 48.35 2.86 456.52
Initial return (%) 218 55.32 36.74 68.06 -10.00 726.09
Percentage with negative initial returns (%) 218 6.42
Post-issue market cap (NT$, millions)
at offer price 218 5,955.26 2,383.98 16,989.74 234.73 160,547.82
at first closing market price 218 8,292.82 3,451.73 21,670.92 324.78 231,188.86
Panel B: Initial returns by year
All TWSE GTSM
N IR, % N IR, % N IR, %
2005 8 59.45 3 52.77 5 63.46
2006 42 55.97 8 39.31 34 59.89
2007 51 60.03 16 34.52 35 71.69
2008 33 29.80 11 32.71 22 28.35
2009 37 79.50 17 85.17 20 74.68
2010 35 49.70 10 22.46 25 60.60
2011 12 42.28 2 25.51 10 45.63
All 218 55.32 67 46.39 151 59.28
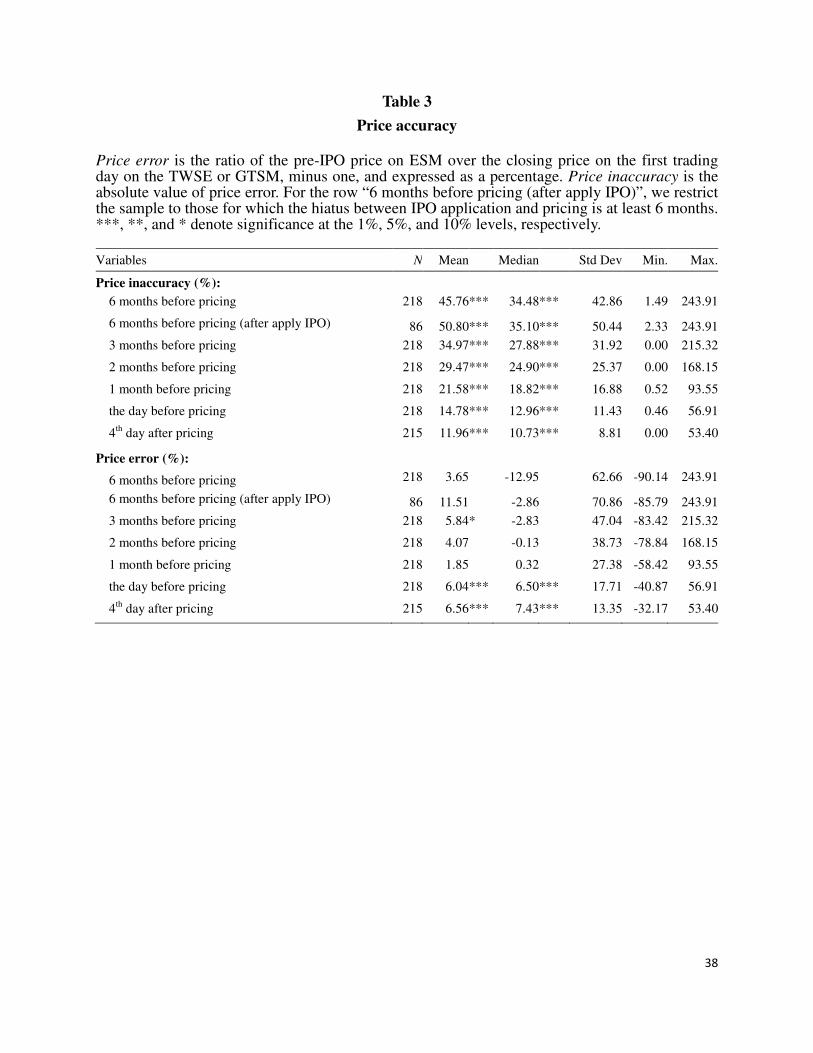
38
Table 3
Price accuracy
Price error is the ratio of the pre-IPO price on ESM over the closing price on the first trading day on the TWSE or GTSM, minus one, and expressed as a percentage. Price inaccuracy is the absolute value of price error. For the row “6 months before pricing (after apply IPO)”, we restrict the sample to those for which the hiatus between IPO application and pricing is at least 6 months. ***, **, and * denote significance at the 1%, 5%, and 10% levels, respectively.
Variables N Mean Median Std Dev Min. Max.
Price inaccuracy (%):
6 months before pricing 218 45.76 *** 34.48 *** 42.86 1.49 243.91
6 months before pricing (after apply IPO) 86 50.80 *** 35.10 *** 50.44 2.33 243.91
3 months before pricing 218 34.97 *** 27.88 *** 31.92 0.00 215.32
2 months before pricing 218 29.47 *** 24.90 *** 25.37 0.00 168.15
1 month before pricing 218 21.58 *** 18.82 *** 16.88 0.52 93.55
the day before pricing 218 14.78 *** 12.96 *** 11.43 0.46 56.91
4th day after pricing 215 11.96 *** 10.73*** 8.81 0.00 53.40
Price error (%):
6 months before pricing 218 3.65 -12.95 62.66 -90.14 243.91
6 months before pricing (after apply IPO) 86 11.51 -2.86 70.86 -85.79 243.91
3 months before pricing 218 5.84 * -2.83 47.04 -83.42 215.32
2 months before pricing 218 4.07 -0.13 38.73 -78.84 168.15
1 month before pricing 218 1.85 0.32 27.38 -58.42 93.55
the day before pricing 218 6.04 *** 6.50 *** 17.71 -40.87 56.91
4th day after pricing 215 6.56 *** 7.43 *** 13.35 -32.17 53.40
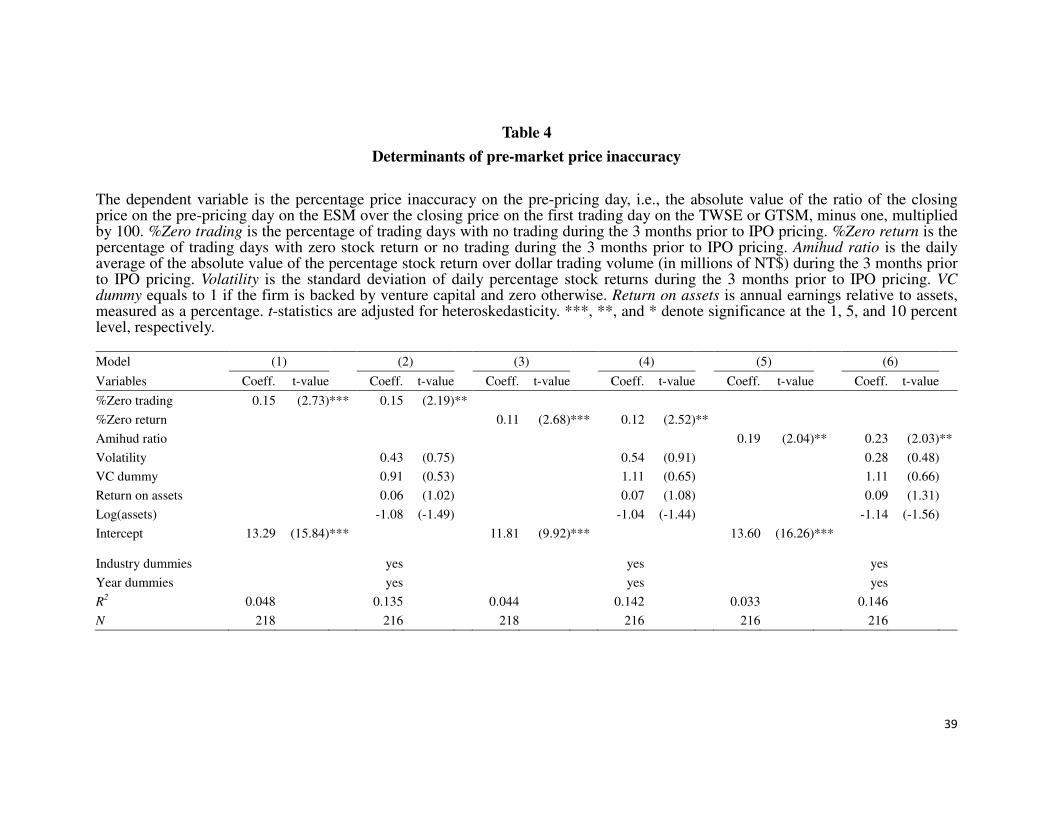
39
Table 4
Determinants of pre-market price inaccuracy
The dependent variable is the percentage price inaccuracy on the pre-pricing day, i.e., the absolute value of the ratio of the closing price on the pre-pricing day on the ESM over the closing price on the first trading day on the TWSE or GTSM, minus one, multiplied by 100. %Zero trading is the percentage of trading days with no trading during the 3 months prior to IPO pricing. %Zero return is the percentage of trading days with zero stock return or no trading during the 3 months prior to IPO pricing. Amihud ratio is the daily average of the absolute value of the percentage stock return over dollar trading volume (in millions of NT$) during the 3 months prior to IPO pricing. Volatility is the standard deviation of daily percentage stock returns during the 3 months prior to IPO pricing. VC dummy equals to 1 if the firm is backed by venture capital and zero otherwise. Return on assets is annual earnings relative to assets, measured as a percentage. t-statistics are adjusted for heteroskedasticity. ***, **, and * denote significance at the 1, 5, and 10 percent level, respectively.
Model (1) (2) (3) (4) (5) (6)
Variables Coeff. t-value Coeff. t-value Coeff. t-value Coeff. t-value Coeff. t-value Coeff. t-value
%Zero trading 0.15 (2.73)*** 0.15 (2.19)**
%Zero return 0.11 (2.68)*** 0.12 (2.52)**
Amihud ratio 0.19 (2.04)** 0.23 (2.03)**
Volatility 0.43 (0.75) 0.54 (0.91) 0.28 (0.48)
VC dummy 0.91 (0.53) 1.11 (0.65) 1.11 (0.66)
Return on assets 0.06 (1.02) 0.07 (1.08) 0.09 (1.31)
Log(assets) -1.08 (-1.49) -1.04 (-1.44) -1.14 (-1.56)
Intercept 13.29 (15.84)*** 11.81 (9.92)*** 13.60 (16.26)***
Industry dummies yes yes yes
Year dummies yes yes yes
R2 0.048 0.135 0.044 0.142 0.033 0.146
N 218 216 218 216 216 216

40
Table 5
Relative importance of pre-market price and peer firms’ prices in determining IPO offer price
When calculating the P/E ratio, we exclude two issuing firms with negative EPS and one firm with an outlier P/E value. Offer-price P/E is the ratio of the IPO offer price relative to the annual EPS prior to the IPO. Pre-market P/E is the ratio of the closing price on the pre-pricing day on the ESM relative to the annual EPS. Industry-median P/E is the median P/E ratio for firms in the same industry as the issuing firm, where the P/E ratio is based on a peer firm’s closing price on the issuing firm’s pre-pricing day and the peer firm’s annual EPS prior to that day. For each issuing firm, we identify a matching firm that is traded on either TWSE or GTSM, is in the same industry and has the closest asset value. Matching-firm P/E is the ratio of the matching firm’s closing price on the issuing firm’s pre-pricing day relative to the matching firm’s annual EPS prior to that day. t-statistics are adjusted for heteroskedasticity. ***, **, and * denote significance at the 1, 5, and 10 percent level, respectively.
Panel A: Summary statistics
Variables N Mean Median Std. Dev Minimum Maximum
Offer-price P/E 215 18.40 11.70 27.75 1.85 257.14
Pre-market P/E 215 29.53 18.04 45.44 2.51 454.29
Industry-median P/E 215 15.83 15.00 5.41 5.20 29.75
Matching-firm P/E 215 29.76 14.95 49.62 5.36 284.09
Panel B: Offer price P/E as the dependent variable
Model (1) (2) (3) (4) (5)
Variables Coeff. t-value Coeff. t-value Coeff. t-value Coeff. t-value Coeff. t-value
Pre-market P/E 0.58 (15.40)*** 0.59 (15.41) *** 0.58 (15.38)***
Industry-median P/E 0.70 (2.76)*** -0.28 (-1.95) *
Matching-firm P/E -0.012 (-0.59) -0.005 (-0.91)
Intercept 1.16 (1.62) 7.29 (1.66)* 5.38 (2.80) *** 18.77 (8.39) *** 1.31 (1.89)*
R2 0.914 0.019 0.917 0.001 0.914
N 215 215 215 215 215

41
Table 6
Determinants of the price discount
The dependent variable is the percentage Price discount, defined as one minus the ratio of the offer price over the closing price on the pre-pricing day on the ESM. Price inaccuracy is the absolute value of price error, which is the ratio of the pre-IPO price on ESM over the closing price on the first trading day on the TWSE or GTSM, minus one. Volatility is the standard deviation of percentage daily stock returns during the 3 months prior to IPO pricing. VC dummy equals to 1 if the firm is backed by venture capital and zero otherwise. Return on assets is annual earnings relative to assets, in percent. Assets are measured in terms of 2011 purchasing power. Expected price inaccuracy is the predicted value of price inaccuracy from Table 4 except excluding liquidity variables from the logit regression. t-statistics are adjusted for heteroskedasticity. ***, **, and * denote significance at the 1, 5, and 10 percent level, respectively. Model (1) (2) (3) (4) (5) (6) (7)
Variables Coeff. t-value Coeff. t-value Coeff. t-value Coeff. t-value Coeff. t-value Coeff. t-value Coeff. t-value
Price inaccuracy 0.23 (3.04) *** 0.17 (2.20)**
Volatility 3.13 (3.60)*** 2.37 (2.85)***
VC dummy -0.43 (-0.22) -1.35 (-0.72)
Return on assets -0.02 (-0.20) -0.12 (-1.41)
Log(assets) -3.37 (-3.35)*** -3.82 (-3.60)***
Expected price inaccuracy 0.86 (3.13) ***
Intercept 29.58 (19.66) *** 21.87 (7.50)*** 33.27 (22.00) *** 33.25 (22.38)*** 57.73 (7.73)*** 20.53 (5.39) ***
Industry dummies yes
Year dummies yes
R2 0.036 0.110 0.000 0.000 0.049 0.332 0.049
N 218 216 218 218 218 216 216

42
Table 7
Underwriting fees and intended price discount
The FPO subscription ratio is the total demand from the fixed-price offering tranche, relative to the shares sold through that tranche. The percentage FPO fee is 8.5 times the FPO subscription ratio, divided by the offer price, and multiplied by the ratio of 100% over 1,000 shares per lot. The bookbuilding fee is the fee bookbuilding investors pay for each share allocated to them, relative to the offer price, multiplied by 100%. The total investor fee is the weighted average of the FPO fees and the bookbuilding fees, where the weighting variable is the proceeds raised in the two tranches. Intended price discount equals one minus the ratio of the midpoint of the price range over the closing price on the day before bookbuilding starts, multiplied by 100%. Volatility is the standard deviation of percentage daily stock returns during the 3 months prior to IPO pricing. VC dummy equals one if the firm is backed by venture capital and zero otherwise. Return on assets is the percentage annual earnings relative to assets. Assets are measured in terms of 2011 purchasing power. t-statistics are adjusted for heteroskedasticity. ***, **, and * denote significance at the 1, 5, and 10 percent level, respectively.
Panel A: Summary statistics
Variables N Mean Median Std. Dev Min. Max.
FPO subscription ratio 204 89.82 60.87 168.95 0.43 2,300.95
FPO fee (%) 204 1.98 1.37 1.89 0.01 12.58
Bookbuilding fee (%) 218 1.68 0 2.09 0 8.70
Total investor fee (%) 218 1.67 1.20 1.70 0 8.00
Intended price discount (%) 218 32.08 30.48 14.16 -0.81 82.31
Panel B: Regressions. The dependent variable is the percentage total investor fee.
Model (1) (2)
Variables Coeff. t-value Coeff. t-value
Intended price discount 0.04 (5.53)*** 0.03 (3.18)***
Volatility -0.03 (-0.34)
VC dummy 0.44 (2.22)**
Return on assets -0.01 (-2.14)**
Log(assets) -0.21 (-1.62)
Intercept 0.41 (1.78)*
Industry dummies yes
Year dummies yes R
2 0.107 0.424
N 218 216
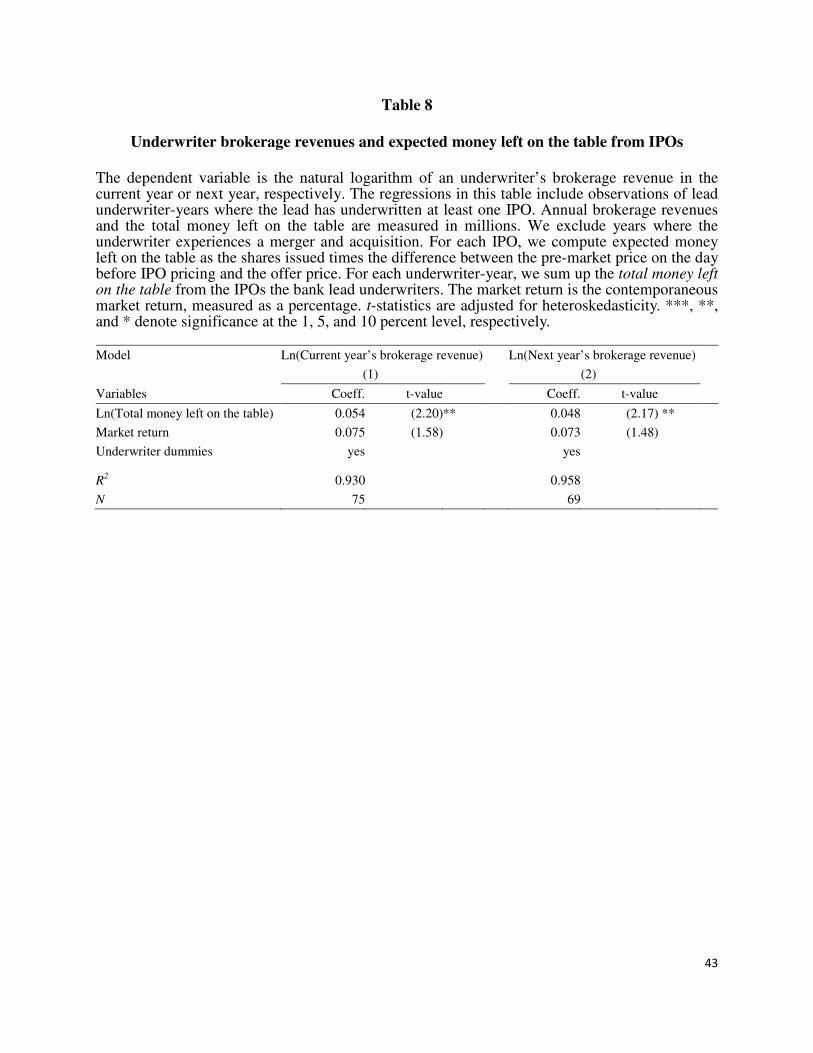
43
Table 8
Underwriter brokerage revenues and expected money left on the table from IPOs
The dependent variable is the natural logarithm of an underwriter’s brokerage revenue in the current year or next year, respectively. The regressions in this table include observations of lead underwriter-years where the lead has underwritten at least one IPO. Annual brokerage revenues and the total money left on the table are measured in millions. We exclude years where the underwriter experiences a merger and acquisition. For each IPO, we compute expected money left on the table as the shares issued times the difference between the pre-market price on the day before IPO pricing and the offer price. For each underwriter-year, we sum up the total money left on the table from the IPOs the bank lead underwriters. The market return is the contemporaneous market return, measured as a percentage. t-statistics are adjusted for heteroskedasticity. ***, **, and * denote significance at the 1, 5, and 10 percent level, respectively.
Model Ln(Current year’s brokerage revenue) Ln(Next year’s brokerage revenue)
(1) (2)
Variables Coeff. t-value Coeff. t-value
Ln(Total money left on the table) 0.054 (2.20)** 0.048 (2.17) **
Market return 0.075 (1.58) 0.073 (1.48)
Underwriter dummies yes yes
R
2 0.930 0.958
N 75 69

44
Table 9
Underwriter impact on underpricing
Panel A reports the mean price discount for subsamples categorized by one of three variables. We categorize an IPO observation as having high underwriter incentive/power to underprice if it has (Column 1) above-median lead percentage, or (Column 2) above-median previous price discount, or (Column 3) an above-median value of issue again. The other IPOs are categorized into low incentive/power subsamples. Panel B estimates regressions with price discount as the dependent variable. Price discount is one minus the ratio of the offer price over the closing price on the pre-pricing day on the ESM, multiplied by 100%. Lead percentage is the percentage of shares sold by the lead underwriter. Previous price discount is the average price discount in the previous three years. Issue again is a dummy variable equal to one if the firm issues any public securities (seasoned equity offerings or corporate bonds) again in the next two years. Assets are measured in terms of 2011 purchasing power. Volatility is the standard deviation of percentage daily stock returns during the 3 months prior to IPO pricing. VC dummy equals one if the firm is backed by venture capital and zero otherwise. Return on assets is the percentage annual earnings relative to assets. t-statistics are adjusted for heteroskedasticity. ***, **, and * denote significance at the 1, 5, and 10 percent level, respectively.
Panel A: Mean percentage price discount by subsamples
Measure of underwriter incentive/power
Lead percentage
(1) Previous price discount
(2) Issue again
(3)
High underwriter incentive/power 35.09
35.42
36.42
Low underwriter incentive/power 30.92
31.34
30.86
Difference 4.17 ** 4.08 ** 5.56***
Panel B: Regression results with the percentage price discount as the dependent variable
Model (1) (2) (3)
Variables Coeff. t-value Coeff. t-value Coeff. t-value
Lead percentage 0.14 (1.82)*
Previous price discount 0.27 (1.98)**
Issue again 4.27 (2.30)**
Ln(assets) -3.27 (-3.06)*** -4.93 (-4.63) -3.69 (-3.57)***
Volatility 2.78 (4.33)*** 2.28 (3.50)*** 2.56 (4.01)
VC dummy -0.82 (-0.42) -1.96 (-1.02) -1.48 (-0.77)
Return on assets -0.12 (-1.45) -0.17 (-1.95)* -0.12 (-1.41)
Industry dummies yes yes yes
Year dummies yes yes yes
R2 0.351 0.352 0.359
N 215 195 215

45
Table 10
Two regulatory regimes
Panel A compares IPO firm characteristics during our sample period (October 2005–February 2011) and the post-sample period (March 2011–December 2014). IPOs during the post-sample period are subject to a rule that the IPO offer price must not be lower than 70% of the average ESM trading price during the 10 days before the bookbuilding announcement is submitted to the Taiwan Securities Association. Panel B compares initial return and price discount of the two regimes. Initial return is the ratio of first trading day closing price over the IPO offer price minus one, multiplied by 100%. Price discount is one minus the ratio of the offer price over the closing price on the pre-pricing day on the ESM, multiplied by 100%. We use t-test for differences in means, and Wilcoxon-Mann-Whitney test for differences in medians. REG dummy equals to one if the observation is from the post-sample period, and zero otherwise. t-statistics are adjusted for heteroskedasticity. ***, **, and * denote significance at the 1, 5, and 10 percent level, respectively.
Panel A: IPO firm characteristics in two regulatory regimes
Sample period Post-sample period Difference
N Mean Median N Mean Median Mean Median
Firm Age (years) 218 13.87 11.26 172 16.15 13.46 -2.28 ** -2.20 ***
Assets (millions of NT$) 218 2932.63 1261.53 172 5774.67 1278.19-2842.04 -16.66
Annual revenues (millions of NT$) 218 2845.89 1126.74 172 3053.62 1082.34 -207.73 44.40
Debt ratio (%) 218 36.19 35.03 172 38.92 37.86 -2.73 -2.84
Return on Assets (%) 218 14.31 11.96 172 8.67 8.92 5.64 *** 3.04 ***
% of firms with VC backing 218 56.42 100.00 172 58.14 100.00 -1.72
0.00
Panel B: Comparison of underpricing in two regulatory regimes
Sample period
(200510-201102)Post-sample period (201103-201412)
Difference
N Mean Median N Mean Median Mean Median
Initial return (%) 218 55.32 36.74 172 26.79 22.52 28.53 *** 14.22 ***
Price discount (%) 218 33.03 31.42 172 23.01 21.88 10.02 *** 9.55 ***