pre-feasibility study for geothermal power development projects in
TRANSCRIPT
Pre-Feasibility Study for Geothermal Power Development Projects in Scattered Islands of
East Indonesia
STUDY REPORT
March 2008
Engineering and Consulting Firms Association, Japan


(
(
(
(
(
(
(
(
(
(
(
(
(
(
Padangsidempuan
Langsa
Tebingtinggi
Kotabumi
Tanjungredep
Balikpapan
Pare Pare
Sorong Biak
Merauke
Wamena
Darwin
Lahat
Sungaipenuh
PayakumbuhManokwari
Timika
Medan
Banda Aceh
Padang
Pekanbaru
JambiPangkalpinang
Palembang
Bandar Lampung
Semarang
Denpasar
Matara
m
Kupang
Ujungpandang
Kendari
Manado
Palangkaraya
SamarindaPaluPontianak
Ambon
Jayapura
Yogyakarta
Bengkulu
Su
rabaya
Banjarmasin
BanddungSerang
Gorontalo
Ternate
Kuala Lumpur
Bangkok
Phnom Penh
Manila
Dili
Bandar Seri Begawan
Jakarta
I N D I A N O C E A N
S O U T H C H I N A
S E A
J A V A S E A
AN
DA
MA
N S
EA
Gulf of Thailand
Strait of Malacca
B A N D A S E A
T I M O R S E A
ARAFURA SEA
Gulf of
Carpentaria
C E R A M S E A
MO
LU
CC
A
S E
A
C E L E B E S
S E A
S U L U S E A
Mak
assa
r
Str
ait
Selat SundaBALI SEA
S AV U S E A
Selat Madura
Teluk Bone
Teluk Tomini
Teluk Cenderawasih
P A C I F I C O C E A N
SelatKartimata
1
2
57
9
10
11
1230
14
1513
16
1718
20 21
22
23
25
24
26
27
28
29
19
6
3
48
Sulawesi(Celebes)
Java
Sumatra
Sumba
Sumbawa Flores
Wetar
Timor
CeramBa
li
Lombo
k
K a l i m a n t a n
Borneo
New Guinea
Halmahera
Bangka
Billiton
Madura
Nias
Simeulue
Natuna Besar
Siberut
Dolak
KepulauanAru
Kepulauan Tanimbar
Alor
Buton
Muna
Peleng
KepulauanSula
Yapen
Morotai
Kepulauan Talaud
Sangihe
Biak
Obi
Waigeo
Misool
Buru
RotiSawu
Cartier I.
Ashmore Is.
Christmas I.
Bacan
G r e a t e r
S u n d a I s l a n d s
Mo
lu
cc
as
L e s s e r S u n d a I s l a n d s
Pagai SelatanPagai UtaraSipura
Enggano
KepulauanLingga
KepulauanRiau
Laut
KangeanSelajar
Babar
Salawati
SINGAPORE
MALAYSIA
MALAYSIA
VIET NAM
CAMBODIA PHILIPPINES
THAILANDLAOP.D.R.
AUSTRALIA
PAP
UA
NE
W G
UIN
EA
BRUNEI DARUSSALAM
TIMOR-LESTE
(AUSTRALIA)
(AUSTRALIA)
(AUSTRALIA)
Map No. 4110 Rev. 4� UNITED NATIONSJanuary 2004
Department of Peacekeeping OperationsCartographic Section
INDONESIA
INDONESIA
The boundaries and names shown and the designations used on this map do not imply official endorsement or acceptance by the United Nations.
National capital
Provincial capital
Town, village
International boundary
Provincial boundary
Main road
Secondary road
Railroad
Major airport
Equator
16.17.18.19.20.21.22.23.24.25.26.27.28.29.30.
KALIMANTAN TIMURLAMPUNG MALUKUMALUKU UTARANUSA TENGGARA BARATNUSA TENGGARA TIMURRIAUSULAWESI SELATANSULAWESI TENGAHSULAWESI TENGGARASULAWESI UTARASUMATERA BARATSUMATERA SELATANSUMATERA UTARAYOGYAKARTA
PROVINCES OF INDONESIA
1.2.3.4.5.6.7.8.9.
10.11.12.13.14.15.
ACEHBALIBANGKA-BELITUNGBANTENBENGKULUGORONTALOIRIAN JAYAJAKARTAJAMBIJAWA BARATJAWA TENGAHJAWA TIMURKALIMANTAN BARATKALIMANTAN SELATANKALIMANTAN TENGAH
0 250 500 750 km
0 250 500 mi
10°
0°
10°
0°
10°
110° 120°
100° 110° 140° 130° 120°
Map of Indonesia (source: United Nations)


Table of Contents
Executive Summary
CHAPTER 1 INTRODUCTION ............................................................................................... 1
1.1 OUTLINE OF STUDY ............................................................................................................. 1 1.2 BACKGROUND ..................................................................................................................... 2 1.3 OBJECTIVES ......................................................................................................................... 4 1.4 SCOPE OF WORK.................................................................................................................. 4 1.5 STUDY AREA........................................................................................................................ 4 1.6 FUTURE INITIATIVE.............................................................................................................. 4 1.7 STUDY TEAM ....................................................................................................................... 5 1.8 STUDY SCHEDULE................................................................................................................ 5
CHAPTER 2 NECESSITY OF GEOTHERMAL DEVELOPMENT IN THE EASTERN PROVINCES ............................................................................................................................... 7
2.1 BACKGROUND OF GEOTHERMAL POWER DEVELOPMENT IN INDONESIA............................ 7 2.2 SIGNIFICANCE OF GEOTHERMAL ENERGY DEVELOPMENT ................................................. 7 2.3 CURRENT STATE OF GEOTHERMAL ENERGY DEVELOPMENT IN INDONESIA ....................... 8 2.4 METHODOLOGY TO PROMOTE GEOTHERMAL ENERGY DEVELOPMENT IN THE EASTERN PROVINCES ................................................................................................................................ 8 2.5 SOCIAL SITUATION OF THE EASTERN PROVINCES ............................................................... 9 2.6 ELECTRICITY SUPPLY AND DEMAND SITUATION IN THE EASTERN PROVINCES ................ 11 2.7 NECESSITY OF GEOTHERMAL ENERGY DEVELOPMENT IN THE EASTERN PROVINCES ...... 12 2.8 SMALL SCALE POWER GENERATION DEVELOPMENT OF OTHER ENERGY SOURCES......... 13
CHAPTER 3 GEOTHERMAL RESOURCES IN EASTERN INDONESIA...................... 54
3.1 OVERVIEW OF GEOTHERMAL RESOURCES IN EASTERN INDONESIA.................................. 54 3.2 PRESENT EXPLORATION STATUS IN EASTERN INDONESIA................................................. 54 3.3 NECESSARY STUDY FOR FUTURE GEOTHERMAL RESOURCE DEVELOPMENT ................... 56 3.4 GEOTHERMAL RESOURCES IN EACH FIELDS ..................................................................... 62
CHAPTER 4 ENVIRONMENTAL AND SOCIAL ASPECT ............................................... 84
4.1 ENVIRONMENTAL ASSESSMENT SYSTEM........................................................................... 84 4.2 LEGISLATION, STANDARDS AND REGULATIONS RELATING TO THE ENVIRONMENT (GEOTHERMAL DEVELOPMENT RELATED) .............................................................................. 85
CHAPTER 5 IMPLEMENTATION PLAN............................................................................ 95
5.1 PROJECT COMPOSITION ..................................................................................................... 95 5.2 CONSULTANT SERVICE..................................................................................................... 106 5.3 PROJECT IMPLEMENTATION ORGANIZATION ................................................................... 106 5.4 DEVELOPMENT SCHEDULE .............................................................................................. 109 5.5 OPERATION AND MAINTENANCE ..................................................................................... 110 5.6 PROJECT COST ESTIMATE ................................................................................................ 110

5.7 FINANCIAL ARRANGEMENT PLAN ....................................................................................111
CHAPTER 6 ECONOMIC ASSESSMENT ......................................................................... 112
6.1 ECONOMIC EVALUATION ................................................................................................. 112 6.2 FINANCIAL EVALUATION ................................................................................................. 117
CHAPTER 7 PREPARATION OF GEOTHERMAL POWER DEVELOPMENT PROJECT ................................................................................................................................ 123
7.1 NECESSITY OF PREPARATION STUDY............................................................................... 123 7.2 SUPPLEMENTARY STUDY AND PROJECT PLANNING......................................................... 124
CHAPTER 8 PROJECT POTENTIAL FOR CDM............................................................. 126
8.1 CO2 EMISSION BY POWER SOURCE.................................................................................. 126 8.2 CDM INSTITUTION IN INDONESIA ................................................................................... 126 8.3 GEOTHERMAL PROJECT ................................................................................................... 127 8.4 EFFECTS OF ENVIRONMENTAL IMPROVEMENT................................................................ 128 8.5 SMALL SCALE GEOTHERMAL POWER DEVELOPMENT AS SMALL SCALE CDM................ 130 8.6 CDM PROJECT IN A ODA PROJECT .................................................................................. 131

List of Figure
Fig. 2-1 Geothermal Development Road Map .................................................................... 19 Fig. 2-2 Electricity Demand and Supply Situation in Eastern Provinces (2006)................. 44 Fig. 2-3 Electricity Sales in Eastern Provinces (2006) ........................................................ 44 Fig. 2-4 Electrification Ratio in Eastern Provinces (2006).................................................. 45 Fig. 2-5 Electricity Demand Outlook in Eastern Provinces................................................. 47 Fig. 2-6 Installed Capacity of PLN (2006) .......................................................................... 48 Fig. 2-7 Comparison of Power Plant Mix between Whole Nation and Eastern Provinces
(2006) .......................................................................................................................... 49 Fig. 2-8 Increase of Diesel Generation Cost and Diesel Fuel Price .................................... 50 Fig. 2-9 Generation Cost by Energy Type (2006)................................................................ 50 Fig. 2-10 International Oil Price.......................................................................................... 51 Fig. 2-11 Concept of Best Energy Mix in Eastern Provinces .............................................. 53 Fig. 3-1 Map of Geothermal Area in West Nusa Tenggara (DGMCG, 2005)...................... 57 Fig. 3-2 Map of Geothermal Area in West East Nusa Tenggara (DGMCG, 2005).............. 57 Fig. 3-3 Map of Geothermal Area in North Maluku (DGMCG, 2005)................................ 58 Fig. 3-4 Map of Geothermal Area in Maluku (DGMCG, 2005) .......................................... 58 Fig. 3-5 Map Showing the Resource Potential in Promising Geothermal Fields (JICA,
2007)............................................................................................................................ 59 Fig. 3-6 Geothermal area of Hu’u Daha (after J. Brotheridge et al., 2000)......................... 64 Fig. 3-7 Geological map in Wai Sano (after JICA, 2007) ................................................... 66 Fig. 3-8 Resistivity survey result in Wai Sano (after JICA, 2007) ...................................... 67 Fig. 3-9 Hydrothermal mineral zonation in Ulumbu (revised Kasbani, et al., 1997) .......... 70 Fig. 3-10 Compiled map of geothermal activity in the Nage and Wolo Bobo areas (JICA,
2007)............................................................................................................................ 73 Fig. 3-12 Location of exploratory wells in Mataloko (Muraoka et al., 2005) ..................... 74 Fig. 3-13 Photograph of the flow twist of NEDO MT-2 well (Muraoka et al., 2005) ......... 74 Fig. 3-14 Prospect Area in Sokoria Mutubusa (J. Brotheridge et al., 2000)........................ 76 Fig. 3-15 Geological map in Tulehu (JICA, 2007).............................................................. 80 Fig. 3-16 Prospect Area in Tulehu (JICA, 2007) ................................................................. 81 Fig. 3-17 Geothermal model in Jailolo (after VSI).............................................................. 83 Fig. 4-1 Geographical relation between prospects and the conservation forest in Huu Daha
and Wai Sano............................................................................................................... 92 Fig. 4-2 Geographical relation between prospects and the conservation forest in Ulumbu
and Bena-Mataloko...................................................................................................... 92 Fig. 4-3 Geographical relation between prospects and the conservation forest in
Sokoria-Mutubusa and Oka-Larantuka........................................................................ 93 Fig. 4-4 Geographical relation between prospects and the conservation forest in Ili
Labaleken and Atadei .................................................................................................. 93 Fig. 4-5 Geographical relation between prospects and the conservation forest in Tonga
Wayana and Tulehu ..................................................................................................... 94 Fig. 4-6 Geographical relation between prospects and the conservation forest in Jailolo... 94 Fig. 5-1 Development Flowchart......................................................................................... 96 Fig. 5-2 Photographs of Suginoi Hotel flash steam unit.................................................... 102 Fig. 5-3 Layout of Back Pressure Turbine Generator Set (5.5 MW)................................. 105
Fig. 5-4 Typical Schemes of Geothermal Power Development in Indonesia .................... 107 Fig. 5-5 Project Organization ............................................................................................ 108 Fig. 5-6 Project Schedule (Tentative) ................................................................................ 109 Fig. 6-1 EIRR Sensitivity to Capacity Factor .................................................................... 115 Fig. 6-2 EIRR Sensitivity to Project Cost.......................................................................... 115 Fig. 6-3 EIRR Sensitivity to Fuel Cost.............................................................................. 116 Fig. 6-4 FIRR Sensitivity to Capacity Factor .................................................................... 119 Fig. 6-5 FIRR Sensitivity to Project Cost .......................................................................... 119 Fig. 6-6 FIRR Sensitivity to Tariff Rate ............................................................................ 120 Fig. 6-7 Accumulate Balance of cash flow........................................................................ 122 Fig. 8-1 CO2 Emission by Power Source........................................................................... 126 Fig. 8-2 Project Screening Process by DNA ..................................................................... 127 Fig. 8-3 CER’s Price.......................................................................................................... 129 Fig. 8-4 CO2 Emission by Steam Production .................................................................... 131

List of Table
Table 1-1 Study Team Members ............................................................................................ 5 Table 1-2 Schedule of First Trip in Indonesia ....................................................................... 6 Table 1-3 Schedule of Second Trip in Indonesia................................................................... 6 Table 2-1 Geothermal Power Plant in Indonesia and its Development Scheme.................. 15 Table 2-2 National Energy Policy........................................................................................ 16 Table 2-3 Presidential Decree on “National Energy Policy” ............................................... 17 Table 2-4 Geothermal Energy Law...................................................................................... 18 Table 2-5 Outline of Eastern Provinces ............................................................................... 20 Table 2-6 Electricity Demand and Supply Situation in Eastern Provinces (2006) .............. 21 Table 2-7 Diesel Power Plants in Maluku and North Maluku ............................................. 22 Table 2-8 Diesel Power Plants in Nusa Tenggara................................................................ 34 Table 2-9 Diesel Power Plants in Flores Island ................................................................... 39 Table 2-10 Electricity Demand Outlook in Eastern Provinces ............................................ 46 Table 2-11 Estimation of Geothermal Development Effect in Eastern Provinces............... 52 Table 3-1 Geothermal Resource Potential (MW) in Eastern Indonesia............................... 60 Table 3-2 Present Status of geothermal resource development in Eastern Indonesia.......... 61 Table 4-1 Environment Quality Standards for Air Pollution ............................................... 86 Table 4-2 Gas Exhaust Standard (Stationary Source).......................................................... 86 Table 4-3 Environmental Quality Standard for Water (Drinking Water Usage) .................. 86 Table 4-4 Quality Standards of Liquid Waste...................................................................... 87 Table 4-5 Standards of Noise Level..................................................................................... 87 Table 4-6 Standards of Noise Level at Source..................................................................... 88 Table 4-7 Classification of Forest Area ............................................................................... 91 Table 5-1 Contents of Project Cost .................................................................................... 110 Table 5-2 Terms and Conditions of Loans..........................................................................111 Table 6-1 Economic Internal Rate of Return ..................................................................... 116 Table 6-2 Financial Internal Rate of Return ...................................................................... 120 Table 6-3 Repayment Schedule for Power Plant Project ................................................... 121 Table 6-4 Cash Flow Statement ......................................................................................... 121

Abbreviations
AMDAL : Analysis Mengenai Dampak Lingkungan
BAPPENAS : National Development Planning Agency
BPPT : Baden Pengkajian dan Penerapan Teknologi
CDM : Clean Development Mechanism
CER : Certified Emission Reduction
CGR : Center for Geological Resources
CO2 : Carbon dioxide
DGEEU : Directorate General of Electricity & Energy Utilization
DGMCG : Directorate General of Mineral, Coal and Geothermal
EIA : Environmental Impact Assessment
EIRR : Economic Internal Rate of Return
ESC : Energy Sales Contract
FIRR : Financial Internal Rate of Return
FS : Feasibility Study
GA : Geological Agency
GDP : Gross Domestic Product
IEE : Initial Environmental Evaluation
IRR : Internal Rate of Return
IUP : Geothermal Energy Business Permit
JBIC : Japan Bank International Cooperation
JICA : Japan International Cooperation Agency
K-Ar : Potassium-Argon
LA : Loan Agreement
MEMR : Ministry of Energy and Mineral Resources
MT : Magneto-Telluric
NCG : Non Condensable Gas
NEDO : New Energy and Industrial technology Development Organization
O&M : Operation & Maintenance
ODA : Official Development Assistance
OJT : On-the Job-Training
PDD : Project Design Document

PERTAMINA : PT. PERTAMINA (Persero)
PIN : Project Information Note
PGE : PT. PETRAMINA Geothermal Energy
PLN : PT. Perusahaan Listrik Negara (Persero)
RUKN : Rencana Umum Ketenagalistrikan Nasional
RUPTL : Rencana Usaha Penyediaan Tenaga Listrik
TDEM : Time Domain Electro Magnetic
TOE : Ton of Oil Equivalent
VAT : Value Added Tax
WACC : Weighted Average Cost of Capital

i
Executive Summary
1. Objectives
The purpose of the study is to survey geothermal resources and formulate a practical development plan making best use of the resource for substitution of geothermal power generation with existing and planned diesel powers in West Nusa Tengara, East Nusa Tengara, Maluku and North Maluku Provinces. The study and planning were carried out in consideration of application for Japanese Yen Loan in the next Japanese fiscal year.
2. Necessity of Geothermal Power Development in Eastern Provinces
Background of Geothermal Power Development in Indonesia
Indonesia suffered the largest impact among ASEAN countries in the Asian economic crisis in 1997. However, the Indonesian economy has shown a great improvement after the crisis due to the results of various policy reforms and supported by the inflow of investment from foreign and domestic sources. Thus, the Indonesian economy is expanding steadily, and the electric power demand is also increasing rapidly. The peak power demand of the whole country reached 20,354 MW in 2006 and showed the 5.1% increase from the previous year. The amount of energy demand in 2006 also records 113,222GWh, the 5.1% increase from the pervious year. The National Electricity Development Plan 2005 (RUKN 2005) estimates that the peak power demand of the country will increase at the average annual rate of 7.5% and will reach 79,900 MW in 2025. It also estimates that the energy demand will increase at almost same rate and will reach 450,000 GWh in 2025. In order to secure stable energy supply, the development of power plants which meets these demand is one of the urgent issues of the Indonesian power sector. Since the demand in the Java-Bali system accounts for 77.2%of the total country, the power plant development in this system is most important. But the power development in other system is also very crucial because the power demand will increase rapidly due to the expansion of the rural electrification and rural economy.
Another urgent issue that the Indonesian power sector faces is the diversification of energy sources. In the light of high oil price, it is necessary to reduce oil dependency in energy source in order to reduce generation cost and to secure stable energy supply. For this purpose, Indonesian government worked out "National Energy Policy (NEP)" in 2002, and set the target of supplying 5% or more of the primary energy by renewable energy by 2020. To achieve this target, the government put the important role on geothermal energy which exists affluently in the country.
Indonesian Government’s Intention on Geothermal Power Development
The utilization of geothermal energy has already a long history and more than 8,000 MW capacity of geothermal energy has been exploited in the world. Notwithstanding one form of natural energy, geothermal energy production is extremely steady with less fluctuation caused by weather or by seasonal condition. The geothermal energy can be used for social development

ii
in rural areas by introducing multipurpose utilization. The development of geothermal energy has a great significance for the national economy and the people’s life in Indonesia. Moreover, since geothermal energy is global-environmentally friendly, the geothermal development can contribute to world community for preventing global warming by reduction of carbon dioxide gas emission.
It is said that Indonesia has the world-biggest geothermal energy potential, which was estimated as more than 27,000 MW and is though to account for more than 40% of world total potential. Therefore, the development of geothermal power has been strongly expected in order to supply energy to the increasing power demand and to diversify energy sources. Today, geothermal power plants exist in seven fields in Indonesia, and the total capacity reaches 857 MW. However, although this capacity is the forth largest in the country-ranking in the world, Indonesia has not fully utilized this huge geothermal potential yet.
Having been urged by such situation, the Indonesian Government decided to promote geothermal energy development. The Government worked out "National Energy Policy” (NEP) in 2002, and set a target of supplying 5% or more of the primary energy by renewable energy by 2020. In addition, the Government enacted "Geothermal Energy Law" in 2003 to promote the participation of private sector in geothermal power business. Moreover, Ministry of Energy and Mineral Resources (MEMR) worked out "Road Map Development Planning of Geothermal Energy" (Road Map) to materialize the National Energy Policy in 2004. In this Road Map, a high development target of 6,000 MW by 2020 and 9,500 MW by 2025 is set. Thus, a basic framework for geothermal energy development has been formulated and the Government has started its efforts to attain these development targets.
In September 2007, Japan International Cooperation Agency (JICA) has submitted the final report on "Mater Plan Study for Geothermal Power Development in the Republic of Indonesia”, which aimed to study the concrete strategy to attain Road Map of Geothermal Development.
This study has evaluated 73 of promising geothermal fields in Indonesia and makes the following proposals; (i) the economic incentives such as the ODA finance for Pertamina and the increase of purchase price for private investors are necessary to promote the Rank A fields (the most promising fields), (ii) the preliminary survey by the geothermal promotion survey which includes test drilling by the government is necessary to promote private investors participation in the Rank B and the Rank C fields (the promising fields without test drilling holes), and (iii) The governmental development activities are indispensable to promote small geothermal energy resources in remote islands in the eastern regions since private investors are unlikely to promote these small geothermal resources in these regions.
As for how to promote geothermal fields in remote eastern islands, the report proposed the following way;
“Basic Strategy for Geothermal Field Development in Remote Islands;
In remote islands geothermal power plant is the most economic advantageous power source, because other power plants can not utilize the scale-merit in construction cost.

iii
Therefore, geothermal development in such small systems should be positively promoted in order to decrease the fuel cost of diesel power plants. However, in such remote islands, the development by private developers cannot be expected because the project scale is too small for business scale. Therefore, the Government should play the central role of developing geothermal energy fields in remote islands. In such fields, as the development scale is small, there is a possibility of converting succeeded exploration wells into production wells. Therefore, the construction of a small power plant by PT. PLN or by local government company may be easy if the government succeeds to drilling steam wells in the survey and transfers the wells to the power plant operator. The governmental survey and development are highly expected in remote islands. “
The main purpose of this study is, based on the above-mentioned proposal, to formulate a project, which promotes geothermal energy development in the eastern provinces in Indonesia by the Indonesian Government. The possibility to utilize Yen Loan for the project finance was investigated in this study.
In Geothermal Master Plan, development of power plants of 186 MW in total in the eastern provinces was planned based on the existing resource data. In a general way, power output and development program in each geothermal field should be decided after resource data collection by preliminary resource studies described later. However, since urgent commencement of geothermal power development in the eastern provinces is considered to be necessary and pilot project of geothermal power development should be started as soon as possible, because of inflationary cost rise of fossil fuel for the diesel power generation and long term development of geothermal power plants of 186 MW until 2025, several fields developments, which include geothermal fields where geothermal resources were confirmed by the studies or an urgent need of substitution by geothermal power exists, were decided to be developed using ODA Yen Loan. Considering commencement of operation of geothermal power plants by 2016, the support by ODA Yen Loan is considered to be sufficient for construction of 35 MW geothermal power plants as pilot projects.
General Status of Eastern Indonesia
The surveyed area in this study is the eastern part of Indonesia, which consists of small islands. Particularly, the Maluku province, the North Maluku province, the West Nusa Tenggara province, and the East Nusa Tenggara province are target islands for this project. The total area of these four provinces is 153,157 km2, and accounts for 8.2% of the whole Indonesian land. The total population of these four provinces was 10,639,000 according to the national population estimation for 2005, and it accounts for 4.9% of the entire Indonesian population. The regional Gross Domestic Production (GDP) of these four provinces totals 41,949 billion Rupiah (Rp) in 2004, and accounts for 1.8% of the whole Indonesia.
Present Status of Power Sector and Economy of Power Generation in Eastern Indonesia
The total maximum electric power demand in these four eastern provinces in 2006 was 270 MW, and it accounts for 1.3% of total Indonesia. To supply electric power to this demand, there is 469 MW installed generation capacity in the area. The generated energy in this area in 2006 was

iv
1,273 GWh, and it accounts for 1.2% of the whole country. The electrification ratio of each province is; 51.6% in Maluku and North Maluku provinces, 28.8% in the West Nusa Tenggara province, and 21.8% in the East Nusa Tenggara province. The electrification ratio in this area is considerably low compared with the national average. It is estimated that the electricity demand in these provinces will increase at an annual average of 7.4% and maximum electric power will reach 1,065 MW in 2025. Given that a reserve margin is expected to be 30-40%, it is expected that the necessary capacity of electric power facilities will reach 1,491 MW in 2025.
The energy source mix of entire nation is well diversified. However, the eastern provinces completely rely on diesel power generation only. This is because the electric system in this area is small-scale due to isolated islands. However, the diesel power generation becomes extremely expensive under the current international oil price hike. The price of diesel fuel (HSD) was predicted to become 0.62 US$/litter in 2006 from 0.07 US$/litter in 2000, showing the expansion of as much as some 9 times more. As a result, the generation cost of diesel power plant of PT. PLN was predicted to become approximately 17.6 cents US$/kWh in 2006, making diesel power generation the most expensive one as well as gas turbine generation. In contrast, the generation cost of geothermal power plant in 2006 was 6.3 cents US$/kWh. The diesel generation cost was 2.8 times higher than that of geothermal power generation and there was the cost deference of 11.5 cents US$/kWh between both the costs.
The international oil price was 66 US$/barrel in 2006, and it has been continuously increasing afterwards and has exceeded 110 US$/barrel in 2008. Due to this oil price increase, the price of diesel oil is also rising continuously. The price of diesel oil for industrial use in the eastern provinces which PT. PERTAMINA announced on March 1, 2008 becomes 0.936 US$/litter. Based on this new diesel oil price, the fuel cost of diesel generation in the eastern provinces is estimated as high as approximately 26 cents US$//kWh. This high fuel cost is a great heavy burden on the financial foundation of PT. PLN . The volume of diesel oil used in the eastern provinces was about 347,000 kilo litter in 2006. The cost of this diesel fuel is estimated as much as 325 million US$ based on the current diesel oil price (0.936 US$/litter). Therefore, if the base-load demand is supplied by geothermal power plant instead of diesel power plant, about 214,000 kilo litter of diesel fuel, which accounts for about 62% of total fuel consumption, can be saved in one year. The value of this fuel saving is about 200 million US$ based on the current diesel oil price. There is a great justification to promote geothermal energy development to substitute diesel power plant in the eastern provinces.
There is no doubt that the geothermal power development in the eastern provinces as substitutes of diesel power contributes to inhabitation of financial deterioration of the Government and PT. PLN .
Prevention of Global Warming
Geothermal power development is generally expected as effective countermeasure against the global warming for conservation of global scale environment due to carbon dioxide gas emission of very low content from the power plants. Indonesia has a plenty of untapped geothermal-resources and remarkable reduction effect of the CO2 emission even in the eastern provinces can be expected, if the geothermal power is used as alterative energy of fossil fuel.

v
Most of all geothermal power developments in the eastern provinces must be regarded as the excellent CDM project. Carbon credits produced from these geothermal projects are necessary for not only developed country and Indonesia but also countries of the world for preventing the global warming.
3. Geothermal Resources in Eastern Indonesia
Indonesia is blessed with abundant geothermal resources. The 253 geothermal areas were identified in Indonesia. The total potential was estimated as approximately 27,791 MW (DGMCG, 2005). In the eastern provinces (Nusa Tenggara and Maluku provinces), 37 geothermal fields were identified by DGMCG (2005), which total potential was estimated as 1,914 MW.
Only two fields in the eastern province, Ulumbu and Mataloko have been studied by well-drilling to confirm reservoir conditions. Promising geothermal resources were confirmed by well discharges from high temperature reservoir. The other fields have been investigated at various levels commensurate with the development perspectives of each field. In 9 fields, Huu Daha, Wai Sano, Ulumbu, Bena-Mataloko, Sokoria-Mutubusa, Oka-Larantuka, Atadei, Tulehu and Jailolo, geothermal resource potentials had been evaluated by JICA (2007) based on some geoscientific data of reconnaissance studies or detail study data, and the data and the study results in these fields were reviewed in this study. Electricity of 110MW was planned to be generated by geothermal development of these 9 fields in the Master Plan study and 20 MW geothermal power development was recommended in the feasibility study of geothermal development in Flores. Except of 9 fields as listed above, exploration statuses are not clarified because available geoscientific data in these fields could not be obtained in this study.
Except for Ulumbu and Mataloko, the present status of geothermal resources development is reconnaissance study level. These data allow estimating probable prospect area and probable heat source, and also allow establishing the sequence and geoscientific methods to use in the next stages of development. However, the data and information of geology, geochemistry and geophysics in the fields are not enough to make geothermal reservoir model and to evaluate generation power capacity of their fields. Therefore, geoscientific studies for clarification of characteristics and structure of the geothermal resources should be conducted as resource feasibility study in the fields in the eastern provinces except for Ulumbu and Mataloko. After the geoscientific surface study, exploratory well drilling and well test should be conducted to confirm geothermal resource existence and to evaluate its capacity.
The current practical plans for geothermal development/expansion projects were confirmed through interviews during a mission trip to Indonesia. In the two fields of Ulumbu and Mataloko, small-scale power developments have been planned by PT. PLN . In addition, PT. PLN has actual plan of resource development in Hu’u Daha, Jailolo, Tolehu and Sembaiun. Development priority of these fields is regarded to be high, because resource existence in some of fields were confirmed and development risk at initial stage must be relatively low.

vi
4. Necessary Assessment and Current Information of Environmental Aspect
Necessary environmental study for construction of power plants and present status in and around the promising fields in the eastern provinces were checked in this study, for considering the feasibility of the geothermal power development projects.
Regarding environmental regulations on geothermal power projects, environmental condition and impact in the objected area of the geothermal power project, whose capacity is more than 55MW, should be checked by application of Environmental Impact Assessment (AMDAL). The AMDAL in specific geothermal power projects in and around legally protected areas should be prepared, even if their development capacity is less than 55MW. In case that AMDAL is not nessesary, Environmental Management Effort (UKL) and Environmental Monitoring Effort (UPL) should be submitted according to the requirement of the ministry decree No. 86/2002.
Geothermal power development activity can be conducted in the forest restricts in special circumstances. Government Regulation No.2/2008 approves geothermal power development activity in protection forest and production forest in exchange for tariff or government income on using forest area. Geothermal power development activity in kinds of the conservation forest is not allowed according to government regulation No.41/1999. The project implementation body should pay attention about the location of prospect which may be included in conservation forest.
There are 37 geothermal prospects in the eastern province according to the data of Geological Agency of MEMR. 11 of 37 prospects were checked the geographical relation between prospects and the conservation forest. There are no serious environmental problems to precede the projects in the objected areas at present. However more detailed information on environment should be collected before starting the project. The forest condition of the other 26 prospects should be confirmed when the project areas are selected.
5. Implementation Plan
Since urgent commencement of geothermal power development in the eastern Indonesia is considered to be necessary and pilot project of geothermal power development should be started as soon as possible, because of inflationary cost rise of fossil fuel for the diesel power generation, small scale geothermal power plant of 35MW in total is proposed to MEMR as appropriate project scale and period. Considering commencement of operation of geothermal power plants as soon as possible, the support by ODA Yen Loan is considered to be sufficient for construction of 35 MW geothermal power plants as pilot projects. Based on the discussion among the MEMR, Ministry of Finance(MOF) and National Development Planning Agency(BAPPENAS), the procedure for registration of Blue Book will be started by MEMR as a project of PT. PLN .
Project Preparation
Based on information such as location of diesel power plant and transmission/ distribution line,

vii
consumer power demand, potential and characteristics, promising areas of geothermal power development will be selected for diesel power substitution and the detailed project program of each field development will be prepared. For deciding detailed description and program of the project, this work should be preferably conducted before starting the project by preliminary surface studies. These studied should be entrusted to consulting firm of geothermal development. However, if possible, these studies are desired to be conducted as preparation study by support from Japan, as described later.
Resource Development for Securing Geothermal Steam
Surface resource survey such as geology, geochemistry and geophysics will be carried out at selected geothermal prospects for the purpose of confirmation of resource existence, delineation of the geothermal reservoirs and decision of exploration drilling targets. Necessary resource studies should be conducted in the project for securing geothermal steam.
After conducting the necessary surface resource studies, data collected from these studies will be summarized using the database software. An Integrated analysis will be carried out using the database for preparing the geothermal conceptual model. Since special technologies and experiences are necessary for these studies and the studies for securing steam are the most important in the geothermal power development, these studies should be entrusted to consulting firm of geothermal development.
Based on the results of surface survey, twenty-eight exploratory wells will be drilled at 10- 14 prospects in the eastern Indonesia. The wells, which will be succeeded in steam production, will be used as production wells. Moreover, seven reinjection wells will be drilled and wastewater will be injected under the ground through these wells. Well drilling will be undertaken by drilling company (or the government institute; Center for Geological resources, Geological Agency). In case of employment of private drilling company, the company will be selected through international bidding. Some material and equipment for drilling will need to be procured through international bidding. Highly capable drilling supervisors should be hired for smooth drilling works. Usually geothermal consultant firm can dispatch such supervisors.
After well drilling and test, all geoscientific data will be consolidated into a conceptual model, and the evaluation of the geothermal potential will be conducted through the application of numerical modeling techniques using this conceptual model (reservoir simulation). This study should be entrusted to geothermal consulting firm, the reservoir simulation for getting reasonable results on resource output capacity requires state of the art.
Geothermal Power Plant Construction
Based on the results of the geothermal resource evaluation carried out before plant construction stage, the optimum development plan of available power output will be formulated. The design of geothermal power plants will be conducted on the basis of characteristics of geothermal fluid and development plan. The detailed planning and power plant design should be entrusted to experienced geothermal-consulting firm.

viii
Small scale power plants of 35MW in total will be constructed after the resource survey and the well drilling. If adequate power output of each plant is estimated 5MW in the project preparation study, 7 power stations will be constructed at least.
In order to shorten the construction period, the power plant will be constructed on "single package full-turnkey" basis in which a sole contractor will undertake engineering, procurements, supply, installation, test and commissioning. The contractor will be selected through international bidding.
The transmission line and substation system will include transmission line from main transformer to a substation, circuit breakers, disconnecting switches, bus, CT, VT, arrestor, supporting structure, insulators, protective relay board and ancillaries.
Substitution of diesel power by geothermal power is very auspicious as the CDM project. The effect of GHG (Green House Gas) emission reduction is 0.8(t-CO2/MWh) in case of the generation capacity bigger than 200kW. Based on the results of geothermal reservoir simulation and conceptual design of geothermal power plant, the GHG emission reduction by this project will be estimated and the procedure for registration of CDM project will be started.
Since geothermal power development from geothermal resource development to power plant construction requires special technologies, the project executing agency, PT. PLN , will employ a consulting firm that has sufficient experience in all the stages for geothermal resource development and construction of geothermal power plant, transmission line, substation, and distribution lines, for smooth project management.
PT. PLN as Implication Agency of Geothermal Power Development in Eastern Indonesia
PT. PLN was nominated as the executing agency of this project by MEMR, because the following background was considered for realizing the project.
This project promotes the efficiency and diversification of power supply of in the eastern provinces, which are composed of the remote and isolated islands, and this project is composed of the small scale geothermal power construction projects utilizing renewable geothermal energy.
PT. PLN can undertake the once-through power development, i.e. the whole scope of the project from the geothermal resource development to the power generation, transmission and distribution. PT. PLN is responsible for power supply in Indonesia, and PT. PLN has ample experiences in implementation of the construction projects of the geothermal power plants, the transmission lines, substations and distribution lines. PT. PLN can assign their geothermal specialists as the key person for implementation of the development project from resource survey to power plant construction. PT. PLN is believed to have enough capacity to develop geothermal power plants in the eastern provinces.
Project Schedule and Cost

ix
A tentative implementation schedule of the project is prepared. The project takes 81 months after commencement of the project (Loan Agreement Effectiveness) for resource survey for the first power plant until the commercial operation start of the last power plant. This period should be changed depending on the planning in the preparation study. If this project starts in November 2008, the project completion will be in July 2015.
Total project cost is estimated to be 161miliom USD. PT. PLN is responsible for procuring the financial resources needed for the implementation of the project. It is assumed that JBIC will participate as financier under the Yen Loan scheme.
6. Economic Assessment of Planned Projects
The economic viability of the planned project was evaluated by an EIRR method in this study. The project economy of the geothermal power projects in the eastern province was calculated using conditions clarified in the previous studies and assumed in this study. Since programs on the power plant construction in various fields could not be prepared due to shortage of resource potential data, the project cost of each power plant construction could not be calculated. Therefore, the construction of power plants in various fields was regarded as one project of 35 MW and general values of each components of geothermal power development were used for cost estimation of the geothermal power plant construction including steam development.
An alternative power project that is capable to give the same services (salable energy) as geothermal power was assumed, and net present value of costs for the geothermal project was compared with that for the alternative project for project life, in order to obtain EIRR. As the alternative power source, a diesel power was selected. The project could dominate the alternative project as the project EIRR stands at 39.5 % while the hurdle rate is 12 %. The capacity factor was assumed to be 85 % in this evaluation. The fuel cost will be saved as much as USD 45.23 million every year, US$ 1,356.81 million in total for the period of project life. Although initial investment for geothermal power project is much higher than the alternative, the geothermal can generate electric energy without using fuel. This enables to export fossil fuel instead of domestic consumption and to acquire foreign currencies.
A FIRR method was applied to this project for evaluation of the project economy. In this study, an internal rate of return to equalize the cost (investment and operating costs) and revenue by sales of energy generated for the project life were calculated. The obtained rate was compared with the opportunity cost of capital. The calculated FIRR value was 11.95 %. As this value much exceeds the WACCs at 2.35 %, the project is judged to be financially feasible under present conditions.
Using the FIRR method and the results of the Mater Plan study, the possibility of introduction of private sector into geothermal power business in the eastern province was discussed in this study. Most of all private companies in Indonesia are considered to aim FIRR of 16%, which was announced as adequate value in the private project by the Government. Assuming FIRR of 16%, adequate electricity tariff was calculated and cash flow of the project was checked in this study. It was revealed that the private companies would suffer from a deficit of more than 50

x
million USD every year, even if the tariff and the FIRR were relatively high. The debt for working funds will be heavy load for private company.
Since adequate tariff rate was obtained to be 14 cent/kWh in case of FIRR of 12 % for government’s or government owned corporation’s project, this project can bring about the maximum reduction effect of subsidy by the Government for electricity power business in the eastern provinces.
As described above, the geothermal power development projects by the private sector as substitutes of diesel power are under difficult condition of economy, because costs of construction and operation of geothermal power plants in remote islands of the eastern ss are relatively high, compared with those in main islands such as Java, Sumatra and Sulawesi. However, the Government or the government owned corporation can conduct more economical management of the geothermal power projects in the eastern provinces, because FIRR desired by them is low and they can use ODA soft loan such as Yen Loan etc. If they conduct geothermal power development in the eastern provinces, the Government’s burden for electricity supply to these provinces is believed to be reduced remarkably.
7. Potential of CDM Projects
The geothermal power generation is considered that the amount of the CO2 emission at the life cycle is less than that of other power supplies. Moreover, the geothermal power plant generates an electric power that is high utilization rates, bigger than the other renewable energy. Therefore, since a big effect of the CO2 emission reduction by the geothermal project can be expected, the project is attractive as the CDM project.
The small scale geothermal power development activity of SSC is categorized as Type-I in the CDM program. Type-I is recognized as renewable energy project activities with a maximum output capacity equivalent to up to 15 MW (or an appropriate equivalent).
The small scale geothermal power plant of the project is connected to a grid so that the methodology will be applied for AMS I.D. AMS I.D is used for renewable electricity generation for a grid. Since emission reduction factor of AMS I.D for small scale geothermal power generation is difficult to estimate using the installed capacity and utilization rates, the reduction factor of 0.8(t-CO2/MWh) is applied to the power plant of bigger than 200kW. In case of the small scale geothermal plants of 35MW, the effect of the emission reduction of 208.5 (kt-CO2/year) is expected.
8. Project Preparation
The first development target was decided to be power plants construction of 35 MW in total in the meeting among MEMR, BAPPENAS, MOF and PT. PLN on 12 March 2008, considering power demand in the eastern provinces and project support from Japan. The support by the Japanese ODA Yen Loan is strongly expected for avoiding a deficit in the project economy. Therefore, the project must meet the requirements of the ODA Yen Loan project such as

xi
information on project feasibility including estimation of geothermal resource potential, development program, environmental constraints etc.
The Government and PT. PLN have studied geothermal power development in eastern provinces and the Japanese Government supported their activity through the research study by NEDO and the feasibility study by JETRO. However, these study projects have concentrated on the Flores Island. About geothermal areas other than the Flores Island, there is no adequate data for preparation of geothermal power development plans. For realizing the development projects by the Japanese ODA Yen Loan, project feasibility of the geothermal development in each field should be clarified on the basis of data of geothermal resource, future power demand and environmental constraints, before starting the development project. As described in this report, existence of high potential geothermal resources and necessity of geothermal power projects in the eastern provinces can understood from the existing data, but adequate and capable power output and characteristics of geothermal resources in each field have not been revealed. Therefore, detailed program of geothermal power development in each field could not be prepared in this study. Collection and analysis of the geoscientific data and programming are indispensable before starting the project.
When the geothermal power development including the steam development is planned, geological data and geochemical data for revealing the resource characteristics and potentials are generally collected by the surface surveys in consideration of reduction of the project cost and risk. Since it takes a considerable amount of time and cost to conduct whole surface surveys including geophysical survey, these detailed surveys in the selected fields should be conducted in the main project. Since the project contains the entire development plans in various islands, study program and development plan of each field should be prepared based on the geothermal resource data by preliminary geological survey and geochemical study, and data and information of predicted future power demand and environmental constraints, before starting the main project. At present, since data and information on the feasibility study of geothermal fields in the eastern area have been partially collected, the resource data should be collected by the preliminary geological survey and geochemical survey and development program should be prepared. Regarding geothermal power development in the Flores Island, some parts of development plan should be modified in accordance with present development policy by PT. PLN .
It is thought that a more certain project becomes possible despite of containing of securing steam in resource development study, if these preliminarily resource surveys and project planning are conducted before start of the development project supported by Yen Loan. If the project is supposed to be supported by ODA Yen Loan, it is desired that the preparation study is conducted using JBIC scheme of SAPPROF (Special Assistance for Project Formation).


1
Chapter 1 Introduction
1.1 Outline of Study
Facing the soaring fossil fuel oil cost and for contribution to the global environmental preservation, the Indonesian Government tries to develop nationwide geothermal development positively. It formulated a geothermal power development plan of 9,500 MW, more than ten (10) times of the so far developed capacity, by the year 2025, and enacted the Geothermal Law to implement the plan. In November 2007, the by-laws of the Geothermal Law has been promulgated and in major geothermal fields in Java, Sumatra and Sulawesi, PT. PERTAMINA, PT. PLN and private sector launched several large scale geothermal power development project.
Under the circumstances above, the Japan Government extended the technical assistance of the Geothermal Master Plan study in Indonesia by JICA. By the Master Plan Study, the geothermal power resource potential, required power demand, environmental conditions, etc. were surveyed in geothermal fields in the whole Indonesia, and then corresponding geothermal power development programs were formulated. The Master Plan Study report was highly evaluated as it may contribute to hastening the geothermal power development in the country. Based on the Master Plan Study results, the Government tries to accelerate the geothermal power development making use of Public-Private-Partnership (PPP) scheme.
The electricity in archipelago in the eastern part of Indonesia heavily relies on diesel power, the generating cost of which has been doubled by soaring fuel cost and transportation cost. The Master Plan also pointed out the fact that the inflationary cost of the fuel caused the distress of the Government, and oppressed both the PLN’s financial conditions and the Government electricity subsidiary budget.
The Ministry of Energy and Mineral Resources (MEMR), through the Master Plan Study, fully understands features of a geothermal power and its high potential in these areas, and found out the possibility to substitute the diesel power with fuel cost-free geothermal power. Understanding that the substitution of diesel power with geothermal would greatly contribute to curtailing the consumption of fuel oil, reduction of the government subsidies, and moreover, to stable power supply and global warming gas (CO2) reduction, the Government has started with the study for implementation. Owing to limited power demand in isolated islands, the geothermal power scale may probably be a total capacity of less 10 MW per site that is too small to give incentives to a private sector. So, the geothermal development in these areas would be led by the central or regional government.
The MEMR headed by the Minister considers that the diesel substitute geothermal undertaking at the eastern provinces is the most significant project of the projects needing the Government assistance, and proposes assistance from Japan, the Japanese Yen Loan in particular. The intention has been forwarded to JBIC from the DGMCG of MEMR.
So far, no feasibility study except for some fields in Flores has been done for this purpose. Thus,

2
the study for the program preparation needed for application of the Yen Loan, and the coordination with the relevant agencies about the prepared draft planning are indispensable to attain the Government objective.
With this Assistance Services by ECFA, if the study for geothermal development in the eastern regions and coordination among the agencies in Indonesia could be attained, the economic assistance from Japan would be realized and the small scale geothermal power development to substitute diesel power could be forwarded as the Indonesian Government earnestly has been expecting. The development of geothermal power would greatly contribute to substitution of the fossil energy consumption and to prevention of global warming.
1.2 Background
1.2.1 Project Identity in Government Geothermal Development Plan
Under the order of the Minister of Energy and Mineral Resources in RUKN (April 2005), the mission of power sector outside Java is outlined as follows:
• To prioritize power generation with renewable energy in remote and isolated local areas where small scale power is required
The policy of using primary energy for power generation consists of both the measures utilizing local primary energy sources and new/renewal energy sources. The utilizing local energy measures means to utilize fossil energy and non-fossil energy. The utilization of local primary energy places priority on utilization of renewable energy in view of environmental safety, technical possibility and economic efficiency.
To promote utilization of renewable energy for power generation, the national policy is clearly stated that energy utilization with geothermal, biomass and hydro shall be over 5% in 2020 in Indonesia.
In remote island far from the national grid, main power sources rely on mostly diesel power, and those high operation and maintenance costs (fuel purchase cost, fuel transportation cost, latest price inflation of oil, and low availability factor of facilities) has caused severe profit losses year by year. In addition, because diesel power generation emits greenhouse gases such as carbon dioxide, the Indonesian Government has tried to convert it to other renewable energy power sources.
The geothermal development master plan formulated by the MEMR based on the JICA Master Plan is consist of
a) A large scale development by PT. PERTAMINA /PLN and private sectors at the geothermal fields where the transmission grids in Java, Bali, Sumatra and Sulawesi are accessible: and
b) Independent, small scale geothermal power development by the Government or PT. PLN .

3
The geothermal power development in the eastern part of Indonesia is identified corresponding to the later one above. This geothermal power development in the eastern part of Indonesia aiming at substitution of diesel power is a high priority project as MEMR’s own project and advocated by the Minister of MEMR himself. As this project has been clearly and frequently identified and mentioned at the government seminar (BAPPENAS) and other government publications, it is a significant and important energy development project for promotion at the economically deterred areas.
1.2.2 Power Situation and Rural Electrification
In 2006 statistics, the power demand (sold energy) recorded at 112,610 GWh, and the peak demand at 20,354 MW. The total installed capacity of PLN was 25,258 MW with a generation of 104,467 GWh. In addition, the enegy of 28,640 GWh was received from power generator other than PLN. The power mix of PLN was, 8,220 MW (32.5%) by thermal, 7,021 MW (27.8%) by combined cycle, 3,529 MW (14.0%) by hydro, 2,941 MW (11.6%) by diesel, 2,727 MW (10.8%) by gas-turbine, and 807 MW (3.2%) by geothermal. Most of the geothermal units are located in Java, and geothermal units are under construction in Sulawesi, and a large scale geothermal power development has been planned in Sumatra. No practical geothermal development project has been planned in the eastern part of Indonesia.
The following are the electric power situations in the objective provinces:
1) West Nusa Tenggara
The peak demand in the year 2006 was 1116 MW and total power generation 579 GWh in scattered power systems. Net system energy demand was 508 GWh in 2006, which breaks down as 333 GWh (65.6%) for household use, 113 GWh (22.3%) for commercial use, 10 GWh (2.0%) for industrial use, and 55 GWh (10.2%) for public use. The electrification rate of the province in 2006 reached 28.8%.
2) East Nusa Tenggara
Maximum electric power in 2006 was 72 MW, and generated output was 313 GWh. The entire load is supplied by isolated power sources. Net system energy demand was 280 GWh in 2006, which breaks down as 178 GWh (63.5%) for household use, 50 GWh (17.9%) for commercial use, 9 GWh (3.2%) for industrial use, and 43 GWh (15.4%) for public use. The electrification rate of the province in 2006 reached 21.8%
3) Maluku Island
The Maluku Island is divided into Maluku Province and North Maluku Province, but the electric supply is made by PLN as one region in the name of Maluku Region. Maximum electric power demand in 2006 was 83 MW, and generated output was 382 GWh. The entire load is supplied by isolated power sources. Net system energy demand was 341 GWh in 2006, which breaks down as 226 GWh (66.3%) for household use, 63 GWh (18.6%) for commercial use, 6 GWh (1.9%) for industrial use, and 45 GWh (13.2%) for public use. The electrification rate of the province in

4
2006 reached 51.6%.
1.3 Objectives
The purpose of the study is to survey geothermal resources and formulate a practical development plan making best use of the resource for substitution of geothermal power generation with existing and planned diesel power in West Nusa Tengara, East Nusa Tengara and Maluku and North Maluku Provinces. The study and planning is carried out in due consideration of application for Japanese Yen Loan in the next Japanese fiscal year.
1.4 Scope of Work
The following studies will be carried out in the Study:
ü Present situation of energy and geothermal development
ü Geothermal resources in the eastern provinces
ü Environmental and social aspects
ü Development program of geothermal resources
ü Economic and financial evaluation
ü Action plan for JBIC ODA Loan
ü Project potential for CDM
1.5 Study Area
West and East Nusa Tenggara, Maluku and North Maluku, Indonesia
1.6 Future Initiative
In this geothermal development plan aiming at substituting diesel power, the geothermal power capacity per site may be approximately less than 10 MW. Due to economy of scale, the generating cost may be comparatively higher than the large-scale development. So, the development should be undertaken mainly by the Government or the Government owned corporation (PT. PLN ). In consideration of the fact above, the introduction of JBIC ODA Loan with a very soft loan conditions will become significant.
According to the Master Plan published at open workshop in August 2007 by DGMCG-JICA, the geothermal power development in these areas is to start with resource survey (resource exploration and exploratory well drilling) from 2010, (partly from 2008) and the geothermal power units is to commission in 2016 to 2018. As the Indonesian Fiscal is to start January, the start of resource survey may be from January to March 2009, and then, a few years will be taken for confirmation of steam production. Though the Master Plan specifies the bidding for actual implementation for power generation facilities in these areas, the assistance of the Government
5
or PT. PLN becomes necessary once the JBIC ODA Loan should be extended for the project.
The ultimate purpose of this study is that the project should be included in the Government Blue Book by March 2008, a list of the projects which the Government is to make application for Japanese Yen Loan. Then, the project will be appraised by JBIC within 2008, and if the Loan for the project should be committed by the end of 2008, it is possible to start the undertaking of the project in the year 2010. However, contents of the study and existing feasibility study report does not seem to be enough to start the development project, it is recommended that preliminary resource study and preparing of the project should be conducted before starting the project.
This project is the development of a renewable energy resource and applicable for a small scale CDM specified by the Kyoto Protocol. The project is signification not only for Indonesia but also for Japan.
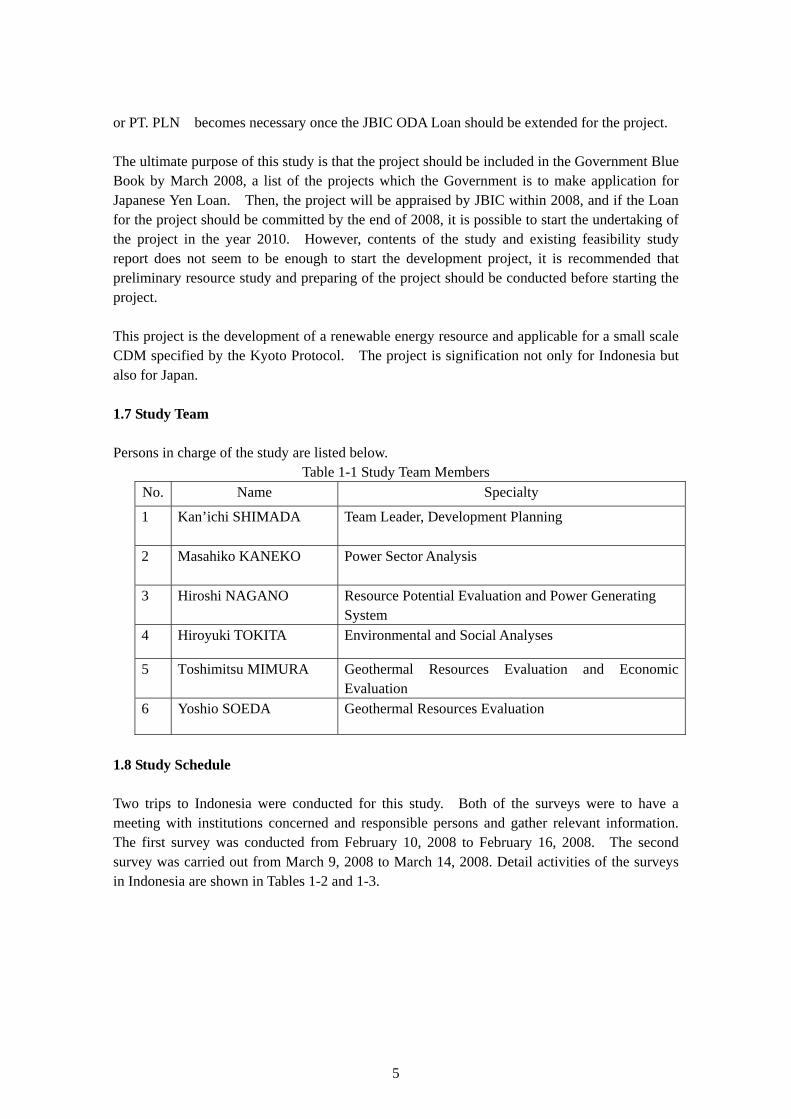
1.7 Study Team
Persons in charge of the study are listed below. Table 1-1 Study Team Members
No. Name Specialty
1 Kan’ichi SHIMADA Team Leader, Development Planning
2 Masahiko KANEKO Power Sector Analysis
3 Hiroshi NAGANO Resource Potential Evaluation and Power Generating System
4 Hiroyuki TOKITA Environmental and Social Analyses
5 Toshimitsu MIMURA Geothermal Resources Evaluation and Economic Evaluation
6 Yoshio SOEDA Geothermal Resources Evaluation
1.8 Study Schedule
Two trips to Indonesia were conducted for this study. Both of the surveys were to have a meeting with institutions concerned and responsible persons and gather relevant information. The first survey was conducted from February 10, 2008 to February 16, 2008. The second survey was carried out from March 9, 2008 to March 14, 2008. Detail activities of the surveys in Indonesia are shown in Tables 1-2 and 1-3.

6
Table 1-2 Schedule of First Trip in Indonesia
Table 1-3 Schedule of Second Trip in Indonesia
1 10-Feb-08 Sun Traveling: Fukuoka to Jakarta Jakarta
2 11-Feb-08 Mon Meeting with Center for Geological Resources, Geological Agency Jakarta
3 12-Feb-08 TueMeeting with Agency for the Assessment and Application of TechnologyMetting with Directorate General of Mineral, Coal and Geothermal,MEMR
Jakarta
4 13-Feb-08 Wed Meeting with PLNMeeting with Directorate General of Electricity & Energy Utilization Jakarta
5 14-Feb-08 Thu Meeting with Agency for the Assessment and Application of TechnologyTeam Meeting Jakarta
6 15-Feb-08 FriMetting with Directorate General of Mineral, Coal and Geothermalo,MEMRTraveling: Jakarta to Fukuoka
Fly Overnight
7 16-Feb-08 Sat Traveling: Fukuoka to Jakarta -
No. Date Schedule Stay
1 09-Mar-08 Sun Traveling: Fukuoka/Tokyo to Jakarta Jakarta
2 10-Mar-08 MonMetting with Directorate General of Mineral, Coal and Geothermal,MEMRMeeting with PLN
Jakarta
3 11-Mar-08 Tue Meeting with Directorate General of Electricity & Energy UtilizationTeam Meeting Jakarta
4 12-Mar-08 Wed Meeting with National Development Planning AgencyMeeting with Agency for the Assessment and Application of Technology Jakarta
5 13-Mar-08 Thu
Meeting with JICAMeeting with JBICMeeting with PLNTraveling: Jakarta to Fukuoka/Tokyo
Fly Overnight
6 14-Mar-08 Fri Traveling: Jakarta to Fukuoka/Tokyo -
No. Date Schedule Stay

7
Chapter 2 Necessity of Geothermal Development in the Eastern
Provinces
2.1 Background of Geothermal Power Development in Indonesia
Indonesia suffered the largest impact among ASEAN countries in the Asian economic crisis in 1997. However, the Indonesian economy has shown a great improvement after the crisis due to the results of various policy reforms and supported by the inflow of investment from foreign and domestic sources. Thus, the Indonesian economy is expanding steadily, and the electric power demand is also increasing rapidly. The peak power demand of the whole country reached 20,354 MW in 2006 and showed the 5.1% increase from the previous year. The amount of energy demand in 2006 also records 113,222 GWh, the 5.1% increase from the pervious year. The National Electricity Development Plan 2005 (RUKN 2005) estimates that the peak power demand of the country will increase at the average annual rate of 7.5% and will reach 79,900 MW in 2025. It also estimates that the energy demand will increase at almost same rate and will reach 450,000 GWh in 2025. In order to secure stable energy supply, the development of power plants which meets these demand is one of the urgent issues of the Indonesian power sector. Since the demand in the Java-Bali system accounts for 77.2%of the total country, the power plant development in this system is most important. But the power development in other system is also very crucial because the power demand will increase rapidly due to the expansion of the rural electrification and rural economy.
Another urgent issue that the Indonesian power sector faces is the diversification of energy sources. In the light of high oil price, it is necessary to reduce oil dependency in energy source in order to reduce generation cost and to secure stable energy supply. For this purpose, Indonesian government worked out "National Energy Policy (NEP)" in 2002, and set the target of supplying 5% or more of the primary energy by renewable energy by 2020. To achieve this target, the government put the important role on geothermal energy which exists affluently in the country.
2.2 Significance of Geothermal Energy Development
The utilization of geothermal energy has already a long history and more than 8,000 MW capacity of geothermal energy has been exploited in the world. Notwithstanding one form of natural energy, geothermal energy production is extremely steady with less fluctuation caused by weather or by seasonal condition. Moreover, since it is a domestically produced energy, geothermal energy greatly contributes to the national energy security. In addition, in a country which largely depends on imported energy, the exploitation of geothermal energy favorably contributes to the national economy through the saving of the foreign currency. In a country which exports energy, the exploitation of geothermal energy also contributes to the national economy through acquisition of foreign currency in payment. In addition, since geothermal energy does not use fuel in its operation, it is insusceptible to the fuel price increase caused by increase of international oil price or depreciation of currency exchange rate. From environmental viewpoint, geothermal energy has little environmental impact such as air

8
pollution because there is no combustion process in geothermal power plant. Moreover, it is a global-environmentally friendly energy because the CO2 exhaust is also extremely little from geothermal power plant. Additionally, geothermal energy can contribute to regional development through utilization of hot water from the power plant. The development of geothermal energy has a great significance for the national economy and the people’s life.
2.3 Current State of Geothermal Energy Development in Indonesia
It is said that Indonesia has the world-biggest geothermal energy potential, which is estimated as more than 27,000 MW and is though to account for more than 40% of world total potential. Therefore, the development of geothermal power has been strongly expected in order to supply energy to the increasing power demand and to diversify energy sources. Today, geothermal power plants exist in seven fields in Indonesia, i.e. Kamojang, Darajat, Wayang-Windu, Salak in west Java, Dieng in Central Java, Sibayak in north Sumatra, and Lahendong in north Sulawesi. The total power generation capacity reaches 857 MW. However, although this capacity is the forth largest in the country-ranking in the world, Indonesia has not fully utilized this huge geothermal potential yet.
Indonesian economy has showed a good recovery from the Asian economic crisis, and has been continuously expanding in these years. Accordingly the domestic energy demand is also expanding. On the other hand, the oil supply has decreased due to depletion of existing oilfields or aging of the production facilities. As a result, Indonesia changed its status form an oil-export country to an oil-import country in 2002.
Having been urged by such situation, the Indonesian Government decided to diversify energy sources and to promote domestic energy sources in order to lower oil dependency. The Government worked out "National Energy Policy” (NEP) in 2002, and set a target of supplying 5% or more of the primary energy by renewable energy by 2020. In addition, the Government promulgated the “Presidential Decree on the National Energy Policy” (PD No.5/2006) in 2006, and enhanced the NEP from ministerial level policy to the presidential level policy. On the other hand, the Government enacted "Geothermal Law" for the first time in 2003 to promote the participation of private sector in geothermal power generation. Moreover, Ministry of Energy and Mineral Resources worked out "Road Map Development Planning of Geothermal Energy" (hereafter “Road Map") to materialize the national energy plan in 2004. In this Road Map, a high development target of 6,000 MW by 2020 and 9,500 MW by 2025 is set. Thus, a basic framework for geothermal energy development has been formulated and the Government has started its efforts to attain these development targets.
2.4 Methodology to Promote Geothermal Energy Development in the Eastern Provinces
In September 2007, Japan International Cooperation Agency (JICA) has submitted the final report on "Mater Plan Study for Geothermal Power Development in the Republic of Indonesia”, which aims to study the concrete strategy to attain the Road Map of Geothermal Development.
This study has evaluated and classified 73 promising geothermal fields in Indonesia into the range of “rank A” to “rank N”, and has proposed the method of promoting each field in the

9
future. The outlines are as follows; (i) the economic incentives such as the ODA finance for Pertamina and the increase of purchase price for private investors are necessary to promote the Rank A fields (the most promising fields), (ii) the preliminary survey by the geothermal promotion survey which includes test drilling by the government is necessary to promote private investors participation in the Rank B and the Rank C fields (the promising fields without test drilling holes), and (iii) The governmental development activities are indispensable to promote small geothermal energy resources in remote islands in the eastern regions since private investors are unlikely to promote these small geothermal resources in these regions.
Speciffcally, the report proposes the following wat as for how to promote geothermal fields in the remote eastern islands;
“Basic Strategy for Geothermal Field Development in Remote Islands
There are some geothermal fields in remote islands in rank A, B, and C. In these fields, development of geothermal resources will be small-scale because the power demand in the system is not so large. In such small systems, geothermal power plant is the most economic advantageous power source, because other power plants can not utilize the scale-merit in construction cost. Therefore, geothermal development in such small systems should be positively promoted in order to decrease the generation costs. Moreover, the geothermal development is also desired to promote rural electrification in such small islands, as the National Energy Plan aims at 90% of nationwide electrification or more by 2020. However, in such remote islands, the development by private developers cannot be expected because the project scale is too small for business scale.
In such remote islands where private sector is unlikely to participate, the Government should play the central role of development. In such fields, as the development scale is small, there is a possibility of converting succeeded exploration wells into production wells. Therefore, the construction of a small power plant by PT. PLN or by local government company may be easy if the Government succeeds to drilling steam wells in the survey and transfers the wells to the power plant operator. The governmental survey is highly expected in the fields in the table below. “
2.5 Social Situation of the Eastern Provinces
The main purpose of this study is, based on the above-mentioned proposal, to formulate a project which promotes geothermal energy development in the eastern provinces in Indonesia by the Indonesian Government. It also surveyed the possibility to utilize Yen Loan for the project finance.
The surveyed area in this study is the eastern part of Indonesia, which consists of small islands. Specifically, the area is the Maluku province, the North Maluku province, the West Nusa

10
Tenggara province, and the East Nusa Tenggara province. In the PT. PLN service, Maluku province and North Maluku province have been treated as one service region.
The total area of these four provinces is 153,157 km2, and accounts for 8.2% of the whole Indonesian land. The total population of these four provinces is 10,639,000 according to the national population estimation for 2005, and it accounts for 4.9% of the entire Indonesian population. Maluku province has 1,266,000 population (0.6% of the entire nation), North Maluku has 890,000 (0.4%), West Nusa Tenggara has 4,356,000 (2.0%), and East Nusa Tenggara has 4,127,000 (1.9%). The regional Gross Domestic Production (GDP) of these four provinces totals 41,949 billion Rupiah (Rp) in 2004, and accounts for 1.8% of the whole Indonesia. The regional GDP of Maluku province is 4,048 billion Rp (0.2% of the entire nation), RGDP of North Maluku is 2,368 billion Rp (0.1%), RGDP of West Nusa Tenggara is 22,594 billion (1.0%), and RGDP of East Nusa Tenggara is 12,938 billion Rp (0.6%). As these numbers show, these eastern provinces have been greatly behind the development compared with the other provinces in Indonesia. This is mainly due to the geographic characteristic of remoteness of these provinces. The poor population ratio over the total population in these provinces exceeds 16.7% of the Indonesia average; 32.1% in Maluku, 12.4% in North Maluku, 25.4% in West Nusa Tenggara, and 27.9% in East Nusa Tenggara. (Table 2-5).
The situation by the province is as follows;
Maluku comprises, broadly, the southern part of the Maluku Islands (also known as the Moluccas, Molucca Islands or Moluccan Islands). The main city and capital of Maluku province is Ambon on the small Ambon Island. All the Maluku Islands formed a single province of Indonesia from 1950 until 1999. In 1999 the Maluku Utara Regency and Halmahera Tengah Regency were split off as a separate province of North Maluku.
North Maluku covers the northern part of the Maluku Islands, which are split between it and the province of Maluku. The planned provincial capital is Sofifi, on Halmahera, but the current capital and largest population center is the island of Ternate. In the sixteenth and seventeenth century, the islands of North Maluku were the original "Spice Islands". At the time, the province was the sole source of cloves. The Dutch, Portuguese, Spanish, and local kingdoms including Ternate and Tidore fought each other for control of the lucrative trade in these spices. Clove trees have since been transported and replanted all around the world and the demand for clove from the original spice islands has ceased, greatly reducing North Maluku's international importance. The population of North Maluku is one of the least populous provinces in Indonesia.
West Nusa Tenggara is a province in south-central Indonesia. It covers the western portion of the Lesser Sunda Islands, except for Bali. The two largest islands in the province are Lombok in the west and the larger Sumbawa Island in the east. Mataram, on Lombok, is the capital and largest city of the province. The province is administratively divided into seven regencies and one municipality. Lombok is mainly inhabited by the Sasak ethnic group, with a minority Balinese population, and Sumbawa is inhabited by Sumbawa and Bima ethnic groups. Each of these groups has a local language associated with it as well. Most of the population lives in Lombok.

11
East Nusa Tenggara is located in the eastern portion of the Lesser Sunda Islands, including West Timor. The provincial capital is Kupang, located on West Timor. The province consists of about 550 islands, but is dominated by the three main islands of Flores, Sumba, and West Timor, the western half of the island of Timor. The eastern part of Timor is the independent country of East Timor. Other islands include Adonara, Alor, Ende, Komodo, Lembata, Menipo, Rincah, Rote Island (the southernmost island in Indonesia), Savu, Semau, and Solor.
2.6 Electricity Supply and Demand Situation in the Eastern Provinces
The total maximum electric power demand in these four eastern provinces in 2006 is 270 MW, and it accounts for 1.3% of total Indonesia. To supply electric power to this demand, there is 469 MW installed generation capacity in the area. The generated energy in the area in 2006 was 1,273 GWh, and it accounts for 1.2% of the whole country. The electrification ratio of each province is; 51.6% in Maluku and North Maluku provinces, 28.8% in the West Nusa Tenggara province, and 21.8% in the East Nusa Tenggara province. The electrification ratio in this area is considerably low compared with the national average. (Table 2-5)
It is estimated that the electricity demand in these provinces will increase at an annual average of 7.4% and maximum electric power will reach 1,065 MW in 20251. Given that a reserve margin is expected to be 30-40%, it is expected that the necessary capacity of electric power facilities will reach 1,491 MW in 2025. (Table2-6) The detail in each province is as follows:
2.6.1 Maluku and North Maluku
Maluku Island was separated into Maluku Province and North Maluku Province, but the service of PT. PLN (Persero) covers these two provinces as one service area called the Maluku province. Maximum electric power demand in 2006 was 83 MW, and generated output was 382 GWh. The entire load is supplied by isolated power sources. Net system energy demand was 341 GWh in 2006, which breaks down as 226 GWh (66.3%) for household use, 63 GWh (18.6%) for commercial use, 6 GWh (1.9%) for industrial use, and 45 GWh (13.2%) for public use. The electrification rate of the province in 2006 reached 51.6%.
It is estimated that the electricity demand in these two provinces will increase at an annual average of 4.3 % and maximum electric power will reach 184 MW in 2025. Given that a reserve margin is expected to be 30-40%, it is expected that the capacity of electric power facilities will reach 257 MW in 2025. Existing diesel power plants in Maluku and North Maluku is shown in Table 2-7.
2.6.2 North Nusa Tenggara
Maximum electric power demand in 2006 was 116 MW, and generated output was 579 GWh. The entire load is supplied by isolated power sources. Net system energy demand was 508 GWh in 2006, which breaks down as 333 GWh (65.6%) for household use, 113 GWh (22.3%) for
1 According to the outlook of RUKN 2005.

12
commercial use, 10 GWh (2.0%) for industrial use, and 55 GWh (10.2%) for public use. The electrification rate of the province in 2006 reached 28.8%.
It is expected that population growth up to 2025 will average 0.8% annually and regional economic growth is 7% a year. It is expected that maximum electric power will reach 568 MW by 2025. Given that a reserve margin is expected to be 20-45%, electricity demand in this province is expected to be 795 MW.
2.6.3 East Nusa Tenggara
Maximum electric power in 2007 was 72 MW, and generated output was 313 GWh. The entire load is supplied by isolated power sources. Net system energy demand was 280 GWh in 2006, which breaks down as 178 GWh (63.5%) for household use, 50 GWh (17.9%) for commercial use, 9 GWh (3.2%) for industrial use, and 43 GWh (15.4%) for public use. The electrification rate of the province in 2006 reached 21.8%
It is expected that maximum electric power will increase in incremental steps and reach 313 MW in 2025. Given that a reserve margin is expected to be 20-50%, it is expected that the amount of electric power facilities required in 2025 will reach 439 MW. Existing diesel power plants in Nusa Tenggara is shown in Tables 2-8 and 2-9.
2.7 Necessity of Geothermal Energy Development in the eastern Provinces
The total installed power generation capacity of PT. PLN is 25,258 MW as of 2006, and the breakdown is as follows; 3,529 MW of hydro power, 8,220 MW of steam, 2,727 MW of gas turbine, 7,021 MW of combined cycle, 807 MW geothermal, 2,941 MW of diesel, and 12 MW of others. (Fig. 2-6) The power source mix is well diversified as an entire nation. However, the eastern provinces completely rely on diesel power generation only. This is because the electric system in this area is small-scale due to isolated islands. (Fig. 2-7)
However, the diesel power generation becomes extremely expensive under the current international oil price hike. As Fig.2-8 shows, the price of diesel fuel (HSD) becomes 0.62 US$/litter in 2006 from 0.07 US$/litter in 2000, showing the expansion of as much as some 9 times more. As a result, the generation cost of diesel power plant of PT. PLN becomes approximately 17.6 centsUS$/kWh in 2006, making diesel power generation the most expensive one as well as gas turbine generation. (Fig. 2-9) In contrast, the generation cost of geothermal power plant in 2006 is 6.3 centsUS$/kWh. The diesel generation cost is 2.8 times higher than that of geothermal power generation and there is the cost deference of 11.5 centsUS$/kWh between both the costs. (Fig.2-10)
The international oil price was 66 US$/barrel in 2006, and it has been continuously increasing afterwards and has exceeded 110 US$/barrel in 2008. Due to this oil price increase, the price of diesel oil (HSD oil) is also rising continuously. The price of diesel oil for industrial use in the eastern provinces which PT. PERTAMINA announced on March 1, 2008 becomes 0.936

13
US$/litter. Based on this new diesel oil price, the fuel cost of diesel generation in the eastern provinces is estimated as high as approximately 26 cents US$//kWh2. This high fuel cost is a great heavy burden on the financial foundation of PT. PLN Although the geothermal generation cost in the eastern provinces may be estimated to be slightly higher than 6.3 cents US$/kWh which is shown in Fig. 2-10 due to the smallness in the generation capacity, the cost is fur less than the current diesel generation cost. There is a great justification to promote geothermal energy development to substitute diesel power plant in the eastern provinces.
The volume of diesel oil used in the eastern provinces is about 347,000 kilo litter in 2006. The cost of this diesel fuel is estimated as much as 325 million US$ in a year based on the current diesel oil price (0.936 US$/litter). On the other hand, the ratio between minimum demand and maximum demand in the eastern provinces is estimated to be about 1/3 from the load curve example of Flores island system3. Since the maximum demand in the eastern provinces is 270 MW, the minimum demand is estimated as some 89 MW. Therefore, the base load demand is estimated to account for approximately 62 % of the total energy demand. If this base load demand is supplied by geothermal power plant instead of diesel power plant, about 214,000 kilo litter of diesel oil can be saved in one year. The value of this fuel saving is about 200 million US$ based on the current diesel oil price (0.936 US$/litter). (Table 2-10)
The Indonesian Government is providing PT. PLN with a large amount of subsidy to alleviate its financial predicament under the current high oil price situation. It is thought that the above-mentioned diesel oil saving has a great effect to reduce this subsidy.
2.8 Small Scale Power Generation Development of Other Energy Sources
The Government is promoting the development of small-scale electricity power generation through solar, micro hydro and biomass power plants as same as geothermal power. The target of these power developments is supposed to be rural electrification. The projects are aimed for disadvantaged villages throughout Indonesia, where many people need electricity and are difficult to reach or far from electricity supply by PT. PLN .
According to report by DGEEU (Director General of Electricity and Energy Utilization), 30,000 panels of solar were supplied to these villages for introducing solar home system (SHS) and each household was expected to be received a 50-80 watt by the SHS unit. Regarding micro hydropower, the Government has developed electric power plants for rural areas, but the development in the eastern islands was not included in this development program. This project’s target is not substitution of diesel power but the rural electrification.
The Government does not only promote small-scale power plants but also increase energy self-reliant villages. Currently these are 100 villages supplying themselves with energy of
2 0.273 l/kWh(average fuel consumption in diesel plant in the eastern provinces)×0.936$/l = 25.6¢/kWh. 3 Peak demand was 17.8MW and minimum demand was 5.8MW in the peak demand day in Flores island system in 2005. (Fig. 2.6.6)

14
non-bio fuel and 40 villages of bio fuel in 81 regencies. This number of the villages is too small compared with whole villages through the country. The projects are aimed for disadvantaged villages throughout Indonesia for electrification.
These projects are expanding step by step but substitution of the existing diesel power generation by these power developments seems to be difficult. Adjustment between these developments and geothermal power development in the eastern provinces is necessary and the small-scale power developments by solar, hydro and geothermal should be categorized by energy source existence and power demand. However, if a major target of the power development in the eastern provinces is substitution of diesel power by renewable energy, geothermal power development is the most suitable because of ample reserve of geothermal resources and relatively large generation capacity of each geothermal resource.

15
Table 2-1 Geothermal Power Plant in Indonesia and its Development Scheme
Power Plant Location Unit No. Capacity(MW)Start of
OperationSteam Developer Power Generator
Unit- 1 30MW 1983
Unit- 2 55MW Kamojang West Java
Unit-3 55MW 1988
PERTAMINA PLN
Unit-1 60MW
Unit-2 60MW
Unit-3 60MW
1994(*5)PERTAMINA/ Chevron
Geothermal of Indonesia (*1)
PLN
Unit-4 66.7MW
Unit-5 66.7MW
Salak West Java
Unit-6 66.7MW
1997(*5) PERTAMINA / Chevron Geothermal of Indonesia(*1)
Unit-1 55MW 1994 Pertamina/Amoseas Indonesia Inc.(AI)(*2)
PLN Darajat West Java
Unit-2 90MW 1999 Pertamina / Amoseas Indonesia Inc.(AI) (*2) Lahendong North Sulawesi Unit-1 20MW 2001 PERTAMINA PLN
Sibayak North Sumatra Unit-1 2MW 2000 PERTAMINA
Wayang-Windu West Java Unit-1 110MW 2000 Pertamina / Magma Nusantara Ltd (MNL) (*3)
Dieng Central Java Unit-1 60MW 2002 Geo Dipa (*4)
PLN Power Plant (395MW) Total 857MW
(Break Down)
IPP Power Plant (462MW) (Source:PERTAMINA; “PERTAMINA Geothermal Development(Resource & Utilization)”)
(Note) *1 Chevron took over Unocal (Union Oil Company of California), who was the original developer of Salak on Aug. 2005 .
*2 Amoseas Indonesia Inc. is a subsidiary of U.S.-based Chevron Texaco.
*3 Magma Nusantara is a wholly owned subsidiary of Star Energy. Star Energy acquired W’ayang-Windu in Nov. 2004.
*4 Dieng Plant was transfer to PT Geo Dipa from California Energy, who was the original developer, through Government of
Indonesia in 2002. PT Geo Dipa is a joint venture of PERTAMINA and PLN.
*5 Renovated in 2005
16
The National Energy Policy (NEP)
Stable energy supply is essential for achieving social and economic development in any nations. In most countries including Indonesia, domestic energy demand is met mostly from fossil energy sources, particularly for oil while proven reserve of oil is limited in the world. In Indonesia, the contribution of oil was approximately 88% in 1970. Although the share of oil has gradually decreased to 54% in 2002, the total oil consumption is relatively high with the growth rate of 6.1% per year. This higher growth is attributed to the economic growth and population growths. However, the per capita energy consumption was relatively low or about 311.6 KOE (kilo gram of Oil Equivalent) per capita, while the energy intensity is 108.3 KOE/thousand US$ (at 1995 US$). On the other hand, the renewable energy of Indonesia has very big potential. However, the development is not well developed compared to this big potential. Realizing present energy condition, the government launched the National Energy Policy (NEP) in 2002. The vision of this policy is “to guarantee the sustainable energy supply to support national interest”; while the missions are:
(a) guaranteeing domestic energy supply, (b) improving the added value of energy sources, (c) managing energy ethically and sustainable way and considering prevention of environment function, (d) proving affordable energy for the poor, and (e) developing national capacity.
The targets of NEP are: (a) improving the role of energy business toward market mechanism to increase added value, (b) achieving electrification ration of 90% by the year 2020, (c) reaching renewable energy (non large hydro) energy shares in energy mix at least 5% by 2020, (d) realizing energy infrastructure, which enable to maximize public access to energy and energy use for export, (e) increase strategic partnership between national and international energy companies in exploring domestic and export energy resources, (f) decrease energy intensity by 1% per year therefore to the elasticity to be 1 by 2020, and (g) increase the local contents and improving the role of national human resources in the energy industries.
To reach this energy targets, strategy have to be taken namely: (a) restructuring energy sector, (b) implementing market based economy, (c) developing regional empowerment in energy sector, (d) developing energy infrastructures (e) improving energy efficiency, (f) improving the role of national energy industry, (g) improving national energy supporting activities (service and industries), and (h) empowering community.
To ensure the achievement of the targets, the policy measures to be pursued are: (a) intensification measure is taken to increase the availability of energy in parallel with the national development and population growth, (b) diversification measure is taken to increase coal and gas shares, which have a larger potential than oil and to increase renewable energy shares, which has a huge potential and clean , (c) conservation measures is taken to improve energy efficiency by developing and using energy saving technology both in upstream and down stream sides.
In line with the strategies, several action plan have to be done: (a) upstream side(oil, gas, coal, geothermal, hydro power, other renewable energy resource, nuclear energy, other new energy resources), (b) downstream side (petroleum, gas pipeline, gas fuel, and LPG, electricity), (c) energy utilization (household, and commercial sector, industry sector, transportation sector) , (d) human resources development , (e) research and development , and (f) community development in supplying energy to empower the local society.
Table 2-2 National Energy Policy

17
Presidential Decree on “National Energy Policy” (PD No.5 / 2006) In 2006, the National Energy Policy (NEP) was enhanced to be a higher level of national policy by Presidential Decree. Specifically, the President of Indonesia issued the Presidential Decree of "The National Energy Policy (PD No.5/2006)” on 25, January, 2006, in order to “guarantee the stable energy supply to the domestic market for sustainable socio economic development”. This Presidential Decree clarifies the concrete target of national energy policy such as :
(a) Energy elasticity (the ratio between the rate of energy consumption increase and the rate of economic growth) should be less than 1 by the year of 2025. (Fig.3.2.3-1)
(b) Achievement of the following energy mix in 2025 (Fig.3.2.3-2) 1) Oil 20% or less 2) Gas 30% or more 3) Coal 33% or more 4) Bio-fuel 5% or more 5) Geothermal 5% or more 6) Other new and renewable energy (especially, biomass, nuclear power, hydro power, photovoltaic, wind power etc.) 5% or more 7) Liquefied coal 2% or more
Moreover, the decree states that this policy target will be achieved by the main policies and the support policies, and that the main policies are:
(a) Energy supply policies to secure stable energy supply to domestic market and to optimize energy production, etc.
(b) Energy utilization policy to improve energy efficiency and to diversify energy sources,
(c) Energy price policy to aim at economic price (although some support to the poor people will be considered.), and
(d) Environmental policy to apply sustainable development principle. As for the supporting policies, the decree indicates the following four policies (Article 3):
(a) Energy infrastructure development, (b) Partnership between government and business society, (c) Empowerment to people, and (d) Research & development and educational & training.
In addition, the decreed states that the government may support the development of the specified alternative energy sources and may grant the incentives to the developers of the energy sources (Article 6). The setting of clear target in the level of presidential decree provides the people concerned to geothermal energy with high expectations for further development of geothermal energy in Indonesia.
Table 2-3 Presidential Decree on “National Energy Policy”
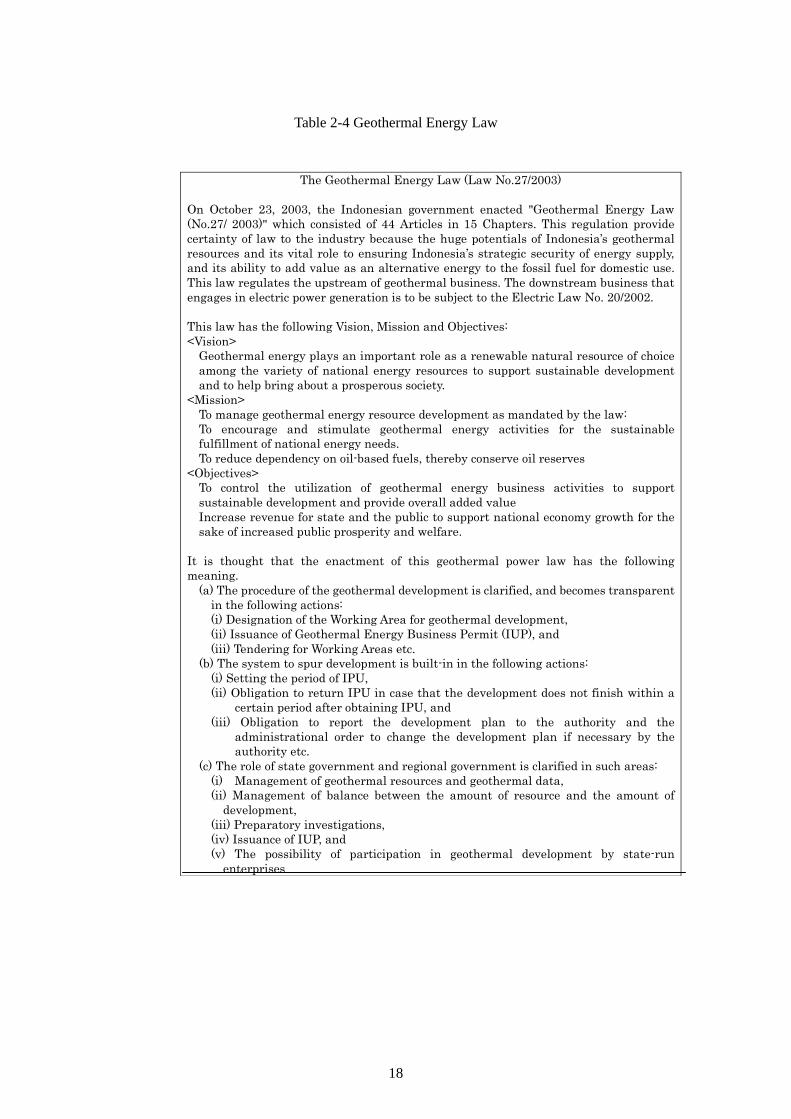
18
Table 2-4 Geothermal Energy Law
The Geothermal Energy Law (Law No.27/2003)
On October 23, 2003, the Indonesian government enacted "Geothermal Energy Law (No.27/ 2003)" which consisted of 44 Articles in 15 Chapters. This regulation provide certainty of law to the industry because the huge potentials of Indonesia’s geothermal resources and its vital role to ensuring Indonesia’s strategic security of energy supply, and its ability to add value as an alternative energy to the fossil fuel for domestic use. This law regulates the upstream of geothermal business. The downstream business that engages in electric power generation is to be subject to the Electric Law No. 20/2002. This law has the following Vision, Mission and Objectives: <Vision>
Geothermal energy plays an important role as a renewable natural resource of choice among the variety of national energy resources to support sustainable development and to help bring about a prosperous society.
<Mission> To manage geothermal energy resource development as mandated by the law: To encourage and stimulate geothermal energy activities for the sustainable fulfillment of national energy needs. To reduce dependency on oil-based fuels, thereby conserve oil reserves
<Objectives> To control the utilization of geothermal energy business activities to support sustainable development and provide overall added value Increase revenue for state and the public to support national economy growth for the sake of increased public prosperity and welfare.
It is thought that the enactment of this geothermal power law has the following meaning.
(a) The procedure of the geothermal development is clarified, and becomes transparent in the following actions: (i) Designation of the Working Area for geothermal development, (ii) Issuance of Geothermal Energy Business Permit (IUP), and (iii) Tendering for Working Areas etc.
(b) The system to spur development is built-in in the following actions: (i) Setting the period of IPU, (ii) Obligation to return IPU in case that the development does not finish within a
certain period after obtaining IPU, and (iii) Obligation to report the development plan to the authority and the
administrational order to change the development plan if necessary by the authority etc.
(c) The role of state government and regional government is clarified in such areas: (i) Management of geothermal resources and geothermal data, (ii) Management of balance between the amount of resource and the amount of
development, (iii) Preparatory investigations, (iv) Issuance of IUP, and (v) The possibility of participation in geothermal development by state-run
enterprises

19
Fig. 2-1 Geothermal Development Road Map

20
Region Maluku North Maluku West Nusa Tenggara East Nusa Tenggara Sub-total ofEastern regions Total Indoensia
Capital Ambon Ternate Capital Mataram Kupang Jakarta
47,350 39,960 19,709 46,138 153,157 1,860,360(2.5%) (2.1%) (1.1%) (2.5%) (8.2%) (100.0%)1,266 890 4,356 4,127 10,639 219,205
(0.6%) (0.4%) (2.0%) (1.9%) (4.9%) (100.0%)
Population Growth Rate (*3) 1.66% 1.78% 1.67% 1.54% - 1.34%
Density (people/km2) 26.7 22.3 221.0 89.4 69.5 117.8
4,048.3 2,368.4 22,593.9 12,938.4 41,949.0 2,303,031.4(0.2%) (0.1%) (1.0%) (0.6%) (1.8%) (100.0%)
Percentage of population belowpoverty line (*5) 32.1% 12.4% 25.4% 27.9% 16.7%
Ambon, Kota Halmahera Tengah Bima AlorBuru Kota Ternate Dompu BaluMaluku Tengah Halmahera Barat Lombok Barat EndeMaluku Tenggara Halmahera Utara Lombok Tengah Flores TimurMaluku Tenggara Barat Halmahera Selatan Lombok Timur KupangSeram Bag. Timur Kep. Sula Mataram Kupang KotaSeram Bag. Barat Halmahera Timur Sumbawa LambataKep. Aru Kep. Tidore. Kota Sumbawa Barat Manggrai
Bima, Kota NgadaSikkaSumba BaratSamba TimurTimor Tengh SelatanTimor Tengh UtaraManggarai BaratRote Ndao
Governor (*7) Karel Albert Ralahalu Thaib Armain Lalu Serinata Piet Alexander TalloEthnic Group (*7) Significantly mixed
ethnicity; Melanesian,Malay, Ambonese,Bugis, Javanese,Chinese
Sasak (68%), Bima(13%), Sumbawa (8%),Balinese (3%)
Atoni Metto (15%),Manggarai (15%),Sumba (13%), Dawan(6%), Lamaholot (5%),Belu (5%), Rote (5%),Lio (5%)
Religion (*7) Christianity, Islam Islam (96%), Hindu(3%), Buddhist (1%)
Catholic (53,9%),Protestant (33,8%),Islam (8,8%), Other(3,5%)
(Note) *1 by Statistics Indoensia 2005/2006. *2 by 2005Indonesia population projction by Statistics Indonesia 2005/2006. *3 growth during 2005-2000 *4 at 2004 current price by Statistics Indonesia 2005/2006. *5 at 2004 by Statistics Indonesia 2005/2006. *6 by ATLAS Indoensia & Dunia Terlengkap (2006) *7 by Wkipedia information
Area (km2) (*1)
Population ('000) (*2)
Regional GDP (Billion Rp) (*4)
Regency/City (*6)
Table 2-5 Outline of Eastern Provinces

21
Item Maluku & NorthMaluku
West NusaTenggara
East NusaTenggara
Installed Capacity (MW) 196.7 149.7 123.0 469.3 6,430.7 24,846.2<0.79%> <0.60%> <0.49%> <1.89%> <25.88%> <100.00%>
Peak Load (MW) 82.7 116.0 71.6 270.4 4,954.6 20,354.4<0.41%> <0.57%> <0.35%> <1.33%> <24.34%> <100.00%>
Generated Energy (GWh) 381.5 579.2 312.6 1,273.3 24,559.4 104,468.6<0.37%> <0.55%> <0.30%> <1.22%> <23.51%> <100.00%>
Energy Sold (GWh) 341.0 507.8 280.1 1,128.9 25,691.2 112,609.8<0.30%> <0.45%> <0.25%> <1.00%> <22.81%> <100.00%>
Installed Capacity by Type (MW) 196.7 149.7 123.0 469.3 (100.0%) 6,430.6 (100.0%) 25,258 (100.0%) Hydro (MW) 0.9 1.1 2.0 (0.4%) 1,119.7 (17.4%) 3,529 (14.0%) Steam (MW) 0.0 (0.0%) 900.0 (14.0%) 8,220 (32.5%) Gas turbine (MW) 0.0 (0.0%) 662.5 (10.3%) 2,727 (10.8%) Combined Cycle (MW) 0.0 (0.0%) 877.9 (13.7%) 7,021 (27.8%) Geothermal (MW) 0.0 (0.0%) 20.0 (0.3%) 807 (3.2%) Diesel (MW) 196.7 148.8 121.9 467.3 (99.6%) 2,838.2 (44.1%) 2,941 (11.6%) Others (MW) 0.0 (0.0%) 12.4 (0.2%) 12 (0.0%)
Energy Production by Type (GWh) 381.5 579.2 312.6 1,273.3 (100.0%) 24,559.4 (100.0%) 104,468.6 (100.0%) Hydro (GWh) 0.0 3.1 3.1 (0.2%) 4,076.3 (16.6%) 8,758.6 (8.4%) Steam (GWh) 0.0 (0.0%) 4,800.7 (19.5%) 47,764.3 (45.7%) Gas turbine (GWh) 0.0 (0.0%) 1,560.4 (6.4%) 5,031.2 (4.8%) Combined Cycle (GWh) 0.0 (0.0%) 5,226.9 (21.3%) 30,917.8 (29.6%) Geothermal (GWh) 0.0 (0.0%) 166.0 (0.7%) 3,141.4 (3.0%) Diesel (GWh) 381.5 579.2 309.6 1,270.3 (99.8%) 8,533.7 (34.7%) 8,659.9 (8.3%) Others (GWh) 0.0 (0.0%) 195.4 (0.8%) 195.4 (0.2%)
Energy Sold by Type (GWh) 341.0 507.8 280.1 1,128.9 (100.0%) 25,691.2 (100.0%) 112,609.8 (100.0%) Residential (GWh) 226.2 332.9 177.8 736.9 (65.3%) 13,058.6 (50.8%) 43,753.2 (38.9%) Industrial (GWh) 6.4 10.1 9.0 25.6 (2.3%) 5,046.8 (19.6%) 43,615.5 (38.7%) Business (GWh) 63.3 113.1 50.2 226.7 (20.1%) 5,309.0 (20.7%) 18,415.5 (16.4%) Social (GWh) 10.3 18.8 14.5 43.6 (3.9%) 677.3 (2.6%) 2,603.6 (2.3%) Government (GWh) 25.9 9.8 14.6 50.3 (4.5%) 602.9 (2.3%) 1,807.9 (1.6%) Street Lighting (GWh) 8.9 23.0 14.0 45.9 (4.1%) 996.7 (3.9%) 2,414.1 (2.1%)
Elecrification Rate (%) 51.6 28.8 21.8 - 51.5 58.8
(Source: PLN Statistics 2006)
Sub Total of EasternRegion Outside Jawa PLN Total
Table 2-6 Electricity Demand and Supply Situation in Eastern Provinces (2006)
(出典:PLN Statistic2006)

22
Table 2-7 Diesel Power Plants in Maluku and North Maluku
NO NAMA PLTD CABANG TAHUN
OPERASI kW
1 HATIVE KECIL 1 AMBON 1978 2,296 2 HATIVE KECIL 2 AMBON 1978 2,296 3 HATIVE KECIL 3 AMBON 1983 3,280 4 HATIVE KECIL 4 AMBON 1986 6,560 5 HATIVE KECIL 5 AMBON 1991 7,040 6 HATIVE KECIL 6 AMBON 1978 200 7 POKA 1 AMBON 1998 6,400 8 POKA 2 AMBON 1998 6,400 9 POKA 3 AMBON 1998 6,400
10 POKA 4 AMBON 2004 4,700 11 POKA 5 AMBON 2004 4,700 12 POKA 6 AMBON 1978 400 13 AIR BUAYA 1 AMBON 1988 140 14 AIR BUAYA 2 AMBON 1992 40 15 AIR BUAYA 3 AMBON 1992 40 16 AIR BUAYA 4 AMBON 1996 100 17 AIR BUAYA 5 AMBON 2004 100 18 AMARSEKARU 1 AMBON 1994 40 19 AMARSEKARU 2 AMBON 1994 40 20 AMARSEKARU 3 AMBON 1990 40 21 BANDA 1 AMBON 1983 117 22 BANDA 2 AMBON 1983 117 23 BANDA 3 AMBON 1990 220 24 BANDA 4 AMBON 1994 220 25 BANDA 5 AMBON 1997 280 26 BANDA 6 AMBON 2003 500 27 BULA 1 AMBON 1984 117 28 BULA 2 AMBON 1984 117 29 BULA 3 AMBON 1994 220 30 BULA 4 AMBON 1999 184 31 BULA 5 AMBON 2003 280 32 BULA 6 AMBON 2004 250 33 GESER 1 AMBON 1988 40 34 GESER 2 AMBON 1992 40 35 GESER 3 AMBON 1981 40 36 GESER 4 AMBON 1994 40 37 GESER 5 AMBON 1995 40 38 GESER 6 AMBON 1997 100 39 GESER 7 AMBON 2004 250 40 GESER 8 AMBON 2004 250

23
NO NAMA PLTD CABANG TAHUN
OPERASI kW
41 HARUKU 1 AMBON 1986 432 42 HARUKU 2 AMBON 1986 432 43 HARUKU 3 AMBON 1995 220 44 HARUKU 4 AMBON 2003 500 45 HARUKU 5 AMBON 2003 500 46 HARUKU 6 AMBON 1981 100 47 HARUKU 7 AMBON 2004 720 48 HARUKU 8 AMBON 2004 250 49 KESUI 1 AMBON 1994 20 50 KESUI 2 AMBON 1994 20 51 KESUI 3 AMBON 1999 40 52 KESUI 4 AMBON 1993 40 53 KAIRATU 1 AMBON 1986 260 54 KAIRATU 2 AMBON 1966 260 55 KAIRATU 3 AMBON 1993 740 56 KAIRATU 4 AMBON 1986 560 57 KAIRATU 5 AMBON 1992 220 58 KAIRATU 6 AMBON 1997 528 59 KAIRATU 7 AMBON 1997 200 60 KAIRATU 8 AMBON 1995 500 61 KAIRATU 9 AMBON 2003 720 62 KAIRATU 10 AMBON 2003 280 63 KAIRATU 11 AMBON 2004 500 64 KIANDARAT 1 AMBON 1993 100 65 KIANDARAT 2 AMBON 1993 40 66 KIANDARAT 3 AMBON 1999 112 67 KIANDARAT 4 AMBON 2003 250 68 KOBISONTA 1 AMBON 1993 100 69 KOBISONTA 2 AMBON 1993 100 70 KOBISONTA 3 AMBON 1998 40 71 KOBISONTA 4 AMBON 1998 40 72 KOBISONTA 5 AMBON 1998 100 73 KOBISONTA 6 AMBON 1999 250 74 KOBISONTA 7 AMBON 1999 250 75 KOBISONTA 8 AMBON 1999 250 76 KOBISONTA 9 AMBON 2001 250 77 KOBISONTA 10 AMBON 2003 720 78 LABUHAN 1 AMBON 1983 117 79 LABUHAN 2 AMBON 1993 40 80 LABUHAN 3 AMBON 1996 100 81 LABUHAN 4 AMBON 1999 100

24
NO NAMA PLTD CABANG TAHUN
OPERASI kW
82 LABUHAN 5 AMBON 2004 250 83 LABUHAN 6 AMBON 2004 250 84 LAIMU 1 AMBON 1991 100 85 LAIMU 2 AMBON 1991 100 86 LAIMU 3 AMBON 1997 100 87 LAIMU 4 AMBON 1999 100 88 LAIMU 5 AMBON 2003 280 89 LAIMU 6 AMBON 2004 250 90 LEXSULA 1 AMBON 1987 140 91 LEXSULA 2 AMBON 1988 40 92 LEXSULA 3 AMBON 1996 16 93 LEXSULA 4 AMBON 2003 280 94 LIANG 1 AMBON 1995 100 95 LIANG 2 AMBON 1995 280 96 LONTHOR 1 AMBON 1985 140 97 LONTHOR 2 AMBON 1994 100 98 LONTHOR 3 AMBON 1997 180 99 LONTHOR 4 AMBON 2004 280
100 LUHU 1 AMBON 1984 100 101 LUHU 2 AMBON 1984 100 102 LUHU 3 AMBON 1981 100 103 LUHU 4 AMBON 1995 220 104 LUHU 5 AMBON 2000 100 105 LUHU 6 AMBON 2003 280 106 LUHU 7 AMBON 2004 500 107 MANIPA 1 AMBON 1994 40 108 MANIPA 2 AMBON 1994 40 109 MANIPA 3 AMBON 1999 40 110 MANIPA 4 AMBON 2003 100 111 MAKO 1 AMBON 1991 100 112 MAKO 2 AMBON 1991 100 113 MAKO 3 AMBON 1993 100 114 MAKO 4 AMBON 1995 100 115 MAKO 5 AMBON 1996 100 116 MAKO 6 AMBON 2003 280 117 MAKO 7 AMBON 2003 100 118 MAKO 8 AMBON 2004 500 119 MAKO 9 AMBON 2004 250 120 MASAWOY 1 AMBON 1994 20 121 MASAWOY 2 AMBON 1994 40 122 MASAWOY 3 AMBON 1994 40

25
NO NAMA PLTD CABANG TAHUN
OPERASI kW
123 MASOHI 1 AMBON 1986 432 124 MASOHI 2 AMBON 1986 432 125 MASOHI 3 AMBON 1994 220 126 MASOHI 4 AMBON 1986 140 127 MASOHI 5 AMBON 1985 140 128 MASOHI 6 AMBON 1995 1,420 129 MASOHI 7 AMBON 1995 1,420 130 MASOHI 8 AMBON 2001 1,250 131 MASOHI 9 AMBON 2002 500 132 MASOHI 10 AMBON 2003 720 133 MASOHI 11 AMBON 2003 720 134 MASOHI 12 AMBON 2003 720 135 WAHAI 1 AMBON 1984 117 136 WAHAI 2 AMBON 1984 40 137 WAHAI 3 AMBON 1995 100 138 WAHAI 4 AMBON 2000 184 139 WAHAI 5 AMBON 2000 184 140 NUSA LAUT 1 AMBON 1987 140 141 NUSA LAUT 2 AMBON 1983 140 142 NUSA LAUT 3 AMBON 1995 100 143 NUSA LAUT 4 AMBON 2000 100 144 NUSA LAUT 5 AMBON 2002 184 145 NUSA LAUT 6 AMBON 2003 250 146 NUSA LAUT 7 AMBON 2004 250 147 NAMLEA 1 AMBON 1982 117 148 NAMLEA 2 AMBON 1986 260 149 NAMLEA 3 AMBON 1993 220 150 NAMLEA 4 AMBON 1994 220 151 NAMLEA 5 AMBON 1997 526 152 NAMLEA 6 AMBON 1997 280 153 NAMLEA 7 AMBON 1978 400 154 NAMLEA 8 AMBON 1978 500 155 NAMLEA 9 AMBON 2002 500 156 NAMLEA 10 AMBON 2003 500 157 NAMLEA 11 AMBON 2003 500 158 NAMLEA 12 AMBON 2004 500 159 NAMLEA 13 AMBON 2004 500 160 ONDOR 1 AMBON 1986 140 161 ONDOR 2 AMBON 1986 140 162 ONDOR 3 AMBON 1993 40 163 ONDOR 4 AMBON 2003 250
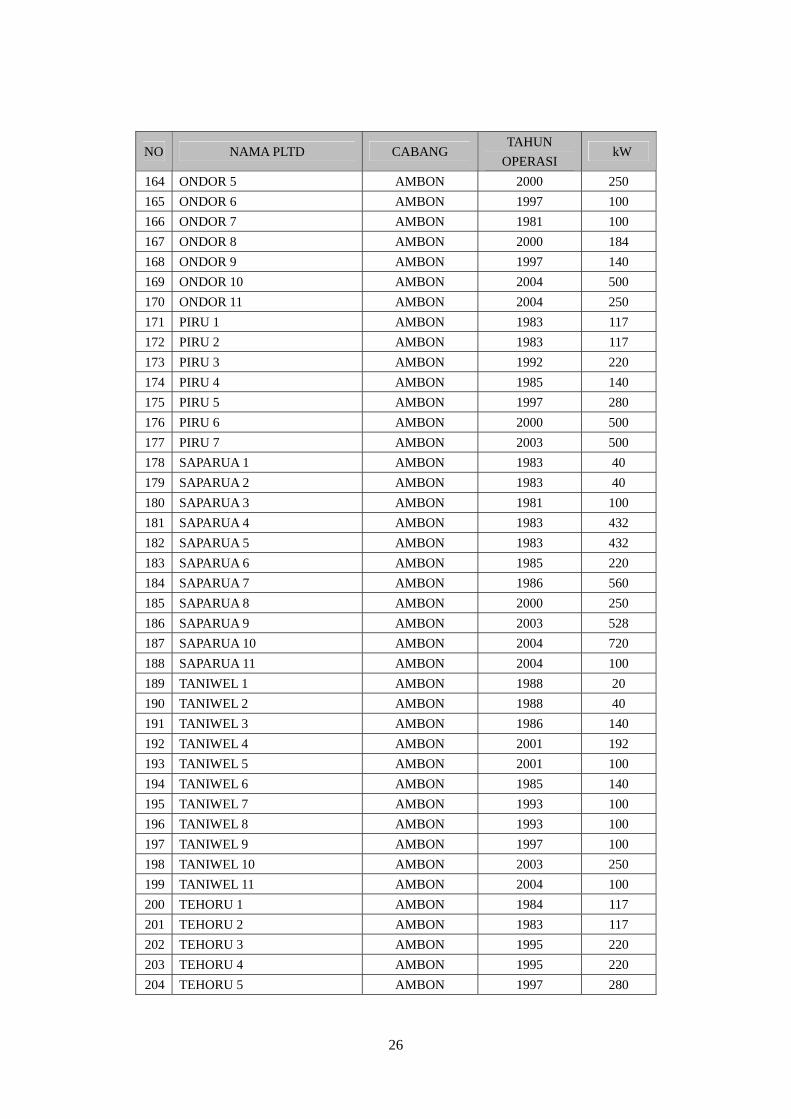
26
NO NAMA PLTD CABANG TAHUN
OPERASI kW
164 ONDOR 5 AMBON 2000 250 165 ONDOR 6 AMBON 1997 100 166 ONDOR 7 AMBON 1981 100 167 ONDOR 8 AMBON 2000 184 168 ONDOR 9 AMBON 1997 140 169 ONDOR 10 AMBON 2004 500 170 ONDOR 11 AMBON 2004 250 171 PIRU 1 AMBON 1983 117 172 PIRU 2 AMBON 1983 117 173 PIRU 3 AMBON 1992 220 174 PIRU 4 AMBON 1985 140 175 PIRU 5 AMBON 1997 280 176 PIRU 6 AMBON 2000 500 177 PIRU 7 AMBON 2003 500 178 SAPARUA 1 AMBON 1983 40 179 SAPARUA 2 AMBON 1983 40 180 SAPARUA 3 AMBON 1981 100 181 SAPARUA 4 AMBON 1983 432 182 SAPARUA 5 AMBON 1983 432 183 SAPARUA 6 AMBON 1985 220 184 SAPARUA 7 AMBON 1986 560 185 SAPARUA 8 AMBON 2000 250 186 SAPARUA 9 AMBON 2003 528 187 SAPARUA 10 AMBON 2004 720 188 SAPARUA 11 AMBON 2004 100 189 TANIWEL 1 AMBON 1988 20 190 TANIWEL 2 AMBON 1988 40 191 TANIWEL 3 AMBON 1986 140 192 TANIWEL 4 AMBON 2001 192 193 TANIWEL 5 AMBON 2001 100 194 TANIWEL 6 AMBON 1985 140 195 TANIWEL 7 AMBON 1993 100 196 TANIWEL 8 AMBON 1993 100 197 TANIWEL 9 AMBON 1997 100 198 TANIWEL 10 AMBON 2003 250 199 TANIWEL 11 AMBON 2004 100 200 TEHORU 1 AMBON 1984 117 201 TEHORU 2 AMBON 1983 117 202 TEHORU 3 AMBON 1995 220 203 TEHORU 4 AMBON 1995 220 204 TEHORU 5 AMBON 1997 280
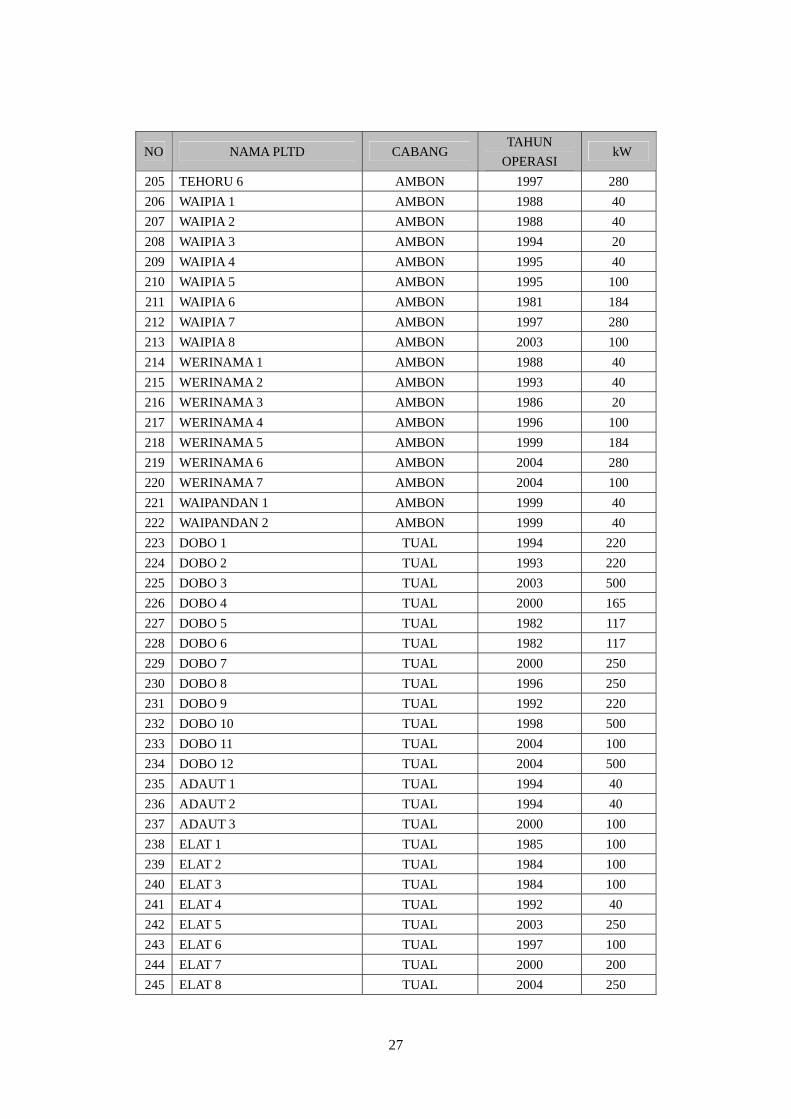
27
NO NAMA PLTD CABANG TAHUN
OPERASI kW
205 TEHORU 6 AMBON 1997 280 206 WAIPIA 1 AMBON 1988 40 207 WAIPIA 2 AMBON 1988 40 208 WAIPIA 3 AMBON 1994 20 209 WAIPIA 4 AMBON 1995 40 210 WAIPIA 5 AMBON 1995 100 211 WAIPIA 6 AMBON 1981 184 212 WAIPIA 7 AMBON 1997 280 213 WAIPIA 8 AMBON 2003 100 214 WERINAMA 1 AMBON 1988 40 215 WERINAMA 2 AMBON 1993 40 216 WERINAMA 3 AMBON 1986 20 217 WERINAMA 4 AMBON 1996 100 218 WERINAMA 5 AMBON 1999 184 219 WERINAMA 6 AMBON 2004 280 220 WERINAMA 7 AMBON 2004 100 221 WAIPANDAN 1 AMBON 1999 40 222 WAIPANDAN 2 AMBON 1999 40 223 DOBO 1 TUAL 1994 220 224 DOBO 2 TUAL 1993 220 225 DOBO 3 TUAL 2003 500 226 DOBO 4 TUAL 2000 165 227 DOBO 5 TUAL 1982 117 228 DOBO 6 TUAL 1982 117 229 DOBO 7 TUAL 2000 250 230 DOBO 8 TUAL 1996 250 231 DOBO 9 TUAL 1992 220 232 DOBO 10 TUAL 1998 500 233 DOBO 11 TUAL 2004 100 234 DOBO 12 TUAL 2004 500 235 ADAUT 1 TUAL 1994 40 236 ADAUT 2 TUAL 1994 40 237 ADAUT 3 TUAL 2000 100 238 ELAT 1 TUAL 1985 100 239 ELAT 2 TUAL 1984 100 240 ELAT 3 TUAL 1984 100 241 ELAT 4 TUAL 1992 40 242 ELAT 5 TUAL 2003 250 243 ELAT 6 TUAL 1997 100 244 ELAT 7 TUAL 2000 200 245 ELAT 8 TUAL 2004 250
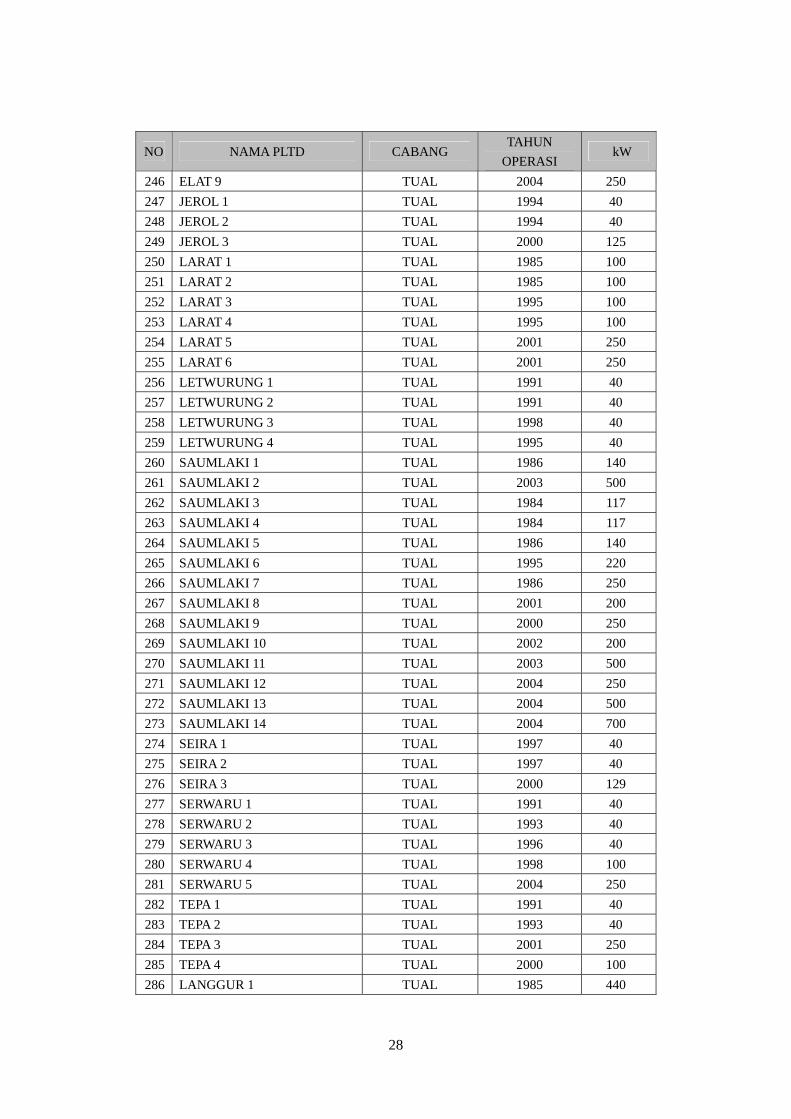
28
NO NAMA PLTD CABANG TAHUN
OPERASI kW
246 ELAT 9 TUAL 2004 250 247 JEROL 1 TUAL 1994 40 248 JEROL 2 TUAL 1994 40 249 JEROL 3 TUAL 2000 125 250 LARAT 1 TUAL 1985 100 251 LARAT 2 TUAL 1985 100 252 LARAT 3 TUAL 1995 100 253 LARAT 4 TUAL 1995 100 254 LARAT 5 TUAL 2001 250 255 LARAT 6 TUAL 2001 250 256 LETWURUNG 1 TUAL 1991 40 257 LETWURUNG 2 TUAL 1991 40 258 LETWURUNG 3 TUAL 1998 40 259 LETWURUNG 4 TUAL 1995 40 260 SAUMLAKI 1 TUAL 1986 140 261 SAUMLAKI 2 TUAL 2003 500 262 SAUMLAKI 3 TUAL 1984 117 263 SAUMLAKI 4 TUAL 1984 117 264 SAUMLAKI 5 TUAL 1986 140 265 SAUMLAKI 6 TUAL 1995 220 266 SAUMLAKI 7 TUAL 1986 250 267 SAUMLAKI 8 TUAL 2001 200 268 SAUMLAKI 9 TUAL 2000 250 269 SAUMLAKI 10 TUAL 2002 200 270 SAUMLAKI 11 TUAL 2003 500 271 SAUMLAKI 12 TUAL 2004 250 272 SAUMLAKI 13 TUAL 2004 500 273 SAUMLAKI 14 TUAL 2004 700 274 SEIRA 1 TUAL 1997 40 275 SEIRA 2 TUAL 1997 40 276 SEIRA 3 TUAL 2000 129 277 SERWARU 1 TUAL 1991 40 278 SERWARU 2 TUAL 1993 40 279 SERWARU 3 TUAL 1996 40 280 SERWARU 4 TUAL 1998 100 281 SERWARU 5 TUAL 2004 250 282 TEPA 1 TUAL 1991 40 283 TEPA 2 TUAL 1993 40 284 TEPA 3 TUAL 2001 250 285 TEPA 4 TUAL 2000 100 286 LANGGUR 1 TUAL 1985 440
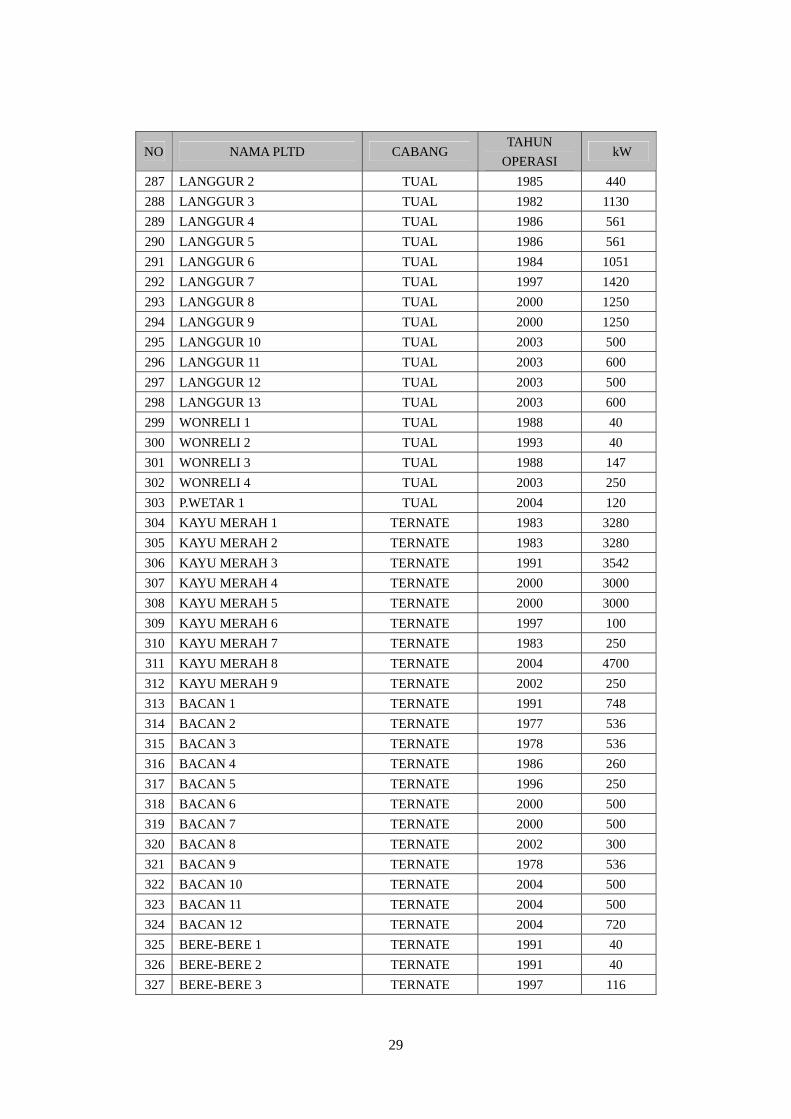
29
NO NAMA PLTD CABANG TAHUN
OPERASI kW
287 LANGGUR 2 TUAL 1985 440 288 LANGGUR 3 TUAL 1982 1130 289 LANGGUR 4 TUAL 1986 561 290 LANGGUR 5 TUAL 1986 561 291 LANGGUR 6 TUAL 1984 1051 292 LANGGUR 7 TUAL 1997 1420 293 LANGGUR 8 TUAL 2000 1250 294 LANGGUR 9 TUAL 2000 1250 295 LANGGUR 10 TUAL 2003 500 296 LANGGUR 11 TUAL 2003 600 297 LANGGUR 12 TUAL 2003 500 298 LANGGUR 13 TUAL 2003 600 299 WONRELI 1 TUAL 1988 40 300 WONRELI 2 TUAL 1993 40 301 WONRELI 3 TUAL 1988 147 302 WONRELI 4 TUAL 2003 250 303 P.WETAR 1 TUAL 2004 120 304 KAYU MERAH 1 TERNATE 1983 3280 305 KAYU MERAH 2 TERNATE 1983 3280 306 KAYU MERAH 3 TERNATE 1991 3542 307 KAYU MERAH 4 TERNATE 2000 3000 308 KAYU MERAH 5 TERNATE 2000 3000 309 KAYU MERAH 6 TERNATE 1997 100 310 KAYU MERAH 7 TERNATE 1983 250 311 KAYU MERAH 8 TERNATE 2004 4700 312 KAYU MERAH 9 TERNATE 2002 250 313 BACAN 1 TERNATE 1991 748 314 BACAN 2 TERNATE 1977 536 315 BACAN 3 TERNATE 1978 536 316 BACAN 4 TERNATE 1986 260 317 BACAN 5 TERNATE 1996 250 318 BACAN 6 TERNATE 2000 500 319 BACAN 7 TERNATE 2000 500 320 BACAN 8 TERNATE 2002 300 321 BACAN 9 TERNATE 1978 536 322 BACAN 10 TERNATE 2004 500 323 BACAN 11 TERNATE 2004 500 324 BACAN 12 TERNATE 2004 720 325 BERE-BERE 1 TERNATE 1991 40 326 BERE-BERE 2 TERNATE 1991 40 327 BERE-BERE 3 TERNATE 1997 116

30
NO NAMA PLTD CABANG TAHUN
OPERASI kW
328 BERE-BERE 4 TERNATE 2004 - 329 BERE-BERE 5 TERNATE 2004 - 330 BOBONG 1 TERNATE 1986 140 331 BOBONG 2 TERNATE 1988 40 332 BOBONG 3 TERNATE 1994 40 333 BOBONG 4 TERNATE 1996 104 334 BOBONG 5 TERNATE 1988 40 335 BOBONG 6 TERNATE 1988 40 336 BOBONG 7 TERNATE 2002 288 337 BOBONG 8 TERNATE 2004 100 338 BICOLI 1 TERNATE 1988 40 339 BICOLI 2 TERNATE 1994 40 340 BICOLI 3 TERNATE 1995 125 341 BICOLI 4 TERNATE 1994 250 342 BICOLI 5 TERNATE 1999 200 343 BICOLI 6 TERNATE 2002 200 344 BICOLI 7 TERNATE 2004 250 345 BICOLI 8 TERNATE 2004 250 346 DARUBA 1 TERNATE 1988 140 347 DARUBA 2 TERNATE 1988 140 348 DARUBA 3 TERNATE 1988 140 349 DARUBA 4 TERNATE 1995 260 350 DARUBA 5 TERNATE 1996 288 351 DARUBA 6 TERNATE 2002 400 352 DARUBA 7 TERNATE 2004 250 353 DARUBA 8 TERNATE 2004 250 354 DARUBA 9 TERNATE 2004 250 355 DOFA 1 TERNATE 1986 140 356 DOFA 2 TERNATE 1988 20 357 DOFA 3 TERNATE 1995 40 358 DOFA 4 TERNATE 1995 104 359 DOFA 5 TERNATE 2003 250 360 DOFA 6 TERNATE 2003 250 361 DOFA 7 TERNATE 2004 250 362 IBU 1 TERNATE 1984 117 363 IBU 2 TERNATE 1984 117 364 IBU 3 TERNATE 1983 117 365 IBU 4 TERNATE 1997 280 366 IBU 5 TERNATE 1993 100 367 IBU 6 TERNATE 2001 288 368 IBU 7 TERNATE 2004 500

31
NO NAMA PLTD CABANG TAHUN
OPERASI kW
369 JAILOLO 1 TERNATE 1983 117 370 JAILOLO 2 TERNATE 1983 117 371 JAILOLO 3 TERNATE 1986 260 372 JAILOLO 4 TERNATE 1991 748 373 JAILOLO 5 TERNATE 1996 508 374 JAILOLO 6 TERNATE 1986 260 375 JAILOLO 7 TERNATE 1999 480 376 JAILOLO 8 TERNATE 1999 480 377 JAILOLO 9 TERNATE 2004 500 378 JAILOLO 10 TERNATE 2004 720 379 KAYOA 1 TERNATE 1988 20 380 KAYOA 2 TERNATE 1988 40 381 KAYOA 3 TERNATE 1983 117 382 KAYOA 4 TERNATE 1995 100 383 KAYOA 5 TERNATE 2004 250 384 KEDI 1 TERNATE 1991 40 385 KEDI 2 TERNATE 1997 40 386 KEDI 3 TERNATE 1997 40 387 LAIWUI 1 TERNATE 1985 117 388 LAIWUI 2 TERNATE 1986 117 389 LAIWUI 3 TERNATE 2004 250 390 LOLOBATA 1 TERNATE 1988 140 391 LOLOBATA 2 TERNATE 1994 40 392 MABA/BULI 1 TERNATE 1986 140 393 MABA/BULI 2 TERNATE 1996 104 394 MABA/BULI 3 TERNATE 2004 250 395 MADOPOLO 1 TERNATE 1982 117 396 MADOPOLO 2 TERNATE 1983 117 397 MADOPOLO 3 TERNATE 2004 250 398 MAFFA 1 TERNATE 1986 100 399 MAFFA 2 TERNATE 1995 140 400 MAFFA 3 TERNATE 1983 140 401 MAFFA 4 TERNATE 1999 100 402 MALIFUT 1 TERNATE 1988 140 403 MALIFUT 2 TERNATE 1988 140 404 MALIFUT 3 TERNATE 1986 140 405 MALIFUT 4 TERNATE 1997 280 406 MALIFUT 5 TERNATE 1995 280 407 MALIFUT 6 TERNATE 1998 500 408 MALIFUT 7 TERNATE 2001 288 409 MALIFUT 8 TERNATE 2001 288

32
NO NAMA PLTD CABANG TAHUN
OPERASI kW
410 MALIFUT 9 TERNATE 2004 500 411 MANGOLI 1 TERNATE 1995 100 412 MANGOLI 2 TERNATE 1995 100 413 MANGOLI 3 TERNATE 1982 117 414 MANGOLI 4 TERNATE 1994 280 415 MANGOLI 5 TERNATE 2000 280 416 MANGOLI 6 TERNATE 2004 280 417 MANGOLI 7 TERNATE 2004 250 418 PATANI 1 TERNATE 1988 140 419 PATANI 2 TERNATE 1988 140 420 PATANI 3 TERNATE 1994 220 421 PATANI 4 TERNATE 2004 250 422 PAYAHE 1 TERNATE 1988 140 423 PAYAHE 2 TERNATE 1989 40 424 PAYAHE 3 TERNATE 1985 140 425 PAYAHE 4 TERNATE 1996 100 426 PAYAHE 5 TERNATE 2004 100 427 SAKETA 1 TERNATE 1988 20 428 SAKETA 2 TERNATE 1992 20 429 SAKETA 3 TERNATE 1992 40 430 SAKETA 4 TERNATE 1992 40 431 SAKETA 5 TERNATE 1983 117 432 SAKETA 6 TERNATE 1999 100 433 SAKETA 7 TERNATE 2004 100 434 SAKETA 8 TERNATE 2004 250 435 SANANA 1 TERNATE 1982 140 436 SANANA 2 TERNATE 1986 260 437 SANANA 3 TERNATE 1991 748 438 SANANA 4 TERNATE 1996 508 439 SANANA 5 TERNATE 1996 508 440 SANANA 6 TERNATE 2004 720 441 SANANA 7 TERNATE 2004 500 442 SOA-SIU 1 TERNATE 1986 432 443 SOA-SIU 2 TERNATE 1986 432 444 SOA-SIU 3 TERNATE 1991 748 445 SOA-SIU 4 TERNATE 1982 117 446 SOA-SIU 5 TERNATE 1994 220 447 SOA-SIU 6 TERNATE 1994 220 448 SOA-SIU 7 TERNATE 1997 1430 449 SOA-SIU 8 TERNATE 2003 250 450 SOA-SIU 9 TERNATE 2004 500

33
NO NAMA PLTD CABANG TAHUN
OPERASI kW
451 SOA-SIU 10 TERNATE 2004 500 452 SOFIFI 1 TERNATE 1988 140 453 SOFIFI 2 TERNATE 1986 140 454 SOFIFI 3 TERNATE 1994 220 455 SOFIFI 4 TERNATE 1997 280 456 SOFIFI 5 TERNATE 1996 104 457 SOFIFI 6 TERNATE 2003 240 458 SOFIFI 7 TERNATE 2004 250 459 SOFIFI 8 TERNATE 2004 720 460 WEDA 1 TERNATE 1986 140 461 WEDA 2 TERNATE 1983 117 462 WEDA 3 TERNATE 2004 250 463 SUBAIM 1 TERNATE 1991 100 464 SUBAIM 2 TERNATE 1995 100 465 SUBAIM 3 TERNATE 1996 280 466 SUBAIM 4 TERNATE 1995 250 467 SUBAIM 5 TERNATE 1986 140 468 SUBAIM 6 TERNATE 2000 288 469 SUBAIM 7 TERNATE 2004 250 470 TOBELO 1 TERNATE 1977 432

34
Table 2-8 Diesel Power Plants in Nusa Tenggara
NO NAMA PLTD CABANG TAHUN
OPERASI kW
1 LABUHAN 1 SUMBAWA 1979 346 2 LABUHAN 2 SUMBAWA 0 508 3 LABUHAN 3 SUMBAWA 1976 536 4 LABUHAN 4 SUMBAWA 1985 500 5 LABUHAN 5 SUMBAWA 1987 1224 6 LABUHAN 6 SUMBAWA 1987 1224 7 LABUHAN 7 SUMBAWA 1989 3000 8 LABUHAN 8 SUMBAWA 2000 3035 9 LABUHAN 9 SUMBAWA 2000 3035
10 LANTUNG 1 SUMBAWA 1987 40 11 LANTUNG 2 SUMBAWA 1987 40 12 LANTUNG 3 SUMBAWA 1995 100 13 LUNYUK BESAR 1 SUMBAWA 1989 40 14 LUNYUK BESAR 2 SUMBAWA 1987 40 15 LUNYUK BESAR 3 SUMBAWA 1983 100 16 LUNYUK BESAR 4 SUMBAWA 1987 100 17 LUNYUK BESAR 5 SUMBAWA 0 250 18 LUNYUK BESAR 6 SUMBAWA 0 250 19 LEBIN 1 SUMBAWA 1997 20 20 LEBIN 2 SUMBAWA 1986 40 21 LEBIN 3 SUMBAWA 1998 100 22 SEBOTOK 1 SUMBAWA 1995 20 23 SEBOTOK 2 SUMBAWA 1995 20 24 LABUHAN HAJI 1 SUMBAWA 1995 20 25 LABUHAN HAJI 2 SUMBAWA 1994 20 26 KLAWIS 1 SUMBAWA 1998 50 27 KLAWIS 2 SUMBAWA 0 20 28 BUGIS MEDANG 1 SUMBAWA 1999 20 29 BUGIS MEDANG 2 SUMBAWA 1999 20 30 BUGIS MEDANG 3 SUMBAWA 1987 40 31 BUGIS MEDANG 4 SUMBAWA 0 100 32 EMPANG 1 SUMBAWA 1985 100 33 EMPANG 2 SUMBAWA 0 100 34 EMPANG 3 SUMBAWA 1976 336 35 EMPANG 4 SUMBAWA 0 528 36 EMPANG 5 SUMBAWA 1982 108 37 EMPANG 6 SUMBAWA 1998 560 38 EMPANG 7 SUMBAWA 1996 100 39 EMPANG 8 SUMBAWA 0 200 40 EMPANG 9 SUMBAWA 1993 120

35
NO NAMA PLTD CABANG TAHUN
OPERASI kW
41 EMPANG 10 SUMBAWA 0 200 42 ALAS 1 SUMBAWA 1978 536 43 ALAS 2 SUMBAWA 1986 250 44 ALAS 3 SUMBAWA 1982 100 45 ALAS 4 SUMBAWA 1985 100 46 ALAS 5 SUMBAWA 1998 560 47 ALAS 6 SUMBAWA 1976 336 48 ALAS 7 SUMBAWA 0 192 49 SEKOKANG 1 SUMBAWA 0 100 50 SEKOKANG 2 SUMBAWA 0 100 51 SEKOKANG 3 SUMBAWA 0 100 52 SEKOKANG 4 SUMBAWA 1993 120 53 SEKOKANG 5 SUMBAWA 0 100 54 SEKOKANG 6 SUMBAWA 0 250 55 SEKOKANG 7 SUMBAWA 0 250 56 TALIWANG 1 SUMBAWA 2000 700 57 TALIWANG 2 SUMBAWA 1999 428 58 TALIWANG 3 SUMBAWA 0 720 59 TALIWANG 4 SUMBAWA 0 700 60 TALIWANG 5 SUMBAWA 1978 336 61 TALIWANG 6 SUMBAWA 1998 576 62 TALIWANG 7 SUMBAWA 1998 528 63 TALIWANG 8 SUMBAWA 1977 777 64 TALIWANG 9 SUMBAWA 1977 777 65 TALIWANG 10 SUMBAWA 1986 200 66 BIMA 1 BIMA 0 40 67 BIMA 2 BIMA 0 336 68 BIMA 3 BIMA 1996 2800 69 BIMA 4 BIMA 1989 3000 70 BIMA 5 BIMA 0 20 71 BIMA 6 BIMA 1987 1224 72 BIMA 7 BIMA 1987 1224 73 BIMA 8 BIMA 1985 500 74 BIMA 9 BIMA 1997 1100 75 BIMA 10 BIMA 1997 1100 76 BIMA 11 BIMA 0 508 77 BIMA 12 BIMA 0 20 78 NIU 1 BIMA 1999 2800 79 NIU 2 BIMA 1999 2800 80 SAPE 1 BIMA 0 336 81 SAPE 2 BIMA 0 280

36
NO NAMA PLTD CABANG TAHUN
OPERASI kW
82 SAPE 3 BIMA 1996 525 83 SAPE 4 BIMA 1987 250 84 SAPE 5 BIMA 1999 384 85 TAWALI 1 BIMA 1982 108 86 TAWALI 2 BIMA 0 100 87 TAWALI 3 BIMA 1984 100 88 TAWALI 4 BIMA 1987 100 89 TAWALI 5 BIMA 0 250 90 KOLO 1 BIMA 1993 20 91 KOLO 2 BIMA 1993 20 92 KOLO 3 BIMA 1993 20 93 KOLO 4 BIMA 0 40 94 NIPA 1 BIMA 1995 100 95 NIPA 2 BIMA 1992 220 96 NIPA 3 BIMA 0 100 97 PAI 1 BIMA 1993 20 98 PAI 2 BIMA 1993 20 99 DOMPU 1 BIMA 1978 336 100 DOMPU 2 BIMA 1982 270 101 DOMPU 3 BIMA 1978 336 102 DOMPU 4 BIMA 1976 336 103 DOMPU 5 BIMA 1996 560 104 DOMPU 6 BIMA 1977 560 105 DOMPU 7 BIMA 0 645 106 DOMPU 8 BIMA 1977 270 107 DOMPU 9 BIMA 0 700 108 DOMPU 10 BIMA 0 700 109 KEMPO 1 BIMA 1984 100 110 KEMPO 2 BIMA 1982 100 111 KEMPO 3 BIMA 1998 320 112 MELAYU 1 BIMA 1993 20 113 KORE 1 BIMA 1996 100 114 KORE 2 BIMA 0 40 115 KORE 3 BIMA 1993 100 116 KORE 4 BIMA 1984 100 117 SAI 1 BIMA 1993 20 118 SAI 2 BIMA 0 20 119 SAI 3 BIMA 1993 20 120 KWANGKO 1 BIMA 1993 20 121 KWANGKO 2 BIMA 1993 20 122 KWANGKO 3 BIMA 1994 20
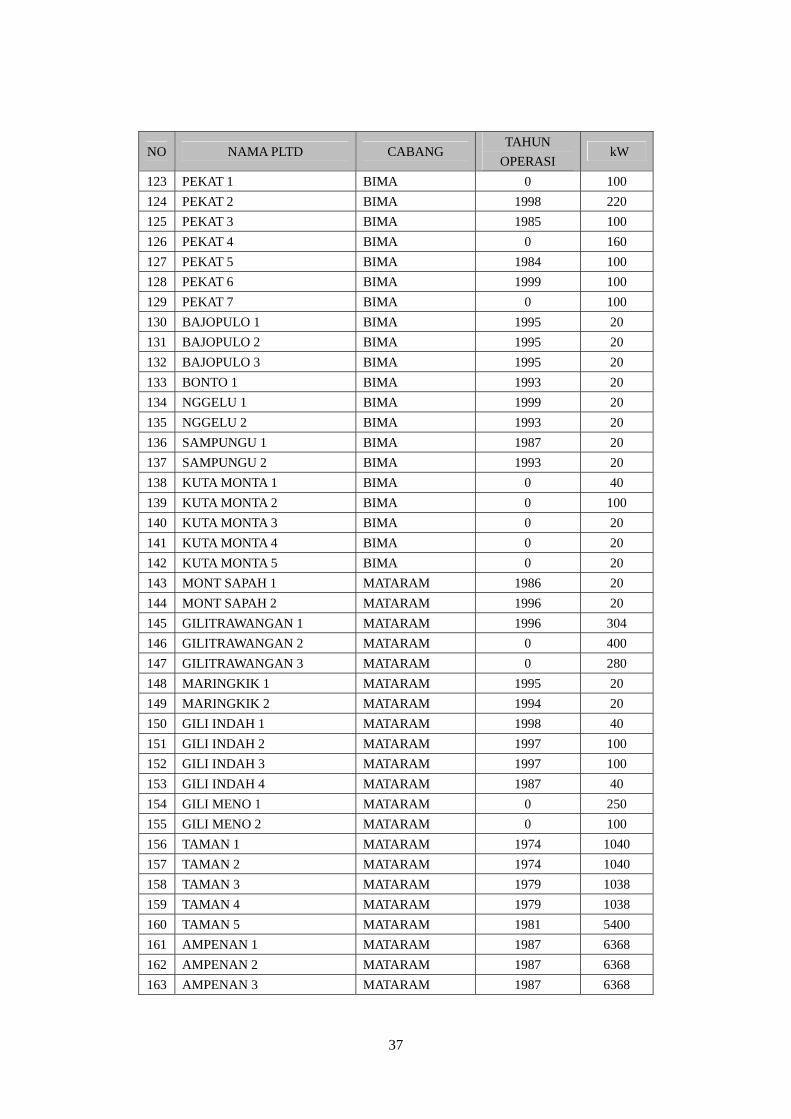
37
NO NAMA PLTD CABANG TAHUN
OPERASI kW
123 PEKAT 1 BIMA 0 100 124 PEKAT 2 BIMA 1998 220 125 PEKAT 3 BIMA 1985 100 126 PEKAT 4 BIMA 0 160 127 PEKAT 5 BIMA 1984 100 128 PEKAT 6 BIMA 1999 100 129 PEKAT 7 BIMA 0 100 130 BAJOPULO 1 BIMA 1995 20 131 BAJOPULO 2 BIMA 1995 20 132 BAJOPULO 3 BIMA 1995 20 133 BONTO 1 BIMA 1993 20 134 NGGELU 1 BIMA 1999 20 135 NGGELU 2 BIMA 1993 20 136 SAMPUNGU 1 BIMA 1987 20 137 SAMPUNGU 2 BIMA 1993 20 138 KUTA MONTA 1 BIMA 0 40 139 KUTA MONTA 2 BIMA 0 100 140 KUTA MONTA 3 BIMA 0 20 141 KUTA MONTA 4 BIMA 0 20 142 KUTA MONTA 5 BIMA 0 20 143 MONT SAPAH 1 MATARAM 1986 20 144 MONT SAPAH 2 MATARAM 1996 20 145 GILITRAWANGAN 1 MATARAM 1996 304 146 GILITRAWANGAN 2 MATARAM 0 400 147 GILITRAWANGAN 3 MATARAM 0 280 148 MARINGKIK 1 MATARAM 1995 20 149 MARINGKIK 2 MATARAM 1994 20 150 GILI INDAH 1 MATARAM 1998 40 151 GILI INDAH 2 MATARAM 1997 100 152 GILI INDAH 3 MATARAM 1997 100 153 GILI INDAH 4 MATARAM 1987 40 154 GILI MENO 1 MATARAM 0 250 155 GILI MENO 2 MATARAM 0 100 156 TAMAN 1 MATARAM 1974 1040 157 TAMAN 2 MATARAM 1974 1040 158 TAMAN 3 MATARAM 1979 1038 159 TAMAN 4 MATARAM 1979 1038 160 TAMAN 5 MATARAM 1981 5400 161 AMPENAN 1 MATARAM 1987 6368 162 AMPENAN 2 MATARAM 1987 6368 163 AMPENAN 3 MATARAM 1987 6368
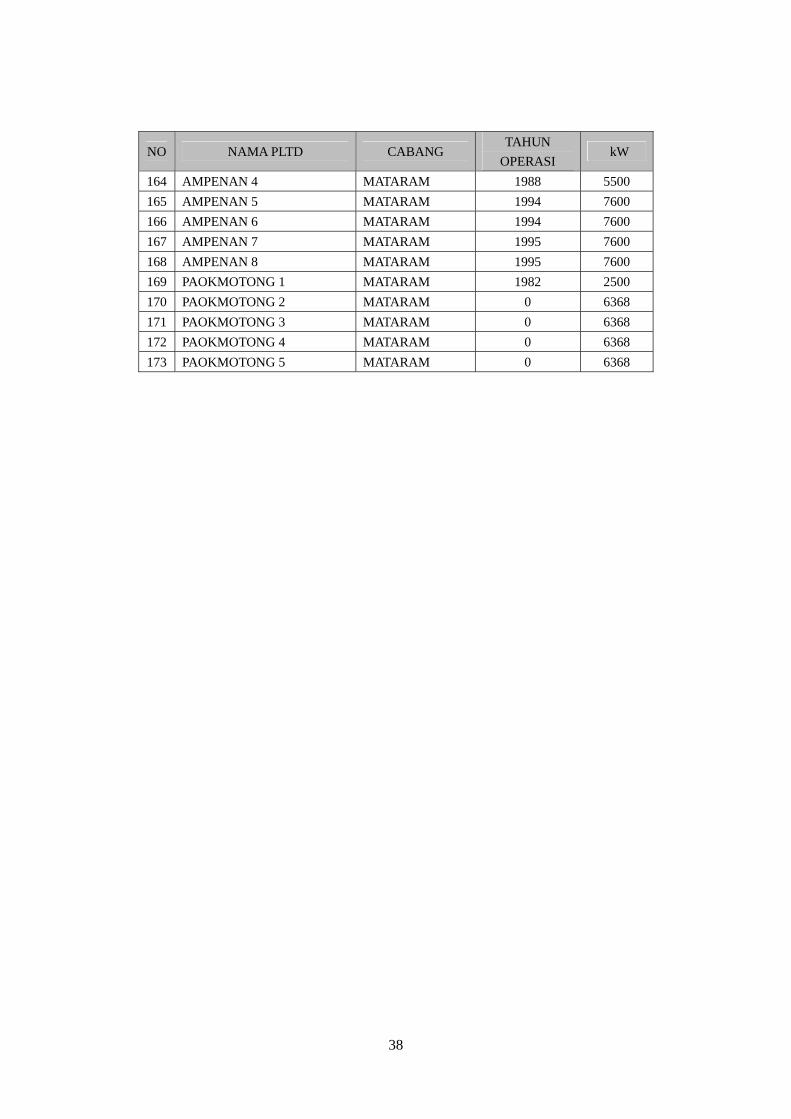
38
NO NAMA PLTD CABANG TAHUN
OPERASI kW
164 AMPENAN 4 MATARAM 1988 5500 165 AMPENAN 5 MATARAM 1994 7600 166 AMPENAN 6 MATARAM 1994 7600 167 AMPENAN 7 MATARAM 1995 7600 168 AMPENAN 8 MATARAM 1995 7600 169 PAOKMOTONG 1 MATARAM 1982 2500 170 PAOKMOTONG 2 MATARAM 0 6368 171 PAOKMOTONG 3 MATARAM 0 6368 172 PAOKMOTONG 4 MATARAM 0 6368 173 PAOKMOTONG 5 MATARAM 0 6368

39
Table 2-9 Diesel Power Plants in Flores Island
NO NAME OF DIESEL
POWER PLANT BRANCH
START OPERATION
CAPACITY (KW)
1 MAUTAPAGA 1 ENDE 1978 336 2 MAUTAPAGA 2 ENDE 1978 336 3 MAUTAPAGA 3 ENDE 1979 346 4 MAUTAPAGA 4 ENDE 1982 270 5 MAUTAPAGA 5 ENDE 1978 536 6 MAUTAPAGA 6 ENDE 1997 1100 7 MAUTAPAGA 7 ENDE 1997 1250 8 MAUTAPAGA 8 ENDE 1997 1250 9 NDORIWOY 1 ENDE 1984 100
10 NDORIWOY 2 ENDE 1985 100 11 WOLOWARU 1 ENDE 1984 100 12 WOLOWARU 2 ENDE 1996 305 13 WOLOWARU 3 ENDE 1997 560 14 MAUROLE 1 ENDE 1987 40 15 MAUROLE 2 ENDE 1992 20 16 MAUROLE 3 ENDE 1994 20 17 NDETUNDORA 1 ENDE 1993 20 18 KOTA BUA 1 ENDE 1993 20 19 KOTA BUA 2 ENDE 1993 20 20 KOTA BUA 3 ENDE 1992 20 21 WELAMOSA 1 ENDE 1994 20 22 WELAMOSA 2 ENDE 1994 20 23 WELAMOSA 3 ENDE 1994 20 24 WELAMOSA 4 ENDE 1995 20 25 WELAMOSA 5 ENDE 1975 104 26 RAPORENDU 1 ENDE 1995 20 27 RAPORENDU 2 ENDE 1994 20 28 KABIRANGGA 1 ENDE 1995 20 29 KABIRANGGA 2 ENDE 1991 20 30 KABIRANGGA 3 ENDE 1987 20 31 WONDA 1 ENDE 1999 40 32 WONDA 2 ENDE 1994 20 33 WOLOWARANG 1 ENDE 1986 561 34 WOLOWARANG 2 ENDE 1986 561 35 WOLOWARANG 3 ENDE 1986 561 36 WOLOWARANG 4 ENDE 1984 1050 37 WOLOWARANG 5 ENDE 1996 500 38 WOLOWARANG 6 ENDE 1997 560 39 WOLOWARANG 7 ENDE 1997 250 40 WOLOWARANG 8 ENDE 1997 1200

40
NO NAME OF DIESEL
POWER PLANT BRANCH
START OPERATION
CAPACITY (KW)
41 WOLOWARANG 9 ENDE 1997 1200 42 BOLA 1 ENDE 1987 20 43 PEMANA 1 ENDE 1992 20 44 PEMANA 2 ENDE 1992 20 45 PEMANA 3 ENDE 1995 20 46 PEMANA 4 ENDE 1988 40 47 PEMANA 5 ENDE 1994 20 48 PEMANA 6 ENDE 1992 20 49 RUBIT 1 ENDE 1994 20 50 RUBIT 2 ENDE 1994 20 51 TALIBURA 1 ENDE 1987 20 52 WAEGATE 1 ENDE 1993 20 53 WAEGATE 2 ENDE 1993 20 54 WAEGATE 3 ENDE 1994 20 55 WAEGATE 4 ENDE 1993 100 56 NEBE 1 ENDE 1994 20 57 NEBE 2 ENDE 1994 20 58 MAGEPANDA 1 ENDE 1994 20 59 MAGEPANDA 2 ENDE 1994 20 60 MAGEPANDA 3 ENDE 1999 20 61 LARANTUKA 1 ENDE 1978 336 62 LARANTUKA 2 ENDE 1982 270 63 LARANTUKA 3 ENDE 1978 336 64 LARANTUKA 4 ENDE 1978 336 65 LARANTUKA 5 ENDE 1994 500 66 LARANTUKA 6 ENDE 1997 560 67 LARANTUKA 7 ENDE 1998 560 68 LEBATUKAN 1 ENDE 1997 160 69 LEBATUKAN 2 ENDE 1993 100 70 LEBATUKAN 3 ENDE 1996 305 71 LEBATUKAN 4 ENDE 1997 560 72 ADONARA TIMUR 1 ENDE 1994 250 73 ADONARA TIMUR 2 ENDE 1996 305 74 ADONARA TIMUR 3 ENDE 1993 100 75 ADONARA TIMUR 4 ENDE 1997 560 76 HADAKEWA 1 ENDE 1994 20 77 ADONARA BARAT 1 ENDE 1987 20 78 ADONARA BARAT 2 ENDE 1989 40 79 ADONARA BARAT 3 ENDE 1993 100 80 BORU 1 ENDE 1985 100 81 BORU 2 ENDE 1997 40

41
NO NAME OF DIESEL
POWER PLANT BRANCH
START OPERATION
CAPACITY (KW)
82 ILEAPE 1 ENDE 1988 20 83 SOLOR TIMUR 1 ENDE 1989 20 84 SOLOR TIMUR 2 ENDE 1989 20 85 SOLOR TIMUR 3 ENDE 1996 100 86 SOLOR TIMUR 4 ENDE 1984 100 87 SOLOR TIMUR 5 ENDE 1996 100 88 WITIHAMA 1 ENDE 1992 20 89 WITIHAMA 2 ENDE 1993 20 90 WITIHAMA 3 ENDE 1996 20 91 NAGAWUTUN 1 ENDE 1993 20 92 NAGAWUTUN 2 ENDE 1993 20 93 SOLOR BARAT 1 ENDE 1994 20 94 SOLOR BARAT 2 ENDE 1994 20 95 OMESURI 1 ENDE 1994 20 96 OMESURI 2 ENDE 1994 20 97 OMESURI 3 ENDE 1991 20 98 OMESURI 4 ENDE 1993 100 99 ILEBOLANG 1 ENDE 1995 20 100 ILEBOLANG 2 ENDE 1995 20 101 LEWOLAGA 1 ENDE 1995 20 102 TANJUNG BUNGA 1 ENDE 1995 20 103 TANJUNG BUNGA 2 ENDE 1997 20 104 TANJUNG BUNGA 3 ENDE 1994 20 105 BAJAWA 1 ENDE 1982 100 106 BAJAWA 2 ENDE 1979 346 107 BAJAWA 3 ENDE 1981 160 108 BAJAWA 4 ENDE 1987 250 109 BAJAWA 5 ENDE 1996 560 110 BAJAWA 6 ENDE 1996 560 111 BAJAWA 7 ENDE 1984 220 112 BAJAWA 8 ENDE 1986 250 113 BAJAWA 9 ENDE 1986 250 114 BAJAWA 10 ENDE 1979 560 115 BAJAWA 11 ENDE 1993 100 116 BAJAWA 12 ENDE 1987 20 117 BAJAWA 13 ENDE 1986 250 118 BOAWAE 1 ENDE 1984 100 119 BOAWAE 2 ENDE 1996 100 120 BOAWAE 3 ENDE 1994 120 121 BOAWAE 4 ENDE 1984 100 122 SAWU 1 ENDE 1979 110
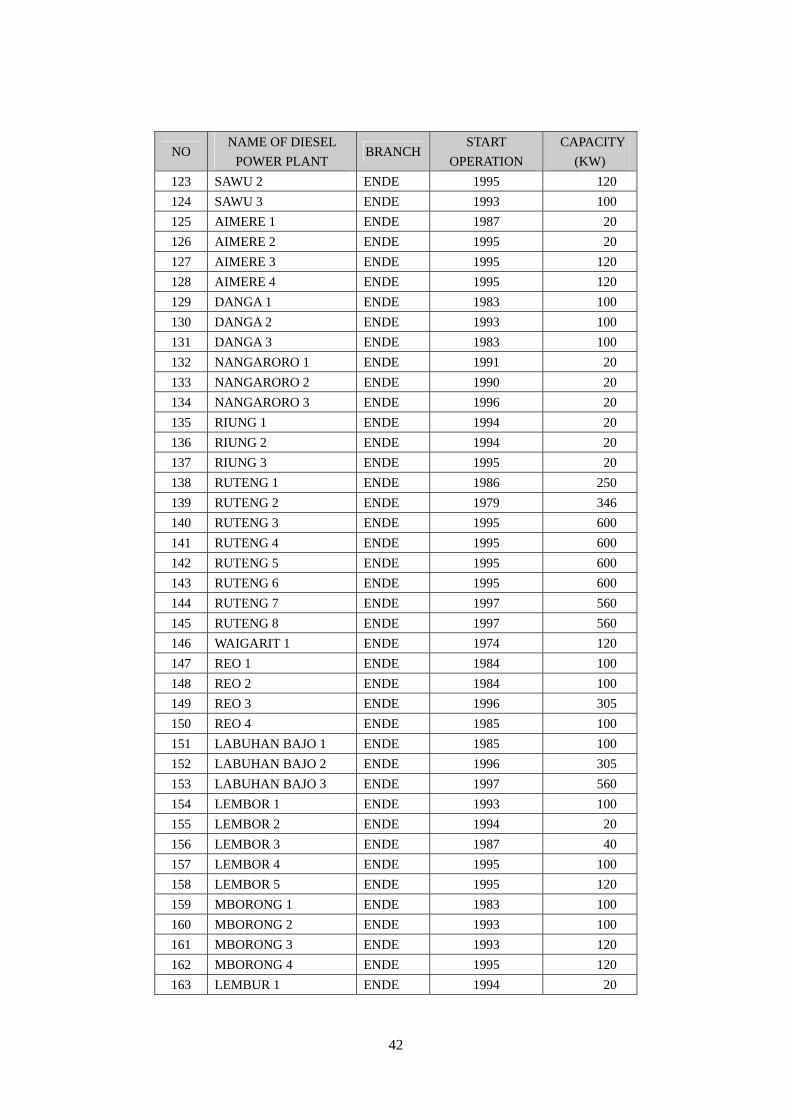
42
NO NAME OF DIESEL
POWER PLANT BRANCH
START OPERATION
CAPACITY (KW)
123 SAWU 2 ENDE 1995 120 124 SAWU 3 ENDE 1993 100 125 AIMERE 1 ENDE 1987 20 126 AIMERE 2 ENDE 1995 20 127 AIMERE 3 ENDE 1995 120 128 AIMERE 4 ENDE 1995 120 129 DANGA 1 ENDE 1983 100 130 DANGA 2 ENDE 1993 100 131 DANGA 3 ENDE 1983 100 132 NANGARORO 1 ENDE 1991 20 133 NANGARORO 2 ENDE 1990 20 134 NANGARORO 3 ENDE 1996 20 135 RIUNG 1 ENDE 1994 20 136 RIUNG 2 ENDE 1994 20 137 RIUNG 3 ENDE 1995 20 138 RUTENG 1 ENDE 1986 250 139 RUTENG 2 ENDE 1979 346 140 RUTENG 3 ENDE 1995 600 141 RUTENG 4 ENDE 1995 600 142 RUTENG 5 ENDE 1995 600 143 RUTENG 6 ENDE 1995 600 144 RUTENG 7 ENDE 1997 560 145 RUTENG 8 ENDE 1997 560 146 WAIGARIT 1 ENDE 1974 120 147 REO 1 ENDE 1984 100 148 REO 2 ENDE 1984 100 149 REO 3 ENDE 1996 305 150 REO 4 ENDE 1985 100 151 LABUHAN BAJO 1 ENDE 1985 100 152 LABUHAN BAJO 2 ENDE 1996 305 153 LABUHAN BAJO 3 ENDE 1997 560 154 LEMBOR 1 ENDE 1993 100 155 LEMBOR 2 ENDE 1994 20 156 LEMBOR 3 ENDE 1987 40 157 LEMBOR 4 ENDE 1995 100 158 LEMBOR 5 ENDE 1995 120 159 MBORONG 1 ENDE 1983 100 160 MBORONG 2 ENDE 1993 100 161 MBORONG 3 ENDE 1993 120 162 MBORONG 4 ENDE 1995 120 163 LEMBUR 1 ENDE 1994 20

43
NO NAME OF DIESEL
POWER PLANT BRANCH
START OPERATION
CAPACITY (KW)
164 BENTENG JAWA 1 ENDE 1994 20 165 BENTENG JAWA 2 ENDE 1994 20 166 GOLOWELU 1 ENDE 1994 20 167 POTA 1 ENDE 1995 20 168 POTA 2 ENDE 1995 20 169 POTA 3 ENDE 1994 20 170 PAGAL 1 ENDE 1994 20 171 PAGAL 2 ENDE 1996 40 172 PAGAL 3 ENDE 1996 100 173 PAGAL 4 ENDE 1997 40

44
0 200 400 600 800 1000 1200
Maluku & North Maluku
West Nusa Tenggara
East Nusa Tenggara
Total of Eastern Region
Energy Sold (GWh)
Residential Industrial Business Social Government Street Lighting
Installed Capacity (2006)
1.9%
24.0%
74.1%
Eastern Region Other Outside Jawa Jawa- Bali
Energy Sold (2006)
1.0%
21.8%
77.2%
Eastern Region Other Outside Jawa Jawa- Bali
(Source:PLN Statistics 2006)
Fig. 2-2 Electricity Demand and Supply Situation in Eastern Provinces (2006)
(Source:PLN Statistics 2006) Fig. 2-3 Electricity Sales in Eastern Provinces (2006)
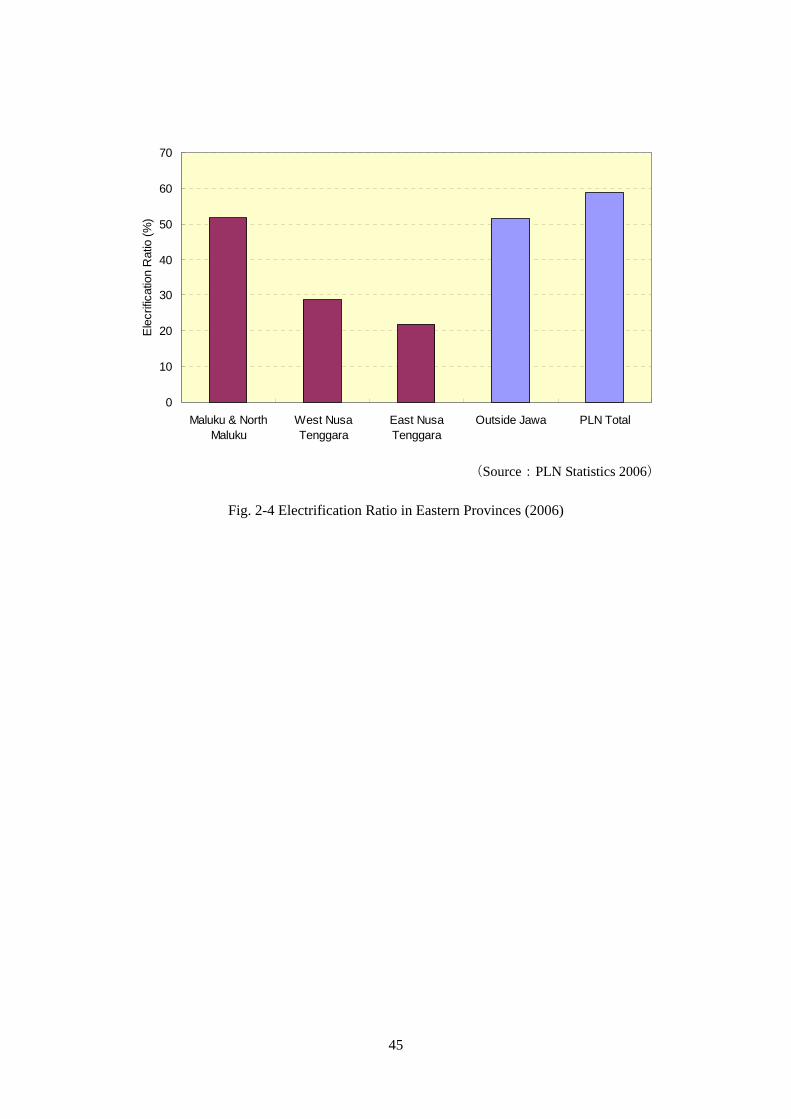
45
0
10
20
30
40
50
60
70
Maluku & NorthMaluku
West NusaTenggara
East NusaTenggara
Outside Jawa PLN Total
Ele
crific
atio
n R
atio
(%)
(Source:PLN Statistics 2006)
Fig. 2-4 Electrification Ratio in Eastern Provinces (2006)

46
Maluku & N. Muluku System
Item Unit 2006(Act.) 2012 2016 2020 2025Energy Demand GWh 345 353 441 571 796
Growth - 0.4% 2.5% 3.7% 4.5%Annual Road Factor % 54% 55% 55% 55%Energy Generation GWh 382 394 488 633 881Peak Power Demand MW 83 83 102 132 184 Growth - 0.1% 2.1% 3.4% 4.3%Required Generation Capacity MW 197 116 142 185 257
NTB System Item Unit 2006(Act.) 2012 2016 2020 2025Energy Demand GWh 508 868 1,215 1,639 2,300
Growth - 9.3% 9.1% 8.7% 8.3%Energy Generation GWh 579 964 1,361 1,901 2,783Peak Power Demand MW 116 239 331 426 568 Growth - 12.8% 11.1% 9.7% 8.7%Required Generation Capacity MW 150 359 480 618 795
NTT System Item Unit 2006(Act.) 2012 2016 2020 2025Energy Demand GWh 282 496 678 859 1,316
Growth - 9.8% 9.1% 8.3% 8.4%Energy Generation GWh 313 550 759 996 1,592Peak Power Demand MW 72 131 177 214 313 Growth - 10.6% 9.4% 8.1% 8.1%Required Generation Capacity MW 123 196 256 300 439
Eastern Region TotalItem Unit 2006(Act.) 2012 2016 2020 2025Energy Demand GWh 1,135 1,717 2,334 3,069 4,412
Growth - 7.1% 7.5% 7.4% 7.4%Energy Generation GWh 1,273 1,908 2,608 3,530 5,256Peak Power Demand MW 270 453 610 772 1,065 Growth - 9.0% 8.5% 7.8% 7.5%Required Generation Capacity MW 469 671 878 1,103 1,491
Table 2-10 Electricity Demand Outlook in Eastern Provinces (Note : The projections during 2012-2025 are based on RUKN 2005)

47
Peak Demand and Energy Demand Outlook(Eastern Region Total)
0
1,000
2,000
3,000
4,000
5,000
6,000
2007
2008
2009
2010
2011
2012
2013
2014
2015
2016
2017
2018
2019
2020
2021
2022
2023
2024
2025
Ener
gy D
eman
d (G
Wh)
0
200
400
600
800
1,000
1,200
Pea
k D
eman
d (M
W)
Energy Demand Peak Power Demand
Peak Demand (MW) Outlook
0
200
400
600
800
1,000
1,200
2007
2008
2009
2010
2011
2012
2013
2014
2015
2016
2017
2018
2019
2020
2021
2022
2023
2024
2025
Pea
k D
eman
d (M
W)
Maluku & North Maluku West Nusa Tenggera East Nusa Tenggera
(Source:MEMR RUKN2005) Fig. 2-5 Electricity Demand Outlook in Eastern Provinces

48
Installed Capacity of PLN Total (2006)
3,529
8,220
2,727
7,021
807
2,941
120
1,000
2,000
3,000
4,000
5,000
6,000
7,000
8,000
9,000
Hyd
ro
Stea
m
Gas
turbi
ne
Combin
ed C
ycle
Geo
therm
al
Dies
el
Others
Inst
alle
d C
apac
ity (M
W)
(Source:PLN Statistics 2006) Fig. 2-6 Installed Capacity of PLN (2006)

49
Installed Capacity Mix of PLN (2006)
14%
32%
11%
28%
3%
12% 0%
Hydro Steam Gas turbine Combined Cycle Geothermal Diesel Others
Installed Capacity Mix of Eastern Region (2006)
100%
Hydro Steam Gas turbine Combined Cycle Geothermal Diesel Others
(Source:PLN Statistics 2006) Fig. 2-7 Comparison of Power Plant Mix between Whole Nation and Eastern Provinces (2006)

50
Increase of Diesel Generaiton Cost and Diesel Fuel Price
0.07 0.09
0.150.20 0.20
0.29
0.62
2.7
4.0
9.28.2
7.5
9.5
17.8
0.00
0.10
0.20
0.30
0.40
0.50
0.60
0.70
0.80
0.90
1.00
2000 2001 2002 2003 2004 2005 2006
Die
sel Fuel Price (
US$/lit
ter)
0.0
2.0
4.0
6.0
8.0
10.0
12.0
14.0
16.0
18.0
20.0
Die
sel G
enera
tion C
ost
(centU
S$/kW
h)
HSD Price (LHS) Diesel Gen Cost (RHS)
Generation Cost of PLN (2006)
0.0
5.0
10.0
15.0
20.0
25.0
Hydro Steam Diesel Gas Turbine Geothermal CombinedCycle
Cen
tsU
S$/k
Wh
Fuel Maintemnance Depreciation Other Expenses Personnel
1.6 ¢/kWh
9.7 ¢/kWh
6.3 ¢/kWh
21.9¢/kWh
17.8¢/kWh
4.3 ¢/kWh
(Source:PLN Statistics 2006) Fig. 2-8 Increase of Diesel Generation Cost and Diesel Fuel Price
(Source: PLN Statistics 2006)
Fig. 2-9 Generation Cost by Energy Type (2006)

51
WTI Spot Price (FOB)
0
10
20
30
40
50
60
70
80
1986
1987
1988
1989
1990
1991
1992
1993
1994
1995
1996
1997
1998
1999
2000
2001
2002
2003
2004
2005
2006
2007
US
Dol
lar p
er B
arre
l
(Source:USDOE http://tonto.eia.doe.gov/dnav/pet/hist/rwtca.htm)
Fig. 2-10 International Oil Price

52
Item Maluku &North Maluku
West NusaTenggara
East NusaTenggara
EasternRegion Total Remarks
Installed Capacity (MW) (a) 196.7 149.7 123.0 469.3 as of 2006Peak Load (MW) (b) 82.7 116.0 71.6 270.4 - ditto -Energy Production by Diesel (GWh) (c) 381.5 579.2 309.6 1,270.3 - ditto -Fuel Consumption by Diesel (kl) (d) 105,857 152,546 88,632 347,034 - ditto -Specific Fuel Consumption by Diesel (l/kWh) (e) 0.277 0.263 0.286 0.273 - ditto -Cost of Diesel Fuel (m$) (f) 99.1 142.8 83.0 324.8 (d) x @0.936 $/l
Alternative Geothermal Capacity (MW) (g) 27.3 38.3 23.6 89.2 '= Minimum Demand ((b) x 33%)Alternative Geothermal Generation (GWh) (i) 239.2 335.3 207.1 781.6 (g) x 8,760hAlternative Geothermal Generation Share (%) (j) 62.7% 57.9% 66.9% 61.5% (i)/(c)Fuel to be saved by Geothermal (kl) (k) 66,361 88,324 59,285 213,527 (d) x (j)Value of Fuel to be Saved (m$) (l) 62.1 82.7 55.5 200.3 (k) x @0.936 $/l(Source: PLN Statistics 2006)
Table 2-11 Estimation of Geothermal Development Effect in Eastern Provinces

53
Demand Curve in Flores Island and Best Mix of Energy Sources (Maximum Demand Day in August 2005)
0.0
2.0
4.0
6.0
8.0
10.0
12.0
14.0
16.0
18.0
20.0
0:00
1:00
2:00
3:00
4:00
5:00
6:00
7:00
8:00
9:00
10:00
11:00
12:00
13:00
14:00
15:00
16:00
17:00
18:00
19:00
20:00
21:00
22:00
23:00
Load
(MW
)
Minimum Demand5.8MW at 8:30
Maximum Demand17.8MW at 19:00
Base Load SupplierGeothermal
Peak Load SupplierDeisel
Fig. 2-11 Concept of Best Energy Mix in Eastern Provinces

54
Chapter 3 Geothermal Resources in Eastern Indonesia
3.1 Overview of Geothermal Resources in Eastern Indonesia
Indonesia is made up of more than 17,000 islands. Located in the western side of Circum Pacific Volcanic Belt, this country is blessed with abundant geothermal resources (S. Suryantoro et al., 2005). The 253 geothermal areas have been identified in Indonesia. The total potential is estimated as approximately 27,791 MW (DGMCG, 2005). The 170 areas of Indonesia have high temperature geothermal resources, and 21 areas of high temperature geothermal systems with electricity-generating capabilities exist and are being developed. These 21 areas are: Sibayak, Salak, Wayang Windu, Kamojang, Darajat, Lahendong, and Dieng, where resources are used for electricity generation of 857 MWe operated by PT. PERTAMINA. Sallura, Sungai Penuh, Hulu Lais Tambang Sawah, Lumut Balai, Ulubelu, Kawah Cibuni, Patuha, Karaha, Iyang Argopuro, Bedugul, and Kotamobagu, whose resources have not been used for electricity so far, and currently are under developing by PT. PERTAMINA own or with its contractors for electricity generation. Tulehu, Mataloko, and Ulumbu, which are outside of PERTAMINA’s activities, are operated by PT. PLN. All the high temperature systems are found within the Sumatra, Java, Sulawesi, and Eastern Island Volcanic Zone, which lies over an active subduction zone in western side of Circum Pacific Volcanic Belt.
In the eastern Indonesia (Nusa Tenggara and Maluku provinces), 37 geothermal fields were identified by DGMCG (2005), which total potential was estimated as 1,914 MW (Figs. 3-1 to 3-4, Table 3-1). JICA (2007) conducted the Master Plan Study for geothermal resource development in Indonesia. The objective fields of the JICA study were selected as seventy three (73) promising geothermal fields which include eleven (11) geothermal fields in the eastern provinces: Huu Daha, Wai Sano, Ulumbu, Bena-Mataloko, Sokoria-Mutubusa, Oka-Larantuka, Ili Labaleken, Atadei, Tonga Wayana, Tulehu and Jailolo.
However, because of the lack of sufficient geoscientific data, only 9 fields among the 11 fields in the eastern Indonesia were evaluated in terms of resource characteristics and capacity in the JICA study (Fig. 3-5 and Table 3-1).
3.2 Present Exploration Status in Eastern Indonesia
Only two fields in the eastern provinces (Nusa Tenggara and Maluku provinces), Ulumbu and Mataloko have been studied by well-drilling to confirm reservoir conditions. Promising geothermal resources were confirmed by well discharges from high temperature reservoir. The other fields have been investigated at various levels commensurate with the development prospect of each field.

55
As mentioned above, detailed surface exploration study and well drillings have been done in Ulumbu and Mataloko, and the existence of geothermal reservoir was confirmed. In 9 fields, Huu Daha, Wai Sano, Ulumbu, Bena-Mataloko, Sokoria-Mutubusa, Oka-Larantuka, Atadei, Tulehu and Jailolo, some geoscientific data of reconnaissance studies are published in websites of VSI and JICA (2007) and published papers.
Except of 9 fields as listed above, exploration statuses were not clarified because available geoscientific data in these fields could not be obtained in this study. However, it is supposed that these geothermal fields are at the initial stages of exploration in geothermal development. In these fields, geoscientific studies or existing data collection for clarification of characteristics and structure of the geothermal resources should be conducted.
The current practical plans for geothermal development/expansion projects were confirmed through interviews during a mission trip to Indonesia. In the two fields (Ulumbu and Mataloko), small-scale power developments have been planned by PT. PLN. In addition, PT. PLN has actual plan of resource development in Hu’u Daha, Jailolo, Tolehu and Sembaiun (Table 3-2).
As shown in Table 3-2, JICA (2007) assessed geothermal resource characteristics in each of 73 promising fields (70 fields originally planned by JICA plus 3 fields proposed by CGR). However, because of the lack of sufficient geoscientific data, only 50 fields among the 73 fields could be evaluated in terms of resource characteristics and capacity. For geothermal resource evaluation relating to development priority, JICA (2007) assessed the likelihood of the presence of a geothermal reservoir accompanied by high enthalpy fluids. The evaluated fields were classified into 4 ranks listed below according to the likelihood of reservoir presence.
1 :The reservoir is ascertained by well drilling(s) (including already developed fields).
2 :The existence of a reservoir is inferred mainly from appropriate geothermometry using chemical data concerning hot springs and fumarolic gases; The presence of a reservoir is extremely likely.
3 :The existence of a reservoir is inferred from a variety of geoscientific information, including geological and geophysical survey data and the occurrence of high temperature manifestations.
Low :The presence of a reservoir is unlikely; or if there is one, only a low temperature reservoir may exist. (However, the possibility of a power plant project utilizing low enthalpy fluids remains.)
In addition to the 4 ranks given above, geothermal fields where sufficient geoscientific data is not available were classified as ‘NE’.

56
As a results of JICA study, Ulumbu and Mataloko are classified as Rank A, Hu’u Daha, Wai Sano, Sukoria, Oka-lle Ange, Atadei, Jailolo and Tolehu as Rank C and Tonga Wayaua and Ili Labaleken as ‘NE’ (Table 3-2).
3.3 Necessary Study for Future Geothermal Resource Development
As described above, many geothermal fields exist in the eastern provinces. However, except for Ulumbu and Mataloko, the present status of geothermal resources development is still reconnaissance study level. These data allow estimating probable prospect area and probable heat source, and also allow establishing the sequence and geoscientific methods to use in the next stages of development. However, the data and information of geology, geochemistry and geophysics in the fields are not enough to make geothermal reservoir model and to evaluate generation power capacity of their fields. Therefore, geoscientific studies for clarification of characteristics and structure of the geothermal resources should be conducted as resource feasibility study in the fields in the eastern provinces except for Ulumbu and Mataloko. After the geoscientific surface study, exploratory well drilling and well test should be conducted to confirm geothermal resource existence and to evaluate its capacity.
A description of the surface thermal activity, estimated resource potential (MW) and the exploration status of the above mentioned 9 geothermal fields in the eastern provinces are given in Chapter 3.4.

57
Fig. 3-1 Map of Geothermal Area in West Nusa Tenggara (DGMCG, 2005)
Fig. 3-2 Map of Geothermal Area in West East Nusa Tenggara (DGMCG, 2005)

58
Fig. 3-3 Map of Geothermal Area in North Maluku (DGMCG, 2005)
Fig. 3-4 Map of Geothermal Area in Maluku (DGMCG, 2005)

IIbbooii--JJaabbooii 2200MMWW SSeeuullaawwaahh AAggaamm 660000MMWW
LLaauu DDeebbuukk--DDeebbuukk // SSiibbaayyaakk 116600MMWW
SSaarruullaa –– SSiibbuuaall BBuuaallii 666600MMWW
SS.. MMeerraappii –– SSaammppuurraaggaa 550000MMWW
SSiippaahhoolloonn –– TTaarruuttuunngg 5500MMWW
MMuuaarraallaabbuuhh 224400MMWW
GG.. TTaallaanngg 3300MMWW
SSuunnggaaii PPeennuuhh 335555MMWW LLeemmppuurr // KKeerriinnccii 6600MMWW
BB.. GGeedduunngg HHuulluu LLaaiiss // TTaammbbaanngg SSaawwaahh 991100MMWW
MMaarrggaa BBaayyuurr 117700MMWW
LLuummuutt BBaallaaii 662200MMWW
SSuuoohh AAnnttaattaaii –– GG.. SSeekkiinnccaauu 990000MMWW
RRaajjaabbaassaa 112200MMWW
WWaaii RRaattaaii 112200MMWW
UUlluubbeelluu 444400MMWW
KKaammoojjaanngg 332200MMWW
CCoossoollookk –– CCiissuukkaarraammee 118800MMWW
CCiittaammaann –– GG.. KKaarraanngg 2200MMWW
GG.. SSaallaakk 550000MMWW
DDaarraajjaatt 333300MMWW
GG.. WWaayyaanngg -- WWiinndduu 440000MMWW GG.. PPaattuuhhaa 550000MMWW
GG.. KKaarraahhaa –– GG.. TTeellaaggaabbooddaass 440000MMWW
TTaannggkkuubbaannppeerraahhuu 2200MMWW
DDiieenngg 440000MMWW TTeelloommooyyoo 5500MMWW
UUnnggaarraann 118800MMWW WWiilliiss // NNggeebbeell 112200MMWW
IIjjeenn 112200MMWW
BBeedduugguull 333300MMWW
HHuu’’uu DDaahhaa 111100MMWW
UUlluummbbuu 115500MMWW WWaaii SSaannoo 5500MMWW BBeennaa –– MMaattaallookkoo 3300MMWW
SSookkoorriiaa –– MMuuttuubbuussaa 9900MMWW
OOkkaa –– LLaarraannttuukkaa 9900MMWW AAttaaddeeii 5500MMWW
LLaahheennddoonngg -- TToommppaassoo 338800MMWW KKoottaammoobbaagguu 222200MMWW
SSuuwwaawwaa –– GGoorroonnttaalloo 113300MMWW
MMeerraannaa 220000MMWW
TTuulleehhuu 4400MMWW
JJaaiilloolloo 4400MMWW
Fig. 3-5 Map Showing the Resource Potential in Promising Geothermal Fields (JICA, 2007)
: Presence of concrete plan for development or expansion : Possible additional or new power capacity for development
LLuummuutt BBaallaaii ((ggrreeeenn)) :: PPEERRTTAAMMIINNAA WWoorrkkiinngg AArreeaa MMuuaarraallaabbuuhh ((wwhhiittee)) :: OOppeenn FFiieelldd
SUMATRA 5,955 MW
JAVA-BALI 3,870 MW
NUSA TENGGARA 570 MW
SULAWESI 930 MW
MALUKU 80 MW
Objective Area
59

JICA Master PlanStudy (2007)
Spec. Hypo. Possible Probable Proven
161 Sembaiun East Lombok - - 39 - - -162 Marongge Sumbawa Besar - 6 - - - -163 Huu-Daha Dompu - - 69 - - - 110
0 6 108 0 0
164 Wai Sano Manggarai - 90 33 - - - 50165 Ulumbu Manggarai - - 187.5 - 12.5 - 150166 Wal Pesi Manggarai - - 54 - - -167 Gou-Inelika Ngada - 28 - - - -168 Mengeruda Ngada - 5 - - - -169 Mataloko Ngada - 10 63.5 - 1.5 - 30170 Komandaru Ende - 11 - - - -171 Ndetusoko Ende - - 10 - - -172 Sukoria Ende - 145 25 - - - 90173 Jopu Ende - - 5 - - -174 Lesugolo Ende - - 45 - - -175 Oka-Ile Ange East Flores - - 40 - - - 90176 Atadei Lembata - - 40 - - - 50177 Bukapiting Alor - - 27 - - -178 Roma-Ujeiewung Lembata - 16 6 - - -179 Oyang Barang East Flores - - 37 - - -180 Sirung (Isiabang-Kuriaii) Alor 100 48 - - - -181 Adum Lembata - - 36 - - -182 Alor Timur Alor 190 - - - - -
- Ili Labaleken - - - - - - - NE290 353 609 0 14
237 Mamuya North Halmahera - 7 - - - -238 Ibu West Halmahera 25 - - - - -239 Akelamo North Halmahera 25 - - - - -240 Jailolo West Halmahera - - 42 - - - 40241 Keibesi West Halmahera 25 - - - - -242 Akesahu Tidore - - 25 - - -243 Indari South Halmahera 25 - - - - -244 Labuha South Halmahera 25 - - - - -245 Tonga Wayaua South Halmahera - 110 - - - - NE
125 117 67 0 0
246 Larike Ambon 25 - - - - -247 Taweri Ambon 25 - - - - -248 Tolehu Ambon - - 100 - - - 40249 Oma Haruku Central Maluku 25 - - - - -250 Saparua Central Maluku 25 - - - - -251 Nusa Laut Central Maluku 25 - - - - -
125 0 100 0 0
540 476 884 0 14
Exploitable ResourcePotential (MW)
Installed(MW)
Regency/CityAreaNo
DGMCG (2005)
6 108Sub Total (MW)114
1100
Sub Total (MW) 643 6231266
0 460
0 40
Maluku
Sub Total (MW) 242 67309
Table 3-1 Geothermal Resource Potential (MW) in Eastern Indonesia
West Nusa Tenggara
East Nusa Tenggara
Total (MW) 1016 8981914
0 40
North Maluku
Not studied in JICA (2007)
Resources (MW) Reserve (MW)
0 650
Sub Total (MW) 125 100225
60

61
Table 3-2 Present Status of geothermal resource development in Eastern Indonesia
161 Sembaiun East Lombok ○162 Marongge Sumbawa Besar163 Huu-Daha Dompu ○ C
164 Wai Sano Manggarai C165 Ulumbu Manggarai ○ ○ A166 Wal Pesi Manggarai167 Gou-Inelika Ngada168 Mengeruda Ngada169 Mataloko Ngada ○ ○ A170 Komandaru Ende171 Ndetusoko Ende172 Sukoria Ende C173 Jopu Ende174 Lesugolo Ende175 Oka-Ile Ange East Flores C176 Atadei Lembata C177 Bukapiting Alor178 Roma-Ujeiewung Lembata179 Oyang Barang East Flores
180 Sirung(Isiabang-Kuriaii) Alor
181 Adum Lembata182 Alor Timur Alor
237 Mamuya North Halmahera238 Ibu West Halmahera239 Akelamo North Halmahera240 Jailolo West Halmahera ○ C241 Keibesi West Halmahera242 Akesahu Tidore243 Indari South Halmahera244 Labuha South Halmahera245 Tonga Wayaua South Halmahera N
246 Larike Ambon247 Taweri Ambon248 Tolehu Ambon ○ C249 Oma Haruku Central Maluku250 Saparua Central Maluku251 Nusa Laut Central Maluku
- Ili Labaleken *3 Lembata N
*1: Area Number defined by DGMCG (2005)
*2: Development Priolity defined by JICA (2007) A Existing Power Plant or Existing Epansion/Development Plan
B High Possibiity of Existing Geothermal Reservoir
C Medium Possibility of Existing Geothermal Reservoir
L Low Possibility of Existing Geothermal Reservoir
N Not Enough Data for Evaluation
*3: Ili Labaleken is located in Lembata, but the field number defined by DGMCG (2005) is unclear.
No. *1 Regency/CityArea
Confirmation ofgeothermal
reservoir by welldrilling
West Nusa Tenggara
East Nusa Tenggara
North Maluku
Maluku
DevelopmentPriolity definedby JICA (2007)
*2
ExistDevelopmentPlan by PLN

62
3.4 Geothermal Resources in Each Fields
Following are the review of geothermal resources in each field based on the data of VSI, JICA (2007) and published papers.
3.4.1 HU’U DAHA
The Hu’u Daha geothermal area is located in the southeastern part of the middle Sumbawa Island. Most thermal features occur in an area surrounding the NW-SE trending fault (Fig. 3-6). The surface features presumably indicate the potency of geothermal resources beneath the area. These features include hot springs, fumaroles and altered rocks. The distribution of the surface features occurs at elevations between 90 to 500 m above sea level, and the temperatures are between 37 and 80° C. Geological, geochemical and geophysical surveys recognized a geothermal prospect area located in the up-flow system of the Hu’u geothermal area. The prospects covers an area of about 10 km2 recognized by mercury and CO2 rich- distribution (H. Sundhoro, et al. 2008).
Surface geoscientific surveys (geological, geochemical and geophysical surveys) have been carried out by CGR. The resource potential is estimated as 110 MW by JICA (2007). The geoscientific description in Hu’u Daha is published by the Volcanological Survey in Indonesia (VSI) and published papers. Based on the description, geoscientific data in Hu’u Daha is reviewed as follows.
Geology: The geology of the Hu’u Daha area is dominated by Miocene, predominantly andesitic, volcanic and volcanoclastic rocks. Dacites and some andesitic intrusives occur to the north of the thermal area but there is no clear heat source for the system. The active volcano of Sangeang Api is 90 km to the north of Huu with an older chain of Quaternary volcanoes along the north coast of Sumbawa about 45 km distant (R. D. Johnstone, 2005).
Surface geothermal manifestations and Geochemistry: The Hu’u Daha has a number of thermal features. They surround Doro Toki - Doro Pure volcanic complex and consist of warm and hot springs and fumaroles, and some hot or old altered ground. Fumaroles exist at two locations: at approximately 500 m.a.s.l. in the Sungai Neangga river valley on the southwestern slopes of Doro Pure, and at Limea at 100 m.a.s.l. on the southern slopes of the same mountain. The valley floor is strongly altered and there are a number of sulphur deposits. The hottest springs also occur at Limea, close to the shoreline. Temperatures range between 81oC and 86oC, flows are low (<0.3 l/sec) and the waters have properties expected in sulphate- chloride outflows. There may be some interference from sea water but the analytical quality is not good enough for any definite ideas to be formed. All the other hot springs are at 40oC or less and are grouped in three locations. The hottest occur on
63
the western slopes of Doro Pure in the Sungai Huu river valley and on the northwestern slopes of Doro Toki. The Huu hot springs occur at 100 m.a.s.l. and are neutral bicarbonate waters. Flows are similar to those at Limea. Some iron oxide deposits and carbonate sinters exist surround the springs. The springs at Daha are also low flow, neutral bicarbonate waters with temperatures approximating 40oC. They all occur at approximately 300 m.a.s.l. and have similar chemistries, allowing for the standard of analysis. The third set of springs occurs at Parado where temperatures approximate 30oC, flows are around 1.5 kg/sec and the waters are of bicarbonate type. Chloride content levels are lower than those at Daha or Huu and the pH is more alkaline (7.5 to 8) (based on description of VSI).
Geophysics: A Schlumberger resistivity survey was carried out during 1984 on part of the southern area of Sumbawa, near the eastern end of the slopes of Doro Pilar (1030 m.a.s.l.) and Doro Puree. The survey comprised 7 parallel lines, averaging 8 km in length, and approximately following constant elevation. The warm springs of Huu and Daha lay within the survey area, and the thermal ground on D.Pure was situated at the southwest end of the lines. No resistivity measurements were made on the south side of the volcanoes, which contain the main thermal manifestation in the prospect (Limea hot springs near the coast). This area can be only accessible by boat. The resistivity measurements comprised overlapping soundings, generally to AB/2=2000m. The results were presented in Andan (1984). An apparent resistivity map at AB/2=1000m was also drawn up for the assessment discussed here. The general pattern on the resistivity maps is decreasing resistivity towards the southwest end of the survey area. However on the lines at lowest elevation, the apparent resistivity increases strongly with increasing AB/2 value (after passing through a relatively shallow zone of low resistivity). At higher elevations (in the southwest), the low resistivity is generally deeper, and on some curves, there is only a marginal increase in resistivity at the largest current spacings (e.g. E 6500). In view of the low resistivity at depth in the young volcanic host rock (<5 ohm-m), the elevated location of the southwest end of line E, and its proximity to the thermal ground on D.Pure, the most interesting part of the prospect probably lies beneath the ridge of D.Pure, or on the south side of D.Pure. The survey lines closest to D.Pilar indicate significantly higher resistivities (typically ~30 ohm-m) at depth, and therefore hot fluids are not expected at depth (i.e. below 1km) in this area (based on description of VSI).
Prospect area: Geological, geochemical and geophysical surveys recognized a geothermal prospect area located in the up-flow system of the Hu’u Daha geothermal area. The prospects covers an area of about 10 km2 recognized by rich distribution of mercury and CO2 (H. Sundhoro et al., 2008).

64
Fig. 3-6 Geothermal area of Hu’u Daha (after J. Brotheridge et al., 2000)
3.4.2 Wai Sano
Wai Sano is a 2.5 km diameter Crater Lake in the center of G. Wai Sano on the SW corner of Flores Island. Surface geoscientific studies (geological, geochemical and geophysical surveys) have been carried out by CGR. The resource potential was estimated as 50 MW by JICA (2007). The geoscientific description in Wai Sano is published by the Volcanological Survey in Indonesia (VSI), JICA (2007) and published papers. Based on the descriptions, geoscientific data in Wai Sano is reviewed as follows.
Geology: G. Wai Sano is an upper Quaternary andesitic volcano resting on the older Quaternary andesites of Pegunungan Geliran. Some pumiceous debris is incorporated in the Wai Sano pyroclastics. Wai Sano is regarded as an older Quaternary volcano since no historic eruptions have been recorded. However, there are many features of the topography suggesting that volcanism is not that old and certainly likely to be less than 1 Ma (Fig. 3-7).
Surface geothermal manifestations and Geochemistry: Thermal activity at Wai Sano is centered on the Crater Lake which is elongated NW–SE and about 3 km long at an elevation of 620 m. The hottest thermal features (98oC) are found along the edges of the lake but associated thermal activity covers an area of about 100 km2. Slightly acidic springs are found at the main Wai Sano thermal area and at Wai Bobok slightly further south on the lake shore. The spring fluids have high salinity attested by the presence of salts encrusting the spring margins. In both these areas the alteration is reminiscent of very acidic fluids and fumarolic activity with sulphur and H2S smell in common. A group of warm bicarbonate type springs occur to the north east of Wai Sano in the Wai Werang and Wai Rancang valleys. About 10 km to the east near the main road is the Namparmacing spring, which has a temperature of 45oC, pH 6 - 7 with only a small outflow. Activity here was much greater in the past with this spring lying within a sinter sheet about 30 by 70 m. About 2 km further

65
NE there is an even more impressive sinter sheet about 250 m long and 100 m wide draping over the river terrace and down the sides of a small gorge into the Wai Rendong river. Only small flow warm springs were present in 1995. The elevation of the boiling springs on the shores of Wai Sano suggests the presence of a significant geothermal reservoir at depth (R. D. Johnstone, 2005).
Contain significant magmatic water, possibly arising from previous volcanic activity near G. Wai Sano. Main fluid flow pattern is from Wai Sano to north and northeast. Spring water geothermometries suggest a reservoir temperature around 200-250oC or higher (JICA, 2007).
Geophysics and Prospect Area: Possible area is defined based on low resistivity zone (Schlumberger <10 ohm-m (AB/2=1000m)). The low resistivity zone coincides with the volcanic crater (D. Sanongoang). There is a possibility that the hydrothermal alterations are developed in the volcanic crater (Fig. 3-8, JICA, 2007).

66
Fig. 3-7 Geological map in Wai Sano (after JICA, 2007)
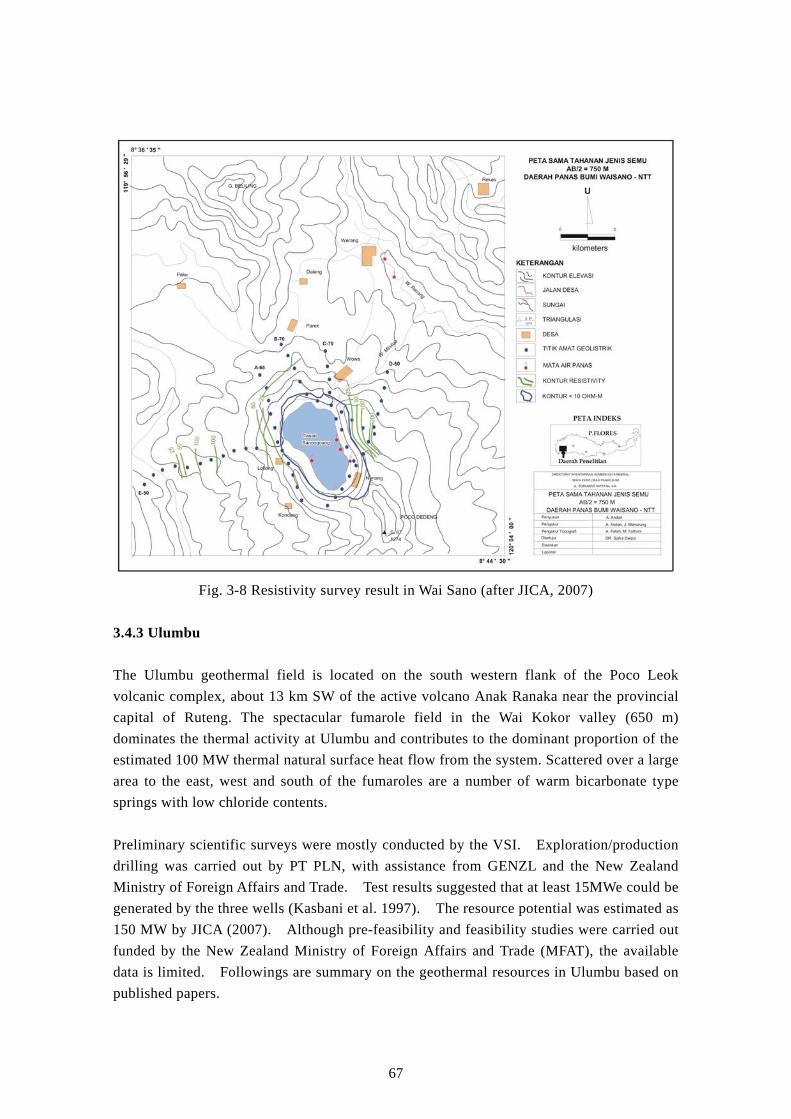
67
Fig. 3-8 Resistivity survey result in Wai Sano (after JICA, 2007)
3.4.3 Ulumbu
The Ulumbu geothermal field is located on the south western flank of the Poco Leok volcanic complex, about 13 km SW of the active volcano Anak Ranaka near the provincial capital of Ruteng. The spectacular fumarole field in the Wai Kokor valley (650 m) dominates the thermal activity at Ulumbu and contributes to the dominant proportion of the estimated 100 MW thermal natural surface heat flow from the system. Scattered over a large area to the east, west and south of the fumaroles are a number of warm bicarbonate type springs with low chloride contents.
Preliminary scientific surveys were mostly conducted by the VSI. Exploration/production drilling was carried out by PT PLN, with assistance from GENZL and the New Zealand Ministry of Foreign Affairs and Trade. Test results suggested that at least 15MWe could be generated by the three wells (Kasbani et al. 1997). The resource potential was estimated as 150 MW by JICA (2007). Although pre-feasibility and feasibility studies were carried out funded by the New Zealand Ministry of Foreign Affairs and Trade (MFAT), the available data is limited. Followings are summary on the geothermal resources in Ulumbu based on published papers.

68
Geology: Flores Island forms part of the Banda Island arc system that comprises Upper Cenozoic volcanic rocks with volcanogenic and carbonate sediments (Hamilton, 1979). The volcanic rocks are dominantly of mafic and intermediate calc-alkaline composition and are unconformably underlain by Tertiary sediments. The oldest rocks exposed are of Middle Miocene age (Koesoemadinata et al., 1981). The Ulumbu field occurs on the southern flank of the Poco Leok volcanic complex and is about 650 m above sea level (KRTMERT, 1989). The youngest rocks outcrop approximately 7 km north of Poco Leok. These are andesites, basaltic andesites, silicic andesites and dacite domes that overlie rocks of the Poco Rii volcano which erupted lavas and breccias, dominated by andesitic to basaltic andesite lithologies. The most recent volcanic event in the region was the 1987 eruption of a dome of silicic andesite - dacite (Anak Ranakah), about 10 km north east of Poco Leok (Sjarifudin & Rakimin, 1988) (Kasbani, et al., 1997).
Surface geothermal manifestations and Geochemistry: Most thermal features in the Ulumbu geothermal field occur over an area of about 28 km2 within the crater and on the western and southwestern flanks of the Poco Leok complex. Features include hot springs, fumaroles, mud pots and steaming ground. The springs are mostly characterized by high concentrations of sulphate, very low chloride content and low pH (-3), but some are of neutral pH - bicarbonate type. No chloride waters discharge at the surface.
Geophysics: Schlumberger resistivity surveys were carried out over the Ulumbu prospect in 1982 and 1985. (Simanjuntak 1982 and 1985). The survey results are summarized in VSI website as follows.
Most of the Schlumberger measurements were in the form of soundings to AB/2=2000 m, along surveyed lines. The lines were concentrated in a 100 km2 area centered on Wai Kokor, although some additional lines were also measured further north (around Ruteng). The surveys appear to have delineated a potential geothermal reservoir area which includes the Wai Kokor thermal area. Significantly, a survey line which extended further east across the Mesir, or Lunggar, "thermal" area indicated generally higher resistivities at depth (10 ohm-m), but low resistivity near-surface. This may mean the Lunggar area is now almost cool, and there is only an alteration zone near surface which is contributing to the low resistivity. It was not possible to ascertain whether or not there is a surface thermal anomaly in this area.
The zone of lowest resistivity appears to be roughly delineated by the 10 ohm-m apparent resistivity contour on the AB/2=1000 m spacing map. The underlying geothermal system probably has a simpler shape than shown by this contour, but the contour may be indicative of the total area of lowest resistivity. This is of the order of 10 km2, but the estimate is clearly poorly controlled in several places, particularly in the region of higher topography to the north. Geographically, the low resistivity anomaly extends to around Wai Mantar in the north, and possibly to Wai Garit in the south. Very low resistivities, which were found at

69
depth 2 km further south, may be influenced by conductive sediments beneath the volcanic pile. The most attractive target area based on geophysical survey results was proposed as the north of the Wai Kokor thermal area, in the region of higher topography.
Exploratory Well Study: Three deep wells were drilled from the same drill pad in 1994 – 1995 less than 100 m away from the fumaroles. One is vertical and the others deviated. The measured temperatures are up to 240°C with a productive steam zone at 750 m (Fig. 3-9, Grant el al., 1997; Kasbani et al., 1997). The deepest well (ULB-01) encountered Quaternary volcanics to a depth of 838 m with Tertiary sediments below this to the well bottom, at 1887 m. ULB-02 is directionally drilled to the NE and was the main producer with about 12 MW of dry steam. PT. PLN continues to pursue the options for installation of a power plant (Kasbani, et al., 1997; R. D. Johnstone, 2005).

70
Fig. 3-9 Hydrothermal mineral zonation in Ulumbu (revised Kasbani, et al., 1997)

71
3.4.4 Bena-Mataloko
The Mataloko (Bajawa) Geothermal area (500-1,400 m a.s.l) is located in Ngada regency, East Nusatenggara, and lies between 121°00' - 121°05' E latitude 08°48'30" - 08°53'30" longitude. It has good accessibility and high rain fall (±1750 - 2250 mm/year). The comprehensive survey had been conducted by VSI, NEDO (New Energy Development Organization)-Japan, and GSJ (Geological Survey of Japan) in FY 1998 i.e. geology, geochemical, geophysical surveys and 103 m depth well-drilling. The geophysical consist of MT (Magneto Telluric), CSAMT (Control Source Audio Magneto Telluric), Schlumberger resistivity and Gravity methods. The resource potential was estimated as 30 MW by JICA (2007). After NEDO study, additional wells have been drilled and constructed 2.5 MW geothermal power plant.
The geothermal resource in Bena-Mataloko was summarized by VSI, JICA (2007) and published papers. Based on these descriptions, geothermal resources in Bena-Mataloko are summarized as follows (Figs. 3-10 and 3-11).
Geology: The Mataloko andesite and the volcanic of Bajawa composed of fresh to weathered lavas, thick pyroclastic, cropping out in Mataloko and Bajawa areas, deducing as a caldera and post caldera forming eruption products. The SE-NW trending fault systems are occupied by regional structures of Central Central Flores, which probably influenced by the tectonic driving from the South. Generally the thermal discharges are associated with structure or fracture system passing through SE-NW, SW-NE and N-S direction. The SE-NW Waeluja normal fault is a major control structure of thermal channel fluids of he Mataloko geothermal area, indicated by trend of hot springs and alteration zone distributions. The SW-NE Boba normal fault is characterized by an old topographic lineation, escarpment and triangular facets in some places. The N-S structure pattern is represented by an existence of volcanic lineaments that are probably strongly affected by a combination of normal and strike slip fault systems. The large geothermal distribution along that trending fault direction, interpreted as a fracture type geothermal system dominated the Bajawa geothermal area (JICA, 2007).
Surface geothermal manifestations: The Waeluja alteration zone characterized by an NW-SE strongly argilitic alteration (natroalunite, alunite, alunogen, crystobalite and quartz). In the lateral order, they are divided into alunite-illite, kaolinite and montmorilonite zones. The alunite-illite zone is located in the inner part, probably affected by a strongly sulphuric acid and high temperature solutions which are indicated by alunite mineral. The kaolinite zone is characterized by kaolinite, crystobalite, quartz and montmorilonite which are probably affected by acidic and weak acidic solutions. The outer zone is montmorilonite, which is possibly driven from a weathering process as well. The NE-SW Nage alteration zone is characterized by silicification-argilitization (Pyrophilite, quartz, and gypsum), which is probably associated with the first episode condition (affected by strongly sulphuric acid

72
solution). Teh west flank of Bobo young volcanic cones (1400 m asl) represent a fumarolic field which consists mainly of alunite, kaolinite and crystobalite clay alterations (probably affected by a strongly sulphuric acid solution of high temperature condition). The Thermo-luminescence dating of quartz from Waeluja and Nage alteration minerals represents ages of 0.087 Ma and less than 0.2 Ma respectively. They probably indicate the thermal history of the preliminary Waeluja and Nage faults. Therefore, high subsurface temperatures of hydrothermal system are probably still existing (based on description of VSI).
Geochemistry: The chemical analysis of thermal discharges that represents high sulphate, low chloride, sodium, and calcium contents, is indicating the sulphate type water. The high sulphate suggests that the volcanic gases particularly H2S oxidize closed to the surface, influencing shallow ground water (based on description of VSI).
Main thermal manifestations in Mataloko are fumaroles and steam-heated acid hot springs. Reservoir fluid originates essentially in meteoric water. The shallow steam-dominated reservoir is likely to be derived from deep liquid-dominated hot reservoir. From fumarolic and well discharge gas geothermometries, reservoir temperature is estimated to be 190-230oC at the shallow reservoir and 270-300oC at the deep reservoir.
Geophysics: The very comprehenship geophysical survey was conducted to provide integrated information on the electrical resistivity distribution of the Mataloko, Bobo, and Nage manifestation areas. The 2-D resistivity model shows that generally a thin high resistivity surface layer except the manifestation zone. Below it, the Mataloko area is entirely underlain by a low resistivity layer (<10 Ohm-m) in the shallow zone, and very low, as low as 1 Ohm-m, near the manifestation zone. This is interpreted as a clay-rich zone which corresponds to ca layer of the geothermal reservoir system. The thickness of the conductive layer becomes larger to western part of the Mataloko area, but less conductive. A large-high resistive layer is interpreted below this cap layer in the Mataloko surface manifestation zone. The CSAMT data shows the discontinuity resistivity structures near manifestation zone which is interpreted as fractures zone, while the Head On represents that the normal fault yields a dipping 70°to the North. Shallow Exploratory Wells Study: Three shallow exploratory wells MTL-1, MT-1 and MT-2 have been drilled in the Mataloko geothermal field in this project. This project was successfully completed with the flow-test steam production of 15 tons per hour from the well MT-2 at the depth of 162.35 m. After the flow-test, this well was deepened to182.02 m (Figs. 3-12 and 3-13).

73
Fig. 3-10 Compiled map of geothermal activity in the Nage and Wolo Bobo areas (JICA,
2007)
Fig. 3-11 Compiled map of geothermal activity in the Mataloko Area (JICA, 2007)

74
Fig. 3-12 Location of exploratory wells in Mataloko (Muraoka et al., 2005)
Fig. 3-13 Photograph of the flow twist of NEDO MT-2 well (Muraoka et al., 2005)

75
3.4.5 Sokoria-Mutubusa
The Sokoria-Mutubusa geothermal field in central Flores and the association of the geothermal activity with the volcanism at Kelimutu is reported R. D. Johnstone (2005) and JICA (2007). The resource potential is estimated as 90 MW by JICA (2007). Preliminary scientific survey was mostly conducted by the CGR. Drilling of slim shallow wells was carried out by CGR. In addition, MT/TDEM survey was conducted by JICA (2007).
Surface thermal activity covers an area of about 100 km2 centered on the Kelimutu volcano. A feature of the thermal activity at Sokoria is the existence of fumaroles at high elevations (1,200 m asl) (Mutubusa and Mutulo’o), and lower elevation (<900 m asl) springs with a wide variety of chemical compositions, being interpreted as mixtures of groundwater, with magmatic ,geothermal steam condensate, and geothermal reservoir fluid of neutral pH, and chloride type. In the lowest elevation area, neutral pH springs at Detu Petu and Landukura and acid springs at Jopu exist. The temperature estimated by the method of Giggenbach (1988) indicated a trend towards equilibrium temperatures of 200 – 250oC. Springs on the south side of the complex occur along the trace of the near vertical Lowongolopolo Fault (R. D. Johnstone, 2005).
Geology: Sokoria-Mutubusa geothermal prospect is located 30km north of Ende, East Nusa Tenggara. The poorly known Sokoria caldera in central Flores Island, NE of Iya volcano is of 8 km in diameter (Fig. 3-14). A 750-m-high northern caldera wall rises above the village of Sokoria in the center of the caldera. The southern caldera wall is very irregular. A small fumarolic area on the western flank contains several vents that eject geyser-like water columns with a smell of hydrogen sulfide. The Ndete Napu fumarole field, located at 750 m elevation along the Lowomelo river valley in central Flores Island, originated during 1927-29. In 1932 it contained mud pots and high-pressure water fountains. The age of volcanism in the Ndete Napu area is not known precisely, but it was included in the Catalog of Active Volcanoes of the World (Neumann van Padang, 1951) based on its thermal activity (JICA, 2007).
Geochemistry: Surface manifestations around Keli Mutu volcanic complex are spread over a wide area. Reservoir fluid originates essentially in meteoric water. Spring waters in Roga and Jopu at the south foot of Keli Mutu may be derived from outflows from the mountain side and contain some magmatic fluid. Hot springs in Sokoria may be derived from various kinds of fluids including shallow condensate, deep reservoir water and outflow containing magmatic fluid. Occurrence of fumaroles in Mutubasa suggests existence of another up flow center of hot fluid there besides the Keli Mutu system. Reservoir temperature was estimated higher than 180oC at least, and possibly up to 320oC from gas and Na/K geothermometries (JICA, 2007).

76
Geophysics: Schlumberger method was conducted by CGR. JICA (2007) conducted geophysical survey (MT/TDEM method) in the Master Plan STudy. The survey results of JICA study are summarized as follows:
Three resistivity discontinuities were detected. Considering the geological survey results, resistivity discontinuity probably reflects a Caldera rim, and is likely to reflect a fault structure. In the central portion along the of resistivity discontinuity, a low resistivity zone of less than 5ohm-m probably reflecting reflects low-temperature hydrothermal-alteration minerals (smectite etc) acting as the cap-rock of the reservoir is recognized. In addition, underlying the low resistivity zone along the discontinuity, a relatively higher resistivity zone of greater than 30ohm-m possibly reflecting reflects high temperature alteration products such as illite and/or chlorite is detected. Hence the area along resistivity discontinuity at depth is possibly indicative of a higher temperature zone at depth. Therefore it is highly probable that the central portion of resistivity discontinuity reflects a part of the fault-like structure where geothermal fluid may circulate at depth in the Sokoria field. Based on these facts, the zone along resistivity discontinuity is likely to be a promising zone for geothermal development in the Sokoria field.
Reservoir extent was estimated in Caldera structure, based on low resistivity zone (Schlumberger <5 ohm-m), surface manifestation and geologic structure trending NNW-SSE (JICA, 2007).
Fig. 3-14 Prospect Area in Sokoria Mutubusa (J. Brotheridge et al., 2000)

77
3.4.6 Oka-Larantuka
Preliminary geoscientific survey was mostly conducted by the CGR. The resource potential was estimated as 90 MW by JICA (2007). Results of surface geoscientific surveys are summarized as follows based on R. D. Johnstone (2005).
Thermal features on the eastern end of Flores occur in three clusters; Oka hot springs on the south eastern side of the island, Kawalawu hot springs on the north western side of the island, and the Riang Kotang alteration area in the saddle between Ili Padang and Ili Waikerewak hills, between the two sets of coastal springs. Several springs are found at Oka over a 200 m interval inland from the seashore. The hottest spring is 60.1oC, with a flow of about 3 l/s, and notable thin salt layer coating the rocks surrounding the pool. Total flow from the Oka area is estimated at about 15 l/s. At Kawalawu the main spring occurs just above high tide level, has a temperature of 51.2oC, and a flow of about 3 l/s. Other springs are reported to have occurred to the east and west of the present springs prior to the 1991 earthquake. But these are now covered with rocks and sand. Both spring groups are slightly acid with pH 5 - 6. The slight acidity is reflected in elevated sulphate contents of the springs suggesting that these waters have undergone a moderate steam heating process. There are significant differences in the chemistry between the two springs indicating that they either originate from different parent fluids, or have been modified significantly before reaching the surface. Silica geothermometers give temperatures of about 170oC for both springs and although the springs fall in the immature field of Giggenbach (1988) the trend line points towards temperatures of 250oC. The volcanic rocks in the area are Pliestocene to recent, forming a poorly dissected group of coalescing volcanic cones up to about 1,240 m high. Young craters occur about 6 km to the east and NE of the springs and the active Ili Leroblong volcano (Kusumadinata, 1979) is about 10 km to the SW. The location of the springs provides little evidence for an association with a particular volcanic heat source.
3.4.7 Atadei
The Atadei geothermal field belongs to Atedei Subdistrict, District of Lembata, and East Nusa Tenggara Province. The field situated about 45 km southeast of Lewoleba city as the capital city of Lembata District. The preliminary works were conducted by the Volcanological Survey of Indonesia, but it has not been developed yet.
The Atadei geothermal field is composed of Quaternary old and young volcanic rock unit and the geological structures are characterized by Watuwawer and Bauraja calderas, Watuwawer and Mauraja normal faults of NE-SW trend and Waibana normal fault of NW-SE. The surface manifestation consists of hot springs (32-45°C), fumaroles (80-96°C), steaming ground (96-98°C) and altered rock. The anomalies of Hg and CO2,,which is almost the same with those of resistivities, extend in the south to southeast of the Atadei geothermal field, around the Watuwawer village.

78
Based on the study results by F. Nadlohyert al (2003), there are three prospect areas Watuwawer 4.5 km2 with the electrical potential of 20-30 MWe, Lewo Kebingin, 0.25 km2 with electrical potential of 1-2 MW and Waru, 1.5 km2 with electrical potential of 7-10 MW. The Watuwawer prospect area is the most prospective area for the development of the Atadei geothermal field in the future. The resource potential was estimated to be 50 MW by JICA (2007).
The geoscientific description in Atadei is published by the Volcanological Survey in Indonesia (VSI). Based on the description, characteristics of the geothermal resource in Atadei are summarized as follows.
Geology: Lomblen Island is a part of the Banda Island arc system which comprises Upper Cenozoic volcanic rocks with volcanogenic and carbonate sediments. The volcanic rocks are dominantly of mafic to intermediate calc-alkaline composition and are uncomfortably underlain by the Tertiary rocks. The oldest rocks are of Miocene age and exposed on northern part of the island. The youngest rocks in the area in relation with the most recent volcanic event in the island occur on Mt. Ili Werung and Mt. Hobal, approximately 6 km South East of the surveyed area. The Quaternary volcanic rocks consist of lava and pyroclastic deposits, which were mostly erupted from the vents of Mt. Watulolo, Mt. Atalojo, Mt. Benolo and Mt. Watukaba. These rocks are dominantly of basaltic andesite composition, however, there are deictic rocks exposed on a narrow area at the north Watukaba caldera wall. The secondary deposits are alluvial and debris avalanches deposits. The later is a very recent deposit due to slope instability of intensively altered volcanic rocks and buried the former sub district capital town of Atadai with about of 500 peoples died in 1979. The area photograph interpretation shows that there are two main trending structures/lineaments: NW-SE and NE-SW. The NW-SW one likely controls the volcanism and the volcanic vents presumably moved from the NW to the SE, where Mt. Iliwerung is the youngest (based on description of VSI).
Surface geothermal manifestations: Most thermal features in the Atadai geothermal area occur over area boundaries by a couple of NE-SW trending faults: Kowan and Lewo geroma faults in the North and South, respectively. Features include hot spring, steaming/hot grounds and altered rocks. The springs have temperature up to 35°C and are mostly characterized by nearly neutral pH and bicarbonate type, but some are of high sulphate content, very low chloride content and low pH. No chloride waters discharge at the surface. The steaming/hot grounds have near surface temperatures up to 98°C and occur with in the Watukaba caldera, on the western flank of Mt. Ilikoti and eastern flank of Mt. Benolo. The volcano-stratigraphy study and thermal manifestation suggest that the heat source for the Atadai geothermal area is beneath the Atalojo crater and Watukaba caldera. The intensive alteration mostly occurs in area boundaries the couple of NE-SW normal faults: Kowan and Lewogeroma. However, some samples taken from the western flank at Mt. Ilikoti show that the rocks have been pervasively altered by neutral pH fluid (based on description of VSI).

79
3.4.8 Tulehu
The geoscientific description in Tulehu was compiled by JICA (2007). The resource potential was estimated as 40 MW by JICA (2007). Based on the description, characteristics of geothermal resources in Tulehu are summarized as follows.
Geology: The area is located at the east coast of Ambon Island. The geological units are divided by several NE-SW trending faults and warm springs are situated along these faults (Fig. 3-15).
Geochemistry: Reservoir fluid originates in meteoric water and seawater. Detailed fluid flow pattern is not clear. Reservoir temperature is estimated around 230oC or higher.
Prospect Area: Possible area was defined by PT. PLN based on the low resistivity zone, surface manifestation, geologic structure and geochemistry. The resistivity data and geologic structure indicate the possibility that the possible area become wider than that defined by PT. PLN (Fig. 3-16).
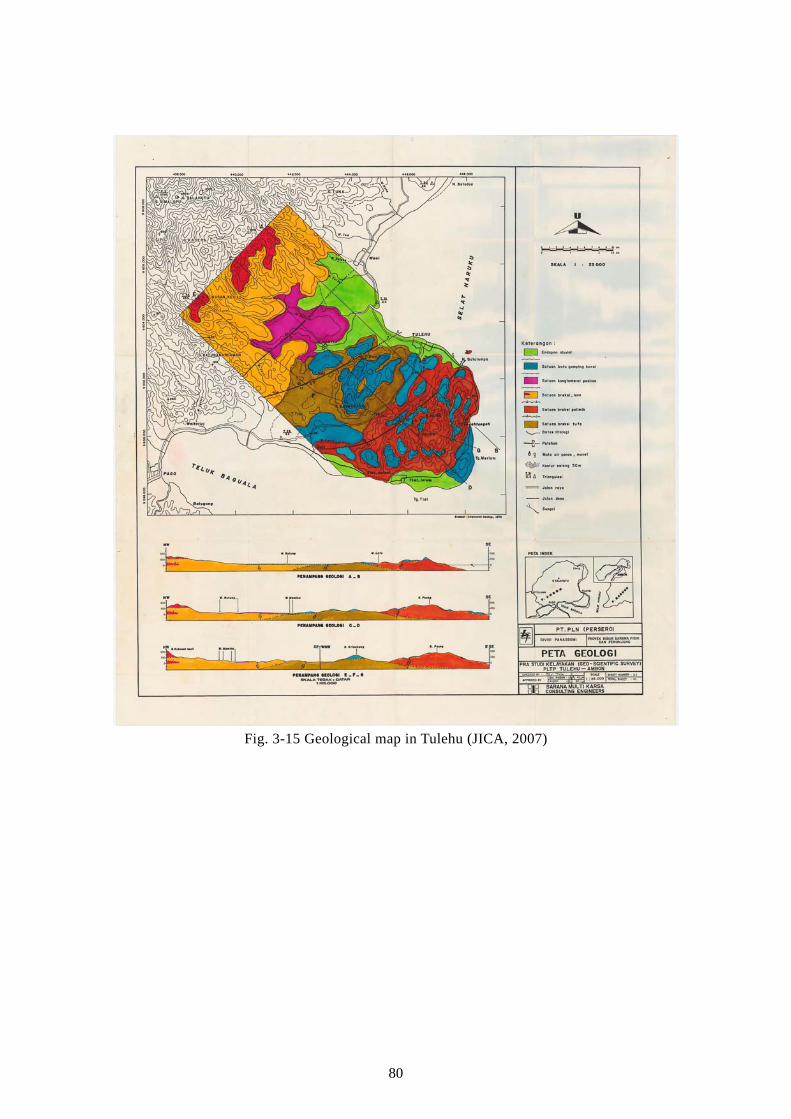
80
Fig. 3-15 Geological map in Tulehu (JICA, 2007)

81
Fig. 3-16 Prospect Area in Tulehu (JICA, 2007)
3.4.9 Jailolo
The geoscientific description in Jailolo is published by the Volcanological Survey in Indonesia (VSI). The resource potential was estimated as 40 MW by JICA (2007). Based on the description, characteristics of geothermal resources in Jailolo are summarized as follows.
Geology: Thermal features of this field occur mainly around the flanks of G. Jailolo which forms a small peninsula on the west coast of central Halmahera Island. The oldest rocks in the area are Tertiary, with andesites and basalts overlain by a deictic ignimbrite which outcrop to the east of the thermal features on an uplifted fault block. Early Quaternary eruptive centers are situated at G.Toada (east of Teluk Jailolo) and to the SW of G. Jailolo in the Teluk Bobo-Kailupa area. The Jailolo Volcanics overlie these older units and consist of basalts erupted from G.Jailolo followed by andesite which were erupted from the vicinity of a 1.75 km diameter crater further to the east at Idamdehe (based on description of VSI).
Surface geothermal manifestations: The highest temperature of thermal features in Jailolo are in the eastern part of the field with steaming ground inside the Idamdehe crater (97oC), on the south side of Manjonga hill (78oC) and springs (84oC) on the coast SW of Manjonga hill. The remaining 33 known springs are around the edges of G.Jailolo and at Todowangi to the NW of G.Toada, and have temperatures lower than 45oC and flows up to 10 l/s.

82
The springs cover an area of about 75km2. It is considered that the eastern part of the field around Kawah Idamdehe is the most promising for obtaining a geothermal resource if one of significance exists (Fig. 3-17).
Geochemistry: There are a number of thermal features within this prospect. To the west of G.Jailolo at Idamdehe within a small collapsed structure and at 175 m.a.s.l. there is some very hot (97oC) steaming ground. A further piece of steaming ground (78oC) is located at 125 m.a.s.l., 3 km south-west of Idamdehe at Bukit Manjanga. Hot outflows occur at six locations but at sea level. Only one near-complete analysis is available, and the Ca/Mg ratio and elevated chloride sulphate and bicarbonate may indicate an influx of seawater rather than a diluted outflow from a cool source. Evidence of a possible high temperature (>180oC) resource is indicated by silica deposition at the two hottest seepages at Sorogogo (84oC) and Arugani (75oC) respectively and both have flows less than 0.5 l/second. Only two hot springs are recorded with flow rates greater than 6 l/second and these occur at Balesoan (50 l/sec) and Gamtala (10 l/sec). There are a number of wells around G.Jailolo flanks which have been sunk to supply hot water (based on description of VSI).
Geophysics: Approximately 75 Schlumberger traversing stations, and 14 soundings were carried out in the Jailolo prospect area during 1982 (Simanjuntak, 1982). The traversing measurements were at the standard AB/2 spacings of 500 m and 1000 m, and most of the soundings were up to AB/2=1000 m.
G.Jailolo is surrounded on its northwest, west and south sides by sea. On the north and east sides, there are broad areas of low-lying swamp which are likely to contain unknown thicknesses of conductive sediments and fluids. With the exception of the small Idamdehe kawah at an elevation of 205 m.a.s.l., the other thermal manifestations (springs) are at low elevations surrounding the flanks of G.Jailolo. Thus low resistivities are to be expected at low elevation around G.Jailolo, and the critical question is whether the low resistivity extends a significant distance beneath the higher parts of the mountain (peak elevation of 1130 m.a.s.l.). None of the soundings centered above 250 m.a.s.l. imply very low resistivity at depth (i.e. <10 ohm-m). However the upper parts of G.Jailolo have a very high resistivity, so most of the sounding curves are steeply descending, and there is some uncertainty about how low the resistivity is at great depth (>1 km depth). Despite this uncertainty, the relatively high apparent resistivity (>50 ohm-m) at AB/2=1000 on most traversing stations, and in all soundings at elevations above 250 m.a.s.l., suggests there is not an extensive geothermal system beneath G.Jailolo.
Low resistivities occur beneath the eastern flanks of G.Jailolo, especially along the survey line that is the closest to the Idamdehe kawah. In situ resistivities of <10 ohm-m are suggested here, and these extend sufficiently inland to be mostly likely caused by the presence of thermal fluids. With only one traversing survey line across this area, the boundaries of the low resistivity zone are poorly delineated. A circular area of radius 1 km

83
(area 3 km2), centered near the Idamdehe kawah has been assumed (based on description of VSI).
Fig. 3-17 Geothermal model in Jailolo (after VSI)

84
Chapter 4 Environmental and Social Aspect 4.1 Environmental Assessment System
The Ministry of Development and Environment (PPLH) was established in 1978 in Indonesia and takes charge of environmental administration. Act of the Republic of Indonesia concerning environmental management (act No.4/1982), which national environmental administration issues were described, was promulgated. PPLH transformed into the Ministry of Population and Environment (KLH) in 1982. For strengthening the function of KLH, the Environmental Management Agency (BAPEDAL) was established as an implementation agency for environmental administration based on Degree of President No.23/1990. KLH was demergered and LH was established in March 1993. BAPEDAL transformed its structure and strengthened the function by Degree of President No.77/ 1994, which brushed up the system on implementation of countermeasures for preservation of the environment and public hazards. According to central government policy, local government has right to act for preservation of the environment based on paragraph 3 article 18 of Act of the Republic of Indonesia concerning environmental management, and BLH of each province enforces the environmental issues. Authority concerned and provinces, which have jurisdiction over project, are capacitated enforcement of environmental impact assessment. They organize the “committee of environmental impact assessment” for prescreening and examining AMDAL report. ”General committee of environmental impact assessment” is organized for enforcing the environmental impact assessment of the project, which has not only one authority concerned. BEPEDAL administrates coordination of environmental impact assessment study. To reflect the article 16 of Act of the Republic of Indonesia concerning environmental management, the Government Regulation No. 29/1986 regarding the Environmental Impact Assessment was promulgated. Considering the results of many developments, “regulation regarding Environmental Impact Assessment” Government Regulation No. 51/1993 was enacted. In Indonesia Environmental Impact Assessment is called as Analysis Mengenai Dampak Lingkungan (hereafter AMDAL). AMDAL is categorized into three types according to the intensity and extent of the proposed development.
V AMDAL KegiatanTerpadu/Multisektoral; the significant impacts of a proposed integrated business or activity on the environment, where that business or activity is located in a single ecosystem type and also involves more than one authorized government agency.
V AMDAL Kawasa; the significant impacts of a proposed integrated business or activity located in a single ecosystem type, which are under the authority of a single authorized government agency.
V AMDAL Regional; the significant impacts of a proposed integrated business or

85
activities located in a single ecosystem type in a development planning area as defined by the regional spatial plan, which involves more than one authorized government agency as part of the decision-making process.
The significant impacts are fundamental changes to the environment, which result from a proposed business or activity, and impact significance is determined by 7 parameters (number of affected people, aerial extent, duration, intensity, number of other affected environmental components, cumulative nature, reversibility / irreversibility) in “decree concerning guidelines for the determination of significant impacts” decree No. Kep-056/1994.
Types of business and activity that may cause the significant impacts on the environment are specified in 14 kinds sectors. The details of activity and its scale were once announced by “decree concerning types of business or activities required preparing an environmental impact assessment”, decree No. Kep-11/Menlh/3/1994, the kind and scale of the business and activities were revised by “decree of sate minister for environment on types of business or activities required to prepare an environmental impact assessment”, decree No. 17/ 2001. (14 sectors, 84 activities)
Environmental Impact Statements called as Analysis Dampak Lingkungan (hereafter ANDAL) and it is a detailed and in-depth research study on the significant impacts of a proposed business or activity.
And also the management plan and monitoring plan shall be prepared in order to manage and monitor the significant impacts of proposed business and activity.
V Environmental Management Plan --- called as RKL (Rencana Pengelolaan Lingkungan Hidup) in Indonesia
V Environmental Monitoring Plan --- called as RPL (Rencana Pemantauan Lingkungan Hidup) in Indonesia
The geothermal power generation smaller than 55MW and transmission line smaller than 150kV are no necessary to prepare AMDAL, but Environmental Management Effort (UKL: Upaya Pengelolaan Lingkungan) and Environmental Monitoring Effort (UPL: Upaya Pemantauan Lingkungan) should be submitted according to ministry decree No. 86/2002.
4.2 Legislation, Standards and Regulations Relating to the Environment (Geothermal Development Related)
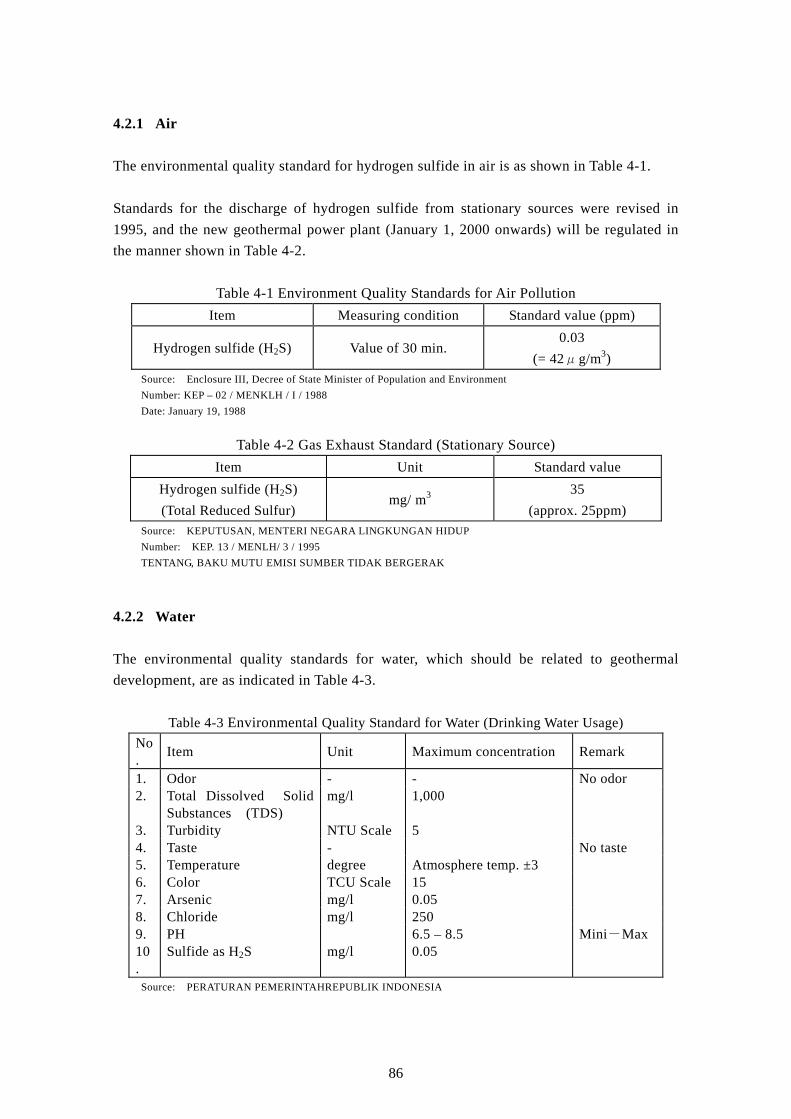
86
4.2.1 Air
The environmental quality standard for hydrogen sulfide in air is as shown in Table 4-1.
Standards for the discharge of hydrogen sulfide from stationary sources were revised in 1995, and the new geothermal power plant (January 1, 2000 onwards) will be regulated in the manner shown in Table 4-2.
Table 4-1 Environment Quality Standards for Air Pollution Item Measuring condition Standard value (ppm)
Hydrogen sulfide (H2S) Value of 30 min. 0.03
(= 42μg/m3) Source: Enclosure III, Decree of State Minister of Population and Environment Number: KEP – 02 / MENKLH / I / 1988 Date: January 19, 1988
Table 4-2 Gas Exhaust Standard (Stationary Source) Item Unit Standard value
Hydrogen sulfide (H2S) (Total Reduced Sulfur)
mg/ m3 35
(approx. 25ppm) Source: KEPUTUSAN, MENTERI NEGARA LINGKUNGAN HIDUP Number: KEP. 13 / MENLH/ 3 / 1995 TENTANG, BAKU MUTU EMISI SUMBER TIDAK BERGERAK
4.2.2 Water
The environmental quality standards for water, which should be related to geothermal development, are as indicated in Table 4-3.
Table 4-3 Environmental Quality Standard for Water (Drinking Water Usage) No. Item Unit Maximum concentration Remark
1. Odor - - No odor 2. Total Dissolved Solid
Substances (TDS) mg/l 1,000
3. Turbidity NTU Scale 5 4. Taste - No taste 5. Temperature degree Atmosphere temp. ±3 6. Color TCU Scale 15 7. Arsenic mg/l 0.05 8. Chloride mg/l 250 9. PH 6.5 – 8.5 Mini-Max 10.
Sulfide as H2S mg/l 0.05
Source: PERATURAN PEMERINTAHREPUBLIK INDONESIA

87
Number: 20, 1990
The quality standards of liquid waste from geothermal activity was not clear in Government Regulation No. 20/1990, it was revised by decree of state minister of Environment “Quality standards of liquid waste of natural and gas as well as Geothermal activities” decree No. Kep-42/MENLH/10/1996. The quality standards of liquid waste for geothermal exploration and production activities are in Table 4-4.
Table 4-4 Quality Standards of Liquid Waste Item Unit maximum
Dissolved sulphide acid (as H2S) mg/l 1 Dissolved ammonia (as NH3) mg/l 10
Mercury mg/l 0.005 Arsenic mg/l 0.5
Temperature degree 45 PH - 5.0-9.0
Source: Attachment III, KEP – 42 / MENLH / 10 / 1996 Date: October 9, 1996
4.2.3 Noise
Standards for noise according to type of land use and activity area are shown in Table 4-5.
Table 4-5 Standards of Noise Level Items dB (A) a. Area Usage 1. Residential 55 2. Commercial 70 3. Office and Trade 65 4. Open Green Area 50 5. Industry 70 6. Government and Public facility 60 7. Recreation (Resort) 70 8. Special - Airport - Train station - Shipyard 70 - National Port 60 b. Activity Area 1. Hospital 55 2. School 55 3. Place for pray / Church / Temple / Mosque 55
Source : LAMPIRAN I; DEPUTUSAN MENTERI NEGARALINGKUNGAN HIDUP Number : KEP – 48 / MENLH / 11 /1996

88
Date : 25 NOVEMBER 1996
Noise abatement measures should achieve either the levels given in Table 4-6 below or a maximum increase in background levels of 3 decibels (measured on the A scale) [dB (A)]. Measurements are to be taken at nose receptors located outside the Project property boundary.
Table 4-6 Standards of Noise Level at Source Maximum allowable log Equivalent (hourly measurements), in dB (A) Receptor
Day (07:00 – 22:00)
Night (22:00 – 07:00)
Residential, Institutional, 55 45 Educational Industrial, Commercial 70 70
4.2.4 Subject for Environmental Impact Assessment
Environmental conditions and impacts in the objected area of the geothermal power project, whose capacity is more than 55MW, should be checked by application of AMDAL. In geothermal power projects in and around the following legally protected areas, it lies under an obligation to prepare AMDAL, even if its capacity is less than 55MW. In case that the AMDAL is not necessary, Environmental Management Effort (UKL) and Environmental Monitoring Effort (UPL) should be submitted according to the requirement of the ministry decree No. 86/2002.
In accordance to the Act on Forestry No. 41/1999, forest area is categorized as Conservation Forest, Protection Forest and Production Forest, for which is defined as in Table 4-7. Conservation Forest is a forest area having specific characteristic established for the purposes of conservation of animal and plant species and their ecosystem. Protection Forest is a forest area designated to serve life support system, maintain hydrological system, prevent of flood, erosion control, seawater intrusion, and maintain soil fertility. Production forest is a forest area designated mainly to promote sustainable forest production. Production forest is classified into permanent production forest, limited production forest, and convertible production forest.
Geothermal power development activity can be conducted in the forest restricts in special circumstances. Government Regulation No.2/2008 approves geothermal power development activity in protection forest and production forest in exchange for tariff or government income on using forest area. Geothermal power development activity in kinds of the conservation forest is not allowed according to government regulation No.41/1999. The

89
project implementation body should pay attention about the location of prospect where is included conservation forest or not.
There are 37 geothermal prospects in the eastern provinces according to the data of Geological Agency. 11of 37 prospects are checked the geographical relation between prospects and the conservation forest. These results are shown in Figs. 4-1 to 4-6. The forest condition of the other 26 prospects should be confirmed when the project areas are selected.
On the bases of the collected information so far, forest conditions were checked as follows.
(1) Huu Daha
The Huudaha prospect is located at Parado and Tenu Tenawo village of Monta district, Regency of Bima in Nusa Tenggara Barat Province. The prospect area is located in production forest and possibly includes protection forest.
(2) Wai Sano
The Waisano prospect is located at Nara, Rawe and Nanggali village of Sononggoang district, Regency of Manggarai in Jambi Province. The prospect area is located in non-forest area and possibly includes protection forest.
(3) Ulumbu
The Ulumbu prospect is located at Ruteng, and Poco Ranakah village of Sataramese district, Regency of Manggarai in East Nusa Tenggara (Nusa Tenggara Timur) Province. The prospect area is located in non-forest area and possibly includes conservation forest.
(4) Bena Mataloko
The Bena Mataloko prospect is located at Bodo and Boawai village of Mogomang Ulewa district, Regency of Ngada in East Nusa Tenggara (Nusa Tenggara Timur) Province. The prospect area is located in non-forest area.
(5) Sokoria Mutubusa
The Sokoria or Mutubusa prospect is located at Ende village of Ende district, Regency of Ende in East Nusa Tenggara (Nusa Tenggara Timur) Province. The prospect area is located in production forest and possibly includes protection forest and non-forest area.

90
(6) Oka Larantuka
The Oka Larantuka prospect is located at Wutuwiti village of Larantuka district, Regency of Florest Tiur (East Flores) in East Nusa Tenggara (Nusa Tenggara Timur) Province. The prospect area is located in production forest and possibly includes protection forest and non-forest area.
(7) Ili Labaleken
The Ili Labaleken prospect is located at Watalolong village of Nagawulan district, Regency of Lembata in East Nusa Tenggara (Nusa Tenggara Timur) Province. The prospect area is located in protection forest and possibly includes non-forest area.
(8) Atadei
The Atadei prospect is located at Labla and Hadakewa village of Atadei district, Regency of Lembata in East Nusa Tenggara (Nusa Tenggara Timur) Province. The prospect area is located in non-forest area and possibly includes protection forest.
(9) Tonga Wayana
The Tonga Wayana prospect is located at Babang and Wajaua village of Bacan district, Regency of South Halmahera in Maluku Province. The prospect area is located in conservation forest and possibly includes production forest.
(10) Tulehu
The Tulehu prospect is located at Liang village of Salahutu district, Regency of Central Maluku in Maluku Province. The prospect area is located in protection forest and possibly includes non-forest area.
(11) Jailolo
The Jailolo prospect is located at Hokuhokukie village of Jailolo district, Regency of West Halmahera in North Maluku Province. The prospect area is located in non-forest area.
According to the information collected so far, there are no serious environmental problems to proceed to the project in the objected areas. However more detailed information on environment should be collected before starting the project.

91
Table 4-7 Classification of Forest Area
Forest Area (Kawasan Hutan) Conservation Forest (Hutan Consavasi) Sanctuary Reserve area (Kawasan suaka alam) Strict Nature Reserve (CA: Cagar Alam) Wildlife Sanctuary (SM: Suaka Margasatwa) Nature conservation area (Kawasan pelestarian alam) National Park (TN: Taman Nasional) Grand Forest Park (THR: Taman Hutan Raya) Nature Recreation Park (TWA: Taman Wisata Alam) Game Hunting Park (TB: Taman Buru) Protection Forest (Hutan Lindung) Production forest (Hutan produksi) Permanent production forest (HP: Hutan Produksi Tetap) Limited production forest (HPT: Hutan Produksi Terbatas)
Convertible production forest (Hutan Produksi yang dapat dikonversi)

92
Fig. 4-1 Geographical relation between prospects and the conservation forest in Huu Daha and Wai Sano
Fig. 4-2 Geographical relation between prospects and the conservation forest in Ulumbu and Bena-Mataloko

93
Fig. 4-3 Geographical relation between prospects and the conservation forest in Sokoria-Mutubusa and Oka-Larantuka
Fig. 4-4 Geographical relation between prospects and the conservation forest in Ili Labaleken and Atadei

94
Fig. 4-5 Geographical relation between prospects and the conservation forest in Tonga Wayana and Tulehu
Fig. 4-6 Geographical relation between prospects and the conservation forest in Jailolo


95
Chapter 5 Implementation Plan
5.1 Project Composition
The diesel power of 89MW, which is base load in the eastern Indonesia, is possible to be substituted geothermal power. In Geothermal Master Plan Study by JICA, exploitable resource potential of 650 MW in total in the eastern provinces was reported based on the existing resource data. On the other hand, Ministry of Energy, Mineral and Resources (MEMR), estimated the potential of the geothermal resources as same as 1914MW in the eastern provinces. Since urgent commencement of geothermal power development in the eastern Indonesia is considered to be necessary and pilot project of geothermal power development should be started as soon as possible, because of inflationary cost rise of fossil fuel for the diesel power generation, small scale geothermal power plant of 35MW in total is proposed to MEMR as appropriate project scale and period. Considering commencement of operation of geothermal power plants as soon as possible, the support by ODA Yen Loan is considered to be sufficient for construction of 35 MW geothermal power plants as pilot projects. Based on the discussion among the MEMR, Ministry of Finance and National Development Planning Agency (BAPPENAS), the procedure for registration of Blue Book will be started by MEMR as a project of PT. PLN .
The Eastern Indonesia Geothermal Development Project will be divided into three stages, and the stages will consist of the following eight major components, which are shown in Fig. 5-1.
Surface Survey Stage
ü Selecting Geothermal Prospect
ü Surface Resource Survey
Drilling Survey Stage
ü Exploration Well Drilling
ü Geothermal Reservoir Simulation
ü Conceptual Design for Geothermal Power Plant
ü Application Study of CDM
Plant Construction
ü Small Scale Power Plant Construction
ü Transmission/ Distribution Line Construction

96
Fig. 5-1 Development Flowchart
Selecting Geothermal Prospect
Surface Study
Exploration Well Drilling
Geology, Geochemistry, Geophysics
Slim Hole Drilling, Well Logging, Production
(Tendering Prospect)
3D Geothermal Model, History Matching, Prediction
Back-Pressure Turbine, Geothermal Binary System
Evaluating Resource Potential
Estimating Resource Distribution
Confirming Resource
Geothermal Reservoir Simulation
THE PROJECT
Small-Scale GPP Construction
Conceptual Design for GPP, CDM
Surface Survey
Drilling Survey
Plant Construction
Geothermal Power Plant Operating

97
5.1.1 Selecting Geothermal Prospect (Preparion of the Project)
Based on information such as location of diesel power plant and transmission/ distribution line, consumer power demand, potential and characteristics geothermal prospect adequate areas of geothermal power development will be selected for diesel power substitution. In this study, the selection of fields is included in the main development project. However, this work should be preferably conducted before starting the project by preliminary surface studies (geology and geochemistry). These studied can be entrusted to consulting firm of geothermal development. However, if possible, these studies are desired to be conducted as preparation study by support from Japan, as described later.
5.1.2 Surface Resource Survey
Surface resource survey such as geology, geochemistry and geophysics will be carried out at selected geothermal prospects for the purpose of confirmation of resource existence, delineation of the geothermal reservoirs and decision of exploration drilling targets. Following resource studies should be conducted in the project for securing geothermal steam.
In the previous resource study, existing geological data of the surveyed area and vicinities are insufficient to quantitatively evaluate the geothermal potential. During the field survey, documentation of the frequency, size, and orientation of the fractures and faults will be conducted. Identification and location of the volcanic rock units in the area will be done and geological mapping will be carried out. In the map, relation between rock units and structure elements of the geology will be written down. Understanding the geological evolution of the geothermal area, a relation between fault movement and geothermal activity, and formation mechanism from the above data can suggest where subsurface heat sources and permeable zones may be found. Furthermore mapping of hydrothermal alteration zone can be identified a relation between fracture-controlled permeability and fluid flow. In the field samples of rocks and minerals will be collected. And petrological analysis, X-ray analysis, age dating and crystal morphology analysis, fission Track (FT) dating, and Thermo-Luminescence (TL) dating on the rocks and minerals will be done. Integration of the results of X-ray analysis and a distribution of the alteration zones will be carried out. All of the above data will suggest that thermal structure and fluid characteristics in geothermal system. Based on history of the volcanism and alteration age, the history of geothermal activity can be constructed, and thus the relation between the geothermal system and its history will be disclosed. All the information will be integrated to formulate the conceptual model of the geothermal system.
Geochemical survey will be carried out to obtain information about the geothermal fluid in the survey area for selecting the sites of exploration well drilling and for planning the geothermal power development. In order to ascertain the geochemical model constructed by

98
the existing geochemical data, supplemental sampling and analysis of hot spring waters and fumarole gases and review of the existing geochemical information will be carried out. Geothermal fluid (hot spring waters, surface waters, and fumarolic and/or bubbling gases) sampling and analysis will be carried out in and around the survey area to obtain chemical component data and isotope data. The data obtained in the survey will be analyzed and interpreted concerning origin, heating mechanism, subsurface temperature, etc. Furthermore, mixing and flow pattern of the thermal fluid system in the survey area will be revealed with constructing the geochemical model.
Magneto-telluric (MT) survey will be carried out as geophysics with a dense number of stations is to disclose the subsurface resistivity distribution that consolidated to the results of other surface surveys would permit the delineation of promising drilling targets. The resistivity distribution is very useful in precisely delineating the location of fracture systems. It is estimated that beneath the area to be explored with this method, therefore it is highly expected that the results of this survey will be decisive to define the drilling targets.
After conducting all surface resource studies, data collected from these studies will be summarized in the database. An Integrated analysis will be carried out using the database for preparing the geothermal conceptual model. These studies can be entrusted to consulting firm of geothermal development.
5.1.3 Exploration Well Drilling
Based on the results of surface survey, twenty-eight exploratory wells will be drilled at 10- 14 prospects in the eastern Indonesia. The wells, which will be succeeded steam production, will be used as production wells. Moreover, seven reinjection wells will be drilled and condensed water will be injected into these wells. Well drilling will be undertaken by drilling company (or the government institute; Center for Geological resources, Geological Agency). Some material and equipment for drilling will need to be procured through international bidding. Grading of access road, construction of new access road, water supply system, site preparation and preparation of storage area in front of base camp, which will be required for well drilling, will be prepared by contractors for civil works. A geothermal fluid transportation system (FCRS) consists of steam pipeline from the production wells to the power plant, pipeline for carrying wastewater from the power plant to the reinjection wells, and ancillaries including valves and the instrumentation & control system. The planning and design of the geothermal fluid transportation system will be undertaken by the consultant on the basis of close technical discussions with PT. PLN . Supply and installation will be done by a contractor under supervision of PT. PLN and the consultant.

99
5.1.4 Geothermal Reservoir Simulation
Once the results of drilling, well geochemical survey and those of the surface exploration have been consolidated into a conceptual model, the evaluation of the geothermal potential can be conducted through the application of numerical modeling techniques. The ultimate objective will be to determine the sustainable maximum potential of the reservoir and the most adequate scheme to exploit this resource. This survey can be entrusted to geothermal consulting firm.
5.1.5 Conceptual Design for Geothermal Power Plant, CDM
Based on the geothermal resource evaluation carried out before plant construction stage, the optimum development plan of available power output will be formulated.
This plan will be formulated upon thoroughly studying the characteristics of geothermal wells (steam flow, wellhead pressure, steam-hot water ratio (enthalpy), non-condensable gas, chemical composition of well discharge, etc.), turbine type, demand and supply balance in the objective power supply area. Since even at this moment, the power demand has been increasing annually at 8%, the demand situation will become tighter when the project is executed. Taking this into consideration, power demand forecast, development effect, economy to formulate the geothermal development scale, development schedule, power generation capacity (unit capacity and total output), generation type and method will be focused in the project. The power output shall be determined in well coordination with the existing power facilities (diesel power, etc.). The design of geothermal power plants can be entrusted to geothermal consulting firm.
As results of study on well characteristics, the unit capacity and total output shall be determined so that objective plant will not give adverse environmental effect to the surrounding areas.
5.1.6 Application Study of CDM
Substitution diesel power by geothermal power is very auspicious as the CDM project. The effect of GHG (Green House Gas) emission reduction is 0.8(t-CO2/MWh) in case of the generation capacity bigger than 200kW. Based on the results of geothermal reservoir simulation and conceptual design of geothermal power plant, the GHG emission reduction will be estimated and the procedure for registration of CDM project will be started.
5.1.7 Small Scale Power Plant Construction
Small scale power plants of 35MW in total will be constructed after the resource survey and the well drilling. In order to shorten the construction period, the power plant will be

100
constructed on "single package full-turnkey" basis in which a sole contractor will undertake engineering, procurements, supply, installation, test and commissioning.
The power plant construction stage will include steam piping, installation of mist separator, steam turbine, hot-well pumps, generator, main transformer, electrical equipment, instrument and control equipment, communication facilities, ancillary equipment, administration building and warehouse, and related civil and architectural works.
5.1.8 Small Geothermal Power System
(1) Type of Geothermal Turbine-Generator
Flash steam system and binary cycle system are commonly used for small geothermal power plants. Dry steam systems are unlikely to be used in small geothermal plants because dry steam resources are thought to be very rare. The advantages of flash steam systems in small applications include the relative simplicity and low cost of the plant in contrast to binary plants, because of no secondary working fluid. Recent installation of binary cycle systems as small geothermal power system seems to be stronger in number, compared with the flash steam systems, because the binary system can be applied to utilization of geothermal fluid of relatively low temperature.
If vapor dominated type fluid is obtained by tapping geothermal reservoir by production wells, dry steam systems should be applied in consideration of cost and reliability of the plant. Since mechanism of the dry steam plant is very simple, its reliability and economy are favorable in power plant construction and operation.
Because corrosive chemical components are contained in the geothermal fluid, it is necessary to select material of geothermal turbine-generator carefully. The special technique and the know-how are necessary for manufactures of geothermal turbine-generator. Since operators, who do not have enough expertise in geothermal power generation, probably operate the geothermal power plants in the remote areas as off-grid power plants, stable and trouble-free power plants should be installed.
The type of the turbine generator will be decided considering the characteristic of the geothermal resource. Basically, it is assumed that the flash steam system or binary cycle system is introduced and the construction plan is prepared based on the installation of these plants.
(2) Advantages of Small Geothermal Power Plants
The advantages of the small power plants were summarized by Vimmersted (1998). For understanding advantages of small geothermal development, this descriptions are introduced

101
as follows. The advantages are considered to be the projects in the Eastern Indonesia. (http://www.geothermie.de/egec-geothernet/prof/small_geothermal_power.htm). ü The plants are small and very transportable. The plants can be built on a single skid
that fits in a standard trans-ocean container. ü Binary power plants can accommodate a wide range of geothermal reservoir
temperatures, 212 to 300oF (100 to 150oC). Above 300oF (150oC) flashed- steam plants usually prove less expensive than binary plants.
ü The demand for electric capacity per person at off-grid sites will range from 0.2 kW to 1.0 kW.
ü The design of the power plants and their interactions with the wells includes provisions for handling fluctuating loads, including low-instantaneous loads ranging from 0 to 25 percent of the installed capacity.
ü Power plant designs emphasize a high degree of computer-based automation, including self starting. Only semi-skilled labor is needed to monitor plant operation, on a part-time basis. Complete unattended operation might also be possible, with plant performance monitored and controlled remotely through a satellite link.
ü The system releases no greenhouse gases to the atmosphere. There may be very small leakages of the binary-cycle working fluids, but these do not contain chlorine or fluorine and are non-greenhouse gases.
ü All wells could be drilled by truck-mounted rigs, either heavy-duty water-well rigs or light-duty oil/gas-well rigs. At very remote sites, both drilling rig and power system equipment can be transported by helicopter.
ü Injection well costs can be relatively low. For small systems, because the geothermal flow rates are relatively small, rarely will there be a need to inject the fluid back into the production reservoir. Any shallow aquifer not used for drinking water could be used for reinjection. If the fluids are clean enough to be disposed of on the surface, then the disposal costs can be quite low.
ü Field piping costs are low. All wellheads are located near the power plant module. Inexpensive plastic or carbon steel pipe is used to connect wells.
ü Geothermal direct-heat applications can be attached to these electric systems inexpensively. Applications needing temperatures not higher than 150 F (65 C) might be attached (cascaded) in series to the power-plant fluid outlet line.
ü Critical backup need is estimated to range from one to five percent of the installed geothermal capacity. The very high availability factors for geothermal systems, on the order of 98 percent, substantially reduce the cost of special features needed to ensure that power is always available. Small critical loads such as medical refrigeration or pumps for drinking water could be supported against brief unscheduled outages by a diesel engine or by small amounts of battery storage.
(3) Example of Small Geothermal Power Plants
Although the small size geothermal power plants are not so popular, compared to large size

102
geothermal power plants, small geothermal turbine-generators are provided by some manufacturers of Japan, the United States etc. In some geothermal fields, turbine generators, which were made in China, were installed. BPPT is developing small size geothermal power plants for domestic production. However, it is advisable that reliable and well-established turbine generators provided by prestigious manufacturers should be introduced into relatively large scale power plants such as 3-5MW.
Geothermal turbine-generators used at various geothermal power stations in Japan are introduced as follows for the purpose of reference.
(a) Suginoi Hotel flash steam unit (condensing), Beppu, Kyushu, Japan
The plant of 3MW was installed in 1983. The steam and water (143 C) from geothermal wells of about 400 meters depth are used for power generation and the waste fluid is supplied to the hotel for space heating and baths. Recently the turbine generator was exchanged for the new model of high efficiency. The power output of the new generator is 1.9 MW and was furnished by Fuji Electric Co., Ltd. of Japan. Power facilities are shown in Fig. 5-2.
Powerhouse
Generator
Turbine
Control panel Fig. 5-2 Photographs of Suginoi Hotel flash steam unit

103
(b) Kirishima International Hotel flash steam unit (back pressure) and binary unit, Kagoshima, Kyushu, Japan
The plant was installed in 1983. The unit was 100-kW non-condensing flash unit. Simplicity of maintenance of the turbine was one of reasons to be selected the non-condensing unit. Steam of 6 tons/hour from two wells runs through a separator, and an inlet temperature is 127 C at 2.45 bars. Hot water from the separator is used for outdoor bathing, space heating and cooling, hot-water supply, heating of a sauna bath and for two indoor baths.
The electricity from the unit is used for the base load in the hotel such as sewage water treatment, lighting in the hallway and lounge, kitchen refrigerators, and provides 30 to 60% of the hotel load according to the season and time of day. The unit was furnished by Fuji Electric Co., Ltd. of Japan.
Recently new binary turbine generator of maximum capacity of 220kW was installed at the hotel. Power generation is carried out using steam from geothermal wells of 70- 300 meters depth.
(c) Kokonoe Kanko Hotel flash steam unit (condensing), Oita, Kyushu, Japan
The plant was installed in 1998. The condensing unit of 2MW was installed at this hotel and dry steam form geothermal wells are used for power generation. The steam temperature at the turbine inlet is 133 C at 3.0 bars. The turbine exhaust pressure is 0.21 bars. The steam flow supplied from two small production wells is 23 tons/h with 2.0% by weight of non-condensable gas.
(d) Hachijojima Island flash steam unit (condensing), Tokyo, Japan
The plant was complete in early 1999. Hachijojima is a remote island with power supplied from several diesel power plants. The unit has a gross output of 3,300 kW and parasitic load of 9% of the gross output with the non-condensable gas abatement system in operation, and 7% with the abatement system shut down. It is expected that the fuel transportation cost will be drastically reduced once the plant has been in operation. The plant was supplied by Fuji Electric Co. Ltd.,
The steam temperature at the turbine inlet is 170 C at 8.2 bar. The flow rate is 30 tons/h with 1.56% by weight of non-condensable gas. The plant is equipped with a hydrogen sulfide abatement system to comply with the regulation of the Tokyo Metropolitan Government which prescribes the concentration of 0.1 ppm, in this case at the cooling tower cell.
In Indonesia, the small power plant were installed in Indonesia is introduced as follows (John W. Lund, Tonya "Toni" Boyd “Geo-Heat Center” http://www.geothermie.de/

104
egec-geothernet /prof/small_geothermal_power.htm)
(e) Geothermal Power Monobloks, Indonesia
The plant was installed in 1978 and 1981. Two skid-mounted General Electric turbine generator modules have been utilized in Indonesia supplied by Geothermal Power Company of Elmira, New York. The first, a 250-kWe unit, was installed at Kamojang in West Java. The second, a 2.0-MWe unit, was installed at Dieng, Central Java and in 1981. This monoblok weighting 30 tons was then moved by PT. PERTAMINA of Indonesia to the Sibayak geothermal site in North Sumatra, where it was installed as the first geothermal power plant on that island. These units were non-condensing, skid mounted steam turbine and generator with switch gear and control system all mounted in one package. The skid mounted package has a stainless steel outer covering for protection from corrosion due to the H2S gas in the steam.
(f) Representative Layout of Geothermal Power Unite of 5MW (Back Pressure)
The layout of the geothermal power station of 5.5MW provided Japanese Plant Manufacturer is shown in Fig. 5-3.

105
Fig. 5-3 Layout of Back Pressure Turbine Generator Set (5.5 MW)
5.1.9 Transmission/ Distribution Line Construction
The transmission line and substation system will include transmission line from main transformer to a substation, circuit breakers, disconnecting switches, bus, CT, VT, arrestor, supporting structure, insulators, protective relay board and ancillaries. PT. PLN will be the project implementation body for this system, and a consultant will assist PT. PLN in planning, design, procurement, contracting, and supervision of contractor’s works. In order to shorten the construction period, the transmission line and substation system will be procured on "single package full-turnkey" basis, and a sole contractor will undertake engineering, procurements, supply, installation, test and commissioning.

106
The switchyard needs to include two feeders: one for a generator and one for transmission line, with single bus bar because of one unit operation. Voltage transformers and current transformers for metering are to be installed near the high voltage side terminals of generator step-up transformers, in conformity to the rule currently applied to the other power plant.
5.2 Consultant Service
The Project Executing Agency, PT. PLN , will employ a consulting firm that has sufficient experience in all the stages for geothermal resource development and constructing of geothermal power plant, transmission line, substation, and distribution lines. For each stage works, the consultant will assist PT. PLN in planning, design, preparation of bid documents, bidding, bid evaluation, contracting, drawing review, construction supervision, and commissioning. The consultant will also undertake study/analysis and preparation of recommended plan for optimum utilization of the geothermal resource in prospects.
The consultant will be selected through competitive bidding by nominated firms.
5.3 Project Implementation Organization
5.3.1 Project Implementation Bodies
PT. PLN will be the executing agency of this project because of the following background. This project promotes the efficiency and diversification of power supply in the eastern provinces which is the remote and isolated islands, and this project is the small scale geothermal power project utilizing renewable geothermal energy. PT. PLN will undertake the once-through power development, i.e. the whole scope of the project from the geothermal resource development to the power generation, transmission and distribution.
PT. PLN is responsible for power supply in Indonesia, and PT. PLN has ample experiences in implementation of the construction projects of the geothermal power plants, the transmission lines, substations, and distribution lines. PT. PLN will assign their geothermal specialists as the key person for implementation of the drilling of exploration wells which supply geothermal steam to the power plant.
The typical schemes of the Indonesia geothermal power development are illustrated in the following chart (Fig. 5-4). Transmission and distribution system will be handled by PT. PLN. Private company can handle freely geothermal power project, which includes UPSTERAM and DOWNSTREAM. Therefore, PT. PLN can select the project scheme, which contains both UPSTREAM and DOWNSTREAM or one of these. Based on the consultation of MEMR and PT. PLN , the case of Type-A is studied in this report.

107
TYPE -A
TOTAL PROJECT
UPSTREAM
DOWNSTREA
M
Steam Field Developme
nt and
Operation
Power Plant Construction
and Operation
Electricity Transmission
and Distribution
Consumers
ESC PERTAMINA or Private Companies PLN
TYPE -B
UPSTREAM
DOWNSTREA
M
Steam Field Developme
nt and
Operation
Power Plant Construction
and Operation
Electricity
Transmissionand
Distribution
Consumers
SSC ESC PERTAMIN
A or
Private Companies
PLN
or Private
Companies PLN
SSC:Steam Supply Contract ESC:Energy Sales Contract
Fig. 5-4 Typical Schemes of Geothermal Power Development in Indonesia
STEA ELEC. ELEC.
STEA ELEC. ELEC.

108
5.3.2 Project Organization
The project executing agency, PLN will establish the project implementation organization as described in the Fig. 5-5. PT. PLN will employ a consultant to assist resource study and development, and power plant construction. Namely, the consultant will conduct geoscientific survey and exploratory well drilling using drilling contractors and assist bid document preparation, bid evaluation, contracting, design review, supervision of construction, and commissioning in line with rules and guidelines of the Indonesia Government, PT. PLN own and, JBIC. The resource development including well drilling is the most important works in the geothermal power development. The consultant will conduct them responsibly and also conduct supervision of the power plant construction works. The Project shall be consistent with the development programs of the central government and the local government. PT. PLN head office shall communicate and coordinate with the central government BAPPENAS and Ministry of Energy and Mineral Resources, and in the local, the PLN project office with the local governments.
Fig. 5-5 Project Organization
Loan Agreement
Borrower: Government of
Indonesia MOF
Financial Agency: JBIC
Consultant
Power Plant Contractor
Transmission/ Distribution Line
& Substation Contractor
Well Drilling Contractor
Project Executing Agency: PT. PLN (Persero)
Sub-Loan Agreement

109
5.4 Development Schedule
A tentative project implementation schedule is shown in Fig. 5-6. It is considered to take 81 months after commencement of the project (Loan Agreement Effectiveness) until the commercial operation start of the last geothermal power plant of the project. If this project starts in November 2008, the project completion will be in July 2015.
5.4.1 Surface Survey
Bidding for deciding consultant for conducting the surface resource survey and the construction works will be conducting during 8 months from the November 2008, contracting will be executed in the June 2009, and surface survey will be executed during 37 months after the August 2009.
5.4.2 Drilling Survey
Bidding for the drilling will be started in the July 2009, contracting will be executed in the July 2010, and drilling works will be executed in 41 months after the August 2010.
5.4.3 Plant Construction
Bidding for plant construction will be started in the November 2010, contracting will be executed in the October 2011, and plant construction works will be executed in 45 months after the November 2011. 12 months warranty period is included for each power plant after commissioning.
Fig. 5-6 Project Schedule (Tentative)
Year
Loan Agreement JBIC appraisal L/A
0 Overall Schedule 81 months
0.1Advanced work (selecting the prospects) (8) months
1 Procurement 18 months
2 Surface Survey 37 months
3 Drilling Suvey 41 months
4 Plant Construction 45 months
2014 201508 2009 2010 2011 2012 2013
Drilling Survey
Consul-tant
Plant and Transmission Line Construction
Surface Survey
Plant T/LContractor
DrillingContractor

110
5.5 Operation and Maintenance
Organization for operation and maintenance of steam supply system and power plant system is planned as mentioned below.
5.5.1 Steam Supply System
PT. PLN owns and operates steam supply system (production wells, reinjection wells, and geothermal fluid transportation system). PT. PLN has experience and established operational organization for operation and maintenance of steam supply system.
5.5.2 Geothermal Power Plant
Based on ample experience of O&M at other geothermal power plants’ O&M, PT. PLN will establish the O&M organization for small scale geothermal power development project. PT. PLN will carry out O&M after completion and handover of the project.
5.5.3 Transmission/Distribution Line
Since the dedicated transmission and distribution lines for the existing units and the substation have been operated and maintained by PT. PLN , operation and maintenance of new transmission and distribution lines will be operated and maintained by PT. PLN as well. For facilitate operation of power plant especially for synchronization of generator to the grid, circuit breakers of step-up transformer operation authority should only be given to power plant operator.
5.6 Project Cost Estimate
Table 5-1 shows project cost estimation.
Table 5-1 Contents of Project Cost
Foreign Local TotalMillion Million MillionUSD USD USD
1 Steam Field Development 49.70 1.75 51.452 Power Plant 45.68 6.83 52.503 Transmission Line 1.44 13.16 14.604 Physical Contingency 11.33 2.54 13.875 Consultant Fee 16.46 3.70 20.166 Administration Cost 0.00 5.93 5.937 IDC 0.40 2.03 2.44
TOTAL 125.01 35.94 160.95

111
Due to the recent inflationary cost of raw materials in the world and difficulty to secure those materials in a certain period, the figures shown here would be reviewed and changeable at the time of project implementation.
5.7 Financial Arrangement Plan
PT. PLN is responsible for procuring the financial resources needed for the implementation of the project.
5.7.1 Finance of the Project
It is assumed that JBIC will participate as financier under the Yen Loan scheme, which can apply for the facility provided by Japanese supplier. Interest of the Yen Loan will be determined by CIRR (Commercial Interest Reference Rate) and a country risk premium at making a loan agreement. The assumption also includes the participation of other banks. Table 5-2 shows terms and conditions of JBIC Yen Loan and the other bank or reference only.
Table 5-2 Terms and Conditions of Loans
*) These values of interest were derived from a trial calculation by West JEC.
JBIC ODA CommercialYen Loan Bank
Interest Rate 0.65% 12.00%Grace Period(year) 10 0Repayment(year) 30 6
Financing Condition

112
Chapter 6 Economic Assessment
6.1 Economic Evaluation
6.1.1 Methodology
The economic viability of the eastern Indonesia geothermal development project is evaluated by an economic internal rate of return (EIRR) method. An alternative power project that is capable to give the same services (salable energy) is assumed, and net present value of costs for the Project and the alternative are compared for the project life in order to obtain EIRR. The obtained EIRR is compared with the hurdle rate (12 %) to evaluate the economic viability of the project. Besides, sensitivity of the EIRR value to some important parameters is tested to check economic vulnerabilities of the project.
6.1.2 Alternative
(1) Selection of alternative
As an alternative power source, a diesel power plant is selected in consideration of power sources in the eastern provinces
(2) Operating conditions and cost
Operating conditions and costs of the alternative project are as follows.
Power plant : Diesel power plant Operating condition : Base load Unit capacity : 35 MW No. of unit : 1 House service load : 7% Transmission and distribution loss : 8.5% Capacity factor : 85 %
Generating Efficiency : 31%
Plant life : 30 years Construction cost : 1100 USD/kW O&M cost : 7.5 cent/kWh
113
(3) Fuel
Fuel data used for the calculation is as follows.
(4) Construction period and plant life adjustment
The construction period of the alternative diesel power plant is assumed 12 months. Since the project duration is 30 years, same as that of the alternative, no adjustment of the investment cost handling becomes necessary.
6.1.3 Project
(1) Steam production facilities
To secure operation of 35MW total small scale geothermal power units, 28 production wells will be drilled during the construction period together with geothermal fluid transportation system. It is noted that 14 production wells will be used at the commissioning, based on assumption of success rate 50%.
(2) Power plant, transmission lines and substation facilities
Unit capacity : 35 MW No. of unit : - House service load : 7 % Capacity factor : 85 % Transmission and distribution loss : 8.5% Capacity factor 85 % Plant life : 30 years Construction cost : 1100 USD/kW O&M cost : 7.5 cent/kWh
(3) Project cost
Project cost is shown in Table 5-1.
(4) Exchange rates
The following exchange rates are used throughout this economic and financial evaluation.
Fuel : HSD(High Speed Diesel Oil) Fuel Price : 20.4 cent/liter
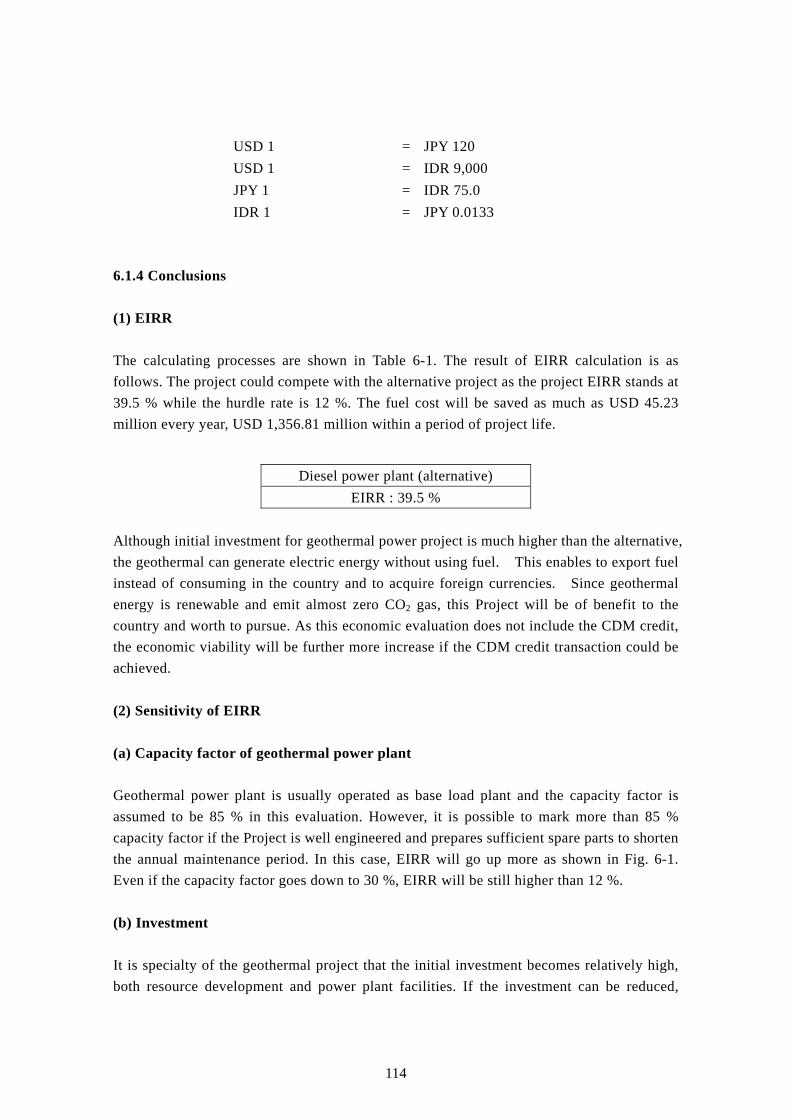
114
USD 1 = JPY 120 USD 1 = IDR 9,000 JPY 1 = IDR 75.0 IDR 1 = JPY 0.0133
6.1.4 Conclusions
(1) EIRR
The calculating processes are shown in Table 6-1. The result of EIRR calculation is as follows. The project could compete with the alternative project as the project EIRR stands at 39.5 % while the hurdle rate is 12 %. The fuel cost will be saved as much as USD 45.23 million every year, USD 1,356.81 million within a period of project life.
Diesel power plant (alternative) EIRR : 39.5 %
Although initial investment for geothermal power project is much higher than the alternative, the geothermal can generate electric energy without using fuel. This enables to export fuel instead of consuming in the country and to acquire foreign currencies. Since geothermal energy is renewable and emit almost zero CO2 gas, this Project will be of benefit to the country and worth to pursue. As this economic evaluation does not include the CDM credit, the economic viability will be further more increase if the CDM credit transaction could be achieved.
(2) Sensitivity of EIRR
(a) Capacity factor of geothermal power plant
Geothermal power plant is usually operated as base load plant and the capacity factor is assumed to be 85 % in this evaluation. However, it is possible to mark more than 85 % capacity factor if the Project is well engineered and prepares sufficient spare parts to shorten the annual maintenance period. In this case, EIRR will go up more as shown in Fig. 6-1. Even if the capacity factor goes down to 30 %, EIRR will be still higher than 12 %.
(b) Investment
It is specialty of the geothermal project that the initial investment becomes relatively high, both resource development and power plant facilities. If the investment can be reduced,

115
EIRR will go up. However, if the project cost is increased by 300%, EIRR will be lower than the hurdle rate of 12% (Fig. 6-2).
(c) Fuel price
The change of fuel price for alternative thermal power plant also gives influence on the Project EIRR. However, even if the fuel price should drop 0.2 US$/liter, EIRR will be still higher than the hurdle rate of 12% as shown in Fig. 6-3. The Project should be considered favorable from the standpoint of the national economy, i.e. to acquire foreign currency by export of fossil fuel.
Fig. 6-1 EIRR Sensitivity to Capacity Factor
Fig. 6-2 EIRR Sensitivity to Project Cost
0%
10%
20%
30%
40%
50%
20% 30% 40% 50% 60% 70% 80%
EIR
R
Capacity Factor
Capacity EIRRFactor
20% 8.5%30% 13.7%40% 18.5%50% 23.2%60% 27.9%70% 32.5%80% 37.2%
Project EIRRCost100% 39.5%125% 29.7%150% 23.8%175% 19.8%200% 16.9%250% 12.9%300% 10.3%
0%
10%
20%
30%
40%
50%
100% 150% 200% 250% 300%
EIR
R
Project Cost Change

116
Fig. 6-3 EIRR Sensitivity to Fuel Cost
Table 6-1 Economic Internal Rate of Return
Model: Eastern Indonesia 35MW Total GPP EIRR = 39.53%
PROJECT ALTERNATIVE : [Diesel Power Plant]
YearProjectCost
CapacityCapacityFactor
AnnualSalableEnergy
O&M Cost
Supple.DrillingCost
TotalCost
Alt.ProjectCost
CapacityCapacityFactor
AnnualSalableEnergy
Effici-ency
FuelConsump.
Fuel Cost(FuelSave)
O&MCost
TotalCost
CostBalance
MM$ MW % GWh MM$ MM$ MM$ MM$ MW % GWh % Mil. Kg MM$ MM$ MM$ MM$
-1 158.51 - - - - - 158.51 38.50 - - - - - - - 38.50 -120.01 1 - 35 85.0 221.77 2.22 - 2.22 35 85.0 221.77 31 66.51 45.23 4.44 49.66 47.442 - 35 85.0 221.77 2.22 - 2.22 35 85.0 221.77 31 66.51 45.23 4.44 49.66 47.443 - 35 85.0 221.77 2.22 - 2.22 35 85.0 221.77 31 66.51 45.23 4.44 49.66 47.444 - 35 85.0 221.77 2.22 - 2.22 35 85.0 221.77 31 66.51 45.23 4.44 49.66 47.445 - 35 85.0 221.77 2.22 - 2.22 35 85.0 221.77 31 66.51 45.23 4.44 49.66 47.446 - 35 85.0 221.77 2.22 - 2.22 35 85.0 221.77 31 66.51 45.23 4.44 49.66 47.447 - 35 85.0 221.77 2.22 - 2.22 35 85.0 221.77 31 66.51 45.23 4.44 49.66 47.448 - 35 85.0 221.77 2.22 - 2.22 35 85.0 221.77 31 66.51 45.23 4.44 49.66 47.449 - 35 85.0 221.77 2.22 - 2.22 35 85.0 221.77 31 66.51 45.23 4.44 49.66 47.44
10 - 35 85.0 221.77 2.22 - 2.22 35 85.0 221.77 31 66.51 45.23 4.44 49.66 47.4411 - 35 85.0 221.77 2.22 - 2.22 35 85.0 221.77 31 66.51 45.23 4.44 49.66 47.4412 - 35 85.0 221.77 2.22 - 2.22 35 85.0 221.77 31 66.51 45.23 4.44 49.66 47.4413 - 35 85.0 221.77 2.22 - 2.22 35 85.0 221.77 31 66.51 45.23 4.44 49.66 47.4414 - 35 85.0 221.77 2.22 - 2.22 35 85.0 221.77 31 66.51 45.23 4.44 49.66 47.4415 - 35 85.0 221.77 2.22 - 2.22 35 85.0 221.77 31 66.51 45.23 4.44 49.66 47.4416 - 35 85.0 221.77 2.22 - 2.22 35 85.0 221.77 31 66.51 45.23 4.44 49.66 47.4417 - 35 85.0 221.77 2.22 - 2.22 35 85.0 221.77 31 66.51 45.23 4.44 49.66 47.4418 - 35 85.0 221.77 2.22 - 2.22 35 85.0 221.77 31 66.51 45.23 4.44 49.66 47.4419 - 35 85.0 221.77 2.22 - 2.22 35 85.0 221.77 31 66.51 45.23 4.44 49.66 47.4420 - 35 85.0 221.77 2.22 - 2.22 35 85.0 221.77 31 66.51 45.23 4.44 49.66 47.4421 - 35 85.0 221.77 2.22 - 2.22 35 85.0 221.77 31 66.51 45.23 4.44 49.66 47.4422 - 35 85.0 221.77 2.22 - 2.22 35 85.0 221.77 31 66.51 45.23 4.44 49.66 47.4423 - 35 85.0 221.77 2.22 - 2.22 35 85.0 221.77 31 66.51 45.23 4.44 49.66 47.4424 - 35 85.0 221.77 2.22 - 2.22 35 85.0 221.77 31 66.51 45.23 4.44 49.66 47.4425 - 35 85.0 221.77 2.22 - 2.22 35 85.0 221.77 31 66.51 45.23 4.44 49.66 47.4426 - 35 85.0 221.77 2.22 - 2.22 35 85.0 221.77 31 66.51 45.23 4.44 49.66 47.4427 - 35 85.0 221.77 2.22 - 2.22 35 85.0 221.77 31 66.51 45.23 4.44 49.66 47.4428 - 35 85.0 221.77 2.22 - 2.22 35 85.0 221.77 31 66.51 45.23 4.44 49.66 47.4429 - 35 85.0 221.77 2.22 - 2.22 35 85.0 221.77 31 66.51 45.23 4.44 49.66 47.4430 - 35 85.0 221.77 2.22 - 2.22 35 85.0 221.77 31 66.51 45.23 4.44 49.66 47.44
158.51 6,652.98 66.53 - 225.04 38.50 6,652.98 1,995.31 1,356.81 133.06 1,528.37 1,303.33
Fuel Price EIRR($/ton)
0.10 6.2%0.15 9.5%0.20 12.6%0.30 18.4%0.50 29.5%0.70 40.6%
0%
10%
20%
30%
40%
50%
0.10 0.20 0.30 0.40 0.50 0.60 0.70
EIR
R
Fuel Price ($/ton)

117
6.2 Financial Evaluation
6.2.1 Methodology
A financial internal rate of return (FIRR) method will be applied: an internal rate of return to equalize the cost (investment and operating costs) and revenue by sales of energy generated for the project life will be calculated. The obtained rate will be compared with the opportunity cost of capital.
6.2.2 Project Income Cash Flow
(1) Fund procurement
The currency portion of 85% of the project will be procured from the Yen Loan extended by JBIC with the following terms and conditions. The other currency portion will be prepared by the project implementation body at an interest of 12.00 %.
Interest : 0.65 % Repayment : 40 years Grace period : 10 years
(2) Opportunity cost of capital
The opportunity cost of capital of this project will be a weighted average cost of capital (WACC) between foreign and local costs. WACC for this project is as follows.
Project WACC 2.35 %
(3) Electricity tariff
The electricity tariff is calculated 14 cent/kWh under the condition of the target FIRR 12% for PT. PLN (government) project.
6.2.3 Project Outgoing Cash Flow
(1) Disbursement schedule
Project cost is assumed to be disbursed in a year.

118
(2) Operation and maintenance cost
The operation and maintenance cost is assumed at 2.22 million USD annually (1 cent/kWh).
6.2.4 Conclusions
(1) FIRR
The FIRR value registered 11.95 % as shown in Table 6-2. As this value exceeds the WACC at 2.35 %, the Project becomes financially feasible with the conditions assumed at present. Table 6-3 to Table 6-4 shows Repayment schedule and Cash flow statement, respectively.
FIRR WACC
11.95 % 2.35 %
(2) Sensitivity of FIRR
(a) Capacity factor of geothermal power plant
The lower capacity factor power plant operates at, the less FIRR becomes as shown in Fig. 6-4. In case of capacity factor goes down to 45 %, FIRR registers 6.34 % and which became infeasible.
(b) Project cost
In case of the project cost becomes 140 % higher, FIRR becomes 8.68 %, which is still feasible. Due to brisk economic activities in Asia, China and India in particular, the market prices of metal and non-metal materials are sharply increasing. The power plant construction cost estimated at the present value may increase and that may adversely affect financial viability (Fig. 6-5).
(c) Tariff rate
In case of the tariff rate decreases to 7 cent/kWh, the FIRR will be 5.41 %, which becomes infeasible as shown in Fig. 6-6. This financial evaluation, however, does not include the CDM credit transaction, and if the transaction should be included, the project financial viability may offset between tariff rate decrease and inclusion of CDM credit transactions.

119
(3) Sensitivity of Tariff Rate
Since the obtained tariff rate 14 cent/kWh in case of target FIRR 12 % for government project, but the electricity tariff should be higher for private project. Private company is considered to aim target FIRR 16%.
Fig. 6-7 shows the calculation results of tariff rate for government and private project. In case the project execute scheme Case-1, The Government of Indonesia can reduce the maximum reduction effect of subsidy for electricity.
Fig. 6-7 shows accumulate balance of project cash flow. In case of the project is implemented by private company as total project (both up-stream and down-stream), private company should finance more than 50 million USD as operating annual working funds. The debt for working funds will be heavy load for private company.
Fig. 6-4 FIRR Sensitivity to Capacity Factor
Fig. 6-5 FIRR Sensitivity to Project Cost
0%
4%
8%
12%
16%
40% 50% 60% 70% 80% 90%
FIR
R
Capacity Factor
Capacity FIRRFactor
40% 5.53%45% 6.34%50% 7.11%55% 7.85%65% 9.28%75% 10.64%85% 11.95%
Project FIRRCost100% 11.95%120% 10.08%140% 8.68%160% 7.58%180% 6.68%190% 6.30%200% 5.94%
0%
4%
8%
12%
16%
100% 120% 140% 160% 180% 200%
FIR
R
Project Cost Change

120
Fig. 6-6 FIRR Sensitivity to Tariff Rate
Table 6-2 Financial Internal Rate of Return
Tariff FIRR(¢/kWh)
5.00 2.80%6.00 4.26%7.00 5.41%9.00 7.46%
11.00 9.33%13.00 11.10%
0%
4%
8%
12%
16%
6.0 7.0 8.0 9.0 10.0 11.0 12.0 13.0
FIR
R
Electricity Tarif f (UScent)
[MM $]
Year OUTPUT REVENUE NET INCOME TAX NET INCOME CASH FLOW
No. of
MW Supplem. SUPPLM. TOTAL TOTAL OPER SUP. WELL TOTAL NET [After Tax] FREETotal Total Wells INVEST. INVEST. REVENUE COST CIATION DEPN. EXPENSES INCOME CASH FLOW
1 2 3 4 5 6 7 8 9 10 11 12 13 [2+3] [6+7+8] [5-9] [10-11] [-4+7+8+12]
[GWh] [1.3 M$/well] [14 ¢/kWh] [1.0 ¢/kWh] [ 47% ]-1 158.51 158.51 0.00 0.00 -158.51 1 35 221.77 0.00 31.05 2.22 8.05 10.27 20.78 8.01 12.77 20.822 35 221.77 31.05 2.22 8.05 10.27 20.78 8.24 12.55 20.593 35 221.77 31.05 2.22 8.05 10.27 20.78 8.46 12.32 20.374 35 221.77 31.05 2.22 8.05 10.27 20.78 8.68 12.10 20.155 35 221.77 31.05 2.22 8.05 10.27 20.78 8.91 11.87 19.926 35 221.77 31.05 2.22 8.05 10.27 20.78 9.13 11.65 19.707 35 221.77 31.05 2.22 8.05 10.27 20.78 9.35 11.43 19.488 35 221.77 31.05 2.22 8.05 10.27 20.78 9.35 11.43 19.489 35 221.77 31.05 2.22 8.05 10.27 20.78 9.35 11.43 19.48
10 35 221.77 31.05 2.22 8.05 10.27 20.78 9.35 11.43 19.4811 35 221.77 31.05 2.22 8.05 10.27 20.78 9.35 11.43 19.4812 35 221.77 31.05 2.22 8.05 10.27 20.78 9.37 11.41 19.4613 35 221.77 31.05 2.22 8.05 10.27 20.78 9.38 11.40 19.4514 35 221.77 31.05 2.22 8.05 10.27 20.78 9.40 11.39 19.4315 35 221.77 31.05 2.22 8.05 10.27 20.78 9.41 11.37 19.4216 35 221.77 31.05 2.22 8.05 10.27 20.78 9.42 11.36 19.4117 35 221.77 31.05 2.22 8.05 10.27 20.78 9.44 11.34 19.3918 35 221.77 31.05 2.22 8.05 10.27 20.78 9.45 11.33 19.3819 35 221.77 31.05 2.22 8.05 10.27 20.78 9.47 11.32 19.3620 35 221.77 31.05 2.22 8.05 10.27 20.78 9.48 11.30 19.3521 35 221.77 31.05 2.22 2.22 28.83 13.28 15.55 15.5522 35 221.77 31.05 2.22 2.22 28.83 13.29 15.54 15.5423 35 221.77 31.05 2.22 2.22 28.83 13.30 15.53 15.5324 35 221.77 31.05 2.22 2.22 28.83 13.31 15.51 15.5125 35 221.77 31.05 2.22 2.22 28.83 13.33 15.50 15.5026 35 221.77 31.05 2.22 2.22 28.83 13.34 15.49 15.4927 35 221.77 31.05 2.22 2.22 28.83 13.36 15.47 15.4728 35 221.77 31.05 2.22 2.22 28.83 13.37 15.46 15.4629 35 221.77 31.05 2.22 2.22 28.83 13.39 15.44 15.4430 35 221.77 31.05 2.22 2.22 28.83 13.40 15.43 15.43
6,652.98 158.51 0 0.00 158.51 931.42 66.53 160.95 0.00 227.48 703.93 316.39 387.55 389.99
Electricity Price 14.00 (¢/kWh) Escalation 0.00 %/yearWACC of Project: 2.35% Project F.I.R.R. 11.95%
GWH SALE
SALES
DEPRE-
INVESTMENT
INITIALINV.
(w/o IDC)
COSTS
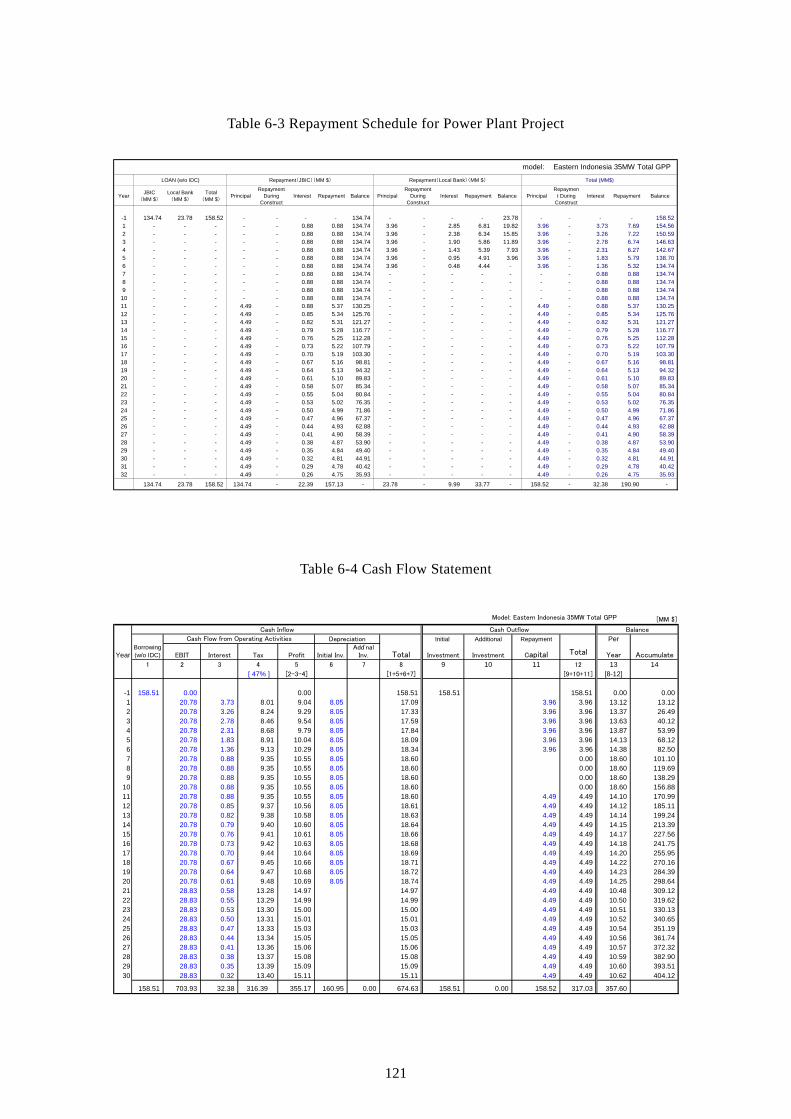
121
Table 6-3 Repayment Schedule for Power Plant Project
Table 6-4 Cash Flow Statement
model: Eastern Indonesia 35MW Total GPP
LOAN (w/o IDC) Repayment(JBIC)(MM $) Repayment(Local Bank)(MM $) Total (MM$)
Year JBIC(MM $)
Local Bank(MM $)
Total(MM $)
PrincipalRepayment
DuringConstruct
Interest Repayment Balance PrincipalRepayment
DuringConstruct
Interest Repayment Balance PrincipalRepaymen
t DuringConstruct
Interest Repayment Balance
-1 134.74 23.78 158.52 - - - - 134.74 - - - - 23.78 - - - - 158.52 1 - - - - - 0.88 0.88 134.74 3.96 - 2.85 6.81 19.82 3.96 - 3.73 7.69 154.56 2 - - - - - 0.88 0.88 134.74 3.96 - 2.38 6.34 15.85 3.96 - 3.26 7.22 150.59 3 - - - - - 0.88 0.88 134.74 3.96 - 1.90 5.86 11.89 3.96 - 2.78 6.74 146.63 4 - - - - - 0.88 0.88 134.74 3.96 - 1.43 5.39 7.93 3.96 - 2.31 6.27 142.67 5 - - - - - 0.88 0.88 134.74 3.96 - 0.95 4.91 3.96 3.96 - 1.83 5.79 138.70 6 - - - - - 0.88 0.88 134.74 3.96 - 0.48 4.44 - 3.96 - 1.36 5.32 134.74 7 - - - - - 0.88 0.88 134.74 - - - - - - - 0.88 0.88 134.74 8 - - - - - 0.88 0.88 134.74 - - - - - - - 0.88 0.88 134.74 9 - - - - - 0.88 0.88 134.74 - - - - - - - 0.88 0.88 134.74
10 - - - - - 0.88 0.88 134.74 - - - - - - - 0.88 0.88 134.74 11 - - - 4.49 - 0.88 5.37 130.25 - - - - - 4.49 - 0.88 5.37 130.25 12 - - - 4.49 - 0.85 5.34 125.76 - - - - - 4.49 - 0.85 5.34 125.76 13 - - - 4.49 - 0.82 5.31 121.27 - - - - - 4.49 - 0.82 5.31 121.27 14 - - - 4.49 - 0.79 5.28 116.77 - - - - - 4.49 - 0.79 5.28 116.77 15 - - - 4.49 - 0.76 5.25 112.28 - - - - - 4.49 - 0.76 5.25 112.28 16 - - - 4.49 - 0.73 5.22 107.79 - - - - - 4.49 - 0.73 5.22 107.79 17 - - - 4.49 - 0.70 5.19 103.30 - - - - - 4.49 - 0.70 5.19 103.30 18 - - - 4.49 - 0.67 5.16 98.81 - - - - - 4.49 - 0.67 5.16 98.81 19 - - - 4.49 - 0.64 5.13 94.32 - - - - - 4.49 - 0.64 5.13 94.32 20 - - - 4.49 - 0.61 5.10 89.83 - - - - - 4.49 - 0.61 5.10 89.83 21 - - - 4.49 - 0.58 5.07 85.34 - - - - - 4.49 - 0.58 5.07 85.34 22 - - - 4.49 - 0.55 5.04 80.84 - - - - - 4.49 - 0.55 5.04 80.84 23 - - - 4.49 - 0.53 5.02 76.35 - - - - - 4.49 - 0.53 5.02 76.35 24 - - - 4.49 - 0.50 4.99 71.86 - - - - - 4.49 - 0.50 4.99 71.86 25 - - - 4.49 - 0.47 4.96 67.37 - - - - - 4.49 - 0.47 4.96 67.37 26 - - - 4.49 - 0.44 4.93 62.88 - - - - - 4.49 - 0.44 4.93 62.88 27 - - - 4.49 - 0.41 4.90 58.39 - - - - - 4.49 - 0.41 4.90 58.39 28 - - - 4.49 - 0.38 4.87 53.90 - - - - - 4.49 - 0.38 4.87 53.90 29 - - - 4.49 - 0.35 4.84 49.40 - - - - - 4.49 - 0.35 4.84 49.40 30 - - - 4.49 - 0.32 4.81 44.91 - - - - - 4.49 - 0.32 4.81 44.91 31 - - - 4.49 - 0.29 4.78 40.42 - - - - - 4.49 - 0.29 4.78 40.42 32 - - - 4.49 - 0.26 4.75 35.93 - - - - - 4.49 - 0.26 4.75 35.93
134.74 23.78 158.52 134.74 - 22.39 157.13 - 23.78 - 9.99 33.77 - 158.52 - 32.38 190.90 -
Model: Eastern Indonesia 35MW Total GPP [MM $]
Cash Inflow Cash Outflow Balance
Initial Additional Repayment Per
Year EBIT Interest Tax Profit Initial Inv.Add'nal
Inv. Investment Investment Capital Total Year Accumulate1 2 3 4 5 6 7 8 9 10 11 12 13 14
[ 47% ] [2-3-4] [1+5+6+7] [9+10+11] [8-12]
-1 158.51 0.00 0.00 158.51 158.51 158.51 0.00 0.001 20.78 3.73 8.01 9.04 8.05 17.09 3.96 3.96 13.12 13.122 20.78 3.26 8.24 9.29 8.05 17.33 3.96 3.96 13.37 26.493 20.78 2.78 8.46 9.54 8.05 17.59 3.96 3.96 13.63 40.124 20.78 2.31 8.68 9.79 8.05 17.84 3.96 3.96 13.87 53.995 20.78 1.83 8.91 10.04 8.05 18.09 3.96 3.96 14.13 68.126 20.78 1.36 9.13 10.29 8.05 18.34 3.96 3.96 14.38 82.507 20.78 0.88 9.35 10.55 8.05 18.60 0.00 18.60 101.108 20.78 0.88 9.35 10.55 8.05 18.60 0.00 18.60 119.699 20.78 0.88 9.35 10.55 8.05 18.60 0.00 18.60 138.29
10 20.78 0.88 9.35 10.55 8.05 18.60 0.00 18.60 156.8811 20.78 0.88 9.35 10.55 8.05 18.60 4.49 4.49 14.10 170.9912 20.78 0.85 9.37 10.56 8.05 18.61 4.49 4.49 14.12 185.1113 20.78 0.82 9.38 10.58 8.05 18.63 4.49 4.49 14.14 199.2414 20.78 0.79 9.40 10.60 8.05 18.64 4.49 4.49 14.15 213.3915 20.78 0.76 9.41 10.61 8.05 18.66 4.49 4.49 14.17 227.5616 20.78 0.73 9.42 10.63 8.05 18.68 4.49 4.49 14.18 241.7517 20.78 0.70 9.44 10.64 8.05 18.69 4.49 4.49 14.20 255.9518 20.78 0.67 9.45 10.66 8.05 18.71 4.49 4.49 14.22 270.1619 20.78 0.64 9.47 10.68 8.05 18.72 4.49 4.49 14.23 284.3920 20.78 0.61 9.48 10.69 8.05 18.74 4.49 4.49 14.25 298.6421 28.83 0.58 13.28 14.97 14.97 4.49 4.49 10.48 309.1222 28.83 0.55 13.29 14.99 14.99 4.49 4.49 10.50 319.6223 28.83 0.53 13.30 15.00 15.00 4.49 4.49 10.51 330.1324 28.83 0.50 13.31 15.01 15.01 4.49 4.49 10.52 340.6525 28.83 0.47 13.33 15.03 15.03 4.49 4.49 10.54 351.1926 28.83 0.44 13.34 15.05 15.05 4.49 4.49 10.56 361.7427 28.83 0.41 13.36 15.06 15.06 4.49 4.49 10.57 372.3228 28.83 0.38 13.37 15.08 15.08 4.49 4.49 10.59 382.9029 28.83 0.35 13.39 15.09 15.09 4.49 4.49 10.60 393.5130 28.83 0.32 13.40 15.11 15.11 4.49 4.49 10.62 404.12
158.51 703.93 32.38 316.39 355.17 160.95 0.00 674.63 158.51 0.00 158.52 317.03 357.60
Total
Cash Flow from Operating ActivitiesBorrowing(w/o IDC)
Depreciation

122
Case 1-1 Case1-2 Case2 (Case3) Up-Stream
(Steam Production)
Down-Stream (Power Generation)
WACC
Target FIRR %
Government
PLN
2.35
12
PLN
PLN
2.35
12
Government
Private
7.12
16
(Private)
(Private)
12.00
(16)
Fig. 6-7 Accumulate Balance of cash flow
-100
-50
0
50
100
150
200
-1 1 2 3 4 5 6 7 8 9 10 11 12Accu
mul
ate
Balan
ce(m
illion
USD)
Year
Case1:G-G(PLN)
Case2:G-P
Case3:P-P
-100
0
100
200
300
400
500
600
-1 1 2 3 4 5 6 7 8 9 10 11 12 13 14 15 16 17 18 19 20 21 22 23 24 25 26 27 28 29 30
Accu
mul
ate
Balan
ce(m
illion
USD
)
Year
Case1:G-G(PLN)
Case2:G-P
Case3:P-P


123
Chapter 7 Preparation of Geothermal Power Development Project
7.1 Necessity of Preparation Study
In the project of geothermal power development in the eastern remote islands, Ministry of Energy and Mineral Resource (MEMR) of the Indonesian Government intends to substitute the diesel power generators by the geothermal power turbine-generators. As described previously, power business by the diesel power generation in the rural areas has confronted difficulty in economy due to recent inflationary price of fossil fuel. The Government and PT. PLN have a bigger economic burden for power supply to the rural areas. This geothermal project is strongly expected as a countermeasure against faltering economy of rural power supply business by PT. PLN. In addition, geothermal development is expected to contribute to social development in the rural areas by introducing multipurpose utilization of geothermal energy.
Since economy of the diesel power generation has deteriorated day by day, the Government and PT. PLN decided to promote geothermal power development as substitute of the diesel power generation. The first development target was decided to be power plant construction of 35 MW in total in the meeting among MEMR, BAPPENAS, MOF and PT. PLN on 12 March 2008, considering power demand in the eastern area and project support from Japan. If the financial support cannot be obtained from Japan, it is difficult to realize the development project. The support by the Japanese ODA Yen Loan is strongly expected for improvement of the project economy. The project must meet the requirements of the ODA Yen Loan project such as project feasibility including estimation of geothermal resource potential, development program, environmental constraints etc
The Government and PT. PLN have studied geothermal power development in the islands and the Japanese Government supported their activity through the research study by NEDO and the feasibility study by JETRO. However, these study projects have concentrated on the Flores Island. The geothermal power plant construction has not been realized even in the Flores Island so far, due to lacking of adequate financial support and development organization.
About geothermal areas other than the Flores Island, there is no adequate data for preparation of geothermal power development plans. For realizing the development projects by the Japanese ODA Yen Loan, project feasibility of the geothermal development in each field should be clarified on the basis of data of geothermal resource, future power demand and environmental constraints, before starting the development project.
When the geothermal power development including the steam development is planned, geological data and geochemical data for revealing the resource characteristics and

124
potentials are generally collected by the surface surveys in consideration of reduction of the project cost and risk. In addition, MT survey as one of geophysical surveys is executed in the field, where the project will be started, and the geothermal structure and the extent of the geothermal reservoir are clarified in this survey. Provided that integrated interpretation on the geothermal resource and structure is conducted, drilling target of the exploratory wells can be decided. Since it takes a considerable amount of time and cost to conduct whole surface surveys, the detailed surface surveys should be conducted in the main project.
Since the project contains the entire development plans in various islands, study program and development plan of each field should be prepared based on the geothermal resource data by preliminary geological survey and geochemical survey, and data and information of predicted future power demand and environmental constraints, before starting the main project. Namely, feasibility study report from steam development study to power plant construction of all geothermal fields is required. At present, data and information on the feasibility study of geothermal fields in the eastern area have been partially collected. Since the only geothermal potential and possibility of power development in the listed areas can be understood, the resource data should be collected by the preliminary geological survey and geochemical survey and development program should be prepared. Regarding geothermal power development in the Flores Island, some part of development plan should be modified in accordance with present development policy by PT. PLN.
It is thought that a more certain project becomes possible despite of securing steam in resource development study, if these preliminarily resource surveys and project planning are conducted before start of the development project supported by Yen Loan.
7.2 Supplementary Study and Project Planning
The Government desires to study development possibility of 37 geothermal fields in the eastern area for substitution of diesel power generation. Present information and data of some fields in the area can be used for judgment of the project feasibility and the project planning, but those of most fields are insufficient. At least, about 20 fields' data should be collected before starting the project. If supporting the project by ODA Yen Loan is supposed, it is desired that the preparation study is conducted using JBIC scheme of SAPPROF (Special Assistance for Project Formation).
Necessary supplementary studies are summarized as follows.
(1) Study Content;
(a) Selection study of development sites
ü Geological survey

125
ü Geochemical survey
ü Geothermal structure modeling and resources potential assessments (power output
estimation)
ü Location analysis and environmental study
ü Study for future power demand and substitution of existing power plants by
geothermal power plants
ü Development site selection
(b) Project Planning
ü Geothermal resource survey and development (steam development and wastewater
treatment) (including well drilling)
ü Construction of surface facilities such as power plants, transmission lines etc.
(c) Economic and financial evaluation
ü Economic and financial evaluation of project
ü CDM project
(2) Study sites; 20 fields in the eastern provinces
(3) Study period; 5 months
Using collected data during this study and those in other reports, the project feasibility of each field will be judged and detailed program for geothermal power development in each field in the eastern provinces will be prepared.


126
Chapter 8 Project Potential for CDM
8.1 CO2 Emission by Power Source
The geothermal power generation is considered that the amount of the CO2 emission at the life cycle is less than that of other power supplies (CRIEPI, 2000). For instance, the coal-fired generation exhausts 65 times CO2 compared with the geothermal power generation (Fig. 8-1).
Moreover, the geothermal power plant generates an electric power that is high utilization rates, bigger than the other renewable energy. Therefore, a big effect of the CO2 emission reduction can be expected, it is attractive as the CDM project.
Source: Modify Denchuken News No.338 (CRIEPI,2000)
Fig. 8-1 CO2 Emission by Power Source
8.2 CDM Institution in Indonesia
After the singing of Kyoto Protocol in 1997, the house of Representative of the Republic Indonesia passed the law on ratification of the Kyoto Protocol on June 28, 2004. The secretary of state issued Law No. 17/2004 on July 28, 2004, and Indonesia submitted the Kyoto Protocol ratification instrument to UN on December 3, 2004 and it was authorized at the plenary assembly of UN on March 3, 2005. The detail CDM system procedures were
0.130
0.088
0.408
0.478
0.704
0.887
0.038
0.053
0.011
0.015
0.022
0.029
0.111
0.0 0.1 0.2 0.3 0.4 0.5 0.6 0.7 0.8 0.9 1.0
Mini Hydro
Geothermal
Nuclear
Wind
Solar
LNG Combined
LNG Thermal
Oil Thermal
Coal Thermal
Pow
er S
ourc
e
CO2 Emission Factor (t-CO2/MWh)
Facility/OperationFuel for Power Generation
0.975
0.608
0.742
0.519

127
described in the decree of Minister of Environment No. 206 of 2005 issued on July 21, 2005. Approval process by National Commission for Clean Development Mechanism (Designated National Authority: DNA) by decree is given in Fig. 8-2.
Fig. 8-2 Project Screening Process by DNA
8.3 Geothermal Project
Today, 47 CDM projects have been approved by Indonesian DNA.
Regarding adoption of CDM to geothermal power project in Indonesia, Unocal had filed applications with the Dutch Government to adopt CDM to geothermal projects in Sarulla and Wayang-Windu in the past. For the Sarulla project, PT. PLN also participated in the application with Unocal and PT. PERTAMINA. These attempts for CDM realization,
Document
completion
NC-CDM
Decision meeting
within 3
months
Project proponent NC-CDM
Internal meeting
Secretariat
receives evaluation
Secretariat
receives
Technical team
evaluation
Expert
evaluation
Sectoral
working group
within 21 days
Within 6 days
Application data
requirement
Stakeholder forum
special meeting
Approval letter
Proposal does not
meet criteria

128
however, seem to make no progress probably due to the transfer of ownership of the projects.
For Darajat-III geothermal project, the Project Design Document (PDD) prepared by Amoseas had been reviewed by the UNFCC panel, but it was failed due to the poor expression and unfamiliarity with CDM documents related barriers and baseline settlement (July 2005; NM0055). However, Chevron-Texaco, the current owner of Darajat project, resubmitted the application. Darajat project have been registered to Executive Board in June 2006 as a first geothermal power project for CDM in Indonesia. PDD of Kamojang geothermal Projects, which is prepared by PT. PLN, have been evaluated by the Technical Committee of DNA CDM Indonesia now.
8.4 Effects of Environmental Improvement
It is hardly to grasp the effects of environmental improvement by this project quantitatively. That is to say, hydrogen sulfide, carbon dioxide, and heavy metal components, which have been discharged from fumaroles, pollute the air and water near site at present. It is sure that generation of such contaminants will be suppressed by using geothermal energy, but the quantitative evaluation method of suppress has not yet established.
The environmental improving effect of this project is the reduction of carbon dioxide emission from electricity generation using renewable geothermal energy comparing with others fossil firing power generation.
The emission reduction is estimated as potential of oil substitution effort of crude oil, based on the amount of total small scale geothermal power generation, which is substituted diesel power. CO2 Conversion Volume (emission factor) =
crude oil conversion of energy substitution (ktoe/y) ×42.62×20×0.99×44/12
Where, ① Energy substitution effect (crude oil conversion ktoe/y)
Heating value conversion of crude oil 10,000 kcal/kg Heating value conversion of electricity 2,646 kcal/kWh
② Conversion to unit of energy (heating unit: TJ) Conversion factor 42.62 TJ/kt
③ Conversion to base unit of carbon discharge Base unit factor of carbon discharge 20 tC/TJ
④ Correction of incomplete combustion portion Oxidation rate factor of carbon 0.99
⑤ Conversion to CO2

129
Molecular weight ratio 44/22
From above formula, CO2 conversion volume (emission factor) is calculated 0.819(t- CO2/MWh). The amount of the emission reductions of each field are presumed from the following formula by the annual power generation assuming the utilization rates of the geothermal plant to be 85%. Annual power generation (MWh/year) =
Development resource potential (MW) × 24(h/day) × 365 (day) × utilization rates (%) Annual emission reduction(kt-CO2/year) =
Emission factor (t-CO2/MWh) × annual power generation (MWh/year)
The effect of annual CO2 emission reduction of the 10MW geothermal power plant is 61 (kt- CO2/year). In case of the 35MW total small scale geothermal plant will be constructed, the effect of the emission reduction of 213.5 (kt-CO2/year) is expected.
If the value of CER is 10 (US$/t-CO2) under the emission factor 0.8(t-CO2/MWh), earning of 0.8(cent/kW) is obtained when the geothermal power generation is executed as CDM business in Indonesia (Fig.8-3). This is one of the incentives of the geothermal power development.
Fig. 8-3 CER’s Price
0.16 0.32
0.48 0.64
0.80 0.96
1.12 1.28
1.44 1.60
0.0
0.2
0.4
0.6
0.8
1.0
1.2
1.4
1.6
1.8
0 2 4 6 8 10 12 14 16 18 20 22
CER
's U
nit P
rice
(cen
t/kW
h)(E
mis
sion
Fac
tor 0
.8t-C
O2/
kWh)
CER's Unit Price (US$/t-CO2)

130
8.5 Small scale geothermal power development as Small Scale CDM
8.5.1 Indicative simplified baseline and monitoring methodologies for SSC project activity
The small scale geothermal power development activity of SSC is categorized Type-I. Type-I is Renewable energy project activities with a maximum output capacity equivalent to up to 15 MW (or an appropriate equivalent).
The small scale geothermal power plant of the project is connected to a grid so that the methodology will be applied for AMS I.D. AMS I.D is used for renewable electricity generation for a grid. Emission reduction factor of AMS I.D, which is different according to the installed capacity and utilization rates, for small scale geothermal power generation bigger than 200kW uses 0.8(t-CO2/MWh). In case of the 35MW total small scale geothermal plant will be constructed, the effect of the emission reduction of 208.5 (kt-CO2/year) is expected.
8.5.2 Additionality for SSC project activities
Project Participants shall provide an explanation to show that the project activity would not have occurred anyway due to at least one of the following barriers: Investment barrier, Technological barrier, Barrier due to prevailing practice or other barriers.
8.5.3 Emission from Source
Geothermal power generation produces low concentration of CO2 and CH4 in NCG (non-condensable gas) with the geothermal vapor. It is necessary to pay attention to the concentration of NCG. Because if the concentration of CO2 and CH4 higher, the GHG emission reduction effect become lower (possible to be zero!). Fig. 8-4 shows the relation between CO2 concentration in steam and CO2 emission. This figure is drawn under the condition of steam-electricity conversion 7 tone/MWh and emission factor of diesel power is imposed on the figure. When the concentration of CO2 goes up to 10wt%, the amount of emission reduction goes down to zero. The average CO2 concentration at the existing geothermal power plant shows around 1wt%, thus the emission reduction effect is expected sufficiently. The concentration of CH4 should be checked because of which concentration is smaller than 1/100, but the GHG effect is 21 times of CO2.

131
Fig. 8-4 CO2 Emission by Steam Production
8.6 CDM project in a ODA project
Immediate cooperation of CDM and ODA granting is prohibited by regulations, but in case of the CDM project selected as ODA project, which ODA granting has negotiated with developing country, in results is excluded. (wind power project in Egypt is approved by EB on June 22nd, 2007 that is supporting by JBIC)
0
0.1
0.2
0.3
0.4
0.5
0.6
0.7
0.8
0.9
1
0.0% 2.0% 4.0% 6.0% 8.0% 10.0% 12.0%
CO
2Em
issio
n by
Ste
am P
rodu
ctio
n (t-
CO
2/MW
h)
CO2 Concentration in Steam (wt%)
Small Scale GeothermalP/P Emission Factor 0.8

インドネシア東部地熱発電計画予備調査
和 文 要 約


要約-6
地熱資源量(出力)評価:調査井の試験結果を精密地表調査結果とともに地熱概念モデ
ルに反映させる。この概念モデルを数値モデル化し、地熱貯留層数値シュミレーション
等による地熱資源量評価を行い、 適開発出力を明らかにする。この調査結果に基づき、
資源開発計画を必要があれば修正し、発電所建設計画を策定する。また、発電所の概念
設計を行い、送電計画を作成する。
以上の地熱資源調査・開発について、PLN 等のインドネシア国側の能力を考慮すれば、
坑井掘削を含めた地熱資源開発は地熱開発特有の技術と経験が必要なことから、豊富な
経験・能力を有する地熱開発コンサルタントを雇用して事業を推進する必要がある。
地熱発電所建設:各地熱地域の地熱資源調査と坑井掘削後に合計 35MW の小規模発電
設備を建設する。発電設備は本プロジェクトの早期完成を考慮し、各地域の発電所建設
をまとめて、単一コントラクターによる設計・資機材供給・据付・試運転調整渡し(一
括フルターンキー方式)とすることが望ましい。なお、送変電設備には発電所主変圧器
の高圧側端子から構内開閉所までの送電線、構内開閉所の遮断器、断路器、母線、CT、
VT、避雷器、支持鉄構、碍子、保護継電器盤、その他付属設備、附帯土木建築工事等一
式を含むものとする。
発電所建設については、PLN は充分な経験をもつが、従来より実施しているようにコ
ンサルタントの技術的助勢を受け実施されるものと思われる。
CDM 化
地熱発電によるディーゼル発電代替事業は CDM プロジェクトとして 適である。温室
効果ガス削減効果は 200kW 以上のディーゼル発電代替の場合、0.8(t-CO2/MWh)とされて
いる。貯留層数値シミュレーションで開発出力を算出し発電設備概念設計結果を参照す
れば、温室効果ガス削減量は推定でき、CDM プロジェクトの登録手続きを始めることが
可能である。
事業実施者としての PLN
PLN は以下の背景・経緯から本プロジェクトの実施主体となりうると考えられる。
東部地域を含む島嶼地域の電力供給は PLN が実施している。PLN には安定した電力供
給の責任があることから、本地熱発電プロジェクトを東部インドネシアの電力供給の効
率化と分散化を促進させる再生可能エネルギー開発事業と位置づけ、現在、東部地域の
幾つかの地熱地域での地熱開発の可能性を自ら調査している。
PLN は、地熱資源開発においては充分な知見を有し、発電・送配電では安定運転・安
定供給の充分な経験をもつ多くの技術者を有している。また、地熱資源開発についても、
専門的知識をもつ技術者を人数的には多くはないが有している。PLN は経験や能力を有
する専門家を本地熱開発プロジェクトに充てることが可能である。
PLN は内外のコンサルタント及び資源調査会社を使った地熱発電開発の経験を有し、
専門機関の能力を適切に用い地熱発電開発を推進していくことが可能と判断される。
実施スケジュールと事業コスト
プロジェクト実施スケジュールでは、円借款締結から(現在計画されている 7 箇所の
発電所のうちの) 後の地熱発電設備の運転開始まで、81 ヶ月を要すると想定している。
この場合、プロジェクトが 2008 年 11 月に開始されれば、2015 年の 7 月に完了すること

要約-7
になる。
プロジェクトコストは 161 百万米ドル程度と推定される(インドネシア国側が坑井の
仕様の変更等を希望した場合、190 百万ドルを超えることもあり得る)。PLN はプロジェ
クト実施に必要な資金調達を行う必要があり、円借款による支援を強く期待している。
6.経済性評価
本プロジェクトの経済的実行可能性を経済的内部収益率法によって検証した。検証で
は、本プロジェクトと同等の便益(売電)を提供する代替プロジェクトを選定し、本プ
ロジェクトの耐用年数間のプロジェクトと代替電源との経費を現在価値にて比較し、等
価割引率を求めた。求めた EIRR をハードルレートと比較し、本プロジェクトの経済性を
評価した。代替電源としてディーゼル発電所を選定した。この結果、本プロジェクトの
代替電源に対する EIRR は 39.5%と算出され、ハードルレート 12%より十分に大きく、本
プロジェクトは経済的に見ても代替電源に充分に対抗できると判断された。
また、燃料費としてそれぞれ年平均で約 45.23 百万 US$相当、プロジェクト期間では
約 1,356.81 百万 US$相当を節約できるものと計算された。削減された国内消費の燃料は
貴重な外貨獲得のために活用できると考えることも可能である。また、地熱エネルギー
は CO2 をほとんど排出しない再生可能エネルギーであることから、地球環境保全面から
も本プロジェクトは貢献すると考えられ、国策としても十分にフィージブルであると考
えられる。
このプロジェクトの経費(投資額と運転経費)と蒸気及び電力の販売による収益が同
等となる内部収益率を求め、プロジェクトの機会費用と比較して財務性を評価した。そ
の結果、FIRR は 11.95%となり、WACC2.35%よりも十分に大きい値となった。現時点での
評価ではあるが、本プロジェクトは財務的にもフィージブルであると言える。
政府機関の実施プロジェクトとして適当とされている財務的内部収益率 12%を目標
にした場合、この地熱発電事業による電気料金は 14 cents/kWh 程度としなければならな
い。民間企業の場合は、既に政府が公認しているように財務的内部収益率の目標値を
16%とすれば、買取電気料金を 14 cents/kWh 程度とすることはできず、さらに高額にし
なければ、この収益率は得られない。政府(あるいは PLN)が一貫開発(下流開発であ
る発電所建設及び上流開発である蒸気(資源)開発の両方)を実施した場合、電力補助金
の削減効果は 大となる。もし、本プロジェクト民間企業が一貫開発した場合は、財務
的内部収益率が 16%あったとしても、キャッシュフローをみると運転操業資金として 50
百米ドル以上の借入をしなければ、事業は維持できない。この運転資金調達は民間事業
者にとって重い負担になると考えられる。
このように、プロジェクトの経済評価からも、民間事業者による東部の島々の地熱開
発は困難であり、ODA による支援が得られる政府機関がプロジェクトを実施するのが
も適切であると判断される。
7.CDM プロジェクトの可能性
地熱発電は一般の他の電源に比べてライフサイクルにおける CO2 排出量が少ないとい
われている。また、地熱発電所は稼働率が高く、他の再生可能エネルギーより大きな電
力を発生する。したがって、大きな CO2削減効果が期待できるため、CDM プロジェクトと
して魅力的である。

要約-8
小規模地熱発電は小規模 CDM においてタイプ I に分類される。タイプ I は再生可能エ
ネルギープロジェクトで 大出力(プラントの設備容量)が 15MW 以下のものとされて
いる。電力系統に接続された小規模地熱発電プロジェクトでは、方法論として AMS I.D
が適用可能である。AMS I.D において、設備容量、稼働率によって異なるが、200KW 以上
の小規模地熱発電では排出係数は 0.8(t-CO2/MWh)と定められている。したがって、合計
35MW の小規模地熱発電プロジェクトの場合、削減効果として 208.5 (kt-CO2/year)が期
待される。
8. 東部地域小規模地熱開発プロジェクト準備
インドネシア政府及び関係機関の意向として、東部地域のディーゼル発電代替のパイ
ロット的小規模地熱発電開発事業を円借款の支援を受け実施することとなったが、予定
事業の開発規模が 35MW と比較的小さいため、本プロジェクト内で将来の地熱発電開発拡
大の見通しを立てることも、同国政府は希望していることから、次の条件を満たすプロ
ジェクトを実施する必要がある。
V 本事業で発電所建設を行う可能性のある有望地域での地熱資源精密調査(構造及
び資源量評価)
V 本事業で発電所建設を行う可能性のある有望地域での調査井掘削とその後の噴気
成功井の生産井への転用、還元井掘削
V 本事業で発電所建設を行う有望地域での発電事業計画の策定
V 約 7 地域のそれぞれ約5MW の小規模地熱発電所建設の実現
V 東部地域の 37 地域の地熱資源評価及び将来の地熱発電開発計画策定
既存のデータ・報告書からは、データ不足のため、約 7 地域の詳細な開発計画や 37
地域の地熱資源評価や開発計画を立案することは難しい。地熱発電事業における地熱資
源調査や開発には事前に把握することの難しい不確定な要素が含まれることから、凡そ
の開発計画でプロジェクトを開始し、その都度計画に修正を加えていくことで適正な事
業とする場合が多い。しかし、本地域の場合は、既存のデータに幾分かの追加情報やデ
ータを加えれば、より精度の高い計画の立案が可能であることから、詳細な事業内容や
工程の立案、事業の効果等を明らかにするために、事前の準備を調査することが望まし
い。
この事前に実施すべき調査では、既設発電所の設置地点、送配電線、電力消費量を調
査し、さらには地熱資源の特性や開発可能量(初期地表調査と地熱資源量評価)を把握
し、ディーゼル代替事業に適切な地熱地域を選定する。データ及び解析結果を用い、選
定された地域の資源開発・発電所開発計画を策定する。このうち有望度の高い、あるい
は開発緊急度の高い約 14 地域を選定し、一部の地域で既に実施されている地熱資源評価
や開発計画を組み入れ本事業の計画を作成する。この調査により地熱資源調査や開発時
のリスクを大幅に軽減でき、適切な開発計画を作成することが可能となる。
本準備調査には、今回のプロジェクトでの地熱発電所建設予定地域以外の地熱地域も
含まれていること、さらにプロジェクト開始以前に本調査を行うことにより、適正な計
画が立案されることが望ましいことから、可能であれば、SAPPROF を適用し、事前に調
査及び計画立案ができることが望ましい。